Does Crowdsourced Research Discipline Sell-Side Analysts? Russell Jame, Stanimir Markov, and Michael Wolfe * January, 2017 Abstract We examine whether increased competition stemming from technological innovation disciplines sell-side analysts. We document a decline in short-term forecast bias for firms added to Estimize, an open platform that crowdsources short-term earnings forecasts, relative to matched control firms; this decline is greater when (1) existing sell-side competition is smaller, (2) earnings uncertainty is higher, and (3) Estimize coverage is less biased and more accurate. We also document an increase in short-term forecast accuracy and representativeness. Finally, we find no change in bias for longer-horizon forecasts or recommendations, suggesting competition from Estimize rather than broad economic forces drives our results. * Jame is from the Gatton College of Business and Economics, University of Kentucky, [email protected]. Markov is from the Cox School of Business, Southern Methodist University, [email protected]. Wolfe is from the Pamplin College of Business, Virginia Tech, [email protected]. We thank seminar participants at the University of Kentucky and West Virginia for helpful comments, and Leigh Drogen for providing the data and answering our questions.
Transcript
Does Crowdsourced Research Discipline Sell-Side Analysts?
Russell Jame, Stanimir Markov, and Michael Wolfe*
January, 2017
Abstract
We examine whether increased competition stemming from technological innovation disciplines sell-side analysts. We document a decline in short-term forecast bias for firms added to Estimize, an open platform that crowdsources short-term earnings forecasts, relative to matched control firms; this decline is greater when (1) existing sell-side competition is smaller, (2) earnings uncertainty is higher, and (3) Estimize coverage is less biased and more accurate. We also document an increase in short-term forecast accuracy and representativeness. Finally, we find no change in bias for longer-horizon forecasts or recommendations, suggesting competition from Estimize rather than broad economic forces drives our results.
* Jame is from the Gatton College of Business and Economics, University of Kentucky, [email protected]. Markov is from the Cox School of Business, Southern Methodist University, [email protected]. Wolfe is from the Pamplin College of Business, Virginia Tech, [email protected]. We thank seminar participants at the University of Kentucky and West Virginia for helpful comments, and Leigh Drogen for providing the data and answering our questions.
4 Other studies that explore the impact of crowdsourced research on market prices include Crawford et al. (2014), Bliss et al. (2016), and Da and Huang (2016).
7
banking deals (e.g., Lin and McNichols, 1998; Michaely and Womack, 1999), and facilitate access
to firm management (e.g., Francis and Philbrick, 1993; Das, Levine, and Sivaramakrishnan 1998).
At the same time, there is evidence that analysts issue pessimistic short-term earnings forecasts,
and that this pessimism is explained by analysts’ desire to make earnings targets more achievable
and, thus, curry favor with firm management (e.g., Matsumoto, 2002; Richardson et al., 2004).5
Finally, analysts who issue biased research are rewarded with greater access to management’s
private information and better career prospects (e.g., Hong and Kubik, 2003; Ke and Yu, 2006).
Analysts’ conflicts of interest are moderated by several forces, including regulation,
reputational concerns, and competition. Barber et al. (2006) and Kadan et al. (2009) show that
recent reforms aimed at limiting the relationship between research and investment banking
departments (e.g., NASD Rule 2711, NYSE Rule 472, and the Global Settlement) have reduced
analysts’ propensity to issue biased research. Fang and Yasuda (2009) show that analysts rated
“All-Stars” are less likely to issue biased research when conflicts of interest are more severe, and
Ljundqvist et al., (2007) find that analyst bias is weaker for stocks heavily owned by institutional
investors. These findings suggest that reputational concerns, such as the desire to maintain prestige
and credibility with institutional clients, can mitigate conflicts of interest.
Competition can reduce analyst bias through at least two channels. First, greater
competition can increase the diversity of incentives among suppliers, making it more likely that at
least one analyst will be incentivized to remain independent and provide an unbiased forecast (e.g.,
Gentzkow and Shapiro, 2008). Consistent with this view, Hong and Kacperczyk (2010) find that
when competition is reduced due to broker mergers, longer-term earnings forecasts become more
5 Graham et al. (2005) provides anecdotal evidence on the importance managers place on meeting or beating quarterly earnings while Kasznik and McNichols (2002) and Bartov et al. (2002) find that the capital market provides a valuation premium to firms whose earnings meet or beat analysts’ estimates.
8
optimistic. Second, competition can impact analysts’ reputational concerns by increasing the
likelihood that their bias will be exposed to the market. For example, a forecast from an analyst
who has stronger incentives to be unbiased can help discipline other analysts by serving as a
benchmark and helping investors unravel incentive-driven biases. Consistent with this view, Gu
and Xue (2008) find that non-independent analysts who cover firms covered by independent
analysts issue more accurate, less biased, and more representative earnings forecasts than other
non-independent analysts. Similarly, the informativeness of ratings from S&P, an issuer-paid
credit rating agency, improves following the entry of Egan Jones, an investor-paid rating agency
(Xia, 2014).
In recent years, technological and institutional innovations have given rise to new forms of
competition for analysts. However, given their novelty and the sell-side’s long-term dominance in
providing investment research, it is unclear whether these new competitive forces can impact
analyst bias. In this study, we examine whether competition from Estimize, a provider of
crowdsourced earnings forecasts, has a disciplining effect on sell-side analysts.
2.2 Estimize
Estimize is an open platform which crowdsources earnings forecasts from a diverse set of
contributors. Since its launch in 2011, Estimize has attracted forecasts from over 11,000
contributors and currently provides coverage for over 1,500 firms each quarter. Estimize forecasts
tend to be short-term focused; 96% of all estimates are forecasts of current quarter (i.e., one-quarter
ahead) earnings. Contributors to the platform include buy-side and sell-side analysts, portfolio
managers, retail investors, corporate finance professionals, industry experts, and students.
Estimize forecasts are available on Bloomberg and several other financial research platforms and
are regularly referenced in prominent financial media sources including Forbes, Barron’s, The
9
Wall Street Journal, Investors’ Business Daily, and Business Week. Estimize is often featured on
CNBC and has signed a data-sharing agreement which allows its estimates to be presented across
all CNBC platforms.
Estimize was founded by Leigh Drogen, a former hedge fund analyst, with the objective of
“disrupting the whole sell-side analyst regime”.6 Drogen’s view is that crowdsourcing estimates
from a diverse community should lead to a superior consensus for two reasons. First, by capturing
the collective wisdom of a large and diverse group, the consensus can convey new information to
the market. Second, by encouraging participation from individuals with varied backgrounds,
Estimize contributors are more likely to be free from many of the conflicts of interest that bias the
research of sell-side analysts.7 Jame et al. (2016) find evidence that is largely consistent with these
predictions. In particular, they document that quarterly forecasts provided by Estimize are
significantly less pessimistic than sell-side forecasts. They also find that Estimize forecasts are
more representative of the market’s expectation of earnings and incrementally useful in forecasting
earnings.
2.3 Hypothesis Development
Although Estimize forecasts are a relatively new phenomenon, there are reasons to believe
they may exert a disciplining effect on the sell-side. First, Estimize provides new information to
the market which increases its viability as a potential competitor to the sell-side. Second, Estimize
forecasts are substantially less biased than sell-side forecasts. An unbiased forecast from Estimize
provides a benchmark which helps investors unravel sell-side forecast bias. This process is likely
facilitated by the collocation of crowdsourced forecasts and sell-side forecasts on the Estimize
6 http://www.businessinsider.com/estimize-interview-leigh-drogan-2011-12 7 In particular, Drogen highlights his dissatisfaction with the sell-side’s “tendency to skew estimates in favor of higher earnings beat rates for the companies they cover,” https://www.estimize.com/beliefs
website and in the financial media (e.g., Bloomberg and CNBC). Thus, the presence of Estimize
could heighten analysts’ reputational concerns by making it more likely that their bias will be
revealed to the market.8
Accordingly, our primary hypothesis is that sell-side analysts’ tendency to issue pessimistic
one-quarter ahead earnings forecasts will decline for firms covered by Estimize. We also have
several auxiliary predictions. First, a reduction in pessimism should result in sell-side analysts’
one-quarter ahead forecasts becoming more accurate and more representative of the market
expectation. Second, we expect the disciplining effect of Estimize will be amplified when the
Estimize consensus is a more valuable information source (i.e., more accurate), and when it is
more likely to facilitate the de-biasing of sell-side forecasts (i.e., when the Estimize consensus is
less biased). Finally, because 96% of Estimize forecasts are for one-quarter ahead earnings, we do
not expect that other form of sell side bias, such as optimism in longer-term earnings forecasts and
stock recommendations, will be affected by the introduction of Estimize.
3. Data and Descriptive Statistics
3.1 Sample Selection and Summary Statistics
So that we can reliably measure the change in sell-side bias around the introduction of
Estimize in 2012, we require continuous sell-side coverage from 2009 to 2015, as reported by
IBES. We also require that firms have non-missing book value of equity and stock price above $5
in the year prior to the introduction of Estimize. Our final sample includes 1,842 firms.
8 According to Kunda’s (1990) theory of motivated reasoning, individuals motivated to arrive at a particular conclusion try to justify their conclusion to a dispassionate observer; and they draw the desired conclusion only if they can muster up the evidence necessary to support it (pp. 482-482). In our setting, sell-side analysts are motivated to issue pessimistic, easy-to-beat forecasts; widely available, accurate, and substantially less biased, Estimize forecasts make justifying biased sell-side forecasts to investors more difficult.
11
We obtain Estimize forecasts of earnings announced from January 2012 through December
2015.9 For each forecast, the dataset contains the forecasted earnings per share, the date of the
forecast, the actual earnings per share, the date of the earnings announcement, a unique id for each
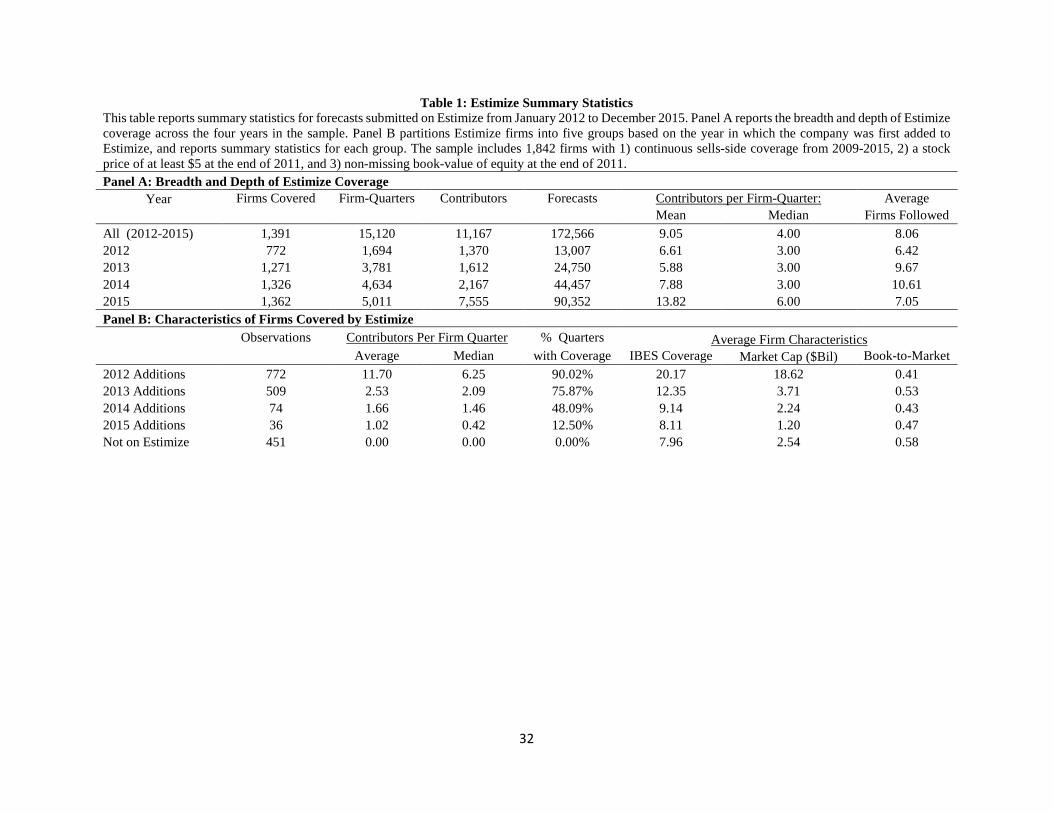
contributor, and the ticker symbol of the firm. Table 1 provides summary statistics regarding the
breadth and depth of Estimize coverage. Of the 1,842 firms in our sample, 1,391 firms have at
least one Estimize forecast during the sample period. Collectively, there are 172,566 forecasts
made by 11,167 unique contributors. The mean (median) Estimize firm is covered by 9.1 (4.0)
different contributors during a quarter. Estimize’s coverage and contributor base have significantly
grown over time. For example, the number of firm-quarters with forecasts has increased from
1,694 in 2012 to 5,011 in 2015, while the number of contributors has increased from 1,370 to 7,555
over the same period.
Panel B of Table 1 examines the characteristics of firms partitioned based on when the firm
is first added to Estimize.10 We observe that firms added in 2012 are larger, have greater sell-side
coverage, and are more growth oriented (i.e., lower book-to-market ratios) than firms added in
subsequent years. These firms also attract greater Estimize coverage: 11.7 contributors per quarter
compared to less than 2.5 contributors for later Estimize additions.
3.2 The Properties of Estimize and IBES Quarterly Forecasts
In this section we compare the properties of Estimize and IBES quarterly earnings
forecasts. We limit the sample to 772 firms added to Estimize in 2012 (see Panel B of Table 1)
and we report forecast properties over the 2013-2015 sample period.11 We consider only forecasts
9 Other studies that examine Estimize forecasts include Jame et al. (2016), Bliss et al. (2016), Da and Huang (2016), and Ertan et al. (2016). 10 A firm is “added to Estimize” when it receives its first Estimize forecast. 11 The sample selection foreshadows subsequent analyses in which we define firms added to Estimize in 2012 as “treated firms” and define the 2013-2015 sample as the “post-event window”.
12
issued within 120 days of the earnings announcement date, i.e., one-quarter ahead forecasts, which
account for approximately 96% of all forecasts, and we exclude Estimize forecasts flagged as
unreliable (roughly 1% of the sample). The resulting sample includes 8,265 firm-quarters with at
least one Estimize and one IBES forecast.
For each firm-quarter, we compute five forecast characteristics: Forecasters per Stock,
Forecasters per Stock is defined as the number of unique contributors or analysts issuing a forecast,
and Forecast Age is defined as the number of calendar days between the forecast issue date and
the earnings announcement date.
Our primary measure of forecast bias for firm j in quarter t is:
j,t j,tj,t
j,t-1
Actual ConsensusBias / Prc = * 100
Price−
(1)
where Actual is reported earnings, Consensus is the mean Estimize (or IBES) forecast, and Price
is closing price at the end of the prior year. In computing Consensus, we use only the most recent
forecast by a contributor or an analyst. We winsorize Bias/Prc at 2.5% and 97.5%. As a robustness
check, we consider two alternative measures of bias: Bias/AbsConsensus, which uses the absolute
value of Consensus as an alternative scaling factor, and MBE, a Meet-or-Beat Earnings indicator
equal to 1 if Actual is greater than or equal to Consensus, and 0 otherwise. AbsFE, a measure of
forecast accuracy, is defined as the absolute value of Bias/Prc.
Our measure of the degree to which the consensus forecast is representative of the market
expectation (Representativeness) relies on the intuition that a superior measure of the market
expectation exhibits a stronger association with returns at the time of the earnings announcement:
that is, a higher Earnings Response Coefficient (ERC) (Brown, Hagerman, Griffin, and Zmijewski,
13
1987). For each firm with at least six quarters of Estimize forecasts, we estimate the time-series
regression
( ) ,j,t jt tCAR = α+ β UE +ε (2)
where CAR is the cumulative market-adjusted return in the three trading days around the earnings
announcement date and UE is unexpected earnings (i.e., actual earnings less forecasted earnings),
scaled by price. The slope coefficient, β, is the ERC, and our measure of representativeness. We
standardize UE to have mean 0 and variance 1 for each firm; thus β reflects the abnormal return
associated with a one-standard deviation change in unexpected earnings. We winsorize β at the
1stand 99th percentile.
Table 2 reports the results. On average, a stock is covered by 12.6 Estimize contributors
and 14.8 IBES analysts12; and Estimize (IBES) forecasts are issued 9.7 days (63.8 days) prior to
earnings announcements. Estimize forecasts have similar accuracy (absolute forecast errors of
17.2% versus 15.9%) and representativeness (ERCs of 4.7% versus 5.4%), but much lower bias:
For instance, the average Bias/Prc for Estimize forecasts is 0.26% compared to 5.81% for IBES
forecasts, and Estimize forecasts are more pessimistic than IBES forecasts in only 19.18% of all
firm-quarters. The results using Bias/Consensus or MBE yield similar conclusions. The dramatic
difference in bias, however measured, is consistent with sell-side analysts having greater
incentives to issue pessimistic forecasts that managers can easily beat (Richardson, Teoh, and
Wysocki, 2004).
4. Empirical Design
12 We note that the number of Estimize contributors is slightly larger than the Table 1 estimate of 11.7 because Table 2 reports the average conditional on there being at least one Estimize contributor. In contrast, the number of sell-side analysts reported in Table 2 is smaller than Table 1, because in Table 2 we exclude forecasts issued more than 120 days prior to the earnings announcement.
14
Our central prediction is that Estimize forecasts, which are easily accessible, reasonably
accurate, and substantially less biased, can exert a disciplining effect on sell-side analysts’
tendency to issue pessimistic forecasts of quarterly earnings. To test this prediction, we follow a
standard difference-in-difference approach, which compares changes in bias for treatment and
control firms around an event window.
We define treated firms as firms that are first added to Estimize in 2012. Firms added in
2012 experience significantly greater activity on the Estimize platform than firms added in later
years (see Table 1). To the extent that greater Estimize activity places more pressure on sell-side
analysts, this subgroup presents a more powerful setting for documenting the disciplining effect of
Estimize. Candidate control firms consist of firms that have not been added to Estimize as of 2015.
We define the pre-event period as the three years prior to the introduction of Estimize (2009
to 2011) and the post-event period as the three years after Estimize (2013 to 2015).13 We favor a
long post-event window because it may take time for an upstart to prove its viability and begin to
influence incumbents, and to reduce the error with which bias is measured; but in robustness tests
we also analyze changes in bias at an annual frequency.
The exclusion restriction is that the change in bias of the treatment firms relative to control
firms around the introduction of Estimize is not due to factors other than the introduction of
Estimize. A natural concern is that treated firms have different characteristics from control firms,
and that these differences influence the time-series behavior of Bias/Prc, biasing our difference-
in-difference estimate. To minimize this potential bias, we match each treated firm to a control
firm using either portfolio matching or propensity score matching.
13 Estimize was founded in 2011. 2011 earnings forecasts are not included in our dataset, but a review of historical earnings forecasts on Estimize.com indicates that earnings forecasts prior to 2012 are extremely sparse.
15
Our portfolio approach matches along three characteristics: size, book-to-market, and pre-
event period Bias/Prc. Specifically, we require that candidate control firms be in the same size
quintile and book-to-market quintile, based on breakpoints estimated at the end of 2011, and then
select the candidate control firm that has the smallest difference in pre-event period Bias/Prc
(averaged across all 12 quarters in the pre-event window).14 We match along size and book-to-
market because 1) treated firms and controls firms tend to differ significantly along both
dimensions (see Table 1) and 2) the magnitude of short-term pessimism tends to vary with both
characteristics (see, e.g., Richardson, Teoh, and Wysocki, 2004); we match on pre-event bias to
control for mean reversion.15
We obtain propensity scores from a logistic regression where the dependent variable is a
dummy variable equal to one for treated firms and zero for control firms, and the independent
variables include four firm characteristics: Log (Size), Book-to-Market, Log (Turnover), and Log
(Coverage), and two forecast characteristics: Bias/Prc and AbsFE. We measure firm
characteristics at the end of 2011 and forecast characteristics as quarterly averages over the period
2009-2011. For each treated firm, we select the control firm with the closest propensity score (i.e.,
nearest neighbor matching).16
5. Main Results
5.1 Changes in Bias – Baseline Results
14 More generally, we match on the outcome variable of interest. For example, when examining AbsFE or Representativeness we match on their pre-event values. 15We match on only three characteristics because the pool of candidate control firms for some characteristics is quite limited. The propensity score matching approach allows us to match on more characteristics and test for the validity of the common support assumption. 16 We find that the likelihood of being included in the treated sample increases with Size, Turnover, Coverage, and Bias/Prc, and decreases with Book-to-Market, and AbsFE.
16
Panel A of Table 3 reports the results from our tests of changes in Bias/Prc for treated firms
and for portfolio-matched control firms after the introduction of Estimize. In the case of treated
firms, the average Bias/Prc is 13.81% in the pre-event period and 5.08% in the post-event period.
The difference of 8.73 percentage points (or 63%) is statistically significant based on standard
errors double clustered by firm and quarter. In contrast, the portfolio-matched control firms
experience a statistically insignificant 0.17 percentage point increase in Bias/Prc around the event.
The difference-in-difference of -8.89 percentage points is not only statistically significant but also
economically large. Specifically, the cross-sectional standard deviation of Bias/Prc for treated
firms is 25.03%; thus, the decline of 8.89 percentage points corresponds to roughly 35% of a one-
standard deviation change in Bias/Prc. For reference, Hong and Kacperzyk (2010) document that
the change in long-term bias associated with losing one analyst due to a broker merger is roughly
5% of a one-standard deviation change in long-term bias.17
To control for additional firm characteristics that influence bias, we purge Bias/Prc from
the effects of Log (Size), Book-to-Market, Log (Coverage), Log (Turnover), Log (Volatility),
Returns, Forecast Age, Guidance, and industry and time factors by estimating the panel regression:
,jt j t j tBIAS / Prc = α+ + IND +QTR +εjβX (3)
where X is the vector of firm characteristics, IND is a vector of 12 Fama and French (1997)
industry dummies, and QTR is a vector of 24 quarter dummies. Panel B of Table 3 reports the
results when the regression residual, Abnormal Bias/Prc, is the outcome variable. We find that
treated firms experience a statistically significant decline in Abnormal Bias/Prc of 3.08 percentage
17 In particular, Table 5 of Hong and Kacperzyk (2010) reports a mean difference-in-difference in bias ranging from 0.11 to 0.16 percentage points, while their Table 1 reports a cross-sectional standard deviation of 3.10%.
17
points, control firms experience a significant increase of 6.31 percentage points, and the
difference-in-difference of -9.39 percentage points is highly significant.
5.2 Changes in Bias – Alternative Specifications
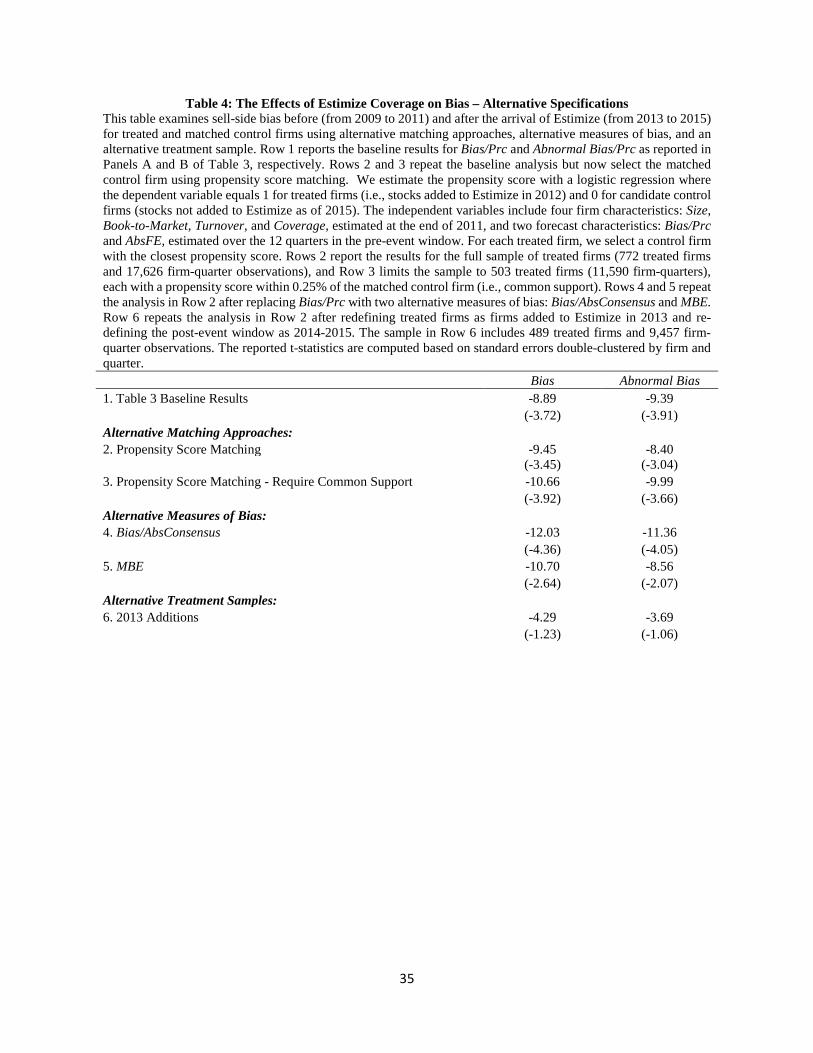
In Table 4, we examine whether our results are sensitive to how we select control firms,
measure sell-side bias, and define treatment firms. For reference, the first row reports the
difference-in-difference estimates from Table 3.
First we replace the portfolio-matched control firms with propensity-score matched control
firms. Reported in Row 2, the difference-in-difference estimates of the change in Bias/Prc and
Abnormal Bias/Prc are -9.45% and -8.40%; these estimates are remarkably close to the baseline
findings of -8.89% and -9.39%, respectively. To ensure that our results are not driven by poor
matching (violations of the common support assumption), in Row 3 we limit the sample of treated
firms to those with a propensity score within 0.25% of the propensity score of the matched control
firm. Despite a sample attrition of 169 firms, we still document comparable difference-in-
difference estimates of -10.66% and -9.99%.
We conduct the same analysis after replacing Bias/Prc with our two alternative measures
of bias: Bias/AbsConsensus and MBE. The results, reported in Rows 4 and 5, respectively, are very
similar to our baseline estimates.
Finally, we define treated firms as firms added to Estimize in 2013.18 Reported in Row 6,
the difference-in-difference estimates of Bias/Prc and Abnormal Bias/Prc are -4.29% and -3.69%;
these estimates are the lowest in Table 4 and statistically insignificant. We attribute the weaker
18 We measure pre-event bias over the period 2009-2011 and post-event bias over 2014 and 2015.
18
results to Estimize coverage: on average, firms added to Estimize in 2013 are covered by only 2.53
contributors, whereas firms added in 2012 are covered by 11.7 contributors (see Table 1).
5.3 Changes in Bias – Non-Parametric Tests
The results so far speak to an average decline in sell-side forecast bias following the
creation of Estimize. In this section, we assess the pervasiveness of this effect by examining the
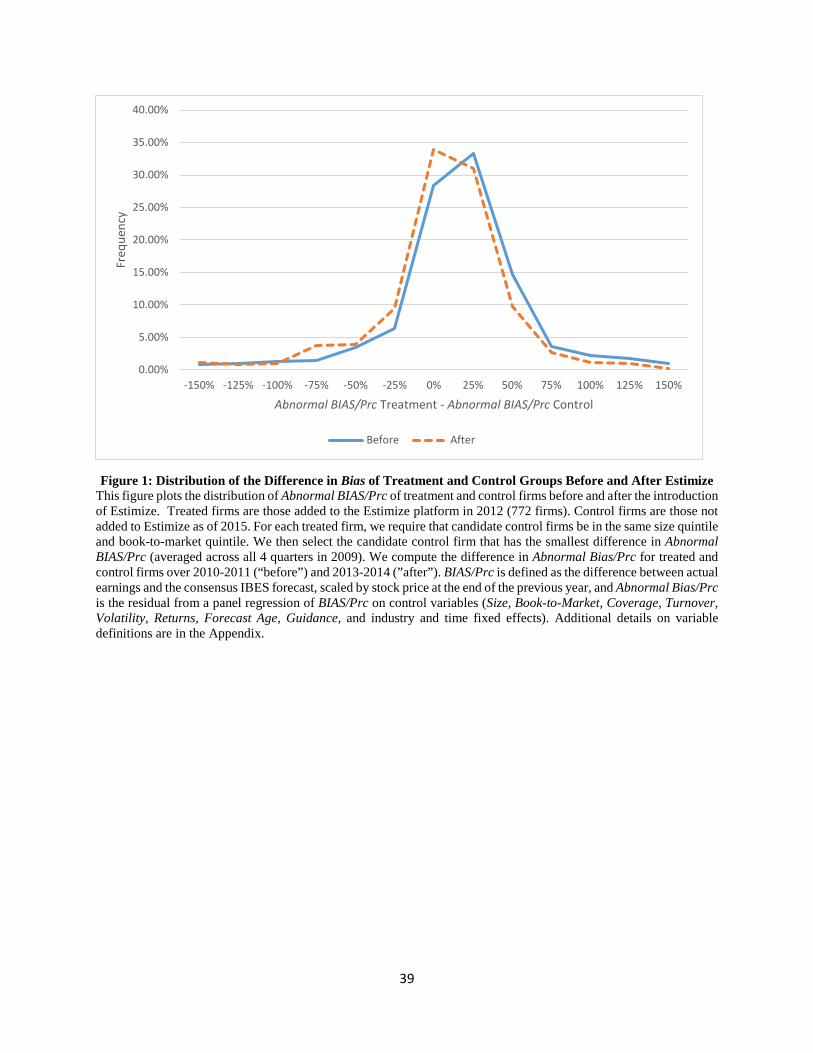
entire distribution of forecast bias in the pre-event and post-event periods. Specifically, we plot
the difference between the quarterly average Abnormal Bias/Prc of a treated firm and that of its
match in 2010-2011 and in 2013-2014, with control firms matched on size, book-to-market, and
Abnormal Bias/Prc estimated over the four quarters in 2009.19
Figure 1 plots the distributions. We observe a significant leftward shift in the entire
distribution of forecast pessimism in the post-event window.20 For example, the median value falls
by 7.4 percentage points and the 25th (75th) percentile falls by 11.6 (4.1) percentage points.
Similarly, the percentage of forecasts where the difference in Abnormal Bias/Prc is greater than
zero (i.e., when forecasts are more pessimistic for treated firms relative to control firms) falls from
54% in the pre-event window to 36% in the post-event window. Collectively, the evidence
suggests that treated firms experience a pervasive and economically large reduction in bias.
5.4 Changes in Other Forecast Properties - Representativeness and Accuracy
Increased competition may also improve other properties of analysts’ forecasts. For
example, a new competitor, Estimize, may place pressure on sell-side analysts to gather and
19 Matching on Abnormal Bias/Prc in the pre-event period, 2009-2011, mechanically compresses the distribution of the difference between the Abnormal Bias/Prc of a treated firm and that of a control firm in the same period; in fact, with perfect matching, the aforementioned distribution collapses to one with mean and standard deviation of zero. To avoid this problem, we match in 2009 and define the pre-event period as 2010-2011; for symmetry, we also shorten the post-event period to 2013-2014. 20 A Kolmogorov-Smirnov tests is able to reject the hypothesis of equality of distributions at a 1% significance level.
19
incorporate more information in their earnings forecasts, resulting in a sell-side consensus that is
both more accurate and more representative of the market expectation. We explore this hypothesis
using Section 5.1’s approach, except that the outcome variable is now AbsFE or
Representativeness. We tabulate our results in Table 5, Panel A and Panel B, respectively.
We find that treated firms experience a statistically significant average reduction in AbsFE
of 11.89 percentage points, while control firms experience an insignificant decline of 4.78
percentage points. The difference-in-difference estimate of -7.10 percentage points is highly
significant. In untabulated analysis, we find similar results when we define the outcome variable
as Abnormal AbsFE or identify control firms using the propensity score-based matching method.21
Similarly, we find that Representativeness increases significantly for treated firms but not
for control firms. In particular, for treated firms, a one-standard deviation increase in unexpected
earnings is associated with a 2.75% three-day earnings announcement return in the pre-event
period and 4.78% in the post-event period; for control firms, the corresponding figures are 2.29%
and 2.12%. The difference-in-difference estimate of 2.21% is economically and statistically
significant.
6. Strengthening Causal Inference
In this section, we seek to increase confidence in the causal interpretation of our findings
by demonstrating that 1) the parallel trends assumption underlying the difference-in-difference
approach is valid, 2) the decline in pessimism varies as predicted by economic theory and intuition,
and 3) sell-side biases that should not be affected by the arrival of Estimize are indeed unaffected.
6.1 Time-Series Patterns in the Decline of Pessimism
21 We compute Abnormal AbsFE as the residual from equation 3 after replacing Bias/Prc with AbsFE.
20
The assumption of parallel trends asserts that the change in bias in the treatment and control
samples would have been the same had Estimize not been created in 2012. To investigate the
parallel trends assumption, we examine changes in bias of treatment and control firms during the
pre-event window. Demonstrating equality helps alleviate the concern that the documented
difference around the event reflects the continuation or the reversal of an earlier difference in
trends.
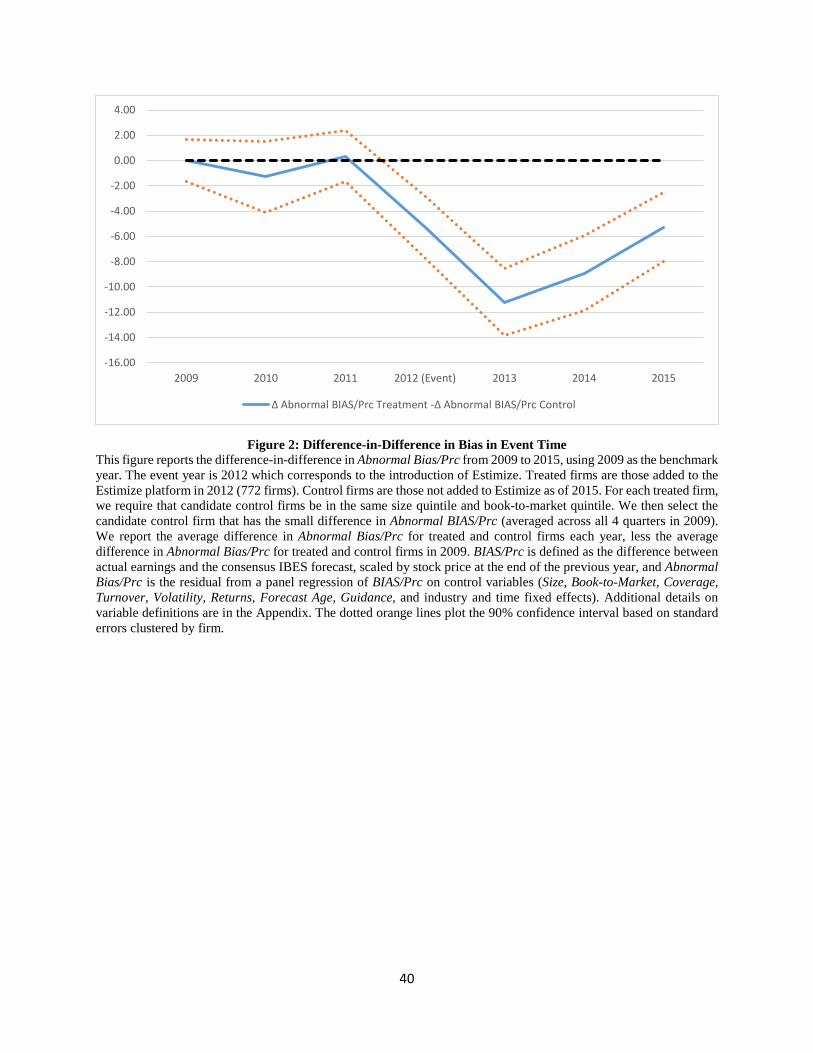
Figure 2 plots the difference-in-difference in Abnormal Bias/Prc over the period 2010-
2015, with 2009 as the baseline year.22 In 2010 and 2011, the change in bias in the treatment
sample is indistinguishable from that in the control sample: the difference-in-difference is less than
1.3 percentage points in absolute value and statistically insignificant. The statistically insignificant
difference-in-difference estimates in the pre-event period are consistent with the parallel trends
assumption and suggest that pre-trends are unlikely to explain our results. Turning to the post-
event window (i.e., 2013-2015), we find that the difference-in-difference estimates are
significantly negative in each year, with point estimates ranging from -5.3 to -11.2. The
consistently negative estimates in the post-event window suggest an immediate and permanent
decline in pessimism following the introduction of Estimize.
6.2 Cross-Sectional Patterns in the Decline of Pessimism
We next examine whether the decline in pessimism is stronger in circumstances where the
disciplining effects of Estimize are likely to be greater. First, we expect that the disciplining effect
of Estimize is greater when the level of existing sell-side competition is lower. Extending
Gentzkow and Shapiro’s (2008) argument to our setting, higher sell-side competition implies
greater diversity of incentives among analysts, which in turn implies a greater likelihood of
22 As in Section 5.3, for each treated firm we select a control firm matched on size, book-to-market, and Abnormal Bias/Prc estimated over the four quarters in 2009.
21
drawing an unbiased analyst/forecasts.23 One or several analysts issuing unbiased forecasts would
exert a disciplining effect on the rest, thus diminishing the value of Estimize as a disciplining
device. As in Hong and Kacperczyk (2010), our measure of competition is the number of analysts
covering a firm, calculated at the end of 2011.
Also, we suggest that the disciplining effect of Estimize is greater when earnings
uncertainty is higher. The reason is that high uncertainty makes it difficult for investors to unravel
sell-side bias on their own, increasing their demand for an external benchmark. We consider two
proxies for earnings uncertainty: analyst forecast dispersion (Baginski et al., 1993; Diether et al.,
2002; Clement et al., 2003) and market-to-book ratio (Pastor and Veronesi, 2003).
Finally, we conjecture that a less biased and more accurate Estimize consensus is more
effective as a disciplining device. Investors should more easily unravel sell-side pessimism when
they have access to a benchmark that is relatively less pessimistic and more accurate, which should
put greater pressure on sell-side analysts to reduce their bias. More broadly, we suggest that
Estimize is a greater threat to the sell-side and more likely to illicit a sell-side response when it is
perceived by investors as a valuable information source – accuracy and unbiasedness are
universally accepted determinants of information value. Estimize consensus bias (Estimize
Bias/Prc) and Estimize consensus accuracy (Estimize AbsFE) are measured as in Table 2.24
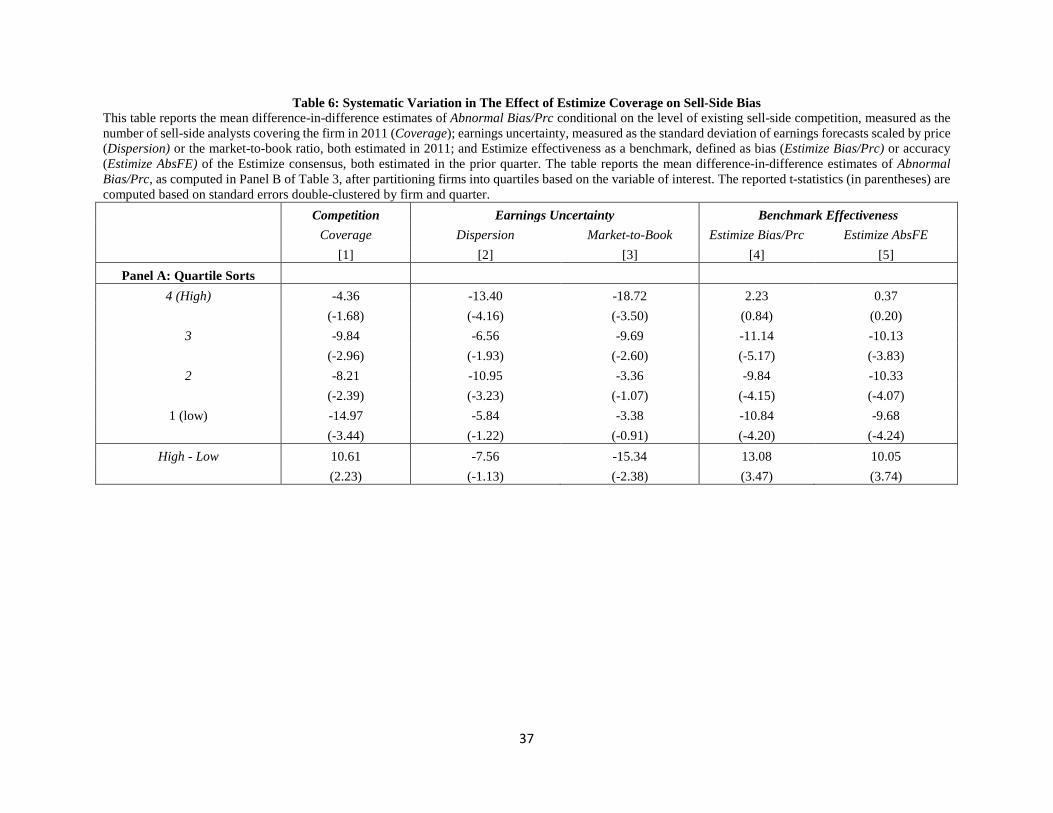
Table 6 sorts treated firms into quartiles based on each of the five variables and reports the
difference-in-difference estimate, computed as in Panel B of Table 3, for each quartile and the
High-Low quartile spread. The results are consistent with our predictions. In particular, when
23 Hong and Kacperczyk (2010) make the same argument in an analyst setting. 24 We drop post-event observations where the Estimize consensus includes less than three forecasts. The Estimize consensus is available on the Estimize platform next to the sell-side consensus and on external sites only if it includes three or more forecasts. While investors can calculate a consensus that comprises one or two individual Estimize forecasts, the location and limited availability of these forecasts hinder their usefulness as a disciplining device. Including these observations yields similar results for Estimize Bias/Prc but weaker results for Estimize AbsFE.
22
existing sell-side coverage is low (high), the difference-in-difference estimate is -14.97 (-4.36)
percentage points. In the top quartiles of forecast dispersion and market-to-book ratio, the
difference-in-difference estimates are -13.40 and -18.72 percentage points, respectively; the
corresponding figures for the bottom quartiles are -5.84 and -3.38 percentage points, neither
statistically different from zero. The spread in difference-in-difference estimates for the measures
of benchmark effectiveness are also consistent with our expectations. In particular, when the
Estimize consensus is most (least) biased, the difference-in-difference estimate is 2.23 (-10.84)
percentage points, and when the Estimize consensus is most (least) accurate, the difference-in-
difference estimate is -9.68 (0.37) percentage points. For all but one variable, sell-side forecast
dispersion, we reject the null hypothesis of equality of difference-in-difference estimates in the top
and bottom quartiles.25
In sum, we find that the decline in sell-side analysts’ pessimism is greater when existing
competition is lower, earnings uncertainty is greater, and Estimize is a more effective benchmark.
These findings raise the hurdle for alternative explanations. In particular, any alternative
explanation would have to explain not only why the decline in sell-side pessimism is coincident
with the arrival of Estimize and limited to stocks covered by Estimize, but also why it varies in
relation to sell-side competition, earnings uncertainty, and Estimize accuracy and unbiasedness.
6.3 The Impact of Estimize on Longer-Horizon Earnings Bias and Recommendation Bias
An alternative hypothesis is that reputational concerns or other broad forces mitigating
analyst conflicts of interest strengthen for stocks in the treatment sample but not in the control
sample. This hypothesis predicts a reduction in bias not only for short-term earnings forecasts, but
25 In a univariate regression setting, even forecast dispersion significantly explains the decline in sell-side bias; in a multiple regression setting, all five variables contribute to explaining the decline in sell-side bias. Results are untabulated for brevity.
23
also for longer-term earnings forecasts and investment recommendations. In contrast, if the
reduction in short-term pessimism is driven by competition from Estimize, we would not expect a
reduction in bias for longer-term forecasts (which account for less than 4% of all Estimize
forecasts) or stock recommendations (which are not available on the Estimize platform).
To preclude the alternative hypothesis, we first examine the effect of Estimize on the bias
of sell-side analysts’ forecasts of t-quarter ahead earnings, Biast/Prc, where t ranges from two to
five. In computing Bias2/Prc (Bias3/Prc), we require that the forecast period indicator, as reported
in IBES, is equal to ‘7’ (‘8’), and we limit the sample to forecasts issued 90-210 (180-300) days
prior to the earnings announcement.26 The selection of the matched control firm is similar to Table
3, except we now match on Biast/Prc rather than Bias/Prc.
Panels A through D of Table 7 report the results for Bias2/Prc, Bias3/Prc, Bias4/Prc, and
Bias5/Prc, respectively. Consistent with prior literature, we find that earnings forecasts are more
optimistic over longer horizons. For example, in the pre-event window, the average Bias2/Prc
(Bias5/Prc) is 0.95% (-19.40%). There is no evidence that treatment firms experience a reduction
in longer-horizon bias. In all four cases, the difference-in-difference estimate is statistically
insignificant. Furthermore, the sign is generally in the wrong direction (i.e. long-horizon optimism
becomes more severe) and the point estimates are economically small.27
We also examine whether Estimize reduces recommendation bias, measured as the average
recommendation level at the end of each quarter (Rec Level). In computing Rec Level, we convert
26 For reference, in computing Bias/Prc (or equivalently Bias1/Prc), we require the forecast period indicator to equal ‘6’ and limit the sample to forecasts issued 1-120 days prior to the earnings announcement. Thus, for each additional quarter we shift the beginning and ending dates by 90 days. 27 In comparing the economic magnitudes to Table 3, it is important to account for the fact that the standard deviation of Bias/Prc increases substantially with forecast horizon. For example, the cross-sectional standard deviation of Bias1/Prc (Bias5/Prc) is about 38% (110%). Thus, the main effects documented in Table 3 reflect roughly 35% of a one-standard deviation change, while the effects documented in Panel D reflect 4% of a one standard deviation change.
24
recommendations to a numeric value using the following five rankings: 1 for strong buy, 2 for buy,
3 for hold, 4 for sell/underperform, and 5 for strong sell. The results from Panel E of Table 7
indicate that Rec Level increases (i.e., recommendations become less optimistic) following the
introduction of Estimize for both treated and the matched control firms. The difference-in-
difference estimate is statistically significant, but the point estimate is in the wrong direction. In
particular, optimism among investment recommendations declines less for treated firms relative
to control firms. Further, in untabulated analysis, we find this specific conclusion is sensitive to
methodological choices. For example, using Abnormal Rec Level (i.e., the residual from equation
3 after replacing Bias/Prc with Rec Level) instead of Rec Level yields a difference-in-difference
estimate of 0.01 (t=0.36). Overall, there is very little evidence that Estimize constrains sell-side
analysts’ tendency to issue optimistic longer-horizon earnings forecasts or investment
recommendations. Thus, our findings suggest that direct competition from Estimize, rather than
more pervasive economic forces, reduces short-term sell-side bias.
7. Conclusion
The last two decades have witnessed a sharp decline in information and communication
costs and the creation of new sources of information; some of them directly competing with and
potentially disrupting traditional sources of investment research. We examine whether increased
competition stemming from recent technological and institutional innovations has a disciplining
effect on sell-side analysts. We focus on Estimize, an open platform that crowdsources short-term
quarterly earnings forecasts. Less pessimistic than sell-side forecasts but similarly accurate and
readily available, Estimize forecasts present a unique opportunity for addressing this question.
We find that sell-side analysts’ tendency to issue pessimistic short-term forecasts
significantly weakens for firms added to Estimize relative to a sample of matched control firms.
25
The decline in sell-side forecast pessimism is accompanied by an increase in forecast accuracy and
representativeness of the market expectation.
Several additional results point towards a causal relation between the arrival of a new
competitor, Estimize, and the decline in sell-side bias. In the time-series, we find no evidence of a
decline in pessimism in the three years prior to the creation of Estimize suggesting that pre-trends
are unlikely to explain our findings. In the cross-section, we find that the decline in sell-side
pessimism is larger when theory suggests a greater disciplining role for Estimize. In particular, the
decline in pessimism is greater when 1) existing competition is lower, 2) earnings uncertainty is
greater, and 3) Estimize is a more effective benchmark (i.e., more accurate and less biased).
Finally, placebo tests show that biases in longer-term earnings forecasts and investment
recommendations – unlikely to be affected by the arrival of a short-term forecast provider – remain
unchanged, indicating that broad economic forces are unlikely to be driving our results.
Our study has important policy implications. In particular, concerned with the adverse
consequences of biased sell-side research such as inefficient prices and wealth transfers from less
sophisticated to more sophisticated investors, in the last two decades regulators have
comprehensively reformed sell-side analyst activities and communications with investment
bankers and required extensive conflict of interest disclosures. These regulations have reduced
analyst bias but at the cost of lower analyst coverage and lower research informativeness (Kadan
et al., 2009). Our findings suggest that encouraging new forms of competition may be effective in
both reducing investor reliance on the sell-side and in constraining sell-side bias, without the
unintended adverse consequences of traditional regulatory approaches.
26
Appendix: Description of Variables
The variables discussed in this appendix are partitioned into two groups: forecast characteristics and firm characteristics.
A.1 Forecast Characteristics
• j,t j,tj,t
j,t-1
Actual ConsensusBias / Prc = * 100.
Price−
o Actual = reported earnings. o Consensus = the average forecasted earnings across all forecasters. We drop
forecasts issued more than 120 days prior to the earnings announcement and use the most recent forecast for each forecaster.
o Price – the stock price at the end of the prior year. o We winsorize Bias/Prc at 2.5% and 97.5%.
• Abnormal Bias/Prcj,t = The residual from a panel regression of Bias/Prc on the following
characteristics: Log(Size), Book-to-Market, Log(Coverage), Log(Turnover), Log(Volatility), Returns, Forecast Age, Guidance, and industry and quarter fixed effects.
o Forecast Age and Guidance are measured in period t, while all other characteristics are measured in period t-1.
• .j,t j,tj,t
j,t
Actual ConsensusBias / AbsConsensus =
Consensus−
o We winsorize |Consensus| at 0.02 and Bias/Consensus at 2.5% and 97.5%.
• MBE (Meet or Beat Earnings) = a dummy variable equal to one for firms who reported earnings greater than or equal to the consensus, and zero otherwise.
• AbsFE (Absolute Forecast Error) = the absolute value of Bias/Prc. • Representativeness (Earnings Response Coefficient - ERC) = the slope coefficient from
the following time-series regression: .j,t j,t tCAR = α+ βUE +ε o CAR = the cumulative market-adjusted return in the three trading days around the
earnings announcement date. o UE = unexpected earnings, defined as actual earnings less forecasted earnings,
scaled by price. We standardize Bias to have mean 0 and standard deviation 1, and
winsorize β at the 1st and 99th percentile. o We exclude firms with fewer than six quarters of Estimize forecasts.
• Forecast Age = the number of calendar days between the forecast issue date and the earnings announcement date. This measure is averaged across all forecasts in the consensus.
27
• Rec Level = the consensus recommendation level at the end of each quarter. Recommendations are converted to numeric values using the following scale: 1 for strong buy, 2 for buy, 3 for hold, 4 for sell/underperform, and 5 for strong sell.
• Estimize Bias/Prc = Bias/Prc computed using only forecasts provided by Estimize Contributors.
o This value is set to zero for all firm-quarters in the pre-event period and is set to missing for post-event quarters with fewer than 3 Estimize contributors.
o We winsorize Estimize Bias/Prc at 2.5% and 97.5%. • Estimize AbsFE = the absolute value of Estimize Bias/Prc.
o This value is set to zero for all firm-quarters in the pre-event period and is set to missing for post-event quarters with fewer than 3 Estimize contributors.
A.2 Firm Characteristics
• Size = market capitalization computed as share price times total shares outstanding as of the end of the year prior to the earnings announcement date.
• Coverage = the total number of sell-side analysts (in IBES) covering a firm in a year. • BM (Book-to-Market) = the book value of equity for the most recent fiscal year prior to
the earnings announcement year, scaled by market capitalization on December 31st of the same fiscal year.
• Turnover = average daily turnover defined as share volume scaled by shares outstanding in the calendar year prior to the earnings announcement date.
• Volatility = the standard deviation of daily returns over the calendar year prior to the earnings announcement date.
• Return = the average daily market-adjusted return over the calendar year prior to the earnings announcement date.
• Guidance = a dummy variable equal to one if the firm issues earnings guidance during the quarter.
• Dispersion = the standard deviation of earnings forecasts scaled by the stock price at the end of the previous year.
28
References:
Baginski, S., Conrad, E., and Hassell, J., 1993. The effects of management forecast precision on equity pricing and on the assessment of earnings uncertainty. The Accounting Review 68 (4), 913-927.
Barber, B. M., Lehavy, R., McNichols, M., and Trueman, B., 2006. Buys, holds, and sells: The distribution of investment banks’ stock ratings and the implications for the profitability of analysts’ recommendations. Journal of Accounting and Economics 41 (1), 87-117.
Bartov, E., Givoly, D., and Hayn, C., 2002. The rewards to meeting or beating earnings expectations. Journal of Accounting and Economics 33 (2), 173-204.
Becker, B., and Milbourn, T., 2011. How did increased competition affect credit ratings? Journal of Financial Economics 101 (3), 493-514.
Bliss, B. A., Kumar, A., and Nikolic, B., 2016. Geography, diversity, and accuracy of crowdsourced earnings forecasts. Working paper, University of San Diego.
Brown, L. D., Hagerman, R. L., Griffin, P. A., and Zmijewski, M. E., 1987. Security analyst superiority relative to univariate time-series models in forecasting quarterly earnings. Journal of Accounting and Economics 9 (1), 61-87.
Brown, L. D., and Rozeff, M. S., 1978. The superiority of analyst forecasts as measures of
expectations: Evidence from earnings. The Journal of Finance 33 (1), 1-16. Chen, H., De, P., Hu, Y. J., and Hwang, B. H., 2014. Wisdom of crowds: The value of stock
opinions transmitted through social media. Review of Financial Studies 27 (5), 1367-1403.
Clement, M., Frankel, R., and Miller, J., 2003. Confirming management earnings forecasts, earnings uncertainty, and stock returns. Journal of Accounting Research 41 (4), 653-679.
Cowen, A., Groysberg, B., and Healy, P., 2006. Which types of analyst firms are more optimistic? Journal of Accounting and Economics 41 (1), 119-146.
Crawford, S., Gray, W., Johnson, B., and Price, R. A., 2014. What motivates buy-side analysts to share recommendations online? Working paper, University of Houston.
Da, Z., and Huang, X., 2016. Harnessing the wisdom of crowds. Working paper, Michigan State University.
Das, S., Levine, C. B., and Sivaramakrishnan, K., 1998. Earnings predictability and bias in analysts' earnings forecasts. Accounting Review 73 (2), 277-294.
Dechow, P. M., and Sloan, R. G., 1997. Returns to contrarian investment strategies: Tests of naive expectations hypotheses. Journal of Financial Economics 43 (1), 3-27.
29
Diether, K., Malloy, C., and Scherbina, A., 2002, Differences of opinion and the cross-section of stock returns. Journal of Finance 57 (5), 2113-2141.
Doherty, N. A., Kartasheva, A. V., and Phillips, R. D., 2012. Information effect of entry into credit ratings market: The case of insurers' ratings. Journal of Financial Economics 106 (2), 308-330.
Egger, Brian D., 2014. Social Media Strategies for Investing: How Twitter and Crowdsourcing Tools Can Make You a Smarter Investor. F+ W Media, Inc.
Ertan, A., Karolyi, S. A., Kelly, P., and Stoumbos, R. C., 2016. Pre-earnings announcement over-extrapolation. Working paper, University of Notre Dame.
Fama, E. F., and French, K. R., 1997. Industry costs of equity. Journal of Financial Economics 43 (2), 153-193.
Fang, L., and Yasuda, A., 2009. The effectiveness of reputation as a disciplinary mechanism in sell-side research. Review of Financial Studies 22 (9), 3735-3777.
Francis, J., and Philbrick, D., 1993. Analysts' decisions as products of a multi-task environment. Journal of Accounting Research 31 (2), 216-230.
Gentzkow, M., Glaeser, E. L., and Goldin, C., 2006. The rise of the fourth estate. How newspapers became informative and why it mattered. In Corruption and Reform: Lessons from America's Economic History (pp. 187-230). University of Chicago Press.
Gentzkow, M., and Shapiro, J. M., 2008. Competition and truth in the market for news. The Journal of Economic Perspectives 22 (2), 133-154.
Graham, J. R., Harvey, C. R., and Rajgopal, S., 2005. The economic implications of corporate financial reporting. Journal of Accounting and Economics 40 (1), 3-73.
Gu, Z., and Xue, J., 2008. The superiority and disciplining role of independent analysts. Journal of Accounting and Economics 45 (2), 289-316.
Hong, H., and Kacperczyk, M., 2010. Competition and bias. Quarterly Journal of Economics 125 (4), 1683-1725.
Hong, H., and Kubik, J. D., 2003. Analyzing the analysts: Career concerns and biased earnings forecasts. The Journal of Finance 58 (1), 313-351.
Jackson, A. R., 2005. Trade generation, reputation, and sell-side analysts. The Journal of Finance 60 (2), 673-717.
Jame, R., Johnston, R., Markov, S., and Wolfe, M. C., 2016. The value of crowdsourced earnings forecasts. Journal of Accounting Research 54 (4), 1077-1110.
Jegadeesh, N., Kim, J., Krische, S. D., and Lee, C., 2004. Analyzing the analysts: When do recommendations add value? The Journal of Finance 59 (3), 1083-1124.
30
Kadan, O., Madureira, L., Wang, R., and Zach, T., 2009. Conflicts of interest and stock recommendations: The effects of the global settlement and related regulations. Review of Financial Studies 22 (10), 4189-4217.
Kasznik, R., and McNichols, M. F., 2002. Does meeting earnings expectations matter? Evidence from analyst forecast revisions and share prices. Journal of Accounting Research 40 (3), 727-759.
Ke, B., and Yu, Y., 2006. The effect of issuing biased earnings forecasts on analysts' access to management and survival. Journal of Accounting Research 44 (5), 965-999.
Kelly, B., and Ljungqvist, A., 2012. Testing asymmetric-information asset pricing models. Review of Financial Studies 25 (5), 1366-1413.
Kunda, Z., 1990. The case for motivated reasoning. Psychological bulletin, 108(3), 480-498.
Kothari, S. P., 2001. Capital markets research in accounting. Journal of Accounting and Economics, 31(1), 105-231.
Lin, H. W., and McNichols, M. F., 1998. Underwriting relationships, analysts' earnings forecasts and investment recommendations. Journal of Accounting and Economics 25 (1), 101-127.
Ljungqvist, A., Marston, F., Starks, L. T., Wei, K. D., and Yan, H., 2007. Conflicts of interest in sell-side research and the moderating role of institutional investors. Journal of Financial Economics 85 (2), 420-456.
Malmendier, U., and Shanthikumar, D., 2007. Are small investors naive about incentives? Journal of Financial Economics 85 (2), 457-489.
Matsumoto, D. A., 2002. Management's incentives to avoid negative earnings surprises. The Accounting Review 77 (3), 483-514.
Mehran, H., and Stulz, R. M., 2007. The economics of conflicts of interest in financial institutions. Journal of Financial Economics 85 (2), 267-296.
Merkley, K. J., Michaely, R., and Pacelli, J. M., 2016. Does the scope of sell-side analyst industry matter? An examination of bias, accuracy and information content of analyst reports. Journal of Finance (forthcoming).
Michaely, R., and Womack, K. L., 1999. Conflict of interest and the credibility of underwriter analyst recommendations. Review of Financial Studies 12 (4), 653-686.
O'Brien, P. C., 1988. Analysts' forecasts as earnings expectations. Journal of Accounting and Economics 10 (1), 53-83.
Pastor, L., and Veronesi, P., 2003, Stock Valuation and Learnings about Profitability. Journal of Finance 58 (5), 1749-1789.
31
Richardson, S., Teoh, S. H., and Wysocki, P. D., 2004. The walk-down to beatable analyst forecasts: The role of equity issuance and insider trading incentives. Contemporary Accounting Research 21 (4), 885-924.
Womack, K. L., 1996. Do brokerage analysts' recommendations have investment value? The Journal of Finance 51 (1), 137-167.
Xia, H., 2014. Can investor-paid credit rating agencies improve the information quality of issuer-paid rating agencies? Journal of Financial Economics, 111 (2), 450-468.
32
Table 1: Estimize Summary Statistics This table reports summary statistics for forecasts submitted on Estimize from January 2012 to December 2015. Panel A reports the breadth and depth of Estimize coverage across the four years in the sample. Panel B partitions Estimize firms into five groups based on the year in which the company was first added to Estimize, and reports summary statistics for each group. The sample includes 1,842 firms with 1) continuous sells-side coverage from 2009-2015, 2) a stock price of at least $5 at the end of 2011, and 3) non-missing book-value of equity at the end of 2011. Panel A: Breadth and Depth of Estimize Coverage
Year Firms Covered Firm-Quarters Contributors Forecasts Contributors per Firm-Quarter: Average Mean Median Firms Followed
Observations Contributors Per Firm Quarter % Quarters Average Firm Characteristics Average Median with Coverage IBES Coverage Market Cap ($Bil) Book-to-Market 2012 Additions 772 11.70 6.25 90.02% 20.17 18.62 0.41 2013 Additions 509 2.53 2.09 75.87% 12.35 3.71 0.53 2014 Additions 74 1.66 1.46 48.09% 9.14 2.24 0.43 2015 Additions 36 1.02 0.42 12.50% 8.11 1.20 0.47 Not on Estimize 451 0.00 0.00 0.00% 7.96 2.54 0.58
33
Table 2: A Comparison of Estimize and IBES Quarterly Forecasts This table examines key attributes of Estimize and IBES consensus forecasts. In computing a consensus, we limit the sample to earnings forecasts issued within 120 calendar days of the earnings announcement and use the most recent forecast by a contributor or an analyst. We also exclude forecasts flagged as unreliable by Estimize. We report mean and median attribute values, as well as the percentage of the times that the Estimize value exceeds the IBES value. Forecast attributes are defined in the Appendix. The sample is limited to the 772 firms that were added to Estimize in 2012. For all attributes except Representativeness, the sample includes 8,265 firm-quarters over the 2013-2015 period. For Representativeness, the sample includes one observation for each firm. Estimize Mean Estimize Median IBES Mean IBES Median % Estimize > IBES Forecasters Per Stock 12.64 6.00 14.83 14.00 23.91% Forecast Age 9.71 6.33 63.82 66.76 1.37% BIAS/Prc 0.26% 0.92% 5.81% 3.75% 19.18% Bias/Consensus -1.36% 0.80% 5.51% 3.19% 17.57% MBE 55.81% 100.00% 70.02% 100.00% - AbsFE 17.19% 7.86% 15.87% 8.06% 45.15% Representativeness (ERC) 4.65% 2.90% 5.39% 3.06% 38.98%
34
Table 3: The Effect of Estimize Coverage on Bias This table examines sell-side bias before (from 2009 to 2011) and after the arrival of Estimize (from 2013 to 2015) for treated and matched control firms. Treated firms are those added to the Estimize platform in 2012. Candidate control firms are those not added to Estimize as of 2015. A matched control firm satisfies two conditions: it has the same size quintile and book-to-market quintile as the treated firm, based on breakpoints estimated at the end of 2011, and the smallest difference in pre-event period bias from the treated firm. The sample includes 772 treated firms and 17,877 treated-firm quarters. Panels A and B report mean BIAS/Prc and Abnormal BIAS/Prc, respectively. BIAS/Prc is the difference between actual earnings and the consensus IBES forecast, scaled by stock price at the end of the previous year (reported in percent). Abnormal Bias/Prc is the residual from a panel regression of BIAS/Prc on control variables (Size, Book-to-Market, Coverage, Turnover, Volatility, Return, Forecast Age, Guidance, and industry and time fixed effects). All variables are defined in the Appendix. Reported t-statistics are based on standard errors that are double-clustered by firm and quarter.
Panel A: BIAS/Prc
Before After Difference t(Dif.) Estimize 13.81 5.08 -8.73 (-4.13) Matched Control 11.14 11.31 0.17 (0.05) Estimize - Control 2.66 -6.23 -8.89 (-3.72)
Panel B: Abnormal BIAS/Prc
Before After Difference t(Dif.) Estimize 1.94 -1.14 -3.08 (-3.16) Matched Control 1.25 7.57 6.31 (2.86) Estimize - Control 0.69 -8.70 -9.39 (-3.91)
35
Table 4: The Effects of Estimize Coverage on Bias – Alternative Specifications This table examines sell-side bias before (from 2009 to 2011) and after the arrival of Estimize (from 2013 to 2015) for treated and matched control firms using alternative matching approaches, alternative measures of bias, and an alternative treatment sample. Row 1 reports the baseline results for Bias/Prc and Abnormal Bias/Prc as reported in Panels A and B of Table 3, respectively. Rows 2 and 3 repeat the baseline analysis but now select the matched control firm using propensity score matching. We estimate the propensity score with a logistic regression where the dependent variable equals 1 for treated firms (i.e., stocks added to Estimize in 2012) and 0 for candidate control firms (stocks not added to Estimize as of 2015). The independent variables include four firm characteristics: Size, Book-to-Market, Turnover, and Coverage, estimated at the end of 2011, and two forecast characteristics: Bias/Prc and AbsFE, estimated over the 12 quarters in the pre-event window. For each treated firm, we select a control firm with the closest propensity score. Rows 2 report the results for the full sample of treated firms (772 treated firms and 17,626 firm-quarter observations), and Row 3 limits the sample to 503 treated firms (11,590 firm-quarters), each with a propensity score within 0.25% of the matched control firm (i.e., common support). Rows 4 and 5 repeat the analysis in Row 2 after replacing Bias/Prc with two alternative measures of bias: Bias/AbsConsensus and MBE. Row 6 repeats the analysis in Row 2 after redefining treated firms as firms added to Estimize in 2013 and re-defining the post-event window as 2014-2015. The sample in Row 6 includes 489 treated firms and 9,457 firm-quarter observations. The reported t-statistics are computed based on standard errors double-clustered by firm and quarter. Bias Abnormal Bias 1. Table 3 Baseline Results -8.89 -9.39
Table 5: The Effect of Estimize Coverage on Accuracy and Representativeness This table examines sell-side forecast accuracy and representativeness before (from 2009 to 2011) and after the arrival of Estimize (from 2013 to 2015) for treated and matched control firms. Treated firms are those added to the Estimize platform in 2012. Candidate control firms are those not added to Estimize as of 2015. A matched control firm satisfies two conditions: it has the same size quintile and book-to-market quintile as the treated firm, based on breakpoints estimated at the end of 2011, and the smallest difference in pre-event period accuracy (or representativeness) from the treated firm. Accuracy is inversely related to the absolute value of the consensus forecast error (AbsFE), whereas Representativeness is defined as the earnings response coefficient from a firm-specific earnings-returns regression. See the Appendix for details. The sample in Panel A includes 772 treated firms and 17,877 firm-quarter observations. The sample in Panel B includes 767 treated firms and 1,534 firm observations. The table reports the sample means. Reported t-statistics are based on standard errors that are double-clustered by firm and quarter in Panel A and clustered by firm in Panel B.
Panel A: Absolute Forecast Error (AbsFE) Before After Difference t(Dif)
Estimize 31.76 19.87 -11.89 (-3.58) Matched Control 30.59 25.81 -4.78 (-1.46) Estimize - Control 1.16 -5.94 -7.10 (-5.05)
Panel B: Representativeness (ERCs) Before After Difference t(Dif)
Estimize 2.75 4.78 2.04 (6.88) Matched Control 2.29 2.12 -0.17 (-1.24) Estimize - Control 0.46 2.67 2.21 (6.84)
37
Table 6: Systematic Variation in The Effect of Estimize Coverage on Sell-Side Bias This table reports the mean difference-in-difference estimates of Abnormal Bias/Prc conditional on the level of existing sell-side competition, measured as the number of sell-side analysts covering the firm in 2011 (Coverage); earnings uncertainty, measured as the standard deviation of earnings forecasts scaled by price (Dispersion) or the market-to-book ratio, both estimated in 2011; and Estimize effectiveness as a benchmark, defined as bias (Estimize Bias/Prc) or accuracy (Estimize AbsFE) of the Estimize consensus, both estimated in the prior quarter. The table reports the mean difference-in-difference estimates of Abnormal Bias/Prc, as computed in Panel B of Table 3, after partitioning firms into quartiles based on the variable of interest. The reported t-statistics (in parentheses) are computed based on standard errors double-clustered by firm and quarter. Competition Earnings Uncertainty Benchmark Effectiveness
Table 7: The Effect of Estimize Coverage on Bias in Longer-Horizon Forecasts and Recommendation Levels This table examines bias in sell-side analysts’ longer-horizon earnings forecasts and investment recommendations before and after the arrival of Estimize in 2012. We use the difference-in-difference approach of Panel A of Table 3, except we now define the outcome variable as the bias in two- to five-quarter ahead consensus earnings forecasts (Panels A through D) or the consensus recommendation (Panels E and F). In matching a treated firm to a control firm, we use the values of the respective outcome variable in the pre-event period. Recommendations are converted to numeric values using the following scale: 1 for strong buy, 2 for buy, 3 for hold, 4 for sell/underperform, and 5 for strong sell. The reported t-statistics are based on standard errors double-clustered by firm and quarter.
Panel A: Two-Quarter Ahead Earnings
Before After Difference t(Dif) Estimize 0.95 -6.48 -7.43 (-1.15) Matched Control 2.31 0.91 -1.40 (-0.28) Estimize - Control -1.35 -7.39 -6.04 (-1.68)
Panel B: Three-Quarter Ahead Earnings
Before After Difference t(Dif) Estimize -8.54 -14.58 -6.04 (-0.62) Matched Control -5.05 -4.79 0.26 (0.03) Estimize - Control -3.48 -9.79 -6.31 (-1.26)
Panel C: Four-Quarter Ahead Earnings
Before After Difference t(Dif) Estimize -18.35 -20.14 -1.79 (-0.14) Matched Control -11.83 -13.08 -1.25 (-0.13) Estimize - Control -6.52 -7.06 -0.54 (-0.08)
Panel D: Five-Quarter Ahead Earnings
Before After Difference t(Dif) Estimize -19.40 -23.80 -4.40 (-0.30) Matched Control -16.04 -15.96 0.08 (0.01) Estimize - Control -3.36 -7.84 -4.48 (-0.59)
Panel E: Rec Level
Before After Difference t(Dif) Estimize 2.27 2.35 0.08 (3.50) Matched Control 2.35 2.50 0.15 (8.22) Estimize - Control -0.09 -0.15 -0.07 (-2.69)
39
Figure 1: Distribution of the Difference in Bias of Treatment and Control Groups Before and After Estimize This figure plots the distribution of Abnormal BIAS/Prc of treatment and control firms before and after the introduction of Estimize. Treated firms are those added to the Estimize platform in 2012 (772 firms). Control firms are those not added to Estimize as of 2015. For each treated firm, we require that candidate control firms be in the same size quintile and book-to-market quintile. We then select the candidate control firm that has the smallest difference in Abnormal BIAS/Prc (averaged across all 4 quarters in 2009). We compute the difference in Abnormal Bias/Prc for treated and control firms over 2010-2011 (“before”) and 2013-2014 (”after”). BIAS/Prc is defined as the difference between actual earnings and the consensus IBES forecast, scaled by stock price at the end of the previous year, and Abnormal Bias/Prc is the residual from a panel regression of BIAS/Prc on control variables (Size, Book-to-Market, Coverage, Turnover, Volatility, Returns, Forecast Age, Guidance, and industry and time fixed effects). Additional details on variable definitions are in the Appendix.
Abnormal BIAS/Prc Treatment - Abnormal BIAS/Prc Control
Before After
40
Figure 2: Difference-in-Difference in Bias in Event Time This figure reports the difference-in-difference in Abnormal Bias/Prc from 2009 to 2015, using 2009 as the benchmark year. The event year is 2012 which corresponds to the introduction of Estimize. Treated firms are those added to the Estimize platform in 2012 (772 firms). Control firms are those not added to Estimize as of 2015. For each treated firm, we require that candidate control firms be in the same size quintile and book-to-market quintile. We then select the candidate control firm that has the small difference in Abnormal BIAS/Prc (averaged across all 4 quarters in 2009). We report the average difference in Abnormal Bias/Prc for treated and control firms each year, less the average difference in Abnormal Bias/Prc for treated and control firms in 2009. BIAS/Prc is defined as the difference between actual earnings and the consensus IBES forecast, scaled by stock price at the end of the previous year, and Abnormal Bias/Prc is the residual from a panel regression of BIAS/Prc on control variables (Size, Book-to-Market, Coverage, Turnover, Volatility, Returns, Forecast Age, Guidance, and industry and time fixed effects). Additional details on variable definitions are in the Appendix. The dotted orange lines plot the 90% confidence interval based on standard errors clustered by firm.
-16.00
-14.00
-12.00
-10.00
-8.00
-6.00
-4.00
-2.00
0.00
2.00
4.00
2009 2010 2011 2012 (Event) 2013 2014 2015
Δ Abnormal BIAS/Prc Treatment -Δ Abnormal BIAS/Prc Control