Page 1
Does exposure to psychosocial adversity enhance deception detection ability?
Abstract
People who grow up in stressful conditions tend to score lower on conventional assessments of
cognitive abilities. They might, however, develop enhanced mental skills and abilities for solving
problems that are more ecologically relevant to them. We present two studies examining whether
psychosocial adversity (i.e., exposure to neighborhood violence and to harsh parenting) enhances
the ability to detect deception. Our results, based on Signal Detection and Bayesian analyses, are
mixed. In Study 1, we find no support for our hypothesis that exposure to psychosocial adversity
enhances deception detection ability. In Study 2, we do find that only harsher parenting predicts
greater accuracy. This evidence is either weak or strong, depending on whether we compare our
hypothesis to the null hypothesis or an impairment model, respectively. In both studies, we find
no relationship between neighborhood violence and accuracy. Although the implications of our
findings are modest, we hope they will encourage future research focused on the skills and
abilities of people who develop in harsh environments.
Keywords: evolution; development; neighborhood violence; harsh parenting; deception
detection; Bayesian statistics; signal detection theory.
Page 2
DECEPTION DETECTION IN HARSH ENVIRONMENTS 2
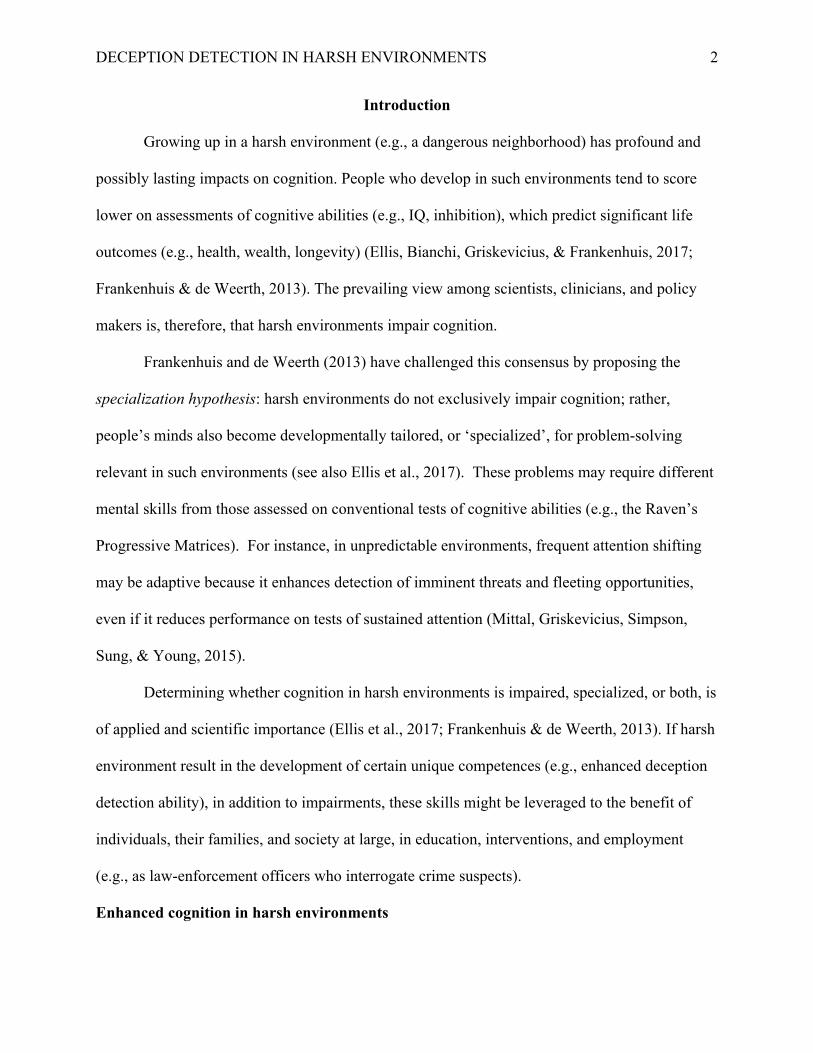
Introduction
Growing up in a harsh environment (e.g., a dangerous neighborhood) has profound and
possibly lasting impacts on cognition. People who develop in such environments tend to score
lower on assessments of cognitive abilities (e.g., IQ, inhibition), which predict significant life
outcomes (e.g., health, wealth, longevity) (Ellis, Bianchi, Griskevicius, & Frankenhuis, 2017;
Frankenhuis & de Weerth, 2013). The prevailing view among scientists, clinicians, and policy
makers is, therefore, that harsh environments impair cognition.
Frankenhuis and de Weerth (2013) have challenged this consensus by proposing the
specialization hypothesis: harsh environments do not exclusively impair cognition; rather,
people’s minds also become developmentally tailored, or ‘specialized’, for problem-solving
relevant in such environments (see also Ellis et al., 2017). These problems may require different
mental skills from those assessed on conventional tests of cognitive abilities (e.g., the Raven’s
Progressive Matrices). For instance, in unpredictable environments, frequent attention shifting
may be adaptive because it enhances detection of imminent threats and fleeting opportunities,
even if it reduces performance on tests of sustained attention (Mittal, Griskevicius, Simpson,
Sung, & Young, 2015).
Determining whether cognition in harsh environments is impaired, specialized, or both, is
of applied and scientific importance (Ellis et al., 2017; Frankenhuis & de Weerth, 2013). If harsh
environment result in the development of certain unique competences (e.g., enhanced deception
detection ability), in addition to impairments, these skills might be leveraged to the benefit of
individuals, their families, and society at large, in education, interventions, and employment
(e.g., as law-enforcement officers who interrogate crime suspects).
Enhanced cognition in harsh environments
Page 3
DECEPTION DETECTION IN HARSH ENVIRONMENTS
3
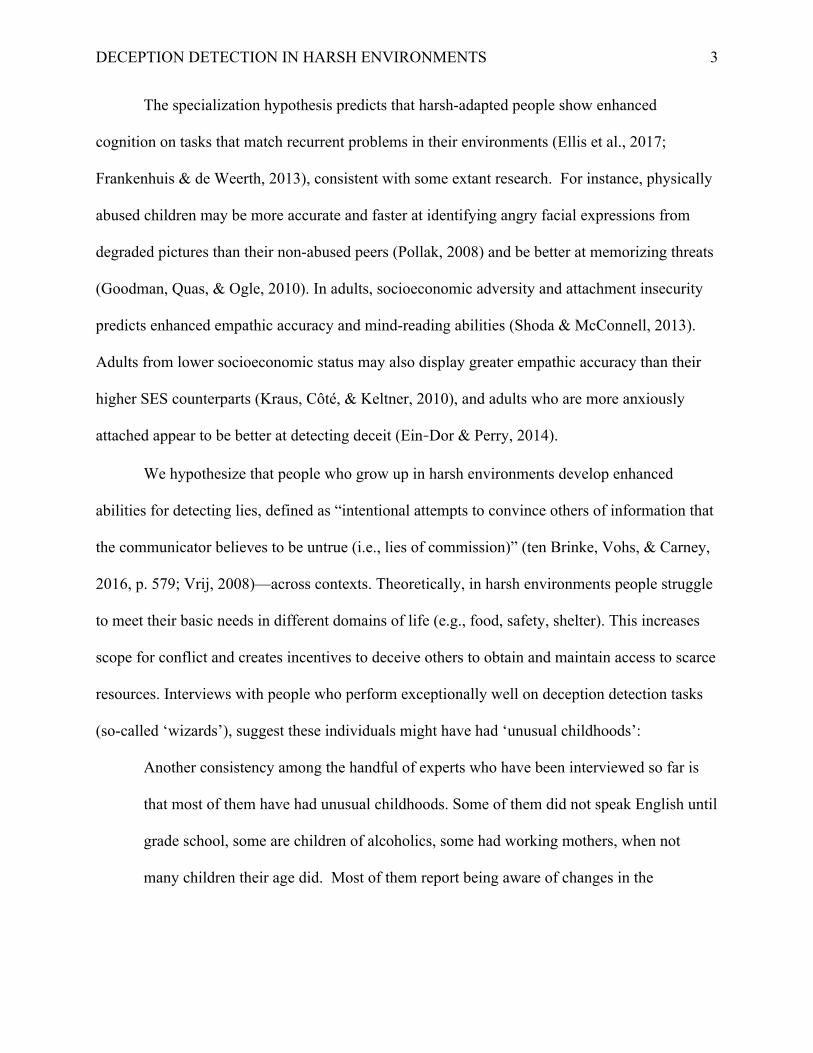
The specialization hypothesis predicts that harsh-adapted people show enhanced
cognition on tasks that match recurrent problems in their environments (Ellis et al., 2017;
Frankenhuis & de Weerth, 2013), consistent with some extant research. For instance, physically
abused children may be more accurate and faster at identifying angry facial expressions from
degraded pictures than their non-abused peers (Pollak, 2008) and be better at memorizing threats
(Goodman, Quas, & Ogle, 2010). In adults, socioeconomic adversity and attachment insecurity
predicts enhanced empathic accuracy and mind-reading abilities (Shoda & McConnell, 2013).
Adults from lower socioeconomic status may also display greater empathic accuracy than their
higher SES counterparts (Kraus, Côté, & Keltner, 2010), and adults who are more anxiously
attached appear to be better at detecting deceit (Ein‐Dor & Perry, 2014).
We hypothesize that people who grow up in harsh environments develop enhanced
abilities for detecting lies, defined as “intentional attempts to convince others of information that
the communicator believes to be untrue (i.e., lies of commission)” (ten Brinke, Vohs, & Carney,
2016, p. 579; Vrij, 2008)—across contexts. Theoretically, in harsh environments people struggle
to meet their basic needs in different domains of life (e.g., food, safety, shelter). This increases
scope for conflict and creates incentives to deceive others to obtain and maintain access to scarce
resources. Interviews with people who perform exceptionally well on deception detection tasks
(so-called ‘wizards’), suggest these individuals might have had ‘unusual childhoods’:
Another consistency among the handful of experts who have been interviewed so far is
that most of them have had unusual childhoods. Some of them did not speak English until
grade school, some are children of alcoholics, some had working mothers, when not
many children their age did. Most of them report being aware of changes in the
Page 4
DECEPTION DETECTION IN HARSH ENVIRONMENTS 4
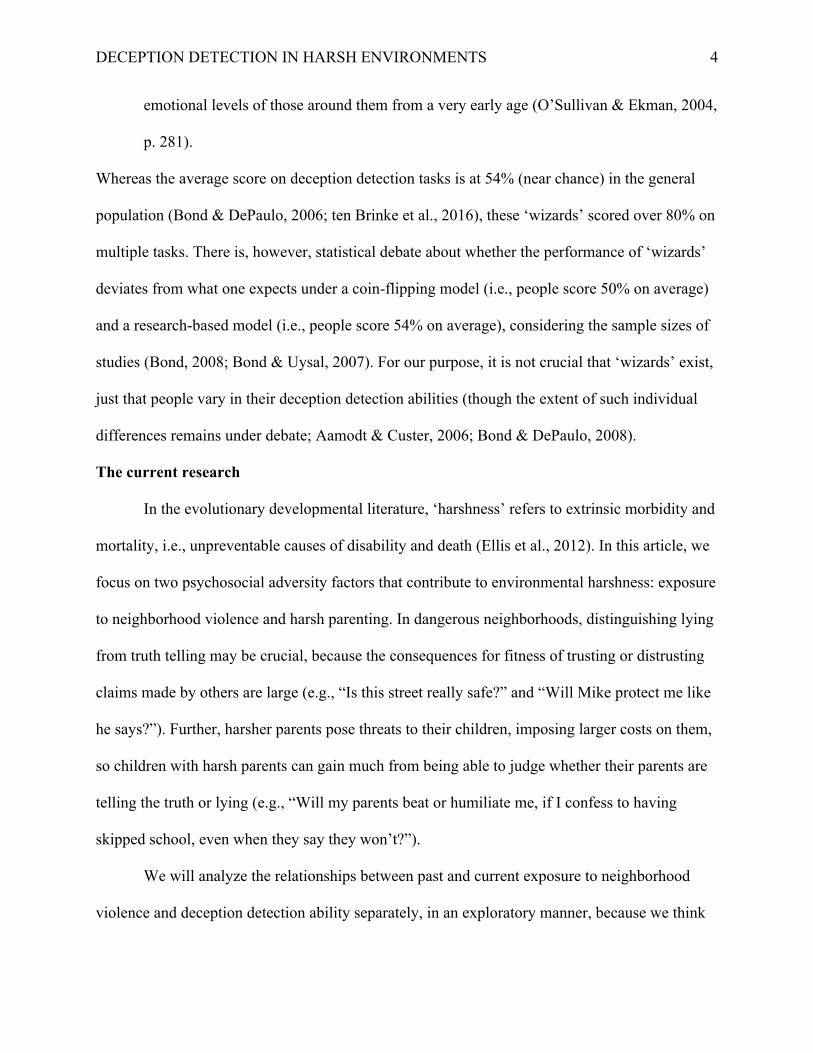
emotional levels of those around them from a very early age (O’Sullivan & Ekman, 2004,
p. 281).
Whereas the average score on deception detection tasks is at 54% (near chance) in the general
population (Bond & DePaulo, 2006; ten Brinke et al., 2016), these ‘wizards’ scored over 80% on
multiple tasks. There is, however, statistical debate about whether the performance of ‘wizards’
deviates from what one expects under a coin-flipping model (i.e., people score 50% on average)
and a research-based model (i.e., people score 54% on average), considering the sample sizes of
studies (Bond, 2008; Bond & Uysal, 2007). For our purpose, it is not crucial that ‘wizards’ exist,
just that people vary in their deception detection abilities (though the extent of such individual
differences remains under debate; Aamodt & Custer, 2006; Bond & DePaulo, 2008).
The current research
In the evolutionary developmental literature, ‘harshness’ refers to extrinsic morbidity and
mortality, i.e., unpreventable causes of disability and death (Ellis et al., 2012). In this article, we
focus on two psychosocial adversity factors that contribute to environmental harshness: exposure
to neighborhood violence and harsh parenting. In dangerous neighborhoods, distinguishing lying
from truth telling may be crucial, because the consequences for fitness of trusting or distrusting
claims made by others are large (e.g., “Is this street really safe?” and “Will Mike protect me like
he says?”). Further, harsher parents pose threats to their children, imposing larger costs on them,
so children with harsh parents can gain much from being able to judge whether their parents are
telling the truth or lying (e.g., “Will my parents beat or humiliate me, if I confess to having
skipped school, even when they say they won’t?”).
We will analyze the relationships between past and current exposure to neighborhood
violence and deception detection ability separately, in an exploratory manner, because we think
Page 5
DECEPTION DETECTION IN HARSH ENVIRONMENTS
5
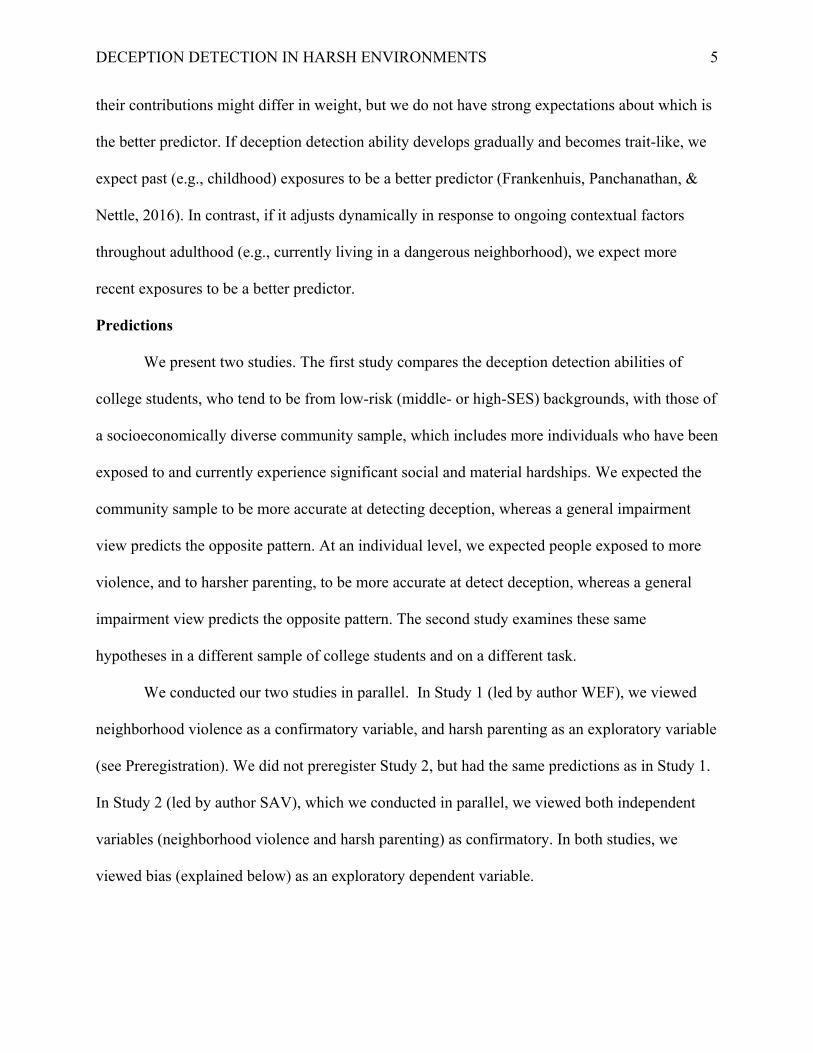
their contributions might differ in weight, but we do not have strong expectations about which is
the better predictor. If deception detection ability develops gradually and becomes trait-like, we
expect past (e.g., childhood) exposures to be a better predictor (Frankenhuis, Panchanathan, &
Nettle, 2016). In contrast, if it adjusts dynamically in response to ongoing contextual factors
throughout adulthood (e.g., currently living in a dangerous neighborhood), we expect more
recent exposures to be a better predictor.
Predictions
We present two studies. The first study compares the deception detection abilities of
college students, who tend to be from low-risk (middle- or high-SES) backgrounds, with those of
a socioeconomically diverse community sample, which includes more individuals who have been
exposed to and currently experience significant social and material hardships. We expected the
community sample to be more accurate at detecting deception, whereas a general impairment
view predicts the opposite pattern. At an individual level, we expected people exposed to more
violence, and to harsher parenting, to be more accurate at detect deception, whereas a general
impairment view predicts the opposite pattern. The second study examines these same
hypotheses in a different sample of college students and on a different task.
We conducted our two studies in parallel. In Study 1 (led by author WEF), we viewed
neighborhood violence as a confirmatory variable, and harsh parenting as an exploratory variable
(see Preregistration). We did not preregister Study 2, but had the same predictions as in Study 1.
In Study 2 (led by author SAV), which we conducted in parallel, we viewed both independent
variables (neighborhood violence and harsh parenting) as confirmatory. In both studies, we
viewed bias (explained below) as an exploratory dependent variable.
Page 6
DECEPTION DETECTION IN HARSH ENVIRONMENTS 6
In both studies, we use a conventional cognitive test—the Raven’s Progressive Matrices
(henceforth, Raven)—in order to assess analytic intelligence. Based on both theoretical accounts
as well as extant research showing negative associations between exposure to adversity and
analytic intelligence (see Ellis et al., 2017; Frankenhuis & de Weerth, 2013), we expect negative
associations between neighborhood violence and harsh parenting and performance on the Raven.
In both studies, we explored whether participants were able to estimate their own
deception detection ability, but found no evidence for associations between self-ratings and
actual performance. We also asked participants what cues they used to form their judgments.
Consistent with previous research (DePaulo et al., 2003), participants answered relying on verbal
cues (such as stuttering, intonation, unconvincing arguments) as well as non-verbal cues (such as
blushing, avoiding eye contact, body posture, fidgeting).
For exploratory purposes, we measured past and current involvement in violence, past
and current poverty, and life expectancy. Although some of these variables showed significant
correlations with our dependent variables, none of them consistently did so in both studies; hence
we do not discuss them.
Study 1
Participants
Our goal was to test 90 participants: 45 from the community sample and 45 students. We
actually tested 102 participants: 49 in the community sample and 53 students. We excluded three
participants from the community sample who did not complete the questionnaires or the
deception detection task, and nine (eight of which were students) that we accidentally tested
beyond our preregistered sample size due to parallel testing at different locations (we excluded
the last participants we tested, based on their date and time of participation, without having seen
Page 7
DECEPTION DETECTION IN HARSH ENVIRONMENTS
7
their data). The final sample comprised 90 participants: 45 in the community sample (Mage = 42,
SD = 12, range: 18–65; 33 females) and 45 students (Mage = 23, SD = 6, range: 19–61; 30
females). All participants received €10 or €15 compensation, depending on whether they
completed the test-battery in 60 or 90 minutes (see Procedure).
Following our preregistration, we do not report analyses of age below. Given the age
difference between the student and community sample, however, we checked for main effects of
age, and for interactions effects between age and our independent variables, finding neither.
Procedure
We recruited the community sample via two different agencies that aim to improve the
lives of people living in disadvantaged conditions for Dutch standards, including homelessness,
eviction, unemployment, and exposure to family violence. We recruited this sample using folders
and posters, and with the help of employees of these agencies who informed people about the
possibility of participating. We recruited the students via an online sign-up system of Radboud
University.
Depending on the place of recruitment, participants completed the test-battery
individually in a test-cubicle at the university or in a room of one of the community agencies. All
participants completed the same test-battery, which comprised the present studies and three other
ones measuring mental skills unrelated to deception detection. All instructions and questions
were presented in Dutch. Students completed the test-battery on a 24-inch desktop and the
community sample on a 17-inch laptop.
After we provided verbal instructions, participants completed the questionnaire (see
below) and three other studies before they started with the deception detection study. Participants
viewed the videos showing deception detection trials (see below) sequentially and in the same
Page 8
DECEPTION DETECTION IN HARSH ENVIRONMENTS 8
order. After each video, participants indicated whether a suspect was lying or telling the truth.
Following the test phase, participants viewed two additional videos, which we used to measure
English proficiency. All videos were presented in the center of the screen in an area of ~700×750
pixels. Finally, participants completed the abbreviated version of the Raven (Bilker et al., 2012).
Items were presented in an area that filled ~90×70 percent of the screen. Participants received
their compensation after completing the test-battery.
Materials
We preregistered our hypotheses, sample size, statistical analyses, and materials for
Study 1, and provide the data for Studies 1 and 2, at the Open Science Framework:
https://osf.io/c8fne/. Both studies have been approved by the Ethics Committee of the Faculty of
Social Sciences of Radboud University Nijmegen; CSW2014-1310-250; Verborgen Talenten
(English translation: Hidden Talents).
Stimuli. We examined deception detection accuracy using a shortened version of the
high-stakes mock-paradigm videos (in English) developed by ten Brinke, Stimson, and Carney
(2014). We did not use the complete videos for three reasons. First, according to some previous
research: “Giving people less information – 5 s of video footage versus 3 min – improves the
accuracy of explicit reports of lie detection by up to 15%” (ten Brinke et al., 2016, p. 584; see
also Albrechtsen, Meissner, & Susa, 2009; but see Street & Vadillo, 2016). Second, in working
with our community sample, there were considerable time constraints (e.g., some people bring
their children, who cannot wait for long). Third, the current study was part of a test-battery that
included multiple studies, further limiting the available time.
In the videos, $100 was hidden in a test cubicle. Six of 12 individuals featuring in these
videos were randomly assigned to take the money and the other six to not take it. All participants
Page 9
DECEPTION DETECTION IN HARSH ENVIRONMENTS
9
could earn the money only if they convinced the experimenter that they did not steal it (i.e., half
of the participants lied). Convincing suspects could earn an additional $500 through a lottery.
The experimenter asked questions unrelated to the possible theft (e.g., “What are you wearing
today?”) as well as ones related to it (e.g., “Did you steal the money?”). We used only those four
questions related to the possible theft. Video segments lasted 46s on average (SD = 28; with truth
segments M = 42, SD = 6; lie segments M = 52, SD = 18).
We used English videos even though our participants were Dutch, as we considered
replicating the study in a US sample, if results suggested enhanced deception detection accuracy
in our community sample. Our participants watched three snippets of two of ten Brinke et al.’s
(2014) videos, showing suspects from the shoulders up, while answering questions unrelated to
the possible theft. To assess English proficiency, we asked six multiple-choice questions (e.g.,
“Which color are the suspect’s pants?”), each with five options (e.g., “Yellow”, “Brown”,
“Black”, “White”, “Blue”).
Neighborhood violence. We measured past (seven items; e.g., “I grew up in a safe
neighborhood”; α= 0.86) and current (seven items; e.g., “Physical fights are common in my
neighborhood”; α = 0.88) exposure to neighborhood violence using the Neighborhood Violence
Scale (NVS; see Supplementary Materials File for subscales and their development). These
subscales are exactly the same except in referring to the past (<18 years) or present (current
experiences). Participants rated items on a scale from 1–7 (completely agree–disagree).
Harsh parenting. We assessed parental behavior using an abbreviated version of the
Parenting Questionnaire (α= 0.90) developed by Ellis, Schlomer, Tilley, and Butler (2012). The
questionnaire was translated to Dutch. This questionnaire consisted of four subscales: maternal
warmth (α= 0.89), paternal warmth (α= 0.80), maternal aggression (α= 0.84), and paternal
Page 10
DECEPTION DETECTION IN HARSH ENVIRONMENTS 10
aggression (α= 0.89). The maternal and paternal warmth subscales each consisted of six items,
and the maternal and paternal aggression scales each consisted of four items. The items were
statements (for example, “My mother pushed, grabbed, or slapped me.”). Participants rated the
extent to which these statements applied to their childhood (until age 16) on a scale from 1–5
(never–always). We computed the mean over all four subscales to obtain a single harsh parenting
score per participant. A higher score indicates lower paternal and maternal warmth, and higher
paternal and maternal aggression. If participants had one parent, we computed the mean over the
two subscales pertaining to that parent.
Raven. We used an abbreviated nine-item version of the Raven (Bilker et al., 2012) to
measure analytic intelligence. Participants complete an incomplete geometric pattern by
selecting the missing element from a set of (six or eight) options. Items progressively increase in
difficulty.
Results
Before conducting our main analyses, Shapiro-Wilk tests indicated that our data was
unlikely to be drawn from a normally distributed population; hence we report non-parametric
analyses. We report medians for groups, and Kendall’s tau for correlations, which has more
attractive qualities than Spearman’s rho (Gibbons, 1993).
Signal detection theory. We analyze accuracy and bias using signal detection theory
(Green & Swets, 1974; Macmillan & Creelman, 2005). Participants may rate truths as truths
(correct rejections), truths as lies (false alarms), lies as truths (misses), and lies as lies (hits). We
used the proportion of hits and false alarm to compute accuracy (d’) and bias (c) (for formulas,
see Stanislaw & Todorov, 1999). Distinguishing accuracy and bias is crucial when the number of
signal (e.g., lie) and noise (e.g., truth) trials is not equal. For instance, if 80% of all trials depict
Page 11
DECEPTION DETECTION IN HARSH ENVIRONMENTS
11
lies, mistrustful participants who estimate all trials to be lies attain 80% correct, even when they
do not discriminate truths from lies.
The discriminability d’ captures the extent to which an individual is able to discriminate
between signal (lie) and no-signal (truth) trials. A d’ of zero indicates no discriminability, and
higher d’ greater accuracy. Criterion c indicates the evidentiary bar for rating a trial as a signal
trial: zero c indicates no bias, negative c a low evidentiary bar (lie bias), and positive c a high
evidentiary bar (truth bias) (for more explanation, see Tan, Luan, & Katsikopoulos, 2017).
Some of our participants had 0% or 100% hits and/or false alarms, which precludes
calculation of d’ and c. Hence we applied the log-linear method (Snodgrass & Corwin, 1988),
which improves estimates when there are extreme values (e.g., Brown & White, 2005; Hautus &
Lee, 2006; Stanislaw & Todorov, 1999), to all participants: adding 0.5 to the frequencies of hits
and false alarms, and adding 1 to the number of signal and noise trials, before computing
proportions used to calculate z-scores (used to compute d’ and c).
We computed signal detection analyses using R version 3.3.0 (R Core Team, 2016). We
also analyzed our data using Generalized Linear Mixed Models (GLMMs) (Watkins & Martire,
2015). As these analyses offer similar conclusions as our signal detection analyses for both
studies, we report GLMMs in the Supplementary Materials File.
Bayes Factors. We also estimate Bayes Factors (BFs) (Jeffreys, 1961; Rouder,
Speckman, Sun, Morey, & Iverson, 2009). BFs quantify the relative evidence for two models
(statistical descriptions of hypotheses), typically a null hypothesis (H0) and an alternative
hypothesis (H1). Whereas Frequentist null-hypothesis testing forces an all-or-none decision about
rejecting H0, BFs allow quantification of support for H0 (Wagenmakers, 2007). BF10 denotes a
ratio: the likelihood of the data conditional on Model 1, P(D|M1), divided by the likelihood of the
Page 12
DECEPTION DETECTION IN HARSH ENVIRONMENTS 12
data conditional on Model 0, P(D|M0). For example, if BF10 = 4, the observed data are four times
more likely to have occurred on Model 1 than on Model 0 (Lee & Wagenmakers, 2014).
Bayesian t-tests assume that data are sampled from a normally distributed population. As
our data tend to violate this assumption, our BF estimates will be suboptimal. However, even if
quantitatively imperfect, these estimates are qualitatively informative. We conduct our Bayesian
analyses using JASP software (2016). We use JASP’s default priors: for Bayesian Kendall’s tau
correlations, a uniform distribution (a stretched Beta distribution with width one) for Spearman’s
rho, mapped onto Kendall’s tau; for Bayesian t-tests, a Cauchy distribution with width .707.
Following convention, we report all p-values two-tailed. We report Bayes Factors (BFs)
two-sided if the adaptation and general impairment views make opposing predictions (subscripts
0 and 1), and one-sided if both views make the same prediction (subscripts 0 and + or -). When
the adaptation and general impairment views make opposing predictions (i.e., two-sided BFs),
we compare M1 (θ ≠ 0) with M0 (θ = 0)—rather than the adaptation model (θ > 0) with the
impairment model (θ < 0)—so BFs and p-values are based on comparisons of the same
hypotheses. This approach is conservative: it understates the evidence for whichever hypothesis
is supported (adaptation or impairment hypothesis). For confirmative analyses with a p-value
below 0.05, we also report BFs comparing the adaptation model (θ > 0) with the impairment
model (θ < 0). We calculate this BF+- by multiplying two BFs obtained by one-sided tests:
BF+- = BF+0 * BF0-
In which we obtain BF+0 by comparing the adaptation model with M0, and BF0- by
comparing M0 with the impairment model. As BFs are transitive, multiplying these two
produces BF+-.
Page 13
DECEPTION DETECTION IN HARSH ENVIRONMENTS
13
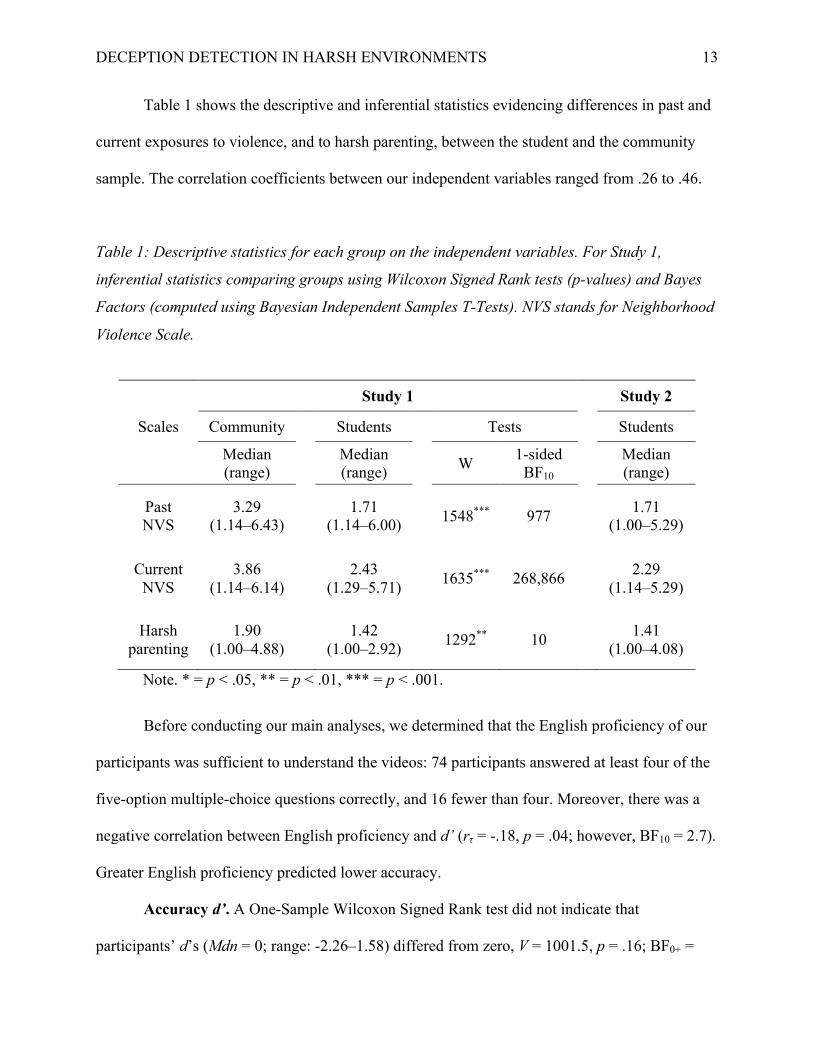
Table 1 shows the descriptive and inferential statistics evidencing differences in past and
current exposures to violence, and to harsh parenting, between the student and the community
sample. The correlation coefficients between our independent variables ranged from .26 to .46.
Table 1: Descriptive statistics for each group on the independent variables. For Study 1,
inferential statistics comparing groups using Wilcoxon Signed Rank tests (p-values) and Bayes
Factors (computed using Bayesian Independent Samples T-Tests). NVS stands for Neighborhood
Violence Scale.
Study 1 Study 2
Scales Community Students Tests Students
Median (range) Median
(range) W 1-sided BF10
Median (range)
Past NVS
3.29 (1.14–6.43) 1.71
(1.14–6.00) 1548*** 977 1.71 (1.00–5.29)
Current NVS
3.86 (1.14–6.14) 2.43
(1.29–5.71) 1635*** 268,866 2.29 (1.14–5.29)
Harsh parenting
1.90 (1.00–4.88) 1.42
(1.00–2.92) 1292** 10 1.41 (1.00–4.08)
Note. * = p < .05, ** = p < .01, *** = p < .001.
Before conducting our main analyses, we determined that the English proficiency of our
participants was sufficient to understand the videos: 74 participants answered at least four of the
five-option multiple-choice questions correctly, and 16 fewer than four. Moreover, there was a
negative correlation between English proficiency and d’ (rτ = -.18, p = .04; however, BF10 = 2.7).
Greater English proficiency predicted lower accuracy.
Accuracy d’. A One-Sample Wilcoxon Signed Rank test did not indicate that
participants’ d’s (Mdn = 0; range: -2.26–1.58) differed from zero, V = 1001.5, p = .16; BF0+ =
Page 14
DECEPTION DETECTION IN HARSH ENVIRONMENTS 14
2.2. Comparing groups, a Mann-Whitney test did not indicate a difference in d’ between the
community sample (Mdn = 0; range: -1.83–1.47) and students (Mdn = 0; range: -2.26–1.58), U =
1176.5, p = .18; BF01 = 2.0. There were no correlations between past (rτ = .06, p = .60; BF01 =
5.4) and current (rτ = .03, p = .76; BF01 = 6.5) exposure to violence and d’, nor between harsh
parenting and d’ (rτ = -.07, p = .50; BF01 = 4.4).
Bias c. A One-Sample Wilcoxon Signed Rank test indicated that participants’ cs (Mdn =
.18) differed significantly from zero, V = 2190, p < .001; BF+0 > 1,000,000. Comparing groups, a
Mann-Whitney test did not indicate a difference of c between the community sample (Mdn = .18)
and students (Mdn = .21), U = 909.5, p = .40; BF0- = 2.1. There were no correlations between
past (rτ = -.08, p = .45; BF0- = 2.2) and current (rτ = -.09, p = .42; BF0- = 2.0) exposure to
violence and c, nor between harsh parenting and c (rτ = -.10, p = .35; BF0- = 1.5).
Raven. We converted the scores of the abbreviated version of the Raven into standard
test scores using a validated function (Bilker et al., 2012). We excluded one participant who did
not complete this test. Comparing groups, a Mann-Whitney test indicated that students (Mdn =
51.68) scored higher on the Raven than the community sample (Mdn = 39.64), U = 458, p < .01;
BF+0 = 1,771. At an individual level, there were no correlations between past (rτ = -.13, p = .21;
BF-0 = 1.5) and current (rτ = -.19, p = .08; however, BF-0 = 8.2) exposure to violence and Raven
scores. There was no correlation between harsh parenting and Raven scores (rτ = -.01, p = .94;
BF0- = 6.5), nor between d’ and Raven scores (rτ = -.002, p = .98; BF01 = 7.2).
Study 2
The second study examines our hypotheses in a different sample of college students and
on a different task. Here, we used a task featuring Dutch speaking and culturally Dutch students
to assess deception detection. This ensures that any failure to detect deception was not due to an
Page 15
DECEPTION DETECTION IN HARSH ENVIRONMENTS
15
inability to understand the person being judged, but instead reflects participants’ skill levels. As
in Study 1, there were real stakes for the people in the videos, but not for our participants.
Participants
Our goal was to test 85 participants. We ended up testing 88 participants, because we had
to exclude the first three due to malfunctioning questionnaires. The final sample comprised 85
participants (Mage = 21.42, SD = 2.67, range: 18–30; 66 females, one person identified as
“other”). All participants were college students and received €5 compensation.
Procedure
We recruited participants via an online sign-up system of the Radboud University.
Criteria for signing up were the ability to understand Dutch and being between 18 and 35 years
old.
Participants completed the test-battery individually in a test-cubicle at the university. All
participants completed the same test-battery, which comprised the present studies and one other
test measuring mental skills unrelated to deception detection. All instructions and questions were
presented in Dutch. Participants completed the test-battery on a 17-inch laptop.
After we provided verbal instructions, participants completed the questionnaire before
they started with the deception detection study. Participants viewed the videos (see below)
sequentially and in the same order. After each video, participants judged whether people in the
videos were telling the truth or lying. All videos were presented in the center of the screen in an
area of ~700×750 pixels. Next, participants completed an unrelated study and the abbreviated
version of the Raven (Bilker et al. 2012). Items were presented in an area that filled ~90×70
percent of the screen. Participants received compensation after completing the test-battery.
Materials
Page 16
DECEPTION DETECTION IN HARSH ENVIRONMENTS 16
Stimuli. We developed a video task to examine deception detection accuracy. We
recruited 10 pairs of students (16 women and four men) in a cafeteria of Radboud University and
asked them to play a game called Split or Steal (Van den Assem, Van Dolder, & Thaler, 2012).
These participants did not participate in the main study and had provided permission to be
filmed, and for the resulting footage to be shown to fellow students. Both players in a pair had to
choose between cooperating (split) and defecting (steal) by picking one of two cards: one
indicating split and the other steal. Both players had one minute to deliberate about their choice,
after which they would lay down the card with the option of their choice, text facing down. If
both players chose split, both received €7.50. If one chose split and the other steal, the player
who chose steal would receive €10 and the other only €5. If both were to choose steal each
would receive €5. The structure of the Split or Steal game is almost identical to that of the
Prisoner’s Dilemma.To ensure that a sufficient number of players chose both options, one of the
players in each pair was given an instruction to either split or steal. They were told not to tell the
other player they had been given an instruction, and to pretend they intended to split. Of the
players with an instruction, 50% was given an instruction to steal, and the other 50% to split.
Only one (10%) of the players without an instruction chose to steal.
During the game, one camera filmed each player, ensuring that facial expressions would
be visible from the same angle as when one would be talking to the player directly (as opposed to
a side-view). We combined video fragments into a single video containing about the same
amount of material from both players. The difference was never larger than 1.7 seconds, or 3.3%
of the duration of the video (M = 1.01). Switching from one camera to the other happened
between sentences or during a pause, to ensure switches would not disturb the viewer. Videos
started when players began deliberating, and ended after participants had selected their cards, but
Page 17
DECEPTION DETECTION IN HARSH ENVIRONMENTS
17
before these cards were turned over. Videos lasted 46s on average (SD = 13; with truth segments
M = 22, SD = 6; lie segments M = 25, SD = 8), and contained Dutch language.
Participants assessed whether the people in the videos would choose split or steal. As
every player told their opponent they were going to split, participants who chose steal were lying
and participants who chose split were telling the truth. For each video, participants made two
judgments: one for each player (first for the person on the left, and then for the person on the
right). Thus, each participant made 20 judgments in total, of which six (30%) were about lies. In
order to ensure participants would not skip parts of the video, they needed to watch a video in its
entirety before selecting an answer.
Neighborhood violence. As in Study 1, we measured past (α= 0.84) and current (α =
0.87) exposure to neighborhood violence using the Neighborhood Violence Scale (see
Supplementary Materials File).
Harsh parenting. As in Study 1, we assessed parental behavior using an abbreviated
version of the Parenting Questionnaire (α= 0.93) (see Ellis, Schlomer, et al., 2012), which
includes four subscales: maternal warmth (α= 0.88), paternal warmth (α= 0.90), maternal
aggression (α= 0.85), and paternal aggression (α= 0.86).
Raven. We used the same abbreviated version of the Raven as in Study 1 (Bilker et al.,
2012).
Results
We report the same analyses as for Study 1. Table 1 shows descriptive statistics. The
correlation coefficients between our independent variables ranged from .11 to .27.
Accuracy d’. A One-Sample Wilcoxon Signed Rank test indicated that participants’ d’s
(Mdn = 0.34; range: -1.12–1.32) differed significantly from zero, V = 2613, p < .001; BF+0 =
Page 18
DECEPTION DETECTION IN HARSH ENVIRONMENTS 18
530. There were no correlations between past (rτ = .08, p = .29; BF01 = 3.8) and current (rτ = -.02,
p = .76; BF01 = 6.7) exposure to violence and d’. However, there was a significant correlation
between harsh parenting and d’ (rτ = .17, p = .03; however, BF10 = 1.7). Harsher parenting
predicted greater accuracy. Testing direction revealed strong evidence for the adaptation model
compared to the impairment model (BF+- = 75).
Bias c. A One-Sample Wilcoxon Signed Rank test indicated that participants’ cs (Mdn =
0.08) differed significantly from zero, V = 2390, p = .003; BF+0 = 40. There were no correlations
between past (rτ = -.10, p = .21; BF0- = 1.7) and current (rτ = -.10, p = .18; BF0- = 1.5) exposure
to violence and c. However, there was a significant correlation between harsh parenting and c (rτ
= -.16, p = .04; however, BF-0 = 2.7). Harsher parenting predicted a lower evidentiary bar in
judging trials as lies.
Raven. There were no correlations between past (rτ = -.02, p = .76; BF01 = 5.4) and
current (rτ = -.13, p = .09; BF10 = 1.2) exposure to violence and Raven scores, nor between harsh
parenting and Raven scores (rτ = .04, p = .58; BF01 = 10.6). There was no correlation between d’
and Raven scores (rτ = .02, p = .83; BF01 = 6.9).
General Discussion
Our results are mixed. In Study 1, we find no support for the hypothesis that exposure to
psychosocial adversity enhances deception detection ability. In Study 2, we do find some
support: harsher parenting predicted greater accuracy. This evidence is either weak or strong,
depending on whether we compare our hypothesis to the null hypothesis or an impairment
model, respectively. In both studies, we observed no relationship between past or current
exposure to neighborhood violence and accuracy.
Page 19
DECEPTION DETECTION IN HARSH ENVIRONMENTS
19
A possible explanation of our mixed results across studies is that participants were able to
use information in the stimuli in Study 2, but not in Study 1. Indeed, in Study 1 participants were
unable to distinguish truths from lies (i.e., their d’s did not differ from zero). Low BFs indicated
that the data were insensitive, providing no support for our specialization hypothesis nor for the
null hypothesis. Either the stimuli of Study 1 did not provide enough information to distinguish
truths from lies, or they did, but participants were not able to use this information to improve
their judgments. We used stimuli known to contain information (ten Brinke et al., 2014), but then
abbreviated them. In doing so, we may have lost information. Some research suggests, however,
that the accuracy of explicit reports of lie detection may increase with shorter presentations
(Albrechtsen et al., 2009; ten Brinke et al., 2016). Further, we showed culturally American and
linguistically English videos to Dutch participants, which may decrease performance (Bond &
Atoum, 2000). However, in Study 1 lower English proficiency predicted greater accuracy. We
cannot assess the cultural stimuli-participant mismatch explanation with the current data.
In Study 2 harsher parenting predicted greater deception detection accuracy. The
structure of the Split or Steal game resembled that of the Prisoner’s Dilemma. A recent meta-
analysis shows that “humans can predict each other’s Prisoner’s Dilemma decisions after a brief
interaction with people who have incentive to deceive” (Sparks, Burleigh, & Barclay, 2016, p.
210). Our judges may have been able to predict the behavior of the game players, and variation
in this ability may have been shaped by experience with harsher parents. We do not know why,
in contrast, exposure to neighborhood violence did not predict deception detection accuracy. Our
parenting scale measures personal involvement in hostile social interactions (e.g., parents hurting
their children), whereas the NVS measures neighborhood-level characteristics. Future research
may examine whether specifically personal involvement in hostile interactions contributes to
Page 20
DECEPTION DETECTION IN HARSH ENVIRONMENTS 20
deception detection ability; and if it does, what psychological process enables this enhanced
performance.
Consistent with previous research (Bond & DePaulo, 2006), we find decisive evidence
for truth bias in both studies, i.e., individuals underestimated the number of deceptions. The
word ‘bias’, here, refers to deviations from the evidentiary bar that maximizes accuracy in the
study setting. In actual environments, however, most people tell the truth most of the time
(Halevy, Shalvi, & Verschuere, 2014). Hence participants may adjust their cue-based estimates
in the lab downward by integrating real-world base rates (Street, 2015). A Bayesian view
predicts the impact of base rates on judgment will be larger when cues are weaker, i.e., provide
less information that discriminates between options (Stamps & Frankenhuis, 2016; Street, 2015;
for a study showing that humans rely more on base rates when cues are less diagnostic, see
Street, Bischof, Vadillo, & Kingstone, 2016). As cues were likely to be weak in our studies,
which they tend to be generally (DePaulo et al., 2003), the truth bias we observed may well
result from integration of base rates (Street, 2015).
Consistent with previous research (Ellis et al., 2017; Frankenhuis & de Weerth, 2013),
students scored higher on the Raven than the community sample. This difference may result in
part from stereotype threat (concerns about confirming stereotypes about one’s social group),
and from community participants being less comfortable in test settings than students (e.g., some
indicated feeling uncertain because they did not do well in school). Our measures of harshness,
however, did not consistently predict Raven scores at an individual level in both studies (note:
Bayesian analyses did support a negative correlation between current exposure to violence and
Raven scores in Study 1). Consistent with meta-analytic results showing no relationship between
Page 21
DECEPTION DETECTION IN HARSH ENVIRONMENTS
21
deception detection ability and educational level (Aamodt & Custer, 2006), we found no
relationship between accuracy and Raven scores.
Our studies have several limitations. First, we measured past adversity exposures
retrospectively. Second, we measured perceptions of, rather than actual, past and current
exposure to neighborhood violence and harsh parenting. On the flip side, subjective and
objective harshness measures are known to correlate in some studies (Sherman, Minich, Langen,
Skufca, & Wilke, 2016), and moreover, some studies find that perceptions are better predictors
of developmental adaptations than objective indicators (Johns, 2011). Third, despite our best
efforts, as we assessed the community sample in the field and in some cases with their own
children nearby, we were not always able to create optimal testing conditions for this sample, as
we were for students. Fourth, we have assumed that people from harsh environments develop
enhanced deception detection abilities across contexts (e.g., harsh parenting predicts detecting
lies in economic game). Future research could examine our hypotheses in context-specific
settings, which match the settings in which harsh-adapted people may have honed their deception
detection abilities.
At the onset we challenged the predominant view that growing up in a harsh environment
impairs cognition (Ellis et al., 2017; Frankenhuis & de Weerth, 2013). This consensus view
informs policy, intervention, and education, which in turn affect the daily lives of millions of
people. If the consensus view is incomplete, people may suffer while well-intended efforts and
material resources are utilized in suboptimal ways. It is thus crucial to constantly scrutinize this
view and consider improvements. Our goal has been to learn about the mental skills and abilities
of people who develop in harsh environments. We found some evidence for the adaptation view
in Study 2, and none of our results indicate that people from harsher environments are worse at
Page 22
DECEPTION DETECTION IN HARSH ENVIRONMENTS 22
detecting deception. The implications of our findings are modest, but those of future discoveries
could be substantial: rather than narrowly focusing on what harsh-adapted people cannot do, it is
time to determine what such individuals can do well. These lenses are complementary, not
mutually exclusive. The better we understand harsh-adapted minds—including their strengths—
the more effective we can tailor education, policy, and interventions to fit their needs and
potentials.
Page 23
DECEPTION DETECTION IN HARSH ENVIRONMENTS
23
Acknowledgements
We thank all participants; Dorian Comperen; Marloes Endenburg; Marleen Groeneweg; Marije
van der Hulst; Pauline Huyts; Barend Rombout; Rob van Sprang. We thank Tita Gonzalez, Chris
Street, Jolene Tan, Leanne ten Brinke, Leonid Tiokhin, Andreas Wilke, Ethan Young, and the
editor and reviewers for valuable comments on previous drafts, and Eric-Jan Wagenmakers for
feedback on Bayesian analyses.
Page 24
DECEPTION DETECTION IN HARSH ENVIRONMENTS 24
References
Aamodt, M. G., & Custer, H. (2006). Who can best catch a liar? A meta-analysis of individual
differences in detecting deception. Forensic Examiner, 15, 6–11.
Albrechtsen, J. S., Meissner, C. A., & Susa, K. J. (2009). Can intuition improve deception
detection performance?. Journal of Experimental Social Psychology, 45, 1052-1055.
Barr, D. J., Levy, R., Scheepers, C., & Tily, H. J. (2013). Random effects structure for
confirmatory hypothesis testing: Keep it maximal. Journal of Memory and Language, 68,
255-278.
Bates, D., Maechler, M., Bolker, B., & Walker, S. (2015). Fitting linear mixed-effects models
using lme4. Journal of Statistical Software, 67, 1-48.
Bilker, J.W., Hansen, J.A., Brensinger, C.M., Richard, J., Gur, R.E., & Gur, R.C. (2012).
Development of abbreviated nine-item forms of the Raven’s Standard Progressive
Matrices test. Assessment, 19, 354-369.
Bond, G. D. (2008). Deception detection expertise. Law and Human Behavior, 32, 339-351.
Bond, C. F., & Atoum, A. O. (2000). International deception. Personality and Social Psychology
Bulletin, 26, 385-395.
Bond, C. F., & DePaulo, B. M. (2006). Accuracy of deception judgments. Personality and Social
Psychology Review, 10, 214-234.
Bond, C. F., & DePaulo, B. M. (2008). Individual differences in judging deception: Accuracy
and bias. Psychological bulletin, 134, 477–492.
Bond Jr, C. F., & Uysal, A. (2007). On lie detection “wizards”. Law and human behavior, 31,
109-115.
Brown, G.S., & White, K.G. (2005). The optimal correction for estimating extreme
discriminability. Behavior Research Methods, 37, 436-449.
Page 25
DECEPTION DETECTION IN HARSH ENVIRONMENTS
25
DePaulo, B. M., Lindsay, J. J., Malone, B. E., Muhlenbruck, L., Charlton, K., & Cooper, H.
(2003). Cues to deception. Psychological Bulletin, 129, 74-118.
Ein-Dor, T., & Perry, A. (2014). Full house of fears: evidence that people high in attachment
anxiety are more accurate in detecting deceit. Journal of Personality, 82, 83-92.
Ellis, B.J., Bianchi, J., Griskevicius, V., & Frankenhuis, W.E. (2017). Beyond risk and protective
factors: An adaptation-based approach to resilience. Perspectives on Psychological
Science.
Ellis, B. J., Del Giudice, M., Dishion, T. J., Figueredo, A. J., Gray, P., Griskevicius, V., …
Wilson, D. S. (2012). The evolutionary basis of risky adolescent behavior: Implications
for science, policy, and practice. Developmental Psychology, 48, 598–623.
Ellis, B. J., Schlomer, G. L., Tilley, E. H., & Butler, E. A. (2012). Impact of fathers on risky
sexual behavior in daughters: A genetically and environmentally controlled sibling
study. Development and Psychopathology, 24, 317-332.
Frankenhuis, W. E., Panchanathan, K., & Nettle, D. (2016). Cognition in harsh and unpredictable
environments. Current Opinion in Psychology, 7, 76-80.
Frankenhuis, W. E., & de Weerth, C. (2013). Does early-life exposure to stress shape or impair
cognition? Current Directions in Psychological Science, 22, 407-412.
Gibbons, J. D. (1993). Nonparametric measures of association. Thousand Oaks, CA: SAGE
Publications.
Goodman, G. S., Quas, J. A., & Ogle, C. M. (2010). Child maltreatment and memory. Annual
Review of Psychology, 61, 325–351.
Green, D.M., & Swets, J.A. (1974). Signal detection theory and psychophysics (reprint). New
York: Krieger (original work published 1966).
Page 26
DECEPTION DETECTION IN HARSH ENVIRONMENTS 26
Halevy, R., Shalvi, S., & Verschuere, B. (2014). Being honest about dishonesty: Correlating self-
reports and actual lying. Human Communication Research, 40, 54-72.
Hautus, M.J., & Lee, A. (2006). Estimating sensitivity and bias in a yes/no task. British Journal
of Mathematical and Statistical Psychology, 59, 257-273.
Jeffreys, H. (1961). Theory of probability. Oxford, UK: Oxford University Press.
Johns, S. E. (2011). Perceived environmental risk as a predictor of teenage motherhood in a
British population. Health & Place, 17, 122-131.
Kraus, M.W., Côté, S., & Keltner, D. (2010). Social class, contextualism, and empathic
accuracy. Psychological Science, 21, 1716-1723.
Lee, M. D., & Wagenmakers, E. J. (2014). Bayesian cognitive modeling: A practical course.
Cambridge University Press.
JASP Team (2016). JASP (Version 0.8) [Computer software].
Macmillan, N. A., & Creelman, C. D. (2005). Detection theory: A user’s guide. Mahwah, NJ:
Lawrence Erlbaum.
Mittal, C., Griskevicius, V., Simpson, J. A., Sung, S., & Young, E. S. (2015). Cognitive
adaptations to stressful environments: When childhood adversity enhances adult
executive function. Journal of Personality and Social Psychology, 109, 604-621.
O'Sullivan, M., & Ekman, P. (2004). The wizards of deception detection. In A. Granhang & L.A.
Stromwall (Eds.), Deception detection in forensic contexts (pp. 269-286). Cambridge,
UK: Cambridge Press.
Pollak, S. D. (2008). Mechanisms linking early experience and the emergence of emotions.
Current Directions in Psychological Science, 17, 370–375.
R Core Team (2016). R: A language and environment for statistical computing. R Foundation for
Page 27
DECEPTION DETECTION IN HARSH ENVIRONMENTS
27
Statistical Computing, Vienna, Austria. URL: https://www.Rproject.org/.
Sherman, A. K., Minich, S. H., Langen, T. A., Skufca, J., & Wilke, A. (2016). Are college
students’ assessments of threat shaped by the dangers of their childhood
environment?. Journal of Interpersonal Violence, 31, 2006-2025.
Rouder, J. N., Speckman, P. L., Sun, D., Morey, R. D., & Iverson, G. (2009). Bayesian t tests for
accepting and rejecting the null hypothesis. Psychonomic Bulletin & Review, 16, 225-
237.
Shoda, T. M., & McConnell, A. R. (2013). Interpersonal sensitivity and self-knowledge: Those
chronic for trustworthiness are more accurate at detecting it in others. Journal of
Experimental Social Psychology, 49, 440-443.
Singmann, H., Bolker, B., Westfall, J., & Aust, F. (2016). Afex: Analysis of factorial
experiments. R package version 0.16-1. URL: https://CRAN.R-project.org/package=afex
Snodgrass, J. J., & Corwin, J., (1988). Pragmatics of measuring recognition memory:
Applications to dementia and amnesia. Journal of Experimental Psychology: General,
117, 34-50.
Sparks, A., Burleigh, T., & Barclay, P. (2016). We can see inside: Accurate prediction of
Prisoner’s Dilemma decisions in announced games following a face-to-face
interaction. Evolution and Human Behavior, 37, 210-216.
Stanislaw, H., & Todorov, N. (1999). Calculation of signal detection measures. Behavior
Research Methods, Instruments, & Computers, 31, 137-149.
Stamps, J., & Frankenhuis, W. E. (2016). Bayesian models of development. Trends in Ecology
and Evolution, 31, 260-268.
Street, C. N. H. (2015). ALIED: Humans as adaptive lie detectors. Journal of Applied Research
Page 28
DECEPTION DETECTION IN HARSH ENVIRONMENTS 28
in Memory and Cognition, 4, 335-343.
Street, C. N. H., Bischof, W. F., Vadillo, M. A., & Kingstone, A. (2016). Inferring others’ hidden
thoughts: Smart guesses in a low diagnostic world. Journal of Behavioral Decision
Making, 29, 539–549.
Street, C. N. H., & Vadillo, M. A. (2016). Can the unconscious boost lie detection
accuracy?. Current Directions in Psychological Science, 25, 246–250.
Tan, J. H., Luan, S., & Katsikopoulos, K. V. (2017). A signal-detection approach to modeling
forgiveness decisions. Evolution and Human Behavior, 38, 27-38.
ten Brinke, L., Stimson, D., & Carney, D.R. (2014). Some evidence for unconscious lie
detection. Psychological Science, 25, 1098-1105.
ten Brinke, L., Vohs, K. D., & Carney, D. R. (2016). Can ordinary people detect deception after
all?. Trends in Cognitive Sciences, 20, 579-588.
Van den Assem, M. J., Van Dolder, D., & Thaler, R. H. (2012). Split or steal? Cooperative
behavior when the stakes are large. Management Science, 58, 2-20.
Vrij, A. (2008). Detecting lies and deceit: Pitfalls and opportunities. John Wiley & Sons.
Wagenmakers, E. J. (2007). A practical solution to the pervasive problems of P
values. Psychonomic Bulletin & Review, 14, 779-804.
Watkins, I. J., & Martire, K. A. (2015). Generalized linear mixed models for deception research:
Avoiding problematic data aggregation. Psychology, Crime & Law, 21, 821-835.