Journal of Economics and Business 62 (2010) 604–626
Contents lists available at ScienceDirect
Journal of Economics and Business
Does institutional ownership affect the cost of bankborrowing?
Gordon Robertsa, Lianzeng (Edward) Yuanb
a CIBC Professor of Financial Services, York University, Schulich School of Business,4700 Keele Street, Toronto, Ontario, Canada M3J 1P3b Cornerstone Research, 599 Lexington Avenue, 43rd Floor, New York, NY 10022-7642, United States
a r t i c l e i n f o
Article history:Received 12 August 2008Received in revised form 20 April 2009Accepted 6 May 2009
Keywords:Loan pricingCorporate governance
a b s t r a c t
Institutional ownership is negatively related, both statistically andeconomically, to loan spreads. This relationship is stronger forfirms with higher degrees of information asymmetry. Institutionalinvestors play an active role in corporate governance by reduc-ing the risk levels of their portfolio companies through effectivelymonitoring management. Further, at high levels of concentration,institutional ownership has the tendency to increase the cost ofloans due to the agency cost of debt. Nonetheless, companies withinstitutional investors pay significantly lower borrowing costs thancompanies without institutional shareholders.
Institutional ownership represents an important form of corporate governance which brings closermonitoring of executive activities along with pressure to reform governance to conform with bestpractices. These effects have grown in importance with the growth of institutional shareholding from5% in 1945 to 56% in 2001 (Conference Board, 2003). At the same time, regulatory changes have madeit easier for institutions to intervene in corporate governance in a more effective manner, and organi-zations have been established for the purpose of coordinating monitoring efforts among institutionalinvestors.1 For example, in the US, the Council of Institutional Investors represents about 150 public,union and company pension funds with $3 trillion in assets. Anecdotal evidence further supports the
E-mail address: [email protected] (G. Roberts).1 New US proxy rules took effect for the 1993 proxy season. Added changes allow an unlimited number of shareholders
to coordinate activist efforts and share information about governance issues in their portfolio firms provided they brief theSEC on any substantive discussions. Prior to these changes, if a group of 10 or more owners wanted to discuss firm/mangerperformance, they had to file with the SEC before the meeting (Clay, 2002).
G. Roberts, L. Yuan / Journal of Economics and Business 62 (2010) 604–626 605
active role of institutional investors in corporate governance. For instance, the Council of InstitutionalInvestors sought to intervene as turmoil unfolded within Morgan Stanley between its CEO, PhillipPurcell, and former dissident directors.2
The present paper is the first to examine the impact of institutional ownership on bank loans. Froma theoretical perspective, the presence of institutional investors may reduce the cost of borrowingsince firms with greater proportions of institutional investors are likely to have lower agency costsdue to better monitoring.3 At the same time, however, the presence of institutional equity investorsmay exacerbate the classic risk shifting problem, prompting lenders to charge higher spreads. Thus,the impact of institutional equity ownership on loan spreads remains an empirical issue.
In the closest antecedent to our research, Bhojraj and Sengupta (2003) find that greater institu-tional ownership reduces interest costs on public bonds consistent with lower agency costs. Bankloans, however, differ from bonds in several important ways that could potentially undermine theimportance of institutional monitoring. Compared with holders of public bonds, banks can providemore effective monitoring at a lower cost due to their role as both insider lenders and delegatedmonitors (Diamond, 1984). In the former role, banks have easy access to firms’ information generatedfrom previous business relationships. The intensive monitoring in the private loan market stands insharp contrast to the lack of monitoring in the public bond market caused by the widespread free riderproblem among public lenders. Further, private lenders’ incentive to monitor is reinforced by the factthat these lenders cannot cash out their position as easily as equity or bond investors.4
Taking these special features of bank loans into account, we investigate whether the negative rela-tionship between institutional ownership and debt cost documented for public debt also holds in theloan market by employing a sample of approximately 7800 loans issued to a wide cross-section ofUS firms between 1995 and 2004. Following prior literature on loan pricing, we control for both firmcharacteristics and loan features found to have a significant impact on loan pricing. Our main resultssupport both the hypotheses outlined above: the presence of institutional equity investors initiallyreduces loan spreads supporting the view that monitoring by these investors is a useful complement tobank oversight. Such benefits to borrowers decrease as the concentration of institutional equity own-ership increases, thus documenting a “U”-shaped relationship between loan spreads and institutionalequity ownership. Further, the more concentrated the equity ownership (i.e., distributed across fewerinstitutional investors) the greater the decrease in the loan spreads to the borrowers. This finding isconsistent with an increasing amount of risk shifting as institutional ownership becomes highly con-centrated. Finally, we also show that the initial reductions in loan spreads are significantly larger forfirms with more pronounced information asymmetry consistent with the view that relatively greatergains are expected from institutional investors monitoring informationally opaque firms.
Our results are important for two reasons. First, the loan market constitutes an important labora-tory for testing the role of governance because it is the most important source of external corporatefinancing for US firms and has distinctly different features from the corporate bond market.5 Second,the overwhelming majority of previous studies focuses on the impact of institutional investors onthe equity side, exploring issues such as operational performance, firm value and major corporatedecisions. As a result, research on loans has the potential to open a new window on the impact ofinstitutional ownership on corporate governance.
The organization of this paper is as follows: Section 2 reviews relevant prior research and presentsour hypotheses. Section 3 describes the data and the methodology and Section 4 presents our empiricalfindings. Section 5 provides the robustness checks while Section 6 concludes.
2 “Purcell’s job on the line”, National Post, FP8, April 14th, 2005.3 Another possibility is that banks will simply engage in less monitoring when borrowers are subject to close monitoring by
institutional investors. Since banks use less resources, they would charge lower interest rates.4 Although the liquidity of the secondary loan market has increased considerably in recent years, it is still less liquid compared
to both the equity market and the bond market.5 According to Thomson Reuters (2008), the total proceeds from investment grade corporate debt in the US amounted to
$572.7 billion in the first three quarters of 2008; in comparison, the total proceeds from all equity issues in the same periodwas $191.2 billion. Further, the amount of private debt issued by firms has been two to three times the amount of public debton an annual basis since 1994 (Bradley & Roberts, 2003).
606 G. Roberts, L. Yuan / Journal of Economics and Business 62 (2010) 604–626
2. Prior research and hypothesis development
2.1. Literature review
A growing body of research supports the view that institutional owners monitor corporate activitiesincluding research and development, capital expenditures, anti-takeover amendments and executivecompensation. After summarizing prior research in this area, Hartzell and Starks (2003) find that firmswith more concentrated institutional ownership display greater pay for performance sensitivity andlower compensation levels. Further, institutional monitoring can improve the quality of informationprovided by management by reducing earnings manipulation through discretionary accrual choices(Chung, Firth, & Kim, 2002) while increasing the informativeness of accounting earnings (Rajgopal &Venkatachalam, 1998). These results are consistent with a role for institutions in promoting strongercorporate governance and reducing agency conflicts between shareholders and managers.
In contrast, a number of studies fail to find any connection between institutional ownership andshareholder value (Agrawal & Knoeber, 1996; Duggal & Miller, 1999; Faccio & Lasfer, 2000; Karpoff,Malatesta, & Walking, 1996). Factors that could prevent institutional investors from taking an activerole include inability to monitor (Taylor, 1990), free rider problems (Black, 1990), short-term invest-ment horizons (Coffee, 1991) and regulatory restrictions.6
Although prior research focuses on management–shareholder conflicts, debt investors can alsobenefit from better corporate governance and more credible financial reports. When managers aresubject to more effective monitoring, they will make better investment decisions and companies willbe less likely to experience financial distress and default. In addition, better financial transparency canhelp lenders collect accurate and timely information about borrowers.
On the other side of the ledger, institutional shareholders, in levered firms also have an incentive toengage in classic risk shifting actions to transfer wealth from debtholders to themselves by increasingdividend payments, engaging in share repurchases and by investing either in excessively risky projectsor by under-investing (Fama & Miller, 1972; Jensen & Meckling, 1976; Myers, 1977).7 In a theoreticalstudy, Inderst and Müller (1999) show that firms with concentrated ownership structures face higheragency costs of debt than firms with more diversified ownership. They demonstrate that as incentives,together with power to control actions, increase with ownership, shareholders will choose the riskiestproject, resulting in a higher agency cost of debt.8 This explains why the advantage of institutionalownership may reverse at very high ownership levels.
2.2. Hypotheses
Considering both positive and negative effects of institutional ownership, we present the followinghypotheses on the impact of such ownership on loan spreads.
2.2.1. Incentive hypothesisInstitutional investors monitor the management team actively improving the quality of investment
decisions and the credibility of financial reports. It follows that we should expect a negative relation-ship between institutional ownership and borrowing costs for three reasons. First, firms that are closelymonitored by institutions would be more profitable and less risky. Second, as institutions pressure
6 Jennings (2005) provides a detailed discussion.7 Parrino and Weisbach (1999) use simulation to demonstrate the investment distortions arising from this conflict of interest.
Parrino and Robert (1997) and Maxwell and Rao (2003) show that such a conflict is significant in spin-offs while Maxwell andStephens (2003) document it in the context of repurchases.
8 An alternative way for debt holders to address this conflict of interest is to write covenants restricting the behavior of theborrower (Kalay, 1982; Lehn & Poulsen, 1991; Smith & Warner, 1979); Drucker and Puri (2009) find that the use of restrictivecovenants makes it easier for loans to be resold in the secondary market, especially when borrowers and loan sellers are likelyto have private information. Nonetheless, covenants are expensive to employ (Smith and Warner, 1979) and remain subject toevasion (Jensen and Meckling, 1976). Consequently, it is unlikely that covenants can completely control agency costs associatedwith high levels of institutional ownership.
G. Roberts, L. Yuan / Journal of Economics and Business 62 (2010) 604–626 607
firms to produce better quality information, bank monitoring becomes less costly. Third, lenders wouldengage in less monitoring activity if they believed that institutional owners are effective monitors, andpass on these savings to the borrowers.9
2.2.2. Information opacity hypothesisIf the Incentive Hypothesis holds, we expect that institutional monitoring would matter more when
firms have higher degrees of information asymmetry. As it is much easier for managers in these firmsto engage in both value-reducing and earnings-manipulation activities, monitoring by institutionalinvestors adds greater value.
2.2.3. Risk shifting hypothesisInstitutional investors encourage activities that result in wealth transfer from debtholders to equi-
tyholders. A positive relationship between institutional ownership and borrowing costs would supportthis hypothesis as debtholders charge borrowers with greater institutional ownership higher ratesto cover additional risk exposure arising from the conflict of interest between shareholders anddebtholders.10 As a result, we hypothesize a non-linear, U-shaped relationship between loan spreadsand institutional ownership.
2.2.4. No effect hypothesisUnder our null hypothesis, if lenders do not believe that institutional investors will have impact
on the quality of corporate governance and financial reporting or on the conflicts of interest betweenshareholders and debtholders, they will not make any adjustments to the rates they charge regardlessof the level of institutional ownership.11
3. Data and methodology
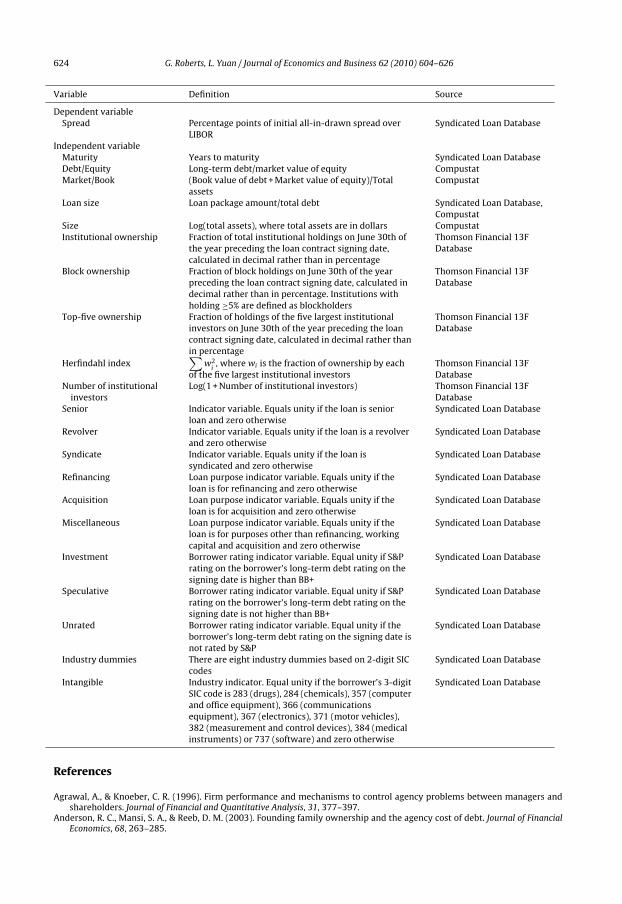
We draw on the SDC Syndicated Loan Database over the period 1995–2004 to collect loan infor-mation including the signing date, maturity, initial all-in-drawn spread, the identity of lenders andborrowers and loan size. The institutional ownership in each borrower is collected from the Thom-son Financial 13F Database. A 1978 amendment to the Securities Exchange Act of 1934 (Rule 13F)requires all institutions with portfolios over $100 million under discretionary management to reporttheir equity positions to the SEC every quarter. In their report, firms must disclose all equity stakesof 10,000 or more shares, or $200,000 or more in value. The filing parties do not include: (1) smallinstitutions; (2) large institutions holding tiny positions and (3) foreign and other exempt institu-tions. Financial information about the borrower is collected from Compustat and stock returns arefrom CRSP. All matching is done using CUSIP numbers.12
First, we collect all the loans obtained by US public firms listed on the three major stock exchanges(NYSE, NASDAQ and AMEX) from 1995 to 2004. Second, we delete those loans obtained by borrowersfrom the financial services, utilities or public administration industries based on SIC codes. Finally, forease of comparison, we delete those loans with the initial all-in-drawn spread not based on LIBOR.This leaves us with 12,399 observations.13
9 Distinguishing among these reasons lies beyond the scope of this paper.10 Institutional owners could also participate in the loan syndication. In this case, institutional owners are likely to engage in
risk shifting activities only when they hold sufficiently concentrated positions so that the benefits from risk shifting outweighthe costs of relationship and reputation damage.
11 This may occur for another reason. If lenders are engaging in effective and independent monitoring, the incremental mon-itoring from institutional investors might not have any impact on the cost of loans. Consequently, there will be no relationshipbetween the two variables.
12 Another popular loan database is Dealscan, however, it does not contain borrowers’ CUSIPs making it less suitable for thecurrent research.
13 Before the last step, there are altogether 12,578 observations, among which the three most frequently used quoting basesare LIBOR, Prime Rate and ABR (Alternative Borrowing Rate). Altogether, 91 observations are based on Prime Rate and 55observations are based on ABR. Consequently, the last procedure does not substantially reduce the size of our final sample.
608 G. Roberts, L. Yuan / Journal of Economics and Business 62 (2010) 604–626
We next turn to the Thomson Financial 13F Database and Compustat to obtain institutional owner-ship and firm-level financial data. Following Gompers and Metrick (2001), we use the information oninstitutional ownership reported on June 30 of the year preceding the loan contract signing date. Weemploy the most recent financial data publicly available before the signing date. Further, we deletethose borrowers with reported institutional ownership greater than 100% as reflecting data errors.The application of these filters leaves us with 7820 observations involving 2006 borrowers.
Following the loan pricing literature, we employ the spread over LIBOR to measure the cost ofloans. This is the rate (including fees) charged to the borrower from the closing date until the firstadjustment date. Drawing on prior studies (Bhojraj & Sengupta, 2003; Cornett, Marcus, Saunders, &Tehranian, 2003; Parrino, Sias, & Starks, 2003), we choose several measures for institutional ownership.First, we calculate the total fraction of ownership held by all institutional investors. Second, in orderto investigate the impact of concentrated ownership, we focus our attention on major institutionalinvestors. For this purpose we calculate the ownership held by institutional block investors (thoseholding more than 5%), by the five/ten largest institutional investors; in addition, we calculate theHerfindahl index using the five/ten largest institutional investors to explicitly examine the impact ofownership concentration on borrowing cost.14 We also use the total number of institutional investorsas another proxy for institutional ownership.
In addition, to investigate whether the impact of institutional ownership is stronger when firmshave higher degrees of information asymmetry, we employ the intangible dummy designed bySougiannis, Amir, and Lev (2003) using 3-digit SIC codes to identify seven industries with high holdingsof intangible assets. Firms in these industries are perceived as having higher degrees of informationasymmetry.
Later, in multivariate regression analyses, we also include other variables that are shown to havesignificant impacts on borrowing costs in prior studies. These control variables fall into two categories:firm characteristics and loan features. Firm characteristics include leverage, Market/Book ratio, long-term debt rating dummies, size and industry dummies based on 2-digit SIC codes. Merton (1974),Hubbard, Kuttner, and Palia (2002) and Johnson (2003) confirm the significance of leverage. Debtrating is the proxy for firm risk. We introduce firm size to capture any residual risk effect. Generallyspeaking, larger firms have lower risk and are expected to face lower borrowing costs.
Loan features include maturity, loan size, a revolver dummy, senior dummy, syndicate dummy andloan purpose dummies. Prior studies have reached mixed conclusions on the relationship between loanpricing and loan maturity. Angbazo, Mei, and Saunders (1998) do not find any relationship betweenyield spread and maturity; Strahan (1999) documents a negative relationship while Helwege andTurner (1999) find a positive relationship. Gottesman and Roberts (2004) find that both positive andnegative relationships can exist at the same time. We follow Dennis, Nandy, and Sharpe (2000) anduse loan size relative to total debt to measure the lender–borrower relationship: the larger the size,the stronger the relationship. Diamond (1989) and Rajan (1992) have opposite predictions on howthe lender–borrower relationship impacts borrowing costs. Preece and Mullineaux (1996) suggestthat revolvers are priced differently from term loans, and Esty and Benjamin (2001) highlights thedominant features of syndicated loans.15
We begin by documenting the summary statistics of selected key variables as well as their correla-tion matrix. As shown in Panel A of Table 1, the initial all-in-drawn spread over LIBOR averages 1.703percentage points (170.3 basis points). In this sample, the mean of maturity is 3.670 years; the meanof Market/Book ratio is 1.701 and the average loan size is 0.38 of total borrower debt. These results arequalitatively similar to those in Coleman, Esho, and Sharpe (2004). On average, 145.59 institutionalinvestors hold stock in each firm in our sample, among which 1.07 are blockholders, which confirmsthe diversified nature of institutional ownership in the United States. Institutional ownership averages
14 The index is defined as∑
w2i, where wi is the fraction of ownership by each of the five investors. A high index value
indicates a highly concentrated ownership structure and a low index value implies a more diversified ownership structure.Since our focus is on institutional shareholders, we consider only institutional (and not individual) blockholders.
15 The definitions of the key variables can be found in the appendix. Since the secured status of the loans is not available inthe SDC Database, it is not included as a control variable in the regression.
The sample consists 7820 loans collected from SDC Syndicated Loan Database over 1995–2004 period. Spread is defined as the percentage points of initial all-in-drawn spread over LIBOR.Institutional Ownership is the fraction of total institutional holdings on June 30th of the year preceding the loan contract signing date. The definition of these variables can be found inthe appendix.
* Significance at 10% level.** Significance at 5% level.
*** Significance at 1% level.
610 G. Roberts, L. Yuan / Journal of Economics and Business 62 (2010) 604–626
53.7% of the outstanding shares in each firm; blockholders hold 9.2% on average and the top-five insti-tutional investors own 25% of each firm on average. These results are comparable to those in Bhojrajand Sengupta (2003). Panel B shows that the correlations among variables are relatively low exceptthose between various measures of institutional ownership. For this reason, in later regressions, weonly use one measure in each model specification.
4. Empirical results
4.1. Preliminary analysis
Before proceeding to the formal regression analysis, we divide the entire sample into deciles basedon institutional ownership to obtain a general idea of the relationship between institutional ownershipand the spread. We then compare mean spreads between adjacent deciles.
It is clear from Panel A in Table 2 that from Decile 1 (lowest institutional ownership) up to Decile6, without exception, firms in deciles with lower institutional ownership pay higher spreads. Further,the t-tests on the mean differences between adjacent deciles in Panel B reveal that these differencesare statistically significant. In contrast, for Deciles 9 and 10 (highest institutional ownership), therelationship between institutional ownership and the spread becomes positive, that is, firms withhigher institutional ownership pay significantly higher spreads. For those deciles in between (Deciles6–8), there is no clear pattern to the relationship between institutional ownership and the spread.Turning to economic significance, since the mean loan package amount in the sample is $514 million,observed mean differences in spreads translate into economically significant dollar amounts. Forexample, on average, firms in Decile 1 pay $5 million more in interest payments annually thando firms in Decile 6. Results from this unconditional univariate analysis indicate that there maybe a non-linear relationship between institutional ownership and the spread: when institutional
Table 2Deciles formed based on institutional ownership.
Decile N Mean spread
Panel A: Mean spread for decilesLowest Institutional Ownership 1 794 2.389
The whole sample is divided into deciles based on the fraction of institutional ownership. Panel A reports the mean of spreadfor each decile. Panel B reports the t-test results for the difference in the mean spread between two adjacent deciles.
* Significance at 10% level.**Significance at 5% level.
*** Significance at 1% level.
G. Roberts, L. Yuan / Journal of Economics and Business 62 (2010) 604–626 611
Fig. 1. Plot of spread against institutional ownership.
ownership is relatively low, it is negatively related to the spread; when institutional ownership is veryhigh, it becomes positively related to the spread. The relationship between institutional ownershipand the spread is not clear in the middle ground.
While this analysis is helpful in determining the relationship between institutional ownershipand loan spreads, it does not constitute definitive evidence that higher institutional ownership isassociated with lower spreads. The pattern displayed may be driven by some other underlying factors.For example, firm size could cause a negative relationship between institutional ownership and thespread. Larger firms typically have lower risk levels and higher institutional ownership. In order tofilter out possible contaminating factors, in the next section, we employ a standard loan pricing modelto control all the other variables that have been found to have a significant impact on loan pricing.
4.2. Regression results
4.2.1. Institutional ownershipWe adopt the following standard loan pricing model to examine the relationship between institu-
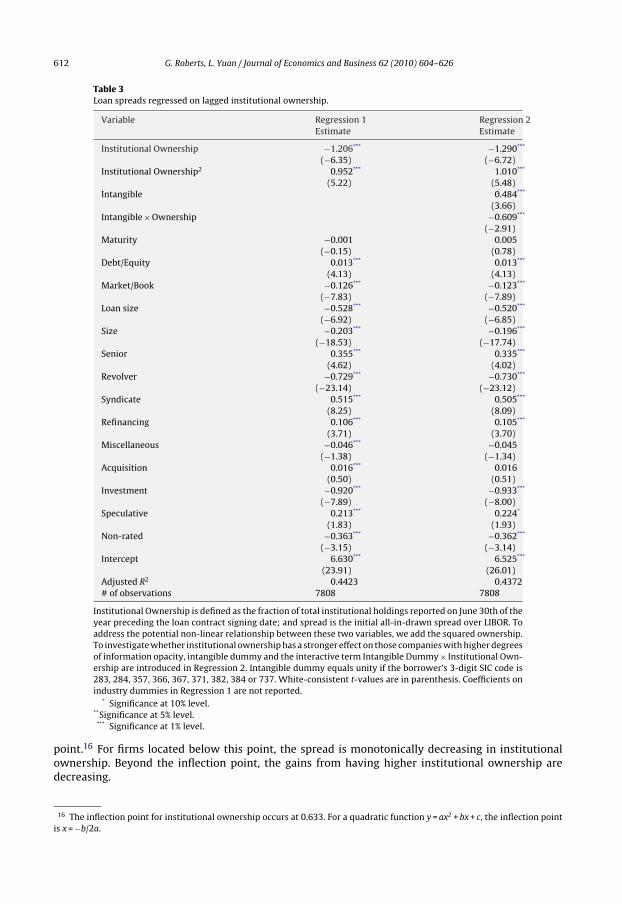
To test for a possible non-linear relationship between institutional ownership and the spread pre-dicted by our Incentive and Risk Shifting hypotheses and indicated by the preliminary bivariate analysis,we add a squared term as an additional independent variable in the regression. Regression 1 of Table 3examines the dependence of spreads on the fraction of shares owned by all institutional investors.We compute White’s (1980) standard errors to account for heteroskedasticity. The coefficient on theinstitutional ownership term is negative (−1.206) and the coefficient on the squared term is positive(0.952), and both are significant at the 1% level. Moreover, the impact of institutional ownership iseconomically significant. The regression results imply that a one standard deviation increase in insti-tutional ownership would reduce the spread by 23 basis points, a 13.5% decrease from its mean. InFig. 1 we plot the relationship between institutional ownership and spread based on the results fromRegression 1. It is clear that the impact of institutional ownership is not linear over its entire range.Since the other factors that impact loan pricing are controlled in the regression analysis, the multivari-ate results on the relationship between institutional ownership and the spread confirm the univariateresults found in previous bivariate analysis. There is strong evidence that the non-linear relationshipbetween these two variables is not simply an artifact.
Overall, firms with greater institutional ownership pay lower spreads. This lends support to theIncentive Hypothesis and suggests that institutional investors reduce firm risk by effectively monitoringmanagement. This effect is stronger when the fraction of institutional ownership is below an inflection
612 G. Roberts, L. Yuan / Journal of Economics and Business 62 (2010) 604–626
Table 3Loan spreads regressed on lagged institutional ownership.
(23.91) (26.01)Adjusted R2 0.4423 0.4372# of observations 7808 7808
Institutional Ownership is defined as the fraction of total institutional holdings reported on June 30th of theyear preceding the loan contract signing date; and spread is the initial all-in-drawn spread over LIBOR. Toaddress the potential non-linear relationship between these two variables, we add the squared ownership.To investigate whether institutional ownership has a stronger effect on those companies with higher degreesof information opacity, intangible dummy and the interactive term Intangible Dummy × Institutional Own-ership are introduced in Regression 2. Intangible dummy equals unity if the borrower’s 3-digit SIC code is283, 284, 357, 366, 367, 371, 382, 384 or 737. White-consistent t-values are in parenthesis. Coefficients onindustry dummies in Regression 1 are not reported.
* Significance at 10% level.**Significance at 5% level.
*** Significance at 1% level.
point.16 For firms located below this point, the spread is monotonically decreasing in institutionalownership. Beyond the inflection point, the gains from having higher institutional ownership aredecreasing.
16 The inflection point for institutional ownership occurs at 0.633. For a quadratic function y = ax2 + bx + c, the inflection pointis x = −b/2a.
G. Roberts, L. Yuan / Journal of Economics and Business 62 (2010) 604–626 613
We now turn to the other explanatory variables in Table 3 representing controls for borrower char-acteristics and loan features. The coefficient on maturity is insignificant. But this result might be biasedsince we do not control for the simultaneity among loan contract terms pointed out by Dennis et al.(2000). We address this issue in our robustness checks below. Further, firms with high Debt/Equityratios are charged a higher rate, and firms with high Market/Book ratios as well as larger firms arecharged a lower rate. In addition, the coefficient on our relationship proxy, relative loan size, is sig-nificantly negative, confirming that as the lender–borrower relationship gets stronger, borrowers canobtain loans at lower costs. Further, as indicated by the coefficients on the rating dummies, firmswith investment grade credit ratings borrow at significantly lower rates while firms with specula-tive grade ratings are charged significantly more. Finally, due to their shorter maturities and lowerdegrees of information asymmetry revolvers have lower spreads; syndicated loans have higher spreadsbecause they are more complicated than non-syndicated loans in various aspects (Esty & Benjamin,2001).17
To investigate whether institutional ownership has a stronger effect on those companies withhigher degrees of information opacity (Hypothesis 2), industry dummies are replaced with the intan-gible dummy described above; in addition, the interactive term, Intangible Dummy × InstitutionalOwnership is introduced to explicitly test the Information Opacity Hypothesis.
The results are presented in Regression 2 of Table 3. The coefficient on intangible dummy is sig-nificantly positive at the 1% level, confirming that firms in industries with high holdings of intangibleassets are charged higher rates. In addition, the coefficient on the interaction term is significantlynegative at the 1% level. This is consistent with the Information Opacity Hypothesis, which predicts thatthe effect of institutional ownership is stronger for those firms that are more difficult to value andmonitor.
4.2.2. Blockholders and top-five institutional investorsOur above analysis records a non-linear relationship between institutional ownership and loan
spreads. As explained previously, the “U”-shape can be traced to the agency cost of debt arising fromthe conflict of interest between equityholders and debtholders which, beyond a critical level of insti-tutional ownership, offsets its monitoring advantage. In this section, we modify our regression modelto investigate the effects of more refined measures of institutional ownership: institutional block-holders, the five largest institutional investors, and a Herfindahl index measuring concentration ofownership.
The results in Table 4 indicate that, a similar non-linear pattern holds for both block ownership(Regression 1) and the ownership held by the five largest institutional investors (Regression 2). Aone standard deviation increase in block ownership lowers the spread by 0.149 percentage points,for an 8.73% decrease from its mean. A one standard deviation increase in the ownership of top-fiveinstitutional investors reduces the spread by 0.087 percentage points, or a 5.1% decrease from its mean.
The squared terms are highly significant in both regressions indicating that the U-shaped relation-ship identified earlier is robust. Based on the results from Regression 1 and Regression 2, we plot therelationship between ownership by these two groups of major institutional investors and the spreadin Figs. 2 and 3. These figures show that, not only does the “U”-shaped relationship hold for these majorinstitutional investors, but also that borrowers can lose from having high institutional ownership by
17 Generally, the renewal of revolvers is conditional on the borrowers having satisfied certain conditions imposed by thelender(s). Since only a very small percent of the observations (275 out of 7820) are non-syndicated loans, the coefficientestimates on syndicated loans may not be reliable.
614 G. Roberts, L. Yuan / Journal of Economics and Business 62 (2010) 604–626
Table 4Loan spreads regressed on ownership by major institutions.
Regression 1 examines the relationship between the ownership of blockholders and the spread. Regression 2 examines therelationship between the ownership of five largest institutional investors and the spread. Regression 3 examines the relationshipbetween the ownership concentration of the five largest institutional investors and the spread. We use Herfindahl index tomeasure the ownership concentration, where Herfindahl index =
∑w2
i, where wi is the fraction of ownership by each of
the five largest institutional investors. In Regression 4, the interaction term [log(Debt/Equity) × Ownership] is introduced toexamine whether the conflict of interest effect will be stronger for firms with higher leverage ratios. White-consistent t-valuesare in parenthesis. Loan purpose dummies and industry dummies are included in all three regressions and their coefficients arenot reported.
* Significance at 10% level.** Significance at 5% level.
*** Significance at 1% level.
G. Roberts, L. Yuan / Journal of Economics and Business 62 (2010) 604–626 615
Fig. 2. Plot of spread against block ownership.
Fig. 3. Plot of spread against top-five ownership.
paying higher spreads on a net basis.18 This is consistent with our prior prediction that the Risk ShiftingEffect associated with major institutional investors will become more pronounced at high ownershiplevels.
To investigate the effect of concentrated ownership further, in Regression 3 we introduce theHerfindahl index of the five largest institutional investors to measure ownership concentration. Thesignificantly positive coefficient on concentration implies that lenders will charge higher spreads whenborrowers have a highly concentrated ownership structure, ceteris paribus. A one standard deviationincrease in concentration raises the spread by 25.8 basis points, equivalent to 15.1% jump from itsmean. In unreported tests, we use the Herfindahl index of the ten largest institutional investors andobtain similar results. Once again, this constitutes reinforcing evidence supporting the hypothesizedU-shaped relationship between ownership concentration and the cost of debt.
In summary, our results here using alternative measures of the concentration of ownership by majorinstitutional investors support the Risk Shifting Hypothesis. Panel B of Table 1 reveals that total institu-tional ownership is positively correlated with the ownership of major institutional investors, includingblockholders and the largest five institutions, as well as with ownership concentration. It follows thatthe bargaining power of major institutions in the management decision process increases with insti-tutional ownership, resulting in a higher propensity for risk shifting producing higher agency costs ofdebt. Facing an increased probability that debtholders’ interest will be hurt through wealth transfer-ring activities, lenders charge higher spreads to cover the additional risk exposure. This effect partly(in some instances, completely) negates the Incentive Effect, resulting in the “U”-shaped relationshipbetween institutional ownership and the spread.
18 The spread will increase on a net basis when block ownership is greater than 0.531, and 99.35% of the observations liebelow this point; for top-five institutional investors, an increase does not occur until ownership exceeds 0.431, and 94.3% ofthe observations lie below this point. We conclude that, although it is possible that spread will increase on a net basis, it is notlikely.
616 G. Roberts, L. Yuan / Journal of Economics and Business 62 (2010) 604–626
In addition, our interpretation that the “U”-shaped relationship arises because the favorable effectof monitoring by institutional investors is partly negated by the adverse effect arising from the agencycosts of debt implies that the risk shifting effect will be stronger for firms with higher leverage ratios.Other things equal, higher leverage ratios are associated with greater risk of financial distress which,in turn, suggests more intense conflicts of interest between shareholders and debtholders and higherprobability for shareholders to engage in risk-shifting activities. To test this conjecture, we introducean interaction term [log(Debt/Equity) × Institutional Ownership]. As can be seen from Regression 4in Table 4, the coefficient on the interaction term is significantly positive. This indicates that whenfirms have higher leverage ratios, the net gains from institutional ownership will be lower, a findingconsistent with our Risk Shifting Hypothesis.
4.2.3. Number of institutional investorsIn this section, we replace institutional ownership with the number of institutional investors,
another popular measure in prior studies. We use log(1 + number of institutional investors) to addressthe possible non-linear relationship between the number of institutional investors and the spread.Similarly, in order to investigate whether the impact of institutional ownership is stronger for firmswith higher degrees of information opacity, we employ both an intangible dummy and an interactionterm (log(1 + Number of institutional investors) × Intangible Dummy) in Regression 2 of Table 5.
In both regressions, the coefficient estimate on the number of institutional investors is significantlynegative consistent with the Incentive Effect Hypothesis. Based on the results in Regression 1, a onestandard deviation increase in the log transformation of the total number of institutional investorsresults in a 27.7 basis point decrease in the spread, or a 16.29% decrease from its mean. In addition, thesignificantly negative coefficient estimate on the interactive term in Regression 2 further confirms astronger impact of institutional monitoring on those firms with higher degrees of information opacity,as predicted by the Information Opacity Hypothesis. We also examine the impact of the number ofinstitutional block investors, and the results are similar to those reported in Table 5.
5. Robustness checks
5.1. Sub-sample regression results
The main theme of this paper is that institutional owners play an active role in corporate gover-nance and engage in monitoring which leads to a reduction in the cost of loans. In contrast, recentresearch has found that weaker governance in the form of anti-takeover provisions that entrenchmanagement can be favorable for debtholders. Klock, Mansi and Maxwell (2005) report that greaterpower of management to defend against takeover attempts is associated with lower costs of publicbonds. The authors argue that weaker governance may result in a lower possibility of wealth transferfrom debtholders to shareholders through takeover. The resulting lower agency cost of debt leads tolower borrowings cost on the public debt market. Chava, Dierker and Livdan (2005) report similarresults for private loans.
In order to examine whether the effect of institutional ownership remains significant after con-trolling for the quality of a firm’s governance rules, we introduce the corporate governance indexcompiled by Gompers, Ishii and Metrick (2003) (GIM index hereafter) and employed by Klock et al.(2005) and Chava et al. (2005). Using data collected by the Investor Responsibility Research Cen-ter (IRRC), Gompers et al. (2003) construct the index by incorporating 24 anti-takeover provisionscovering five categories of tactics for defeating hostile takeover attempts – delaying hostile bidders,voting rights, director/officer protection, other takeover defenses and state laws.19 Higher index scoresindicate stronger managerial power and a lower probability for takeover.
We match our original sample with the GIM index to obtain 3360 observations. In the process wefollow Gompers et al. (2003) and Chava et al. (2005) and use the previously available index value untila new update becomes available for those years in between. The IRRC data are only available for the
19 This index does not include ownership structure variables.
G. Roberts, L. Yuan / Journal of Economics and Business 62 (2010) 604–626 617
Table 5Loan spreads regressed on number of institutional investors.
(14.82) (15.29)Adjusted R2 0.4509 0.4467# of observations 7820 7820
Number of institutional investors is defined as log(1 + Number of institutional investors) as on June30th of the year preceding the loan contract signing date; and spread is the initial all-in-drawn spreadover LIBOR. Regression 1 examines the relationship between the number of institutional investors andthe spread. To investigate whether institutional ownership has a stronger effect on those companieswith higher degrees of information opacity, intangible dummy and the interactive term IntangibleDummy × Number are introduced in Regression 2. White-consistent t-values are in parenthesis. Coef-ficients on industry dummies in Regression 1 are not reported.*Significance at 10% level.
** Significance at 5% level.*** Significance at 1% level.
years 1990, 1993, 1995, 1998, 2000, 2002 and 2004. However, as pointed out in Gompers et al. (2003),the index is extremely persistent and there is no reason to suspect that any systematic bias may ariseby assuming constant values between publication dates.20
Consistent with Chava et al. (2005) and Klock et al. (2005), in Table 6, the GIM index is signifi-cantly negatively related with the spread, confirming that lenders are concerned about the possibility
20 The mean (absolute) change in the index for individual firms is 0.60 between publication years while the median change iszero (Gompers et al., 2003).
618 G. Roberts, L. Yuan / Journal of Economics and Business 62 (2010) 604–626
Table 6Loan spreads regressed on lagged institutional ownership control-ling for GIM index.
Variable Estimate
Institutional Ownership −1.183***
(−3.09)Institutional Ownership2 0.737**
(2.3)Governance index −0.015***
(−2.73)Maturity −0.004
(−0.4)Debt/Equity 0.011***
(2.83)Market/Book −0.140***
(−8.59)Loan size −0.410***
(−3.85)Size −0.166***
(−10.3)Senior 0.283***
(4.22)Revolver −0.809***
(−14.1)Syndicate 0.312**
(2.53)Refinancing 0.151***
(3.65)Miscellaneous −0.053
(−−1.14)Acquisition 0.046
(0.98)Investment −0.868***
(−5.17)Speculative 0.248
(1.46)Non-rated −0.349**
(−2.08)Intercept 6.107***
(13.91)Adjusted R2 0.4734# of observations 3359
Gompers et al. (2003) corporate governance index is compiledbased on 24 components and is taken from Metrick’s personalwebsite. White-consistent t-values are in parenthesis. Coefficientson industry dummies are not reported.*Significance at 10% level.
** Significance at 5% level.*** Significance at 1% level.
of takeover offering lower spreads as managerial power increases and the probability of takeoverdecreases. The table also shows that the coefficient estimates on both institutional ownership andthe squared term are similar to previous results. We conclude that our main results still hold aftercontrolling for the GIM index.
5.2. Simultaneity among loan contract terms
Dennis et al. (2000) highlight the interrelations among different loan contract terms and showthat ignoring such simultaneity can lead to unreliable results. In this section we adopt the followingsimultaneous equation framework in which both loan pricing and loan maturity are endogenously
G. Roberts, L. Yuan / Journal of Economics and Business 62 (2010) 604–626 619
To identify the system of equations, we add Tax (measured by Tax/Asset) in the maturity regression.As argued in Dennis et al. (2000), the higher the tax advantages of debt, the more frequently firmswill rebalance their capital structures, resulting in a shorter optimal maturity. Table 7 displays theestimates of our simultaneous equations. Similar to the OLS results, the coefficients on institutionalownership and the squared term remain significantly negative and positive, respectively.21
5.3. Endogeneity of institutional ownership
In our analysis to this point, we treat institutional ownership as an exogenous variable. How-ever, Demsetz and Lehn (1985) argue that ownership structure is endogenously determined by firmcharacteristics. For example, for liquidity and transaction cost considerations, institutions tend tohold large-cap stocks with thick markets; in addition, stocks’ historical return patterns might alsohave a bearing on institutions’ investment decisions. Duggal and Miller (1999) and Clay (2002)make similar arguments. This raises the question whether the previously discovered relationshipbetween institutional ownership and the spread could be spurious if both are determined by firm-level and stock-level characteristics. To address this concern, we conduct a two-stage analysis. Inthe first stage, we employ a set of explanatory variables drawn from prior studies to estimate insti-tutional ownership; in the second stage, we estimate the spread using the predicted institutionalownership from the first stage rather than the observed institutional ownership.
We estimate institutional ownership in the first stage with the following model specification:
where Total Return is the cumulative return of the stock in the previous 12 months, excluding the filingmonth of 13F (June); Sigma is the standard deviation of monthly return in the previous 12 months,excluding the filing month of 13F (June); Turnover is the trading volume divided by shares outstanding,measured for the month prior to the beginning of the filing quarter (i.e., turnover in March, if Marchdata is missing, then February data are used instead).
Table 8 details the summary statistics and the correlations among the variables used to estimateinstitutional ownership. Table 9 presents the results from the two-stage regression and shows thatinstitutional ownership is, to some degree, endogenously determined. In particular, institutions tendto invest in larger firms with higher Market/Book ratios, higher total returns, lower volatility and
21 It is worth noting that some of the changes are dramatic. For example, after controlling for simultaneity, in the estimationof spread, the coefficient on maturity becomes significantly positive, confirming the Tradeoff Hypothesis in Gottesman andRoberts (2004), which predicts a positive relationship between spread and maturity. Meanwhile, spread has a negative impacton maturity, which is significant at the 10% level, supporting the Quality Credit Hypothesis in Gottesman and Roberts (2004).They find a positive relationship using a matched pairs approach and a negative relationship using a regression approach. Theconflicting results can also be understood in a supply–demand framework. On the supply side, lenders ask for higher spreads onlonger maturity loans to compensate for additional risk bearing; on the demand side, borrowers will choose shorter maturityloans facing a higher spread environment as they want to opt out of the contract when spreads get lower in the future.
620 G. Roberts, L. Yuan / Journal of Economics and Business 62 (2010) 604–626
Table 7Loan spreads regressed on lagged institutional ownership controlling for simultaneitybetween spread and maturity.
Variable Spread MaturityEstimate Estimate
Institutional Ownership −2.138***
(−3.03)Institutional Ownership2 1.629***
(2.55)Spread −0.524*
(−1.71)Maturity 2.200***
(3.73)Debt/Equity 0.012** 0.006
(2.28) (1.25)Market/Book −0.068 −0.111***
(1.07) (−3.59)Loan size −7.010*** 2.851***
(−4.01) (16.54)Size −0.343*** −0.035
(−6.29) (−0.02)Senior 0.752 −0.008
(0.87) (−0.02)Revolver 1.438** −1.354***
(2.44) (−5.98)Syndicate 0.027 0.486***
(0.10) (2.65)Refinancing −0.590*** 0.359***
(−2.74) (6.17)Miscellaneous 0.089 −0.083
(0.55) (−1.07)Acquisition −0.586*** 0.283***
(−2.79) (4.56)Investment 0.017 −0.868***
(0.04) (−2.70)Speculative −1.198** 0.724***
(−2.34) (4.20)Non-rated 0.276 −0.471**
(0.72) (−2.37)Tax −4.903***
(−2.83)Intercept 3.918** 4.442**
(2.38) (2.10)System weighted R2 0.3706# of observations 7807
3SLS technique is used to control for the simultaneity between the spread and maturity.To properly identify the system of equations, a new variable, Tax, is introduced in the sec-ond equation, where Tax is defined as (Tax/Assets). In parenthesis are t-values. Industrydummies are included in both regressions and their coefficients are not reported.
* Significance at 10% level.** Significance at 5% level.
*** Significance at 1% level.
higher turnover. All these are consistent with the findings from prior studies. When we substitutethe predicted institutional ownership into the second stage regression, the “U”-shaped relationshipbetween institutional ownership and the spread previously found using OLS technique continues tohold. This shows that controlling for the potential endogeneity of institutional ownership does notchange our main results.
G. Roberts, L. Yuan / Journal of Economics and Business 62 (2010) 604–626 621
Table 8Basic statistics for main variables used to estimate institutional ownership.
Panel A shows the descriptive statistics. Panel B shows the correlation between these variables. Market/Book is defined as [(bookvalue of debt + market value of equity)/total assets]. Size is defined as log(total assets), where total assets are in dollars. To makesure that the financial information is available on the 13F filing day, these two variables are calculated using the most recentfinancial information that is publicly available. Total return is the cumulative monthly stock return over the past 12-month,ending one-month before the 13F report month (June of each year). Sigma is the standard deviation of monthly returns overthe past 12 months, ending one-month before the 13F report month (June of each year). Turnover is the trading volume dividedby shares outstanding, measured for the month prior to the beginning of the reporting quarter (i.e., turnover in March, if Marchdata is missing, then February data is used instead).
* Significance at 10% level.** Significance at 5% level.
*** Significance at 1% level.
5.4. Other robustness checks
In this section, we briefly summarize five further robustness checks conducted but not includedhere to preserve space.22 These checks address independence among observations, possible contem-poraneous correlation among estimation errors, influential observations, the stability of our findingsfor different time periods and how the presence of a bond rating affects spreads.
Turning first to the issue of independence assumed in our previous OLS analysis, this property mayfail to hold if there are several tranches in a deal, or a firm borrows repeatedly causing all the firm-level variables, including institutional ownership to enter the regression more than once. In order tomaintain independence across observations, we include only the main tranche of each deal in theanalysis. To further reduce the impact of correlation between observations, in a second robustnesscheck, we include only the main tranche of the first loan package if the borrower has multiple dealsover the sample period. The non-linear relationship between institutional ownership and the spreadcontinues to hold.
Next, to address possible contemporaneous correlation among estimation errors, we employ theseemingly unrelated regression (SUR) framework. In particular, for each month from 1995 to 2004, wedivide our loan sample into quartiles based on the size of the borrower, then pool across all months torun our regression for each quartile using SUR. In this framework, both the dependent variable and allthe independent variables take on their monthly averages for each quartile. We also introduce laggedspread to address any possible time trend. We find that our main results still hold after taking intoconsideration the lack of independence among observations.
Whether our previous results are driven by extreme observations is the focus of our next robustnesscheck. We rerun the regression on all tranches after deleting those influential observations based on
22 Tables showing these results are available from the authors upon request.
622 G. Roberts, L. Yuan / Journal of Economics and Business 62 (2010) 604–626
Table 9Two-stage regressions.
Variable First stage Second stageEstimate Estimate
Predicted Institutional Ownership −5.362***
(−3.25)Predicted Institutional Ownership2 3.649**
(2.56)Maturity 0.0003
(0.05)Debt/Equity 0.038***
(5.23)Market/Book 0.004** −0.116***
(2.37) (−6.98)Loan size −0.451***
(−5.79)Size 0.043*** −0.143***
(29.85) (−8.35)Investment −0.935***
(−7.77)Speculative 0.201*
(1.67)Non-rated −0.411***
(−3.45)Total return 0.017***
(3.73)Sigma −0.656***
(−17.51)Turnover 0.463***
(16.49)Intercept −0.321*** 6.816***
(−10.13) (14.86)Adjusted R2 0.2305 0.4683# of observations 8108 7226
This table shows the coefficients from the two-stage regression, which is employed to control for theendogeneity of institutional ownership. In the first stage, institutional ownership is estimated usinga set of lagged explanatory variables. In the second stage, the predicted institutional ownership,instead of the observed institutional ownership, is used to estimate the spread. White-consistentt-values are in parenthesis. In the second regression the coefficients on senior dummy, revolverdummy, syndicate dummy, loan purpose dummies and industry dummies are not reported.
* Significance at 10% level.** Significance at 5% level.
*** Significance at 1% level.
Cook’s (1979) D measure.23 While there is a significant increase in the adjusted R2 as a result of thedeletion of those influential observations, the coefficients on institutional ownership, the squaredterm, intangible dummy and the interactive term remain qualitatively unchanged establishing thatour findings are robust to extreme observations.
In addition, we wish to examine whether the “U”-shaped relationship between institutional own-ership and the spread holds for different periods. For this purpose, we conduct three exercises. First,we divide the sample into two equal periods (1995–1999 and 2000–2004) and run the Table 3 regres-sion on these two periods separately. Second, we run the regression on the whole sample introducinga Year Fixed Effect and repeat the exercise after deleting influential observations. Finally, we useFama–Macbeth framework to estimate the regression on every quarter of each year, and then conducta t-test on the mean of coefficient estimates. In all these versions, institutional ownership, the squaredterm and the interaction term attain significance with signs consistent with our original regressions.
23 The cut-off point used here is (4/number of observations). If the Cook’s D measure for an observation is larger than thecut-off point then it is deleted from the regression.
G. Roberts, L. Yuan / Journal of Economics and Business 62 (2010) 604–626 623
Finally, we separate rated firms from non-rated firms, and run the main regression on these sub-samples. The motivation for this exercise arises from the unexpected negative sign for the non-rateddummy in the original regression (Table 3). The coefficient estimates on variables related to institu-tional ownership and other major control variables across these two sub-samples are consistent withthose reported earlier.
6. Conclusions
Equity ownership by institutional investors has increased significantly during the past severaldecades motivating research on whether an increased role for institutional investors in corporategovernance creates value for shareholders. Because this body of work has produced mixed results, itis useful to assess the role of institutional investors from a new perspective: that of corporate debt.In this vein, Bhojraj and Sengupta (2003) show that equity ownership by institutional investors canlower the cost of public bonds. Their focus on public bonds leaves open whether a similar result holdsfor private loans. Because private lenders have “insider information” making them more effectivemonitors, institutional monitoring could well be redundant.
The present study examines the influence of institutional ownership on the cost of private loansusing loans collected from the SDC Syndicated Loan Database between 1995 and 2004. Our analysisindicates that institutional ownership reduces the cost of bank borrowing. Specifically, a one standarddeviation increase in institutional ownership lowers the loan spread over LIBOR by 23 basis points, a13.5% reduction from its mean. Further, the impact of institutional ownership is stronger for borrowerswith higher degrees of information asymmetry. Both findings suggest an important role for institu-tional investors in reducing firms’ risk through active monitoring of managerial activities (IncentiveEffect) even in the presence of bank monitoring.
The impact on borrowing costs, however, is not uniform over the whole range of institutionalownership. When the level of ownership is below an inflection point, the spread is monotonicallydecreasing in institutional ownership; beyond the inflection point, the gains begin to shrink but firmswith institutional investors continue to pay significantly lower spreads than firms without. We presentevidence that this “U”-shaped pattern occurs because the Incentive Effect can be partly negated byanother force associated with institutional investors: the Risk Shifting Effect, under which the agencycost of debt becomes higher with highly concentrated ownership resulting in relatively higher cost ofborrowing.
Taken as a whole, our analysis establishes the importance of institutional monitoring in privateloan markets, contributing to the literature on the relationship between ownership structure and thecost of borrowing (Anderson, Mansi, & Reeb, 2003; Bhojraj & Sengupta, 2003). It also provides directevidence on the active role played by institutional shareholders in corporate governance, adding toan emerging body of work that investigates the significant impact of corporate governance on debt.
Acknowledgements
The authors received valuable comments from the referee as well as from Franklin Allen, Don-ald Mullineaux, Jay Ritter, Paul Schure, Henri Servaes, and John Smithin. They also benefited fromcomments from audiences at the University of Arizona, York University, Ryerson University, the 2005Northern Finance Association and 2006 Eastern Finance Association Meetings. Financial support forthis research came from the Social Sciences and Humanities Research Council of Canada and theNational Research Program on Financial Services and Public Policy.
Appendix A.
Variable definition and data sources.
624 G. Roberts, L. Yuan / Journal of Economics and Business 62 (2010) 604–626
Variable Definition Source
Dependent variableSpread Percentage points of initial all-in-drawn spread over
LIBORSyndicated Loan Database
Independent variableMaturity Years to maturity Syndicated Loan DatabaseDebt/Equity Long-term debt/market value of equity CompustatMarket/Book (Book value of debt + Market value of equity)/Total
Size Log(total assets), where total assets are in dollars CompustatInstitutional ownership Fraction of total institutional holdings on June 30th of
the year preceding the loan contract signing date,calculated in decimal rather than in percentage
Thomson Financial 13FDatabase
Block ownership Fraction of block holdings on June 30th of the yearpreceding the loan contract signing date, calculated indecimal rather than in percentage. Institutions withholding ≥5% are defined as blockholders
Thomson Financial 13FDatabase
Top-five ownership Fraction of holdings of the five largest institutionalinvestors on June 30th of the year preceding the loancontract signing date, calculated in decimal rather thanin percentage
Thomson Financial 13FDatabase
Herfindahl index∑
w2i, where wi is the fraction of ownership by each
of the five largest institutional investorsThomson Financial 13FDatabase
Number of institutionalinvestors
Log(1 + Number of institutional investors) Thomson Financial 13FDatabase
Senior Indicator variable. Equals unity if the loan is seniorloan and zero otherwise
Syndicated Loan Database
Revolver Indicator variable. Equals unity if the loan is a revolverand zero otherwise
Syndicated Loan Database
Syndicate Indicator variable. Equals unity if the loan issyndicated and zero otherwise
Syndicated Loan Database
Refinancing Loan purpose indicator variable. Equals unity if theloan is for refinancing and zero otherwise
Syndicated Loan Database
Acquisition Loan purpose indicator variable. Equals unity if theloan is for acquisition and zero otherwise
Syndicated Loan Database
Miscellaneous Loan purpose indicator variable. Equals unity if theloan is for purposes other than refinancing, workingcapital and acquisition and zero otherwise
Syndicated Loan Database
Investment Borrower rating indicator variable. Equal unity if S&Prating on the borrower’s long-term debt rating on thesigning date is higher than BB+
Syndicated Loan Database
Speculative Borrower rating indicator variable. Equal unity if S&Prating on the borrower’s long-term debt rating on thesigning date is not higher than BB+
Syndicated Loan Database
Unrated Borrower rating indicator variable. Equal unity if theborrower’s long-term debt rating on the signing date isnot rated by S&P
Syndicated Loan Database
Industry dummies There are eight industry dummies based on 2-digit SICcodes
Syndicated Loan Database
Intangible Industry indicator. Equal unity if the borrower’s 3-digitSIC code is 283 (drugs), 284 (chemicals), 357 (computerand office equipment), 366 (communicationsequipment), 367 (electronics), 371 (motor vehicles),382 (measurement and control devices), 384 (medicalinstruments) or 737 (software) and zero otherwise
Syndicated Loan Database
References
Agrawal, A., & Knoeber, C. R. (1996). Firm performance and mechanisms to control agency problems between managers andshareholders. Journal of Financial and Quantitative Analysis, 31, 377–397.
Anderson, R. C., Mansi, S. A., & Reeb, D. M. (2003). Founding family ownership and the agency cost of debt. Journal of FinancialEconomics, 68, 263–285.
G. Roberts, L. Yuan / Journal of Economics and Business 62 (2010) 604–626 625
Angbazo, L., Mei, J., & Saunders, A. (1998). Credit spreads in the market for highly leveraged transaction loans. Journal of Bankingand Finance, 22, 1249–1282.
Bhojraj, S., & Sengupta, P. (2003). Effect of corporate governance on bond ratings and yields: The role of institutional investorsand outside directors. Journal of Business, 76, 455–475.
Black, B. S. (1990). Shareholder passivity reexamined. Michigan Law Review, 88, 520–608.Bradley, M., & Roberts, R. R. (2003). Are debt covenants priced? Working paper. Duke University.Chava, S., Dierker, M., & Livdan, D. (2005). Do shareholder rights affect the cost of bank loans? Working paper. University of
Houston.Chung, R., Firth, M., & Kim, J. (2002). Institutional monitoring and opportunistic earnings management. Journal of Corporate
Finance, 8, 29–48.Clay, D. G. (2002). Institutional ownership and firm value. Working paper.Coffee, J. (1991). Liquidity versus control: The institutional investor as corporate monitor. Columbia Law Review, 91, 1277–1368.Coleman, A. D. F., Esho, N. & Sharpe, I. G. (2004). Does bank monitoring influence loan contract terms? Working paper.Conference Board (2003). Institutional investor report.Cook, R. D. (1979). Influential observations in linear regression. Journal of the American Statistical Association, 74, 169–174.Cornett, M. M., Marcus, A. J., Saunders, A. & Tehranian, H. (2003). The impact of institutional ownership on corporate operating
performance. Working paper.Demsetz, H., & Lehn, K. (1985). The structure of corporate ownership: Causes and consequences. Journal of Political Economy,
93, 1155–1177.Dennis, S., Nandy, D., & Sharpe, I. G. (2000). The determinants of contract terms in bank revolving credit agreements. Journal
Financial and Quantitative Analysis, 35, 87–110.Diamond, D. W. (1984). Financial intermediation and delegated monitoring. The Review of Economic Studies, 51, 393–414.Diamond, D. W. (1989). Reputation acquisition in debt markets. Journal of Political Economy, 97, 828–862.Drucker, S., & Puri, M. (2009). On loan sales, loan contracting, and loan relationships. Review of Financial Studies, 22, 2835–2872.Duggal, R., & Miller, J. A. (1999). Institutional ownership and firm performance: The case of bidder returns. Journal of Corporate
Finance, 5, 103–117.Esty, & Benjamin, C. (2001). Structuring loan syndicates: A case study of the Hong Kong Disneyland project loan. Journal of
Applied Corporate Finance, 14(3), 80–95.Faccio, M., & Lasfer, M. A. (2000). Do occupational pension funds monitor companies in which they hold large stakes? Journal
of Corporate Finance, 6, 71–110.Fama, E., & Miller, M. (1972). The theory of finance. Hinsdale, IL: Dryden Press.Gompers, P., & Metrick, A. (2001). Institutional investors and equity prices. Quarterly Journal of Economics, 116, 229–259.Gompers, P., Ishii, J. L., & Metrick, A. (2003). Corporate governance and equity prices. Quarterly Journal of Economics, 118, 107–155.Gottesman, A. A., & Roberts, G. S. (2004). Maturity and corporate loan pricing. Financial Review, 38, 55–77.Hartzell, J. C., & Starks, L. T. (2003). Institutional investors and executive compensation. The Journal of Finance, 58, 2351–2374.Helwege, J., & Turner, C. M. (1999). The slope of the credit yield curve for speculative-grade issuers. Journal of Finance, 54,
1869–1884.Hubbard, R. G., Kuttner, K. N., & Palia, D. N. (2002). Are there “Bank Effect” in borrowers’ costs of funds? Evidence from a matched
sample of borrower and banks. Journal of Business, 75, 559–581.Inderst, R. & Müller, H. M. (1999). Ownership concentration, monitoring and the agency cost of debt. Working paper. University
of Mannheim.Jennings, W. W. (2005). Further evidence on institutional ownership and corporate value. Advances in Financial Economics, 11,
171–211.Jensen, M., & Meckling, W. (1976). Theory of the firm: Managerial behavior, agency costs and ownership structure. Journal of
Financial Economics, 3, 305–360.Johnson, S. (2003). Debt maturity and the effects of growth opportunities and liquidity risk on leverage. Journal of Financial
Studies, 16, 209–236.Kalay, A. (1982). Stockholder–bondholder conflict and dividend constraints. Journal of Financial Economics, 10, 211–233.Karpoff, J., Malatesta, P., & Walking, R. (1996). Corporate governance and shareholder initiatives: Empirical evidence. Journal of
Financial Economics, 42, 365–395.Klock, M. S., Mansi, S. A., & Maxwell, W. F. (2005). Does corporate governance matter to bondholders? Journal of Financial and
Quantitative Analysis, 40, 693–719.Lehn, K., & Poulsen, A. (1991). Contractual resolution of bondholder–stockholder conflicts in leveraged buyouts. Journal of Law
and Economics, 34, 645–673.Maxwell, W., & Rao, R. (2003). Do spin-offs expropriate wealth from bondholders? The Journal of Finance, 58, 2087–2108.Maxwell, W., & Stephens, C. (2003). The wealth effects of repurchases on bondholders. The Journal of Finance, 58, 895–919.Merton, R. (1974). On the pricing of corporate debt: The risk structure of interest rates. The Journal of Finance, 29, 449–470.Myers, S. (1977). Determinants of corporate borrowing. Journal of Financial Economics, 5, 147–175.Parrino, R. (1997). Spin-offs and wealth transfers: The Marriott case. Journal of Financial Economics, 43, 241–274.Parrino, R., & Weisbach, M. S. (1999). Measuring investment distortions arising from stockholder–bondholder conflicts. Journal
of Financial Economics, 53, 3–42.Parrino, R., Sias, R. W., & Starks, L. T. (2003). Voting with their feet: Institutional ownership changes around forced CEO turnover.
Journal of Financial Economics, 68, 3–46.Preece, D. C., & Mullineaux, D. J. (1996). Monitoring, loan renegotiability, and firm value: The role of lending syndicates. Journal
of Banking and Finance, 20, 577–593.Rajan, R. G. (1992). Insiders and outsiders: The choice between informed and arm’s-length debt. The Journal of Finance, 47,
1367–1400.Rajgopal, S., & Venkatachalam, M. (1998). The role of institutional investors in corporate governance: An empirical analysis.
Working paper.Smith, C., & Warner, J. (1979). On financial contracting: An analysis of bond covenants. Journal of Financial Economics, 7, 117–161.
626 G. Roberts, L. Yuan / Journal of Economics and Business 62 (2010) 604–626
Sougiannis, T., Amir, E., & Lev, B. (2003). Do financial analysts get intangibles? European Accounting Review, 12, 635–659.Strahan, P. E. (1999). Borrower risk and the price and nonprice terms of bank loans. Working paper. Boston College.Taylor, W. (1990). Can big owners make a big difference? Howard Business Review, 70–82.Thomson Reuters (2008, Third Quarter). Equity capital markets. http://banker.thomsonib.com.White, H. (1980). A heteroskedasticity-consistent covariance matrix estimator and a direct rest for heteroskedasticity. Econo-