30
Do Language Arts Intervention Programs Increase Student Achievement on Language Arts Standardized Tests? Fall 2007 Dan Blood Baretta Hagen Brandi Kasten Jennifer Roll

Do Language Arts Intervention Programs Increase Student Achievement on Language Arts Standardized Tests?
Fall 2007
Dan BloodBaretta HagenBrandi KastenJennifer Roll
California State University, San Bernardino 5500 University Parkway
San Bernardino, California 92407

Abstract
The purpose of our research is to determine whether or not language arts
intervention programs increase student achievement. Our results were based on
analyzing standardized test scores of basic and below basic students in sixth
through eighth grade. We did a comparison study using standardized test scores
of students who received remediation to students who did not. Students were
matched based on similar test scores on the California Standardized Test (CST)
Language Arts section. The result of this research shows that the double dose
language arts intervention for students who are at least two years behind grade
level does not demonstrate significant literacy improvement. The standardized
test results showed that students not in the program were no worse off than
students in the program.
Statement of Problem
Students who do not meet grade level standards are given the opportunity
to participate in intervention classes that remediate skills that are essential for
academic success. Students’ participation in these classes takes the place of
their electives, which provides them with a double dose of instruction in
Language Arts, Math, or both. The goals of the intervention programs are to
provide extra support for students to become proficient in reading. The question
is not whether these programs provide the much-needed support, but whether
students are making substantial gains in the subject area of our focus, Language
Arts.
1

Literature Review
There are many factors that contribute to poor readers such as, poverty,
English as a second language, poor attendance, engagement, etc. There has
been an influx of data that shows that there is much attention needed concerning
adolescent literacy in the United States. An article in the Journal of Adolescent &
Adult Literacy (November 2006), stated that the United States Department of
Education reports that more than 8 million students in grades 4-12 are struggling
readers and National Assessment of Educational Progress data from 2002
indicate that 33% of the 8th grade students and 36% of the 12th grade students
who were tested performed at or above a “proficient” level. This means that
nearly 70% of the 8th graders tested could not describe the purpose of a practical
passage and support their views with examples and details. Poor readers are at
significant risk for dropping out of high school. If a student can’t read by the 8 th
grade, the likelihood of them dropping out is almost a given. Over 3,000 students
drop out of high school everyday.
No Child Left Behind and The President’s Striving Readers Initiative
provides federal funds to states for reading intervention programs for middle and
high school students. In California funds are available for schools to adopt
intervention programs. The purpose of the current middle school reading
intervention is to provide a comprehensive, intensive, accelerated
reading/language arts program designed for students in grades four through
eight whose reading achievement is significantly below grade levels according to
the Department of Education’s website.
2

By the time students get to middle school the achievement gap has
widened. One teacher is responsible for 150 –200 students on a daily basis. It is
extremely difficult for teachers to meet the needs of poor readers. Intense, direct,
and explicit instruction in reading is critical to close the achievement gap
(Shippen, et al., 2005). Poor readers may know the skills and strategies that are
essential for becoming a good reader, but do not know how or when to apply
them. They begin reading without preparation or purpose, labor with word
identification skills, do not recognize important vocabulary, and demonstrate
limited connections between reading and thinking (Shippen, et al., 2005).
In a study conducted by Shippen, et al. they compared two direct
instruction intervention reading programs for urban middle school students. The
seventh grade students who participated in the study were behind 2 to 4 years in
reading. After a short six-week intervention, they showed gains in word reading
efficiency, reading rate, reading accuracy, and reading fluency in both programs.
Students who were reading at or above the fourth grade level showed more
gains, then students who were reading at the third grade level or below. The
authors suggest that these findings be viewed with caution. Practically speaking
students were still performing poorly in many important areas of reading.
Making up for lost ground in reading skills is indeed possible, but schools
have limited resources, of both time and money. In a paper delivered to the
International Reading Association, in Orlando, FL., McConnell, 2003, the author
shared her experience with one-on-one intensive literacy intervention with a
middle school student two years behind the pace. In just 10 weeks the child
3

made significant improvement in all areas of literacy. While research proves that
intensive intervention programs succeed in bringing poor readers up to speed, it
is inconceivable that one-on–one interventions will be the norm due to financial
constraints. In another study, Goe, 2006, the author viewed literacy
improvement programs through a financial lens. Goe ‘s research concluded that
even with an abundance of state funds to support locally customized school
improvement, there were no substantial gains made on the larger school-wide
scale.
In the article, Effects of a Homogeneous Low-Tracked Program on
Academic Performance of At-Risk Students, it states
Presently, over 95 percent of middle and senior high schools use some type of tracking program. Tracking occurs when students are placed homogenously according to grades, scores on standardized tests, and/or teacher evaluations. Research by Kerchoff and Garmoran claims tracking widens the academic gap by depressing the achievement of students in low tracks while boosting the level of high-track students, especially in light of a study by Argys, Rees, and Brewer, who found that low-tracked students assigned to heterogeneous math classes gained five percentage points on achievement tests. (Pula and Schweiker-Marra 2005)
The researchers of this study took a group of Below Basic students and tracked
them into two classes that received extra support in all subject areas. They were
not only remediated, but also taught test taking skills. Students were followed
from 5th to 10th grade, and their standardized test scores were looked at to show
academic growth. The researchers found that the number of students scoring
Below Basic declined each year, and that this reduction increased over time.
“While much of the research on low-tracked homogenous programs for at-risk
students has found the tracking model to be unsuccessful, this three-year
4

program showed a significant decrease in the number of students performing in
the lowest percentile.” (Pula and Schweiker-Marra 2005)
With a focus on middle school students from high-poverty Philadelphia
public schools, Balfanz, Herzog, and MacIver conducted a longitudinal study
involving tracking the graduation rates of 12,972 sixth-grade students over eight
years (Balfanz, Herzog, MacIver, 2006, p. 10). The questions these researchers
asked were “How early in the middle grades can a significant number of students
in high-poverty school districts be identified who, absent intervention, will fall off
the graduation track? How large a role does student disengagement plan in
falling off the graduation track in the middle grades, and equally important, can
students be identified in a reliable and valid manner with indicators readily
available and interpretable to school teachers and administrators?”(Balfanz,
Herzog, McIver, 2006, p. 8)
In regards to the first and third questions, statistical data was used to find
predictors that were highly indicative of future graduation. Therefore, only factors
that had a predictive rate of 75% or more were labeled as highly indicative for
determining graduation. These factors met the researchers’ criteria: failing math,
failing English, attend school 80% or less of the time, and out of school
suspensions (Balfanz, Herzog, MacIver, 2006, p. 13). If a student met one of
the following factors, he or she would fail to graduate 75% of the time. A
combination of these factors further lowered the chance of a student graduating.
Because two of these factors involve failure in core classes, finding interventions
5

to curtail failure in these subjects is a necessary step in keeping students on the
graduation track.
In addressing the second question regarding engagement, Balfanz,
Herzog, and MacIver state, “Our findings strongly support the use of
comprehensive school reforms that attempt to improve student engagement
through mutually supporting mechanisms” (Balfanz, Herzog, & MacIver, 2006, p.
25). One reform which was show to “significantly improve student achievement”
was the use of “mathematics and reading labs which students take in addition to
their regular mathematics and English course in lieu of an elective” ((Balfanz,
Herzog, & MacIver, 2006, p. 25).
Further research on student disengagement was conducted by Brazo.
The focusing question of his research was whether school interventions and
reforms would be better accepted by students if students themselves were
included in the design of the reform. The high school that Brazo was studying
had implemented major educational reforms with few results. Through interviews
with four students, a student council member, a remedial reader, a ninth grader,
and a college bound senior, Brazo found a pattern of disengagement. While he
cautioned that the effectiveness of the literacy reform methods could not be
linked to continuing “flat” test scores based on the conclusions of his study,
Brazo acknowledged that, “Adolescents from all ability levels can be informants
to help bring about curricular reforms that support responsive literacy practices”
(2006).
6

Hypothesis
After deciding to research the effects of a reading intervention program on
student achievement, we constructed a theory. Our theory was that middle
school reading intervention programs are not successful in contributing to gains
on standardized tests. One contributing factor may be that the loss of electives
may decrease student motivation. Another factor may be that students who are
Far Below Basic and are required to take a “double dose” remediation class have
a negative pre-disposition towards the subject.
Significance of the Proposed Study
No Child Left Behind states that all students must be proficient in reading
and math by 2014. Standardized test scores show us that students are
significantly behind grade level in reading. Most students who are poor readers
have a higher drop out rate and are unable to further education and attain high
paying jobs. Interventions must be put into place in order to ensure academic
success for all students. More schools are incorporating reading intervention
programs in order to increase reading achievement scores. Students are getting
a “double dose” of instruction throughout the day, which is eliminating their
choice of electives.
7

Subjects
The sample populations were taken from a middle-school of seventh and
eighth graders with a student population of 475. Two comparison groups were
created for this study. One was a control group, the other a literacy group. Within
the control group was a sub-group of seventh grade students and another sub-
group of eighth grade students. Students were considered to be part of the
control group if their ELA score for the 2005/2006 school year was in the Far
Below Basic, Below Basic, or Basic score on the ELA given annually by the
school district in accordance with state requirements. For the seventh graders,
the number of students in the control sub-group was 50. The eighth grade sub-
group had 76 students. Students in the control group had four core classes
(English, social studies, science, and math), as well as physical education and an
elective. The comparison group, labeled the literacy group, also consisted of
students who scored at Far Below Basic, Below Basic or Basic on the ELA, and
were enrolled in four core classes, as well as physical education. The variable
was that these students did not choose an elective, but were instead placed in a
second English language class called Literacy Support. This doubling up on a
core class is a process often referred to as dual remediation. Within the literacy
group, there was a subgroup of seven seventh graders. There were ten eighth
graders.
8

Instrumentation
The question of the effectiveness of dual-remediation in a middle-school
setting was investigated using a qualitative method involving the comparison of
similar students, one group which did not participate in a remediation program
and the other which did. The research team believed that these two groups were
comparable because all were below the State of California’s definition of being a
student meeting grade-level standards in English. They were not at either the
Proficient or Advanced Levels based on English Language Assessment (ELA)
scores. A short survey was also used to gauge student engagement in the dual
remediation program.
Data Treatment Procedures
Using Data Director, a multi-function software program for schools,
student scores were downloaded into an Excel program for analysis. To access
student literacy (ELA) growth, a spread sheet was created comparing end of year
sixth grade scores to end of year seventh grade scores. Students who fell into
the categories of Far Below, Below, and Basic in sixth grade were included in the
seventh grade study and included on Table 1 as the Grade Seven Control Group.
Similarly, a spread sheet was created comparing end of year seventh grade
scores to end of year eighth grade scores. Students who fell into the categories
of Far Below, Below, and Basic in seventh grade were included in the eighth
grade study and included on Table 2 as the Eighth Grade Control Group. The
same process was used for the much smaller Literacy Group.
9

In order to show growth or lack of growth, Tables 1 and 2 were created to
allow an individual student to be counted as staying at the same ELA level,
increasing by one or two levels, or decreasing by one level. No students, either
in the control or literacy group, decreased by more than one level. The mean
ELA scores were also calculated to show group growth or lack of group growth.
Our qualitative research also included a survey of seven students
currently enrolled in the dual-remediation literacy program at the researched
middle-school. While both the classroom teacher and one study researcher were
present, the students completed a short survey designed to gauge student
opinion on the helpfulness of participating in the literacy program. (See Appendix
1) Specifically, the researchers wanted to know if students were able to identify
literacy strategies they had learned and if these strategies were being applied in
their core classes. The responses were noted in Appendix 2.
Presentation of Findings
The data does not show significant gains in the 7th grade literacy group.
However, after two years in the program, the gains realized in 8th grade are
significant, as 60% moved up one level, and they enjoyed a 7.4% mean average
ELA test score increase.
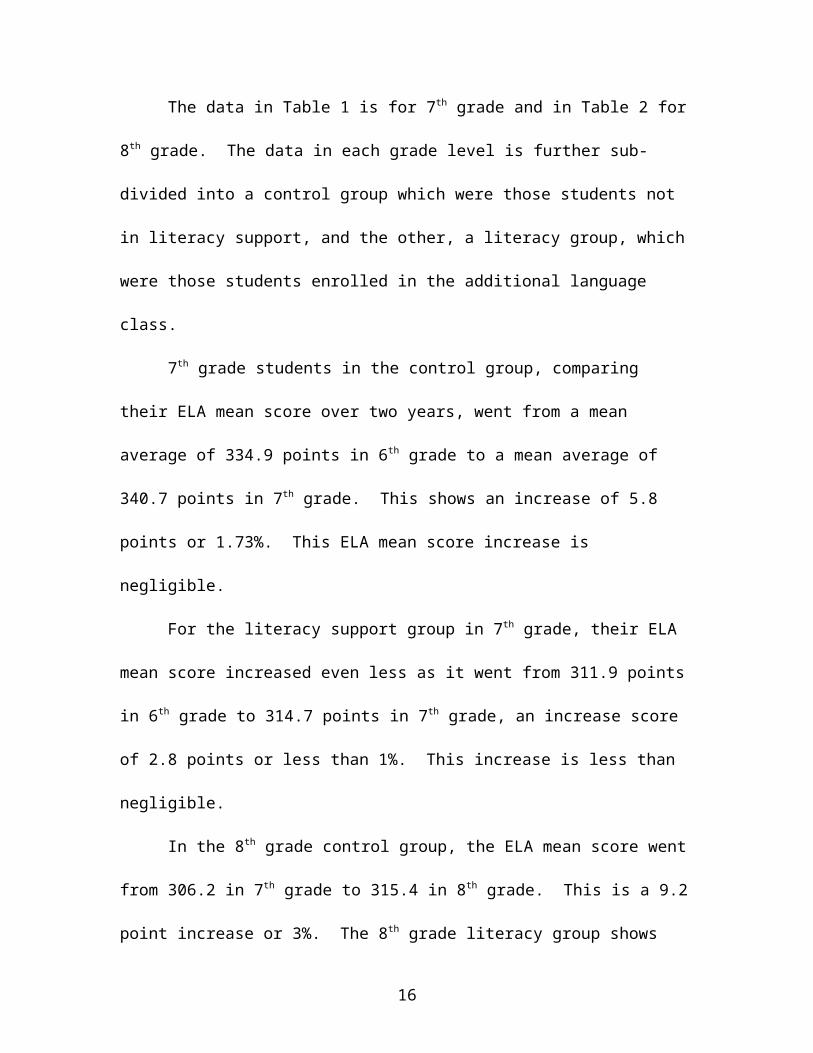
The data in Table 1 is for 7th grade and in Table 2 for 8th grade. The data in
each grade level is further sub-divided into a control group which were those
students not in literacy support, and the other, a literacy group, which were those
students enrolled in the additional language class.
10

7th grade students in the control group, comparing their ELA mean score over
two years, went from a mean average of 334.9 points in 6th grade to a mean
average of 340.7 points in 7th grade. This shows an increase of 5.8 points or
1.73%. This ELA mean score increase is negligible.
For the literacy support group in 7th grade, their ELA mean score increased
even less as it went from 311.9 points in 6th grade to 314.7 points in 7th grade, an
increase score of 2.8 points or less than 1%. This increase is less than
negligible.
In the 8th grade control group, the ELA mean score went from 306.2 in 7th
grade to 315.4 in 8th grade. This is a 9.2 point increase or 3%. The 8th grade
literacy group shows the highest gains in their ELA mean score. In 7th grade their
mean ELA score was 289.2 points, in 8th grade it climbed to 312.6 points, an
increase of 21.4 points or 7.4%
Another method of measuring ELA test score gains and losses are the
rankings provided by Data Director. These range from a lowest rank of “student
decreased two levels” to a “no change” ranking, all the way up to a “student
increased three levels” rank. In both the 7th grade groups, an average of 56% of
the students stayed where they were, no change up or down, 70% for the control
group and 43% for the literacy group. The “no change” ranking for both of the 8 th
grade control and literacy groups was an average of 39.5%, 49% for the control
group and 30% of the literacy group.
The percent of students in the 8th grade literacy group who increased one
level or more was 60%. In the control group 38% increased one level or more.
11

Among 7th graders in the control group, 24% increased one or more levels and in
the literacy group only 29% moved up one level or more. One additional ranking
that is somewhat troublesome is 29% of the 7th graders in the literacy group
actually dropped one level of literacy after a full year in the support class. In 8 th
grade those students dropping one level after a year of literacy support was only
10%.
From the results of the personal literacy survey, the majority students in the
literacy group reported that they found the second language class helpful. They
were also able to identify the subjects they were transferring the most benefit
towards, such as history, English and science, and specific strategies they
learned in the literacy support, like questioning, clarifying and making predictions.
Overall, students are communicating a positive attitude about the literacy class.
Seven current students enrolled in Literacy Support were surveyed to
gauge student engagement in the class. Results are listed on Appendix A. The
results show that all surveyed students were placed into Literacy Support by
school administration or parent request. The students did not wish to be in
Literacy Support. Five of the students were continuing literacy student, while two
were new to a literacy program. Participation in English Language Support for
English Learners was considered participation in a literacy program.
Students were asked to list three strategies they had learned while a
student in the Literacy Support class. The classroom teacher encouraged them
to use resources on the walls in the classroom if they needed assistance. Eight
different strategies were noted. Five out of the seven students noted they had
12

learned how to ask questions about the text, while four out of the seven had said
they had learned how to clarify or make predictions. The abilities to summarize
or write better were noted by three students. Two noted vocabulary skills
(understanding new words) and one student each responded with sounding out
words or using schema. The majority of responses were deeper level literacy
skills (questioning, clarifying, and prediction) compared to surface level skills
(sounding out words).
These learned strategies were applied by all students in English, science
and history. Three of the students responded that they also used literacy
strategies in math. This makes sense with the increased focus on problem
solving skills at the middle school level. These math problems require students
to read and comprehend a problem before being able to answer it
mathematically.
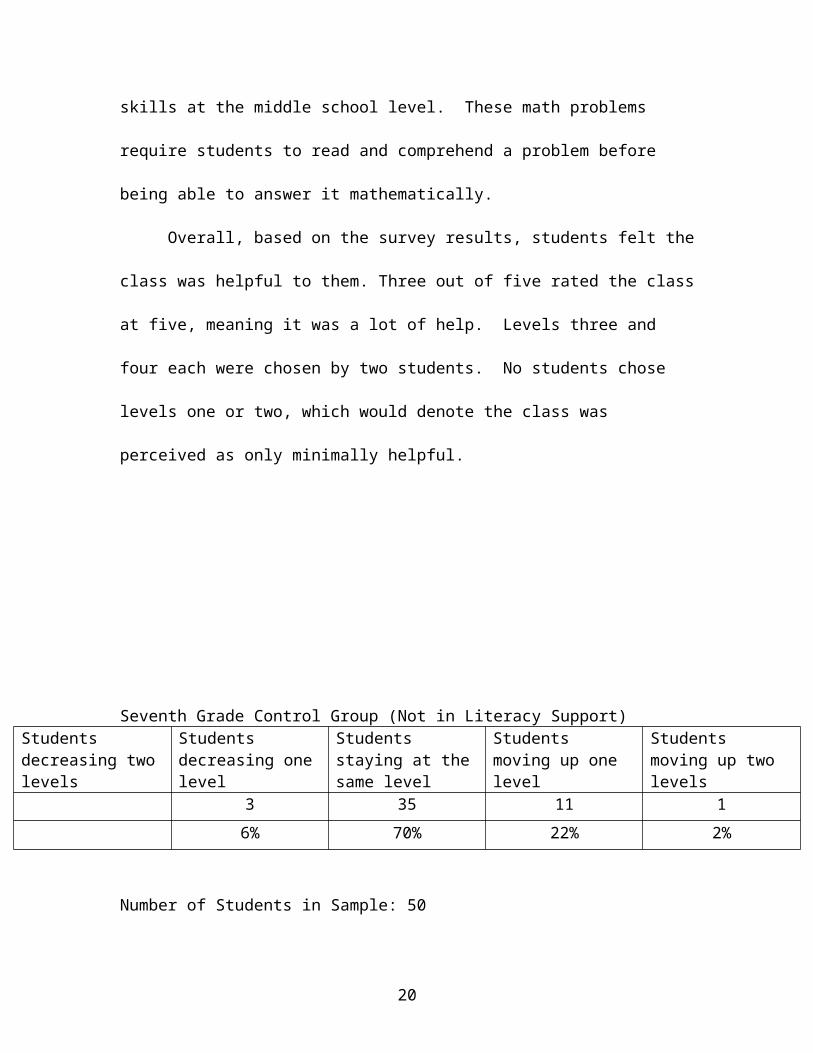
Overall, based on the survey results, students felt the class was helpful to
them. Three out of five rated the class at five, meaning it was a lot of help.
Levels three and four each were chosen by two students. No students chose
levels one or two, which would denote the class was perceived as only minimally
helpful.
13

Seventh Grade Control Group (Not in Literacy Support)Students decreasing two levels
Students decreasing one level
Students staying at the same level
Students moving up one level
Students moving up two levels
3 35 11 1
6% 70% 22% 2%
Number of Students in Sample: 50
Mean 6th Grade ELA score: 334.9
Mean 7th Grade ELA score: 340.7
Seventh Grade Literacy Group (Enrolled in Literacy Support)
Students decreasing two levels
Students decreasing one level
Students staying at the same level
Students moving up one level
Students moving up two levels
2 3 2
29% 43% 29%
Number of Students in Sample: 7
Mean 6th Grade ELA score: 311.9
Mean 7th Grade ELA score: 314.7
Table 2
14

Eighth Grade Control Group (Not in Literacy Support)Students decreasing two levels
Students decreasing one level
Students staying at the same level
Students moving up one level
Students moving up two levels
Students moving up three levels
1 9 37 25 3 1
1% 12% 49% 33% 4% 1%
Number of Students in Sample: 76
Mean 7th Grade ELA score: 306.2
Mean 8th Grade ELA score: 315.4
Eighth Grade Literacy Group (Enrolled in Literacy Support)
Students decreasing two levels
Students decreasing one level
Students staying at the same level
Students moving up one level
Students moving up two levels
1 3 6
10% 30% 60%
Number of Students in Sample: 10
Mean 7th Grade ELA score: 289.2
Mean 8th Grade ELA score: 312.6
15
Limitations of the Design
Time constraints required a less detailed study than would be necessary
to better answer the research question about the effectiveness of dual
remediation. Ideally, data from various schools could have been collected and
analyzed. Further, in-depth student interviews would better gauge student
engagement and its affect on student achievement.
Only students who were enrolled in the district of the middle-school
studied from June 2006 through June 2007 were included in the study. This
version of Data Director, the source of the ELA scores, only allows access to
scores from this one district. This limited the inclusion of transient students in
this study.
Conclusion
The double dose language arts intervention for students who are at least two
years behind grade level does not demonstrate significant literacy improvement.
The standardized test results showed that students not in the program were no
worse off than students in the program. Furthermore, those students who are in
double dose programs are missing out on all of the literacy exposure they might
have benefited from had they be able to attend language rich elective courses
such as drama or computers. However, school districts may feel they must
show that some kind of intervention is being offered to their underachieving
readers, and for this reason, this particular intervention, the dual language arts
classes, is indeed low cost insurance.
16

Further Recommendations
With the importance of literacy education on graduation success, further
in-depth studies are recommended. While noted above, time limitations and
small sample populations restricted the detailed study required to amply answer
our research question regarding the affect of dual literacy remediation on student
progress. Further researchers should consider larger sample populations and
conduct a study over a longitudinal basis. Particular programs for literacy
progress should be compared and evaluated. While our study limited the focus
to ELA scores, progress in core areas would ideally be measured. Finally,
methods should be enacted to measure student engagement into literacy
programs.
17

References
Balfanz, R., Herzog, L., MacIver, & D.J. (2006) Preventing student disengagement and keeping students on the graduation track in
high poverty middle-grades: Early identification and effective interventions (National Science Foundation grant number
0411796). Johns Hopkins University, Center for the Organization of Schools.
Brozo, W. (2006). Tales out of school: Accounting for adolescents in a literacy reform community. Journal of Adolescent & Adult Literacy, 49, 410-418.
Fisher, Douglas, Ivey, Gay (2006). Evaluating the interventions for struggling adolescent readers. Journal of Adolescent & Adult Literacy, 50(3).
Goe, L. (2006). Evaluating a state-sponsored school improvement program through an improved school finance lens. Journal of Education Finance, 31:4, 395-419
McConnell, D. (2003). Reading intervention for struggling adolescents. Paper presented at the International Reading Association, Orlando, FL.
Papalewis, Rosemary (2004). Struggling Middle School Readers: Successful, Accelerating Intervention. Reading Improvement, 41(1), 24-37.
Pula, Judith J. and Schweiker-Marra, Karyn (2005). Effects of a Homogeneous Low-Tracked Program on Academic Performance of At-Risk. The Delta Kappa Gamma Bulletin, 71(2) 34-42 and 58.
Shippen, et al. (2005). A Comparison of Two Direct Instruction Reading Programs for Urban Middle School Students. Remedial and Special Education. 26(3), 177-182.
18

Appendix 1
Literacy Survey
Your answers are important to us. Please answer thoughtfully.
1. How did you become a student in the class?
Chose this as my class Placed into this class
2. Were you in a literacy support class last Year?
Yes No
3. Please list strategies you are learning.
____________________
____________________
____________________
4. What classes do you use these strategies in? Please check all that apply?
Math_____ English_____ Science ______ History _____
5. On a scale of one through five, please rate how helpful this class has been to you.
1 2 3 4 5Just a little help A lot of help
19
APPENDIX 2
Literacy Survey Results
1. How did you become a student in the class?
Chose this as my class: 0 Placed into this class 7
2. Were you in a literacy support class last Year?
Yes: 5 No: 2
3. Please list strategies you are learning.
Strategy Number of students with this response Clarify 4Summarize 3Question 5Sound out words 1Schema 1Predictions 4Writing Better 3Understanding New Words2
4. What classes do you use these strategies in? Please check all that apply?Subject Number of students who checked this subject Math 3 English 7 Science 7 History 7
5. On a scale of one through five, please rate how helpful this class has been to you.
Level Student response 1 (Just a little help) 02 03 24 25 (A lot of help) 3
20


