J. Zool., Lond. (1993) 229, 133-1 5 1 Does metatarsal/femur ratio predict maximal running speed in cursorial mammals? THEODORE GARLAND, JR Department of Zoology, University of Wisconsin, Madison, W I 53706, USA Program in Ecology and Evolutionary Biology, Division of Biology and Medicine, Brown University, Providence, RI 02912, USA (Accepted 26 November 1991) (With 7 figures in the text) We tested the hypothesis that hind limb proportions may be used to predict locomotor performance in a sample of 49 species of primarily cursorial mammals. Data on maximal sprint running speeds taken from published sources were related to measurements of hind limb lengths. To control for statistical complications due to the hierarchical nature of phylogenetic relationships, we used Felsenstein's (1985) independent contrasts method for analysing comparative data, and a composite phylogeny for all 49 species, based on a variety of published sources. The independent contrasts method indicates that maximal running speed does not covary significantly with body mass for this sample of mammals (mass range = 2.5-2,000 kg). Even though quality of the available speed data is highly variable, both metatarsallfemur ratio- the traditional index of 'cursoriality' in mammals-and hind limb length (corrected for body size) are significant predictors of maximal running speed. When only fully cursorial species are included in the analyses (n = 32), hind limb length still significantly predicts speed (r2 = 16%), but MT/F ratio does not. Although ungulates tend to have larger MT/F ratios than do Carnivora, they are not generally faster; relationships between speed and limb proportions within the two clades show no significant differences. These and previous results suggest that hind limb proportions and maximal running speed may not have evolved in a tightly coupled fashion. Prediction of locomotor performance of extinct forms, based solely on their limb proportions, should be undertaken with caution. Contents Page ................................ Introduction 134 .................................. Methods 135 ........................ Morphological and speed data 135 .......................... Phylogenetic information 135 ............................ Statistical analyses 137 .................................. Results 138 ............................ Phylogenetic analyses 140 .................. Phylogenetic analyses of restricted data set 143 ................................ Discussion.. 145 .................................. References 148 133 O 1993 The Zoological Society of London
Transcript
J. Zool., Lond. (1993) 229, 133-1 5 1
Does metatarsal/femur ratio predict maximal running speed in cursorial mammals?
THEODORE GARLAND, JR
Department of Zoology, University of Wisconsin, Madison, W I 53706, U S A
Program in Ecology and Evolutionary Biology, Division of Biology and Medicine, Brown University, Providence, RI 02912, U S A
(Accepted 26 November 1991)
(With 7 figures in the text)
We tested the hypothesis that hind limb proportions may be used to predict locomotor performance in a sample of 49 species of primarily cursorial mammals. Data on maximal sprint running speeds taken from published sources were related to measurements of hind limb lengths. To control for statistical complications due to the hierarchical nature of phylogenetic relationships, we used Felsenstein's (1985) independent contrasts method for analysing comparative data, and a composite phylogeny for all 49 species, based on a variety of published sources. The independent contrasts method indicates that maximal running speed does not covary significantly with body mass for this sample of mammals (mass range = 2.5-2,000 kg). Even though quality of the available speed data is highly variable, both metatarsallfemur ratio- the traditional index of 'cursoriality' in mammals-and hind limb length (corrected for body size) are significant predictors of maximal running speed. When only fully cursorial species are included in the analyses (n = 32), hind limb length still significantly predicts speed (r2 = 16%), but MT/F ratio does not. Although ungulates tend to have larger MT/F ratios than do Carnivora, they are not generally faster; relationships between speed and limb proportions within the two clades show no significant differences. These and previous results suggest that hind limb proportions and maximal running speed may not have evolved in a tightly coupled fashion. Prediction of locomotor performance of extinct forms, based solely on their limb proportions, should be undertaken with caution.
'Cursorial' implies swiftness or ease in running, but the term is usually applied to animals based not on their performance ability per se (sensu Djawdan & Garland, 1988; Alexander, 1991; Garland & Losos, 1993; references therein), but on putatively correlated aspects of their morphology (but see Taylor, 1989). 'Cursorial adaptations' (Coombs, 1978; Hildebrand, 1982, 1985) include the lengthening of the distal limb segments, the reduction, compression or loss of the lateral metapodials and phalanges (and of the ulna and fibula), the reduction of the range of limb motion to the sagittal plane, and a change in foot stance from the primitive plantigrade position to digitigrade or unguligrade. Many cases of parallel evolution of such morphological adaptations occur in mammals; examples involving extinct forms are discussed elsewhere (Bakker, 1983; Janis, 1993; references therein). Among living species, not all 'cursorial' mammals are fast runners; the cow is one example, although here it is difficult to judge the effects of domestication (cf. Taylor et al., 1981).
Functional morphologists have routinely used the metatarsal/femur (MT/F) ratio as an index of 'cursoriality' in mammals (Howell, 1944; Maynard Smith & Savage, 1956; Gambaryan, 1974). This ratio reflects the degree to which distal elements of the hind limb are elongated relative to proximal elements; larger values indicate increased cursoriality and, presumably, enhanced locomotor performance (e.g. increased speed, stamina, agility or energetic efficiency) (Coombs, 1978; Hildebrand, 1982, 1985).
Although widely used by paleontologists to infer the locomotor abilities and behaviour of extinct species (Howell, 1944; Maynard Smith & Savage, 1956; Gambaryan, 1974; Coombs, 1978; Bakker, 1983; van Valkenberg, 1987; Janis, 1993), surprisingly little empirical evidence exists that would indicate a strong relationship between MT/F ratio and any measure of locomotor performance. 'Cursorial' (e.g. Coombs, 1978; Hildebrand, 1982) mammals do indeed exhibit larger MT/F ratios than do 'non-cursorial' forms, but such a comparison is confounded by phylogenetic relationships. Most present-day cursorial mammals are either ungulates (the orders Artiodactyla and Perissodactyla) or Carnivora (or kangaroos), most of which are relatively large and mobile species. For restricted samples of mostly large mammals, Bakker showed positive relationships between maximal running speed and (1) hind limb length divided by body mass'13 (Bakker, 1975, fig. 21.6) and (2) MT/F ratio (Bakker, 1983, fig. 4; see also Janis, 1993). In neither case, however, were possible confounding influences of body mass or of phylogenetic relationships considered in a quantitative fashion. Thus, within cursorial mammals, we do not know whether limb proportions or lengths are in fact significant predictors of any aspect of locomotor performance.
Although MT/F ratio is not commonly used as a predictor of speed by those working on living species, it has traditionally been used as the standard morphological indicator to estimate locomotor performance of fossil forms (although more recently other morphological indicators have been investigated, e.g. van Valkenburgh, 1987; Wilhelm & Janis, 1990, In prep.). The purpose of this paper is, therefore, to examine critically the empirical relationship between maximal running speed and hind limb proportions within the two largely cursorial clades of mammals, Carnivora and ungulates. Our analyses build on previous studies that have compiled the available data on maximal running speeds of mammals and examined variation in speed in relation to body size, ecology and phylogeny (Garland, 1983a; Djawdan & Garland, 1988; Garland et al., 1988; Janis, 1993). The species we analyse are limited to those Carnivora and ungulates for which data on maximal running speeds are available and for which we were able to obtain skeletal
METATARSALIFEMUR RATIO A N D LOCOMOTION 135
measurements. Most of these species occur in open habitats of Nor th America o r East Africa, where field studies have been concentrated.
W e employ a recently-developed technique for the phylogenetic analysis of comparative da ta (Felsenstein, 1985; Garland et al., 1992). This 'independent contrasts' method explicitly uses the known phylogenetic relationships of the species being compared t o correct for statistical problems tha t are introduced because species da t a points are neither biologically nor statistically independent (e.g. Felsenstein, 1985; Burt, 1989; Grafen, 1989; Harvey & Pagel, 1991; Harvey & Purvis, 1991; Martins & Garland, 1991). Although a number of additional questions could be asked of the da ta that we analyse, we focus simply o n comparisons of Carnivora and ungulates, which may be thought of, roughly speaking, a s predators and prey (cf. Garland, 1983a; Bakker, 1983; Janis, 1993).
Methods
Morphological a n d speed data
Data on maximal running speeds (see Fig. 1) were taken from Simmonetta (1966; Madoqua only), Garland (1983a), and Garland et al. (1 988). As discussed elsewhere (Alexander et al., 1977; Garland, 1983~; Garland et ul., 1988; Alexander, 1991), the available data on maximal running speeds of large mammals have been obtained with a variety of methods and are of highly variable quality. 'Noise' introduced by measurement errors should tend to obscure correlations between speed and limb proportions. Unfortunately, more accurate estimates of the maximal speeds of large mammals are unlikely to become available. On the other hand, it is doubtful that the speed data are biased in any systematic way in relation to limb proportions. So, our analyses should tend to underestimate the strength of correlations between speed and limb proportions.
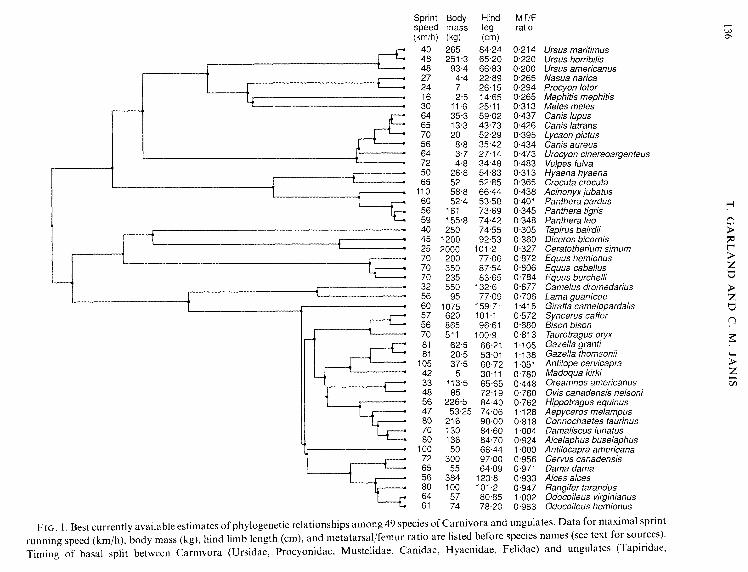
Although speed data are available for many more species of mammals (Djawdan & Garland, 1988; Garland et al., 1988), we concentrated on Carnivora and ungulates because these are the 2 largely cursorial clades of mammals. The 49 species listed in Fig. 1 were studied because data on speed, limb proportions, and phylogenetic relationships were available. The hippopotamus was excluded because it is amphibious.
Limb lengths (from Janis, 1993 and P. B. Wilhelm, pers. comm.) (Fig. 1) were measured as maximum articular lengths (Scott, 1985) on primarily wild-shot specimens housed at the Museum of Comparative Zoology (Harvard University) and the American Museum of Natural History (New York). Hind limb length was computed as the sum of femur, tibia, and metatarsal lengths. Body masses were taken primarily from Nowak & Paradiso (1983) for the Carnivora and non-ruminant ungulates and from Scott (1983, 1987, references therein) for the ruminant artiodactyls, as well as sources listed in Garland (1983~). For Tapirus, speed data are for T. americanus, whereas morphological data are for T. bairdii. For Hyaena, speed data are for H. vulgavis, whereas morphological data are for H. hyaena. For Damaliscus, speed data are for D. korrigum, whereas morphological data are for D. lunatus. For Ouis canadensis, morphological data are from the relatively small nelsoni subspecies.
Phylogenetic information
Figure 1 depicts phylogenetic relationships of the 49 species of mammals that we considered. No single study has considered the phylogenetic relationships of all of these species, so we have compiled information from a variety of sources. Relationships for Carnivora are based primarily on various molecular data sets (Wayne et al., 1989, and references therein), supplemented by morphological and paleontological information (Kurten, 1964; Kurten & Anderson, 1980; Savage & Russell, 1983; Martin, 1989; Wozencraft, 1989). The mustelid-procyonid split is based on morphological and paleontological evidence presented in Baskin (1982, In press) and Wozencraft (1989).
Ungulate relationships are based primarily on cladistic analyses of morphological traits, supplemented by
Sprint Body Hind MTIF speed mass leg ratio (kmlh) (kg) (cm)
FIo . I . Best currently available estimates of phylogenetic relationships among 49 species of Carnivora and ungulates. ~ a t a for maximal sprint
running speed (km/h), body mass (kg), hind limb length (crn), and metatarsal/femur ratio are listed before species names (see text for ~ i ~ i ~ ~ of basal split between Carnivora (Ursidae, Procyonidae, Mustelidae, Canidae, Hyaenidae, Felidae) and ungulates
METATARSALIFEMUR RATIO A N D LOCOMOTION 137
molecular information, and with divergence times estimated from first fossil appearances (Hooijer, 1978; Bennett, 1980; Kurten & Anderson, 1980; Janis, 1982; Savage & Russell, 1983; Geist, 1987; Groves & Grubb, 1987; Janis & Scott, 1987; Lister, 1987; Prothero et al., 1988; Prothero & Schoch, 1989; Gentry, 1990, pers. comm.; Georgiadis et al., 1990; Miyamoto et al., 1990). Where molecular and paleontological evidence disagree as to divergence times, we have favoured the latter. The divergence of the camelids is based on Honey et al. (In press).
We recognize that hypothesized phylogenetic relationships are in a more-or-less constant state of flux, because systematics is an active area of research. Indeed, many of the details of our composite phylogeny (Fig. 1) are in dispute. Thus, it is important in phylogenetically-based comparative analyses to publish the actual phylogeny used (not to mention the phenotypic data), so that reanalysis is possible when enhanced (or alternative) phylogenetic information becomes available.
Statistical analyses
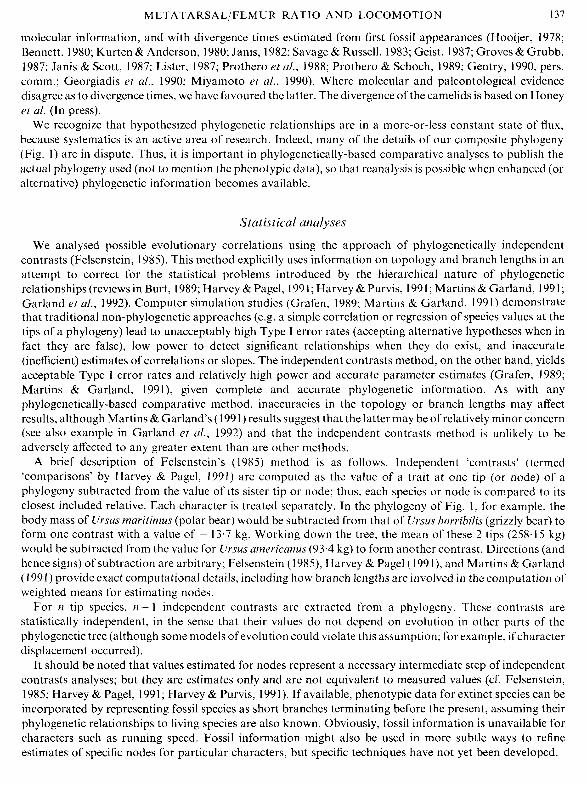
We analysed possible evolutionary correlations using the approach of phylogenetically independent contrasts (Felsenstein, 1985). This method explicitly uses information on topology and branch lengths in an attempt to correct for the statistical problems introduced by the hierarchical nature of phylogenetic relationships (reviews in Burt, 1989; Harvey & Pagel, 199 1 ; Harvey & Purvis, 199 1 ; Martins & Garland, 199 1; Garland et al., 1992). Computer simulation studies (Grafen, 1989; Martins & Garland, 1991) demonstrate that traditional non-phylogenetic approaches (e.g. a simple correlation or regression of species values at the tips of a phylogeny) lead to unacceptably high Type I error rates (accepting alternative hypotheses when in fact they are false), low power to detect significant relationships when they do exist, and inaccurate (inefficient) estimates of correlations or slopes. The independent contrasts method, on the other hand, yields acceptable Type I error rates and relatively high power and accurate parameter estimates (Grafen, 1989; Martins & Garland, 1991), given complete and accurate phylogenetic information. As with any phylogenetically-based comparative method, inaccuracies in the topology or branch lengths may affect results, although Martins & Garland's (1991) results suggest that the latter may be of relatively minor concern (see also example in Garland et al., 1992) and that the independent contrasts method is unlikely to be adversely affected to any greater extent than are other methods.
A brief description of Felsenstein's (1985) method is as follows. Independent 'contrasts' (termed 'comparisons' by Harvey & Pagel, 1991) are computed as the value of a trait at one tip (or node) of a phylogeny subtracted from the value of its sister tip or node; thus, each species or node is compared to its closest included relative. Each character is treated separately. In the phylogeny of Fig. 1, for example, the body mass of Ursus maritimus (polar bear) would be subtracted from that of Ursus horribilis (grizzly bear) to form one contrast with a value of - 13.7 kg. Working down the tree, the mean of these 2 tips (258.15 kg) would be subtracted from the value for Ursus americanus (93.4 kg) to form another contrast. Directions (and hence signs) of subtraction are arbitrary; Felsenstein (1985), Harvey & Page1 (1991), and Martins & Garland (1991) provide exact computational details, including how branch lengths are involved in the computation of weighted means for estimating nodes.
For n tip species, n- 1 independent contrasts are extracted from a phylogeny. These contrasts are statistically independent, in the sense that their values do not depend on evolution in other parts of the phylogenetic tree (although some models of evolution could violate this assumption; for example, if character displacement occurred).
It should be noted that values estimated for nodes represent a necessary intermediate step of independent contrasts analyses; but they are estimates only and are not equivalent to measured values (cf. Felsenstein, 1985; Harvey & Pagel, 1991 ; Harvey & Purvis, 199 1). If available, phenotypic data for extinct species can be incorporated by representing fossil species as short branches terminating before the present, assuming their phylogenetic relationships to living species are also known. Obviously, fossil information is unavailable for characters such as running speed. Fossil information might also be used in more subtle ways to refine estimates of specific nodes for particular characters, but specific techniques have not yet been developed.
138 T. GARLAND AND C. M . JANIS
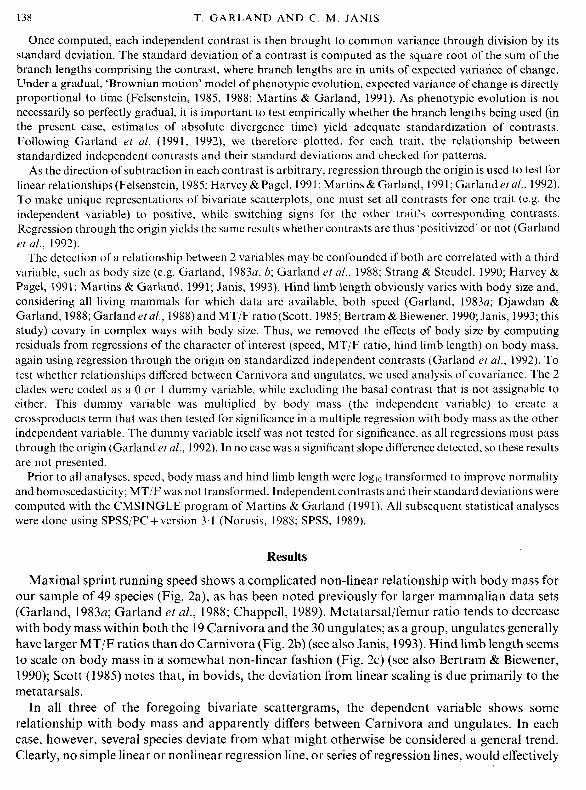
Once computed, each independent contrast is then brought to common variance through division by its standard deviation. The standard deviation of a contrast is computed as the square root of the sum of the branch lengths comprising the contrast, where branch lengths are in units of expected variance of change. Under a gradual, 'Brownian motion' model of phenotypic evolution, expected variance of change is directly proportional to time (Felsenstein, 1985, 1988; Martins & Garland, 1991). As phenotypic evolution is not necessarily so perfectly gradual, it is important to test empirically whether the branch lengths being used (in the present case, estimates of absolute divergence time) yield adequate standardization of contrasts. Following Garland et al. (1991, 1992), we therefore plotted, for each trait, the relationship between standardized independent contrasts and their standard deviations and checked for patterns.
As the direction of subtraction in each contrast is arbitrary, regression through the origin is used to test for linear relationships (Felsenstein, 1985; Harvey & Pagel, 1991; Martins & Garland, 199 1; Garland et al., 1992). To make unique representations of bivariate scatterplots, one must set all contrasts for one trait (e.g. the independent variable) to positive, while switching signs for the other trait's corresponding contrasts. Regression through the origin yields the same results whether contrasts are thus 'positivized' or not (Garland et al., 1992).
The detection of a relationship between 2 variables may be confounded if both are correlated with a third variable, such as body size (e.g. Garland, 1983a, 6; Garland et al., 1988; Strang & Steudel, 1990; Harvey & Pagel, 1991; Martins & Garland, 1991; Janis, 1993). Hind limb length obviously varies with body size and, considering all living mammals for which data are available, both speed (Garland, 1983a; Djawdan & Garland, 1988; Garland et al., 1988) and MT/F ratio (Scott, 1985; Bertram & Biewener, 1990; Janis, 1993; this study) covary in complex ways with body size. Thus, we removed the effects of body size by computing residuals from regressions of the character of interest (speed, MT/F ratio, hind limb length) on body mass, again using regression through the origin on standardized independent contrasts (Garland et al., 1992). To test whether relationships differed between Carnivora and ungulates, we used analysis of covariance. The 2 clades were coded as a 0 or 1 dummy variable, while excluding the basal contrast that is not assignable to either. This dummy variable was multiplied by body mass (the independent variable) to create a crossproducts term that was then tested for significance in a multiple regression with body mass as the other independent variable. The dummy variable itself was not tested for significance, as all regressions must pass through the origin (Garland et al., 1992). In no case was a significant slope difference detected, so these results are not presented.
Prior to all analyses, speed, body mass and hind limb length were loglo transformed to improve normality and homoscedasticity; MT/F was not transformed. Independent contrasts and their standard deviations were computed with the CMSINGLE program of Martins & Garland (1991). All subsequent statistical analyses were done using SPSS/PC + version 3.1 (Norusis, 1988; SPSS, 1989).
Results
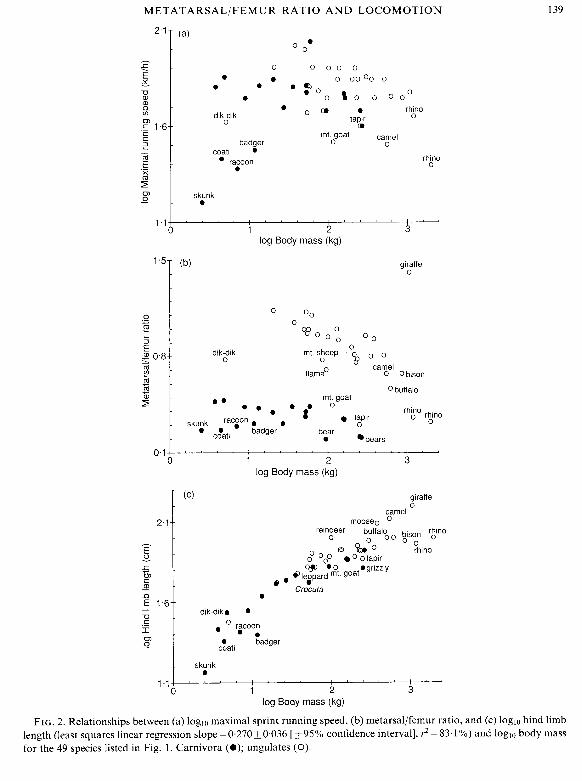
Maximal sprint running speed shows a complicated non-linear relationship with body mass for our sample of 49 species (Fig. 2a), as has been noted previously for larger mammalian data sets (Garland, 1983a; Garland et al., 1988; Chappell, 1989). Metatamallfemur ratio tends to decrease with body mass within both the 19 Carnivora and the 30 ungulates; as a group, ungulates generally have larger MT/F ratios than do Carnivora (Fig. 2b) (see also Janis, 1993). Hind limb length seems to scale on body mass in a somewhat non-linear fashion (Fig. 2c) (see also Bertram & Biewener, 1990); Scott (1985) notes that, in bovids, the deviation from linear scaling is due primarily to the metatarsals.
In all three of the foregoing bivariate scattergrams, the dependent variable shows some relationship with body mass and apparently differs between Carnivora and ungulates. In each case, however, several species deviate from what might otherwise be considered a general trend. Clearly, no simple linear or nonlinear regression line, or series of regression lines, would effectively
METATARSALIFEMUR RATIO A N D LOCOMOTION
. 0 0 ) . rhino tapir 0 a,
skunk . log Body mass (kg)
dik-dik 0
. . ... . skunk
. badger coat1
giraffe 0
Oo
9 0 0 ; 0,
mt. sheep
camel llama0 0 0 bison
0 buffalo mt. goat
Z O tapir rhino rhino
O 0
bear .bears
o . l ! m m a L : ~ ~ ~ ~ : m n c n : " 0 1 2 3
log Body mass (kg)
. racoon . badger
coati
0 camel
moose0 O reindeer buffaloo bison rhino
0 0 O rhino
c? OoO 0 o tapir
Olezar:$t. goategrizzly
Crocuta
FIG. 2. Relationships between (a) loglo maximal sprint running speed, (b) metarsallfemur ratio, and (c) loglo hind limb length (least squares linear regression slope = 0.270 f 0.036 [+ 95% confidence interval], r2 = 83.1 %) and loglo body mass for the 49 species listed in Fig. 1. Carnivora (0); ungulates (0).
1.1
- skunk
" " ~ " " : " ' " " 0 1 2 3
log Body mass (kg)
140 T. GARLAND A N D C. M . JANIS
remove confounding effects of body size or of phylogenetic affinity. Given these patterns and the known deficiencies of nonphylogenetic analyses, we do not attempt any. We do note, however, that the difference in MT/F ratio (Fig. 2b) but similarity in maximal running speed (Fig. 2a) between Carnivora and ungulates suggests no absolute association between these two traits.
Phylogenetic analyses
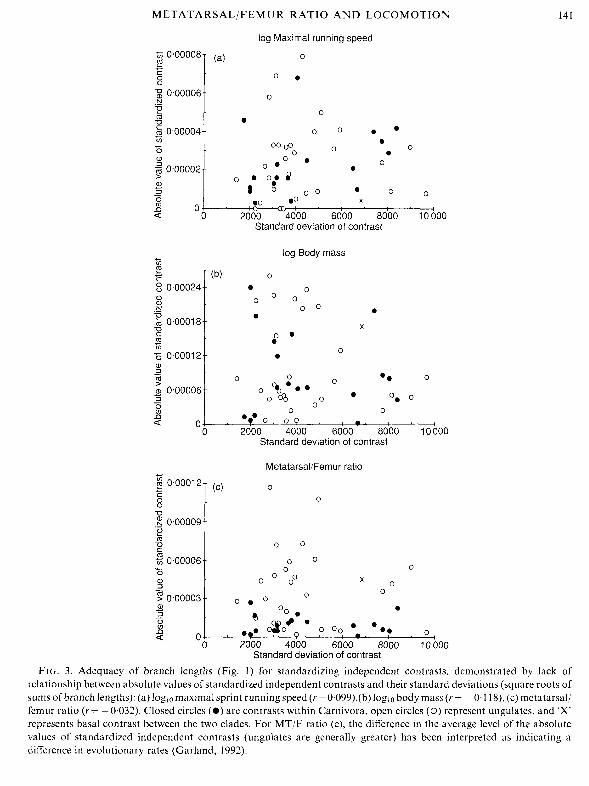
Whether the branch lengths depicted in Fig. 1 serve adequately for standardization of independent contrasts can be checked by plotting, for each character, the absolute values of its standardized independent contrasts versus their standard deviations (i.e. the square root of the sum of its branch lengths). For none of the traits being analysed did these plots indicate any significant trends (Fig. 3). Thus, the branch lengths of Fig. 1 adequately standardized the independent contrasts, and correlations based on them can be tested for significance in the usual way (Felsenstein, 1985; Martins & Garland, 1991; Garland et al., 1991, 1992). Note that standardized independent contrasts are ratios representing amount of change per unit square root of time (a type of evolutionary rate; Garland, 1992), and cannot be interpeted simply as amount of change. Given this interpretation, MT/F ratio seems on average to evolve more rapidly in ungulates than in Carnivora (Fig. 3c) (Garland, 1992), a conclusion also reached for fossil record data (Bakker, 1983; Janis, 1993).
Figure 4 depicts bivariate relationships of each trait with body mass, using standardized independent contrasts. Thus, Fig. 4 is a phylogeny-corrected representation of Fig. 2. Contrasts in speed are uncorrelated with contrasts in body mass, which agrees with previous nonphylogenetic analyses of restricted groups of mammals (Garland, 1983a; Djawdan & Garland, 1988; Garland et al., 1988). In contrast to Fig. 2b, Fig. 4b indicates no significant evolutionary covariation between MT/F ratio and body mass for the entire data set (n = 48 contrasts, r = 0.108,2-tailed P = 0.4622), within the ungulates (n = 29, r = - 0.130, P = 0.4937), or within the Carnivora (n = 18, r = - 0.379, P = 0.1093). The scaling exponents for hind limb length are similar for nonphylogenetic and phylogenetic regressions (cf. legends of Figs 2c and 4c), although the confidence interval for the former cannot be trusted.
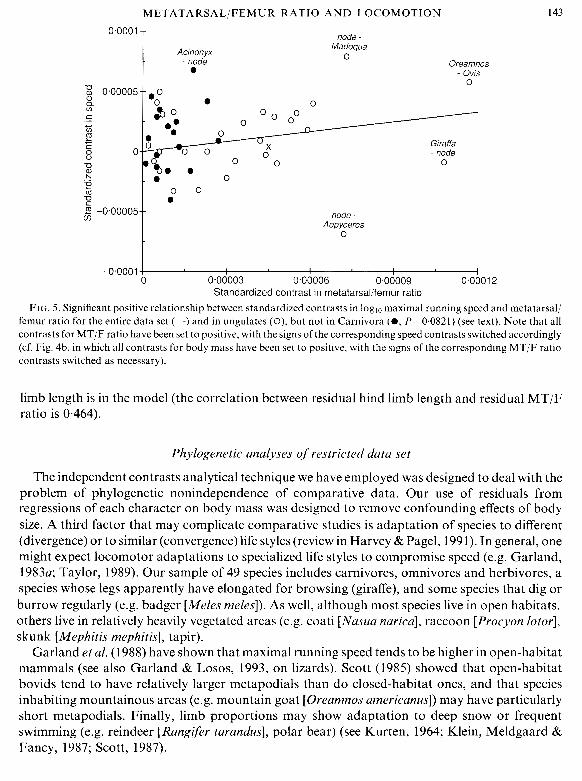
As neither speed nor MT/F ratio varies in any simple way with body mass (Figs 4a, b), it may be unnecessary to analyse residuals from regressions on body mass. A plot of standardized independent contrasts (Fig. 5) shows a significant relationship between speed and MT/F ratio for the entire data set (n = 48 contrasts, r = 0.339, 2-tailed P = 0.01721) and within the ungulates (n = 29, r = 0.367, P = 0.0459), but not within the Carnivora (n = 18, r = 0.409,2-tailed P = 0.0821).
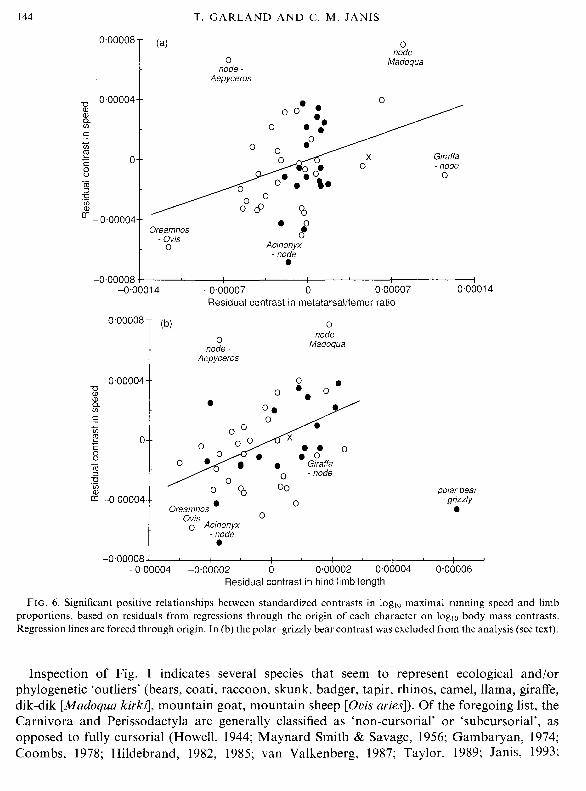
Analysing residuals from regressions through the origin of each character on body mass yields slightly stronger correlations (Fig. 6a). The relationship is significant for the entire data set (n = 48 contrasts; solid line in Fig. 6a is regression through the origin), within the ungulates (n = 29), and within the Carnivora (n = 18) (Table I).
Figure 6b indicates a generally positive relationship between residual standardized indepen- dent contrasts in speed and hind limb length. The contrast between the polar bear (Ursus maritimus) and the grizzly bear (U. horribilis=arctos) is an outlier, reflecting the fact that polar bears have considerably longer legs but are slower (40 vs. 48 km/h). Omitting the polar-grizzly contrast, the relationship is significant for the entire data set (n=47 contrasts), within the Carnivora (n = 17), and marginally significant within the ungulates alone (n = 29) (Table I). A stepwise multiple regression analysis of the 47-contrast data set indicates that residual MT/F ratio does not add significantly (partial r2 = 3.0%, P= 0.1 975) to prediction of speed once residual hind
METATARSALIFEMUR RATIO A N D LOCOMOTION
log Maximal running speed
Standard deviation of contrast
Standard deviation of contrast
MetatarsalIFemur ratio
Standard deviation of contrast
FIG. 3. Adequacy of branch lengths (Fig. 1) for standardizing independent contrasts, demonstrated by lack of relationship between absolute values of standardized independent contrasts and their standard deviations (square roots of sums of branch lengths): (a) loglo maximal sprint running speed (r = 0.099),(b) loglo body mass (r = - 0.1 18), (c) metatarsal/ femur ratio (r = -0.032). Closed circles (*) are contrasts within Carnivora, open circles (0) represent ungulates, and 'X' represents basal contrast between the two clades. For MT/F ratio (c), the difference in the average level of the absolute values of standardized independent contrasts (ungulates are generally greater) has been interpreted as indicating a difference in evolutionary rates (Garland, 1992).
node - node - Aepyceros o 0 Madoqua
Cervus - Darna
0
t node - Acinonyx
- 0~0001~ I , I I - : a ; 0 0.00005 0.0001 0.00015 0.0002 0.00025
FIG. 4. Bivariate relationships of standardized independent contrasts (n=48) within Carnivora (0; n = 18) and ungulates (0; n = 29) ('X' represents basal contrast between these two clades): (a) loglo maximal running speed and loglo body mass, (b) metatarsal/femur ratio and loglo body mass, (c) scaling of hind limb length on body mass (least squares linear regression slope = 0.250 k 0.040; r2 = 77.1 %I). Note that this regression equation is forced through the origin; thus, the deviant bear contrast has little effect on the slope, as it is near the origin, although it does lower the coefficient of determination.
METATARSALIFEMUR RATIO A N D LOCOMOTION
Acinonyx - node
node Madoqua
0 Oreamnos
- ovis 0
- 0 @o 0
Gira ffa - node
0
node - Aepyceros
0
I I 1 -0.0001 1 I I 0 0.00003 0.00006 0.00009 0.0001 2
Standardized contrast in metatarsalifemur ratio
FIG. 5. Significant positive relationship between standardized contrasts in loglo maximal running speed and metatarsal/ femur ratio for the entire data set (-) and in ungulates ( O ) , but not in Carnivora (e, P=0.0821) (see text). Note that all contrasts for MT/F ratio have been set to positive, with the signs of the corresponding speed contrasts switched accordingly (cf. Fig. 4b, in which all contrasts for body mass have been set to positive, with the signs of the corresponding MT/F ratio contrasts switched as necessary).
limb length is in the model (the correlation between residual hind limb length and residual MT/F ratio is 0.464).
Phylogenetic analyses of restricted data set
The independent contrasts analytical technique we have employed was designed to deal with the problem of phylogenetic nonindependence of comparative data. Our use of residuals from regressions of each character on body mass was designed to remove confounding effects of body size. A third factor that may complicate comparative studies is adaptation of species to different (divergence) or to similar (convergence) life styles (review in Harvey & Pagel, 1991). In general, one might expect locomotor adaptations to specialized life styles to compromise speed (e.g. Garland, 1983a; Taylor, 1989). Our sample of 49 species includes carnivores, omnivores and herbivores, a species whose legs apparently have elongated for browsing (giraffe), and some species that dig or burrow regularly (e.g. badger [Mcles meles]). As well, although most species live in open habitats, others live in relatively heavily vegetated areas (e.g. coati [Nasua narica], raccoon [Procyon lotor], skunk [Mephitis mephitis], tapir).
Garland et al. (1 988) have shown that maximal running speed tends to be higher in open-habitat mammals (see also Garland & Losos, 1993, on lizards). Scott (1985) showed that open-habitat bovids tend to have relatively larger metapodials than do closed-habitat ones, and that species inhabiting mountainous areas (e.g. mountain goat [Oreamnos americanus]) may have particularly short metapodials. Finally, limb proportions may show adaptation to deep snow or frequent swimming (e.g. reindeer [Rangifer tarandus], polar bear) (see Kurten, 1964; Klein, Meldgaard & Fancy, 1987; Scott, 1987).
T. GARLAND AND C. M . JANIS
0 node -
Aepyceros
0 node -
Madoqua
Gira ffa - node
0
Orearnnos - ovis
0 ~ c i n o n ~ i - node
-0.00008 1 I I I I I I
-0.0001 4 -0.00007 0 0.00007 0.0001 4 Residual contrast in metatarsallfemur ratio
0.00008 (b)
1 0
0 node -
node - Madoqua
Aepyceros
0 . 0 . 0 0 0 0 ° @ ' • G%fa •
- node 0
0 0 0 0
Oreamnos . 0
- Ovis 0 0 Acinonyx
- node . polar bear
- grizzly . -0.00008 1 I I a I I I I I I I
-0.00004 -0.00002 0 0.00002 0.00004 0.00006 Residual contrast in hind limb length
FIG. 6. Significant positive relationships between standardized contrasts in loglo maximal running speed and limb proportions, based on residuals from regressions through the origin of each character on loglo body mass contrasts. Regression lines are forced through origin. In (b) the polar-grizzly bear contrast was excluded from the analysis (see text).
Inspection of Fig. 1 indicates several species that seem to represent ecological and/or phylogenetic 'outliers' (bears, coati, raccoon, skunk, badger, tapir, rhinos, camel, llama, giraffe, dik-dik [Madoqua kirki], mountain goat, mountain sheep [Ovis aries]). Of the foregoing list, the Carnivora and Perissodactyla are generally classified as 'non-cursorial' or 'subcursorial', as opposed to fully cursorial (Howell, 1944; Maynard Smith & Savage, 1956; Gambaryan, 1974; Coombs, 1978; Hildebrand, 1982, 1985; van Valkenberg, 1987; Taylor, 1989; Janis, 1993;
METATARSALIFEMUR RATIO A N D LOCOMOTION
T A B L E I
Correlation coclfficient.~ (computed tlzrough the origin) ,for,full and restricted data sets
Sample, rz of Speed and MT/F ratio Speed and Hind limb length independent contrasts r 2-tailed P r 2-tailed P
Full data set (49 species) All, 48* Ungulates, 29 Carnivora, 18*
Restricted data set (32 species) All, 3 1 Ungulates, 19 Carnivora, 11
Fig. 6a 0.345 0.01 53 0.372 0.0429 0.469 0.0427
Fig. 7a 0.269 0.1359 0.223 0.3437 0,504 0.0945
Fig. 6b 0.425 0.0026 0.348 0.0596 0.582 0.01 13
Fig. 7b 0.396 0.0247 0.366 0.1 122 0.434 0.1582
* Omitting polar-grizzly bear contrast for hind limb correlations (see Fig. 6b).
references therein). Camels differ from other ungulates in their acquisition of a secondarily digitigrade foot posture, and their limb proportions scale differently from ruminants (Janis, 1993). Inspection of Figs 4-6, representing phylogenetically independent contrasts, also indicates some data points that deviate from the general pattern (in particular, contrasts involving Ursus maritimus, Aepyceros, Girafla, Madoqua, Oreamnos). Accordingly, we have removed the foregoing 17 species from the phylogenetic tree, and repeated the entire independent contrasts analysis for 32 fully cursorial species. The plots shown in Fig. 3, and discussed above, were similar for 32 species (not shown), indicating that the branch lengths of the modified phylogeny are adequate for standardizing the independent contrasts.
When reanalysed and redrawn for 32 species, figures (not shown) were similar to Fig. 4a and c; speed does not covary with body mass, and hind limb scales with an exponent of 0,232 k0.042 ( k 95% confidence interval; r2 = 81.4%). The redrawn Fig. 4b (not shown), however, indicates a clearer negative scaling (cf. Fig. 2b) of MT/F ratio (n = 3 1 contrasts, r = 0-390,2-tailed P = 0.0273); this difference is due largely to removal of the contrasts involving the dik-dik and the giraffe (cf. Fig. 4b).
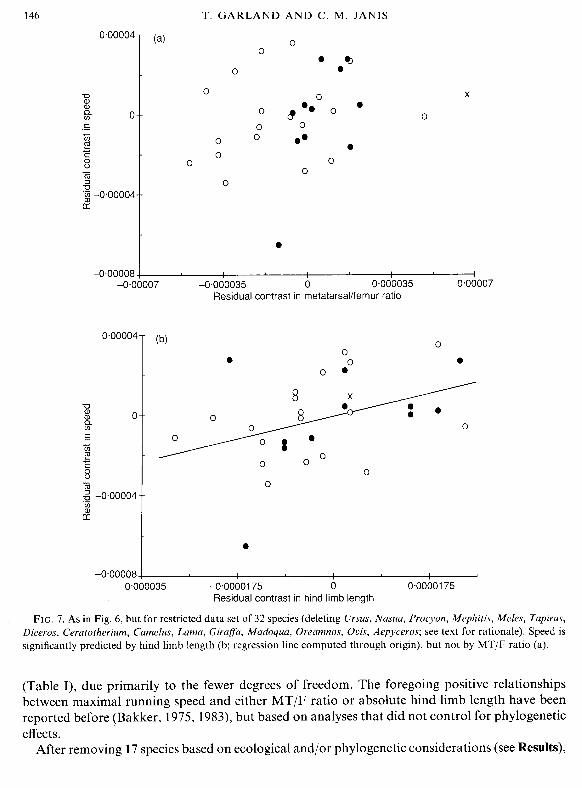
Analysing residuals from regressions through the origin of each character on body mass indicates no significant relationship between speed and MT/F (Fig. 7a: Table I) for the entire data set (n = 31 contrasts), within the ungulates (n = 19), or within the Carnivora (n = 11). The relationship between speed and hind limb length, however, is significant for the entire data set, although not within the ungulates or Carnivora alone (Fig. 7b; Table I). A stepwise multiple regression analysis indicates that residual MT/F ratio does not add significantly (partial r2 = 4.1 %, P= 0.2348) to prediction of speed once residual hind limb length is in the model (the correlation between residual hind limb length and residual MT/F ratio is 0.179).
Discussion
With the effects of phylogeny and of body size controlled, the traditional morphometric indicator of cursoriality, metatarsallfemur ratio, is a significant predictor of maximal running speed within a combined sample of 19 Carnivora and 30 ungulates (Fig. 6a; r2 = 1 1.9%). Hind limb length also predicts running speed (Fig. 6b), at least if the contrast involving the long-legged polar bear is removed from consideration (r2 = 18.1 %). Relationships within Carnivora and ungulates appear similar (Figs 6, 7), although statistical significance is reduced in the smaller subsamples
T. GARLAND AND C . M. JANIS
-0.00008 1 I , I I I I I -0.00007 -0.000035 0 0.000035 0.00007
Residual contrast in metatarsal/femur ratio
-0.000035 -0.0000175 0 0.0000175 Residual contrast in hind limb length
FIG. 7. As in Fig. 6, but for restricted data set of 32 species (deleting Ursus, Nasua, Procyon, Mephitis, Meles, Tapirus, Diceros, Ceratotherium, Camelus, Lama, Girafa, Madoqua, Oreamnos, Ovis, Aepyceros; see text for rationale). Speed is significantly predicted by hind limb length (b; regression line computed through origin), but not by MT/F ratio (a).
(Table I), due primarily to the fewer degrees of freedom. The foregoing positive relationships between maximal running speed and either MT/F ratio or absolute hind limb length have been reported before (Bakker, 1975, 1983), but based on analyses that did not control for phylogenetic effects.
After removing 17 species based on ecological and/or phylogenetic considerations (see Results),
METATARSALIFEMUR RATIO A N D LOCOMOTION 147
the magnitude of correlations of speed with MT/F ratio or with hind limb length were reduced in four of six cases and the level of statistical signficance was reduced in all six cases (see Table I). Both of these effects are to be expected because: (1) the ranges of the independent variables were reduced by removing 'extreme' species; and (2) sample size was reduced. The lack of significant correlation between speed and MT/F ratio within cursorial forms is in accord with Janis's (1993) nonphylogenetic analysis of a similarly-restricted data set.
Regardless of which subset of the data is analysed (Table I), correlations between speed and either MT/F ratio or hind limb length (corrected for body size) are always positive, with coefficients of determination ranging from 5-34(% (average r2 = 16.4%). Such predictive power is arguably of biological significance. Moreover, we have judged statistical significance with 2-tailed tests; this is a conservative procedure, given that the a priori hypotheses are for positive correlations between speed and either MT/F ratio or relative hind limb length.
Although MT/F ratio has often been used for predictive purposes, our analyses indicate that hind limb length (corrected for body size) is if anything a slightly better predictor of maximal running speed (Table I, Figs 6, 7, results of stepwise multiple regression analyses). One of the reasons that the MT/F ratio has been favoured by paleontologists is that it requires fewer bones to have been preserved. Another is the presumption that MT/F ratio varies less with body size than does absolute leg length. However, both nonphylogenetic depictions and phylogenetic analyses indicate that MT/F ratio may covary with body size in complicated ways (see Results, Figs 2b, 4b).
Increases in MT/F ratio over evolutionary time in carnivores and herbivores have been taken as indicative of increases in maximum running speeds reflecting a predatorlprey 'arms race' (Bakker, 1983; Janis, 1993). Yet it is clear that MT/F ratio alone will not provide precise information about maximal running speed, nor enable the determination of whether an extinct carnivore was capable of fast pursuit (see also Wilhelm & Janis, 1990). Additionally, the North American fossil record does not provide supporting evidence for the coevolution of relative limb lengths in carnivores and ungulates (Janis, 1993). A high MT/F ratio does have some broad-scale predictive utility in distinguishing animals capable of relative fast running from those less capable (e.g. skunk, badger). In the fossil record, it may indeed indicate general changes in locomotor abilities within lineages (Bakker, 1983; Janis, 1993). However, this predictive relationship may break down in specific cases within cursorial clades, such as where limb proportions have evolved for reasons other than speed (e.g. giraffe).
Why do hind limb length and proportions only roughly predict maximal running speeds? First, as discussed previously (Alexander et al., 1977; Garland, 1983a; Garland et al., 1988; Alexander, 1991: see Methods), the available data for maximal running speeds of large mammals are of variable quality. In addition, estimation of body mass introduces additional errors; masses of animals timed in the field are generally unknown, and museum specimens rarely include mass data. Given such 'noise' in the available data, it is perhaps surprising that we are able to show any significant correlations with limb proportions! Thus, the predictive abilities we report herein (i.e. r2=5-34%) should be considered as underestimating the strength of the true functional relationships. More accurate estimates of maximal running speeds and body masses are possible for small mammals (Djawdan & Garland, 1988; Garland et al., 1988), some of which are fully cursorial (e.g. kangaroo rats, although ricochetal locomotion represents a different type of cursorial adaptation than seen in the mammals considered herein).
Secondly, absolute limb length per se is an imperfect indicator (Pennycuick, 1975; Coombs, 1978; Garland, 1985; Alexander, 1989) of the functionally important variable-stride length- which is considerably more difficult to measure (Alexander et al., 1977; Strang & Steudel, 1990).
148 T. G A R L A N D A N D C . M . JANIS
Nonetheless, a positive relationship between size-corrected hind limb length and maximal running speed exists among species of lizards (Losos, 1990; see also Garland & Losos, 1993), and theoretical and empirical surveys have identified absolute limb length as an important component of cursorial adaptations (e.g. Howell, 1944; Gambaryan, 1974; Coombs, 1978; Hildebrand, 1982; Alexander, 1989). Strang & Steudel (1990) argue that absolutely longer limbs may lead to lower costs of transport; such an effect could also contribute to speed. For some of the species included in our study, limb length may partly reflect selection pressures for locomotion in snow and/or frequent swimming (Kurten, 1964; Klein et al., 1987; Scott, 1987; Dailey & Hobbs, 1989).
Thirdly, variation in locomotor capacities is related to many other traits besides limb bone lengths or proportions (cf. Alexander, 199 1). For example, Coombs (1 978: 406) listed at least eight different aspects of morphology that 'would be expected in most cursors'. The fact that Carnivora and ungulates of similar size attain similar top speeds (Fig. 2a) and have similar relative limb lengths (Fig. 2c)-but have very different MT/F ratios (Fig. 2b) (see also Alexander et al., 1979)- indicates multiple solutions to the adaptive 'problem' of how to run fast. Thus, perhaps variation in muscle masses or physiology (e.g. fibre types, contactile properties: cf. Gleeson & Harrison, 1988; Marsh, 1988) or in limb postures (Biewener, 1990) accounts for substantially more of the variation in maximal running speed than does simple morphometric variation in the hind limb (cf. Garland, 1983a, 1985 on the scaling of morphology versus performance). The slow top speed of skunks, for example, is reflected in their muscle fibre compositions (Garland, 1983a, references therein).
In closing, it should be noted that we have tested for correlations between limb proportions and only one aspect of locomotor performance. Perhaps MTjF ratio is a better predictor of other aspects of 'cursoriality' (Coombs, 1978; Hildebrand, 1982), such as stamina (Garland et al., 1988; Janis, 1993) or energetic costs of locomotion (cf. Pennycuick, 1979; John-Alder et al., 1986; Dailey & Hobbs, 1989; Biewener, 1990; Full, Zaccarello & Tullis, 1990; Kram & Taylor, 1990; Steudel, 1990; Strang & Steudel, 1990). Garland et al. (1988) showed that at least two aspects of cursorial abilities-maximal sprint running speed and maximal aeorobic speed (the speed at which the maximal rate of oxygen consumption is attained)-are uncorrelated in a sample of 18 species of mammals. Thus, underlying morphological (or physiological) traits might affect speed but not stamina, or vice versa (cf. Garland, 1984, 1985; Garland & Else, 1987). From a more ecological perspective, Janis (1993) presents preliminary data showing a positive correlation between MT/F ratio and home range size in ungulates, suggesting a connection between limb proportions and long-term locomotor costs (see also Garland, 1983h; Bunnell & Harestad, 1990). Resolution of these and other possibilities must await the availability of further data on other aspects of locomotor performance, morphology and physiology, as well as information concerning phylogenetic relationships (see also Alexander, 199 1).
We thank P. B. Wilhelm for providing information on limb lengths, M. Rutzmoser at the Museum of Comparative Zoology and G. Musser at the American Museum of Natural History for facilitating access to specimens in their curation, J. A. Jones for computer programing and helpful discussions, and A. R. Ives, R. E. Jung, K. L. Steudel, and an anonymous reviewer for comments on this or earlier versions of the manuscript. Partially supported by U.S. National Science Foundation grants BSR-9006083, BSR-9146864 (Research Experiences for Undergraduates), and BSR-9 157268 (Presidential Young Investigator Award) to TG.
REFERENCES
Alexander, R. McN. (1989). Dynamics of dino,saurs and other extinct giants. New York: Columbia University Press. Alexander, R. McN. (1991). Apparent adaptation and actual performance. Euol. Biol. 25: 357-373.
METATARSALIFEMUR RATIO A N D LOCOMOTION 149
Alexander, R. McN., Jayes, A. S., Maloiy, G . M. 0 . & Wathuta, E. M. (1979). Allometry of the limb bones of mammals from shrews (Sorex) to elephant (Loxodonta). J. Zool., Lond. 189: 305-314.
Alexander, R. McN., Langman, V. A. & Jayes, A. S. (1977). Fast locomotion of some African ungulates. J. Zool., Lond. 183: 29 1-300.
Bakker, R. T . (1975). Experimental and fossil evidence for the evolution of tetrapod bioenergetics. In Perspectices of biophysicul ecology: 396-418. Gates, D. M. & Schmerl, R. B. (Eds). New York: Springer-Verlag.
Bakker, R. T. (1983). The deer flees, the wolf pursues: incongruencies in predator-prey coevolution. In Coevolution: 350- 382. Futuyma, D. J. & Slatkin, M. (Eds). Sunderland, Mass.: Sinauer Assoc. Inc.
Baskin, J. A. (1982). Tertiary Procyonidae (Mammalia: Carnivora) of North America. J. Vert. Paleont. 2: 71-93. Baskin, J. A. (In press). Musteloidea. In Evolution of Tertiary mammals of North America. Janis, C. M., Scott, K. M. &
Jacobs, L. L. (Eds). Cambridge: Cambridge University Press. Bennett, D. K. (1980). Stripes do not a zebra make. Syst. Zool. 29: 272-287. Bertram, J. E. A. & Biewener, A. A. (1990). Differential scaling of the long bones in the terrestrial Carnivora and other
mammals. J. Morph. 204: 157-169. Biewener, A. A. (1990). Biomechanics of mammalian terrestrial locomotion. Science, Wash. 250: 1097-1 103. Bunnell, F. L. & Harestad, A. S. (1990). Activity budgets and body weight in mammals: How sloppy can mammals be? In
Current mummalogy 2: 245-305. Genoways, H. H. (Ed.). New York: Plenum. Burt, A. (1989). Comparative methods using phylogenetically independent contrasts. Oxj: Surv. Evol. Biol. 6: 33-53. Chappell, R. (1989). Fitting bent lines to data, with applications to allometry. J. theor. Biol. 138: 235-256. Coombs, W. P., Jr (1978). Theoretical aspects of cursorial adaptations in dinosaurs. Q. Rez3. Biol. 53: 398-418. Dailey, T. V. & Hobbs, N. T. (1 989). Travel in alpine terrain: energy expenditures for locomotion by mountain goats and
bighorn sheep. Can. J. Zool. 67: 2368-2375. Djawdan, M. & Garland, T., Jr (1988). Maximal running speeds of bipedal and quadrupedal rodents. J. Mammul. 69: 765-
772. Felsenstein, J. (1985). Phylogenies and the comparative method. Am. Nut. 125: 1-15. Felsenstein, J . ( 1988). Phylogenies and quantitative characters. A. Reo. Ecol. Syst. 19: 445-47 1. Full, R. J., Zuccarello, D. A. & Tullis, A. (1990). Effect of variation in form on the cost of terrestrial locomotion. J. exp.
Biol. 150: 233-246. Gambaryan, P. P. (1974). H O M ~ man~ma1.s run. New York: John Wiley & Sons. Garland, T., Jr (1983~). The relation between maximal running speed and body mass in terrestrial mammals. J. Zool.,
Lond. 199: 157-170. Garland, T., Jr (1983b). Scaling the ecological cost of transport to body mass in terrestrial mammals. Am. Nut. 121: 571-
587. Garland, T., Jr (1984). Physiological correlates of locomotory performance in a lizard: an allometric approach. Am. J.
Physiol. 247: R806-R8 15. Garland, T., Jr (1985). Ontogenetic and individual variation in size, shape and speed in the Australian agamid lizard
Amphibolurus nuchalis. J . Zool., Lond. ( A ) 207: 425-439. Garland, T., Jr (1992). Rate tests for phenotypic evolution using phylogenetically independent contrasts. Am. Nut. 140:
509-5 19. Garland, T., Jr & Else, P. L. (1987). Seasonal, sexual, and individual variation in endurance and activity metabolism in
lizards. Am. J. Physiol. 252: R439-R449. Garland, T., Jr, Geiser, F. & Baudinette, R . V. (1988). Comparative locomotor performance of marsupial and placental
mammals. J. Zool., Lond 215: 505-522. Garland, T., Jr, Harvey, P. H. & Ives, A. R. (1992). Procedures for the analysis of comparative data using phylogenetically
independent contrasts. Sy,rt. Biol. 41: 18-32. Garland, T., Jr, Huey, R. B. & Bennett, A. F. (1991). Phylogeny and thermal physiology in lizards: a reanalysis. Evolution
45: 1969- 1975. Garland, T., Jr & Losos, J . B. (1993). Ecological morphology of locomotor performance in reptiles. In Ecological
rnorphologj: integrutizx. orguni.rnzu1 biology. Wainwright, P. C. & Reilly, S. M. (Eds). Chicago: University of Chicago Press. (In press).
Geist, V. (1987). On the evolution of the Caprinae. In The hiologj1 and management of Capvicovnis and related mountain antelopes: 3---40. Soma, H. (Ed.). London: Croom Helm.
Gentry, A. W. (1990). Evolution and dispersal of the African Bovidae. In Horns, pronghorns, and antlers. Evolution, morphology; physiology and sociul .signlficunce: 195--230. Bubenik, G. A. & Bubenik, A. B. (Eds). New York: Springer-Verlag.
150 T . G A R L A N D A N D C. M . JANIS
Georgiadis, N. J., Kat, P. W., Oketch, H. & Patton, J. (1990). Allozyme divergence within the Bovidae. Evolution 44: 2135- 2 149.
Gleeson, T. T. & Harrison, J. M. (1988). Muscle composition and its relation to sprint running in the lizard Dipsosauru.s dorsalis. Am. J. Physiol. 255: R470-R477.
Grafen, A. (1989). The phylogenetic regression. Phil. Trans. R. Soc. ( B ) 326: 119-157. Groves, C. P. & Grubb, P. (1987). Relationships of living deer. In Biology and management of the Cervidae: 21-59.
Wemmer, C. M. (Ed.). Washington, D.C.: Smithsonian Institution Press. Harvey, P. H. & Pagel, M. D. (1991). The comparative method in evolutionary biologjl. Oxford: Oxford University Press. Harvey, P. H. & Purvis, A. (1991). Comparative methods for explaining adaptations. Nature, Lond. 351: 619-624. Hildebrand, M. (1982). Analysis of zlertebrate structure. 2nd edn. New York: John Wiley & Sons. Hildebrand, M. (1985). Walking and running. In Functional vertebrate morphology: 38-57. Hildebrand, M . , Bramble,
D. M., Liem, K. F. & Wake, D. B. (Eds). Cambridge, Mass.: Belknap, Harvard. Hildebrand, M., Bramble, D. M., Liem, K. F. & Wake, D. B. (Eds) (1985). Functional vertebrate morphology. Cambridge,
Mass.: Belknap, Harvard. Honey, J. G., Harrison, J. A., Prothero, D. R. & Stevens, M. S. (In press). Camelidae. In Euolution of Tertiary mammals of
North America. Janis, C. M., Scott, K. M. & Jacobs, L. L. (Eds). Cambridge: Cambridge University Press. Hooijer, D. A. (1978). Rhinoceratidae. In Evolution of African mammals: 371-378. Maglio, V . J. & Cooke, H. B. S. (Eds).
Cambridge, Mass.: Harvard University Press. Howell, A. B. (1944). Speed in animals. Chicago: Chicago University Press. Janis, C. M. (1982). Evolution of horns in ungulates: ecology and paleoecology. Biol. Rev. 57: 261-318. Janis, C. M. (1993). Do legs support the arms race hypothesis in mammalian predator/prey relationships? In Vertebrate
behat)iour us derivedfrom the fossil record. Horner, J . R. & Ellis, L. (Eds). New York: Columbia University Press. (In press).
Janis, C. M. & Scott, K. M. (1987). The interrelationships of higher ruminant families, with especial emphasis on the members of the Cervidae. Am. Mus. Noz'it. 2893: 1-85.
John-Alder, H. B., Garland, T., Jr & Bennett, A. F. (1986). Locomotory capacities, oxygen consumption, and the cost of locomotion of the shingle-back lizard (Trachydo,saurus rugosus). Physiol. 2001. 59: 523-53 1.
Klein, D. R., Meldgaard, M. & Fancy, S. G. (1987). Factors determining leg length in Rangifer tarandu.~. J. Mammal. 68: 642-655.
Kram, R. & Taylor, C. R. (1990). Energetics of running: a new perspective. Nature, Lond. 346: 265-267. Kurten, B. (1964). The evolution of the polar bear, Ursus rnaritimus Phipps. Acta zool.,fenn. 108: 1- 126. Kurten, B. & Anderson, E. (1980). Pleistocene mammals ofNorth America. New York: Columbia University Press. Lister, A. M. ( 1987). Diversity and evolution of antler form in Quaternary deer. In Biology andmanagenient o f the Cerzlidae:
65-80. Wemmer, C. M. (Ed.). Washington, D.C.: Smithsonian Institution Press. Losos, J. B. (1990). The evolution of form and function: morphology and locomotor performance in West Indian Anolis
lizards. Ez?olution 44: 1 189- 1203. Marsh, R. L. (1988). Ontogenesis of contractile properties of skeletal and sprint performance in the lizard Dip.sosuuru.s
dorsalis. J . e.up. Biol.. 137: 1 19- 139. Martin, L. D. (1989). Fossil history of the terrestrial Carnivore. In Carnicore behacior, ecologj.4' and ez~olution: 536-568.
Gittleman, J. L. (Ed.). Ithaca, NY: Cornell University Press. Martins, E. P. & Garland, T., Jr (1991). Phylogenetic analyses of the correlated evolution of continuous characters: a
simulation study. Ez~olution 45: 534-557. Maynard Smith, J. & Savage, R. C. (1956). Some locomotory adaptations in mammals. J. Linn. Soc. 42: 603-622. Miyamoto, M. M., Kraus, F. & Ryder, 0 . A. (1990). Phylogeny and evolution of antlered deer determined from
mitochrondial DNA sequences. Proc. nam. Acad. Sci. USA 87: 6 127-6 13 1. Norusis, M. J . (1988). SPSS/PC+ Version 2.0,fbr the IBM PCiXTiAT. Chicago: SPSS Inc. Nowak, R. M. & Paradiso, J. L. (1983). Walker's mammals of the ~lorld. Baltimore: The Johns Hopkins Press. Pennycuick, C. J. (1975). On the running of the gnu (Connochaetes laurinus) and other animals. J. e.up. Biol. 63: 775-799. Pennycuick, C. J. (1979). Energy cost of locomotion and the concept of 'foraging radius'. In Serengeti: dynamics o f an
ecosystem: 164-184. Sinclair, A. R. E. & Norton-Griffiths, M. (Eds). Chicago: University of Chicago Press. Prothero, D. R., Manning, E. M. & Fischer, M. (1988). The phylogeny ofthe ungulates. In Thepliylogenj~andc~Ia.ss~fication
oj'the tetrapods 2: 201-234. Benton, M. J . (Ed.). Oxford: Clarendon Press. Prothero, D. R. & Schoch, R. M. (1989). Summary of perissodactyl evolution. In Thp 'zlolution ofperis.~odactyls: 504-529.
Prothero, D. R. & Schoch, R. M. (Eds). Oxford: Oxford University Press. Savage, D. E. & Russell, D. E., (1983). Mammalian pulcc?fuunus e f the izlorld. Reading, Mass.: Addison Wesley Publ. Co.
METATARSALIFEMUR RATIO A N D LOCOMOTION 151
Scott, K. M. (1983). Body weight prediction in fossil Artiodactyla. Zool. J. Linn. Soc. 77: 199-215. Scott, K. M. (1985). Allometric trends and locomotor adaptations in the Bovidae. Bull. Am. Mus. nut. Hist. 179: 197-288. Scott, K. M. (1987). Allometry and habitat-related adaptations in the postcranial skeleton of Cervidae. In Biology and
management of the Cervidae: 65-80. Wemmer, C. M. (Ed.). Washington, D.C.: Smithsonian Institution Press. Simmonetta, A. M. (1966). Osservazion i etologiche e eclogiche sui dik-dik (Madoqua; Mammalia, Bovidae) in Somalia.
Monit. 2001. Ital. (Suppl.) 74: 1-33. SPSS Inc. (1989). SPSS/PC+ Update for V3.0 and V3.1 ,for the IBM PCIXTIAT and PS/2. Chicago: SPSS Inc. Steudel, K. L. (1990). The work and energetic cost of locomotion. I. The effects of limb mass distribution in quadrupeds.
J. exp. Biol. 154: 273-285. Strang, K. T. & Steudel, K. (1990). Explaining the scaling of transport costs: the role of stride frequency and stride length.
J. Zool., Lond. 221: 343-358. Taylor, C. R., Maloiy, G. M. O., Weibel, E. R., Langman, V. A., Kamau, J. M. Z., Seeherman, H. J. & Heglund, N. C.
(198 1). Design of the mammalian respiratory system. 111. Scaling maximum aerobic capacity to body mass: wild and domestic mammals. Respir. Physiol. 44: 25-37.
Taylor, M. E. (1989). Locomotor adaptations by carnivores. In Carnivore behavior, ecology, and evolution: 382-409. Gittleman, J. L. (Ed.). Ithaca, NY: Cornell University Press.
van Valkenberg, B. (1987). Skeletal indicators of locomotor behavior in living and extinct carnivores. J. Vert. Paleont. 7: 162-182.
Wayne, R. K., Benveniste, R. E., Janczewski, D. N. & O'Brien, S. J. (1989). Molecular and biochemical evolution of the carnivora. In Carnivore behavior, ecology, and etiolution: 465-494. Gittleman, J. L. (Ed.). Ithaca, NY: Cornell University Press.
Wilhelm, P. B. & Janis, C. M. (1990). Prediction of predatory behavior of fossil taxa using total limb morphology. J. Vert. Paleont. (Suppl.), 10: 41 A.
Wozencraft, W. C. (1989). The phylogeny of the recent Carnivora. In Carnizlorr behavior, ecologj), andetlolution: 495-535. Gittleman, J. L. (Ed.). Ithaca, NY: Cornell University Press.