41
| Date post: | 27-Dec-2015 |
| Category: |
Documents |
| Upload: | philomena-hardy |
| View: | 218 times |
| Download: | 0 times |

Overarching question
“How mitigative actions undertaken
by developed countries could affect
development in developing and
emerging economies?”
Hans Opschoor (2010)

Overview
• Background on climate change mitigation.
• Consumption trends and consumption-based accounting.
• Trade and impacts to the developing world.
• Method• Results• Limitations and conclusions
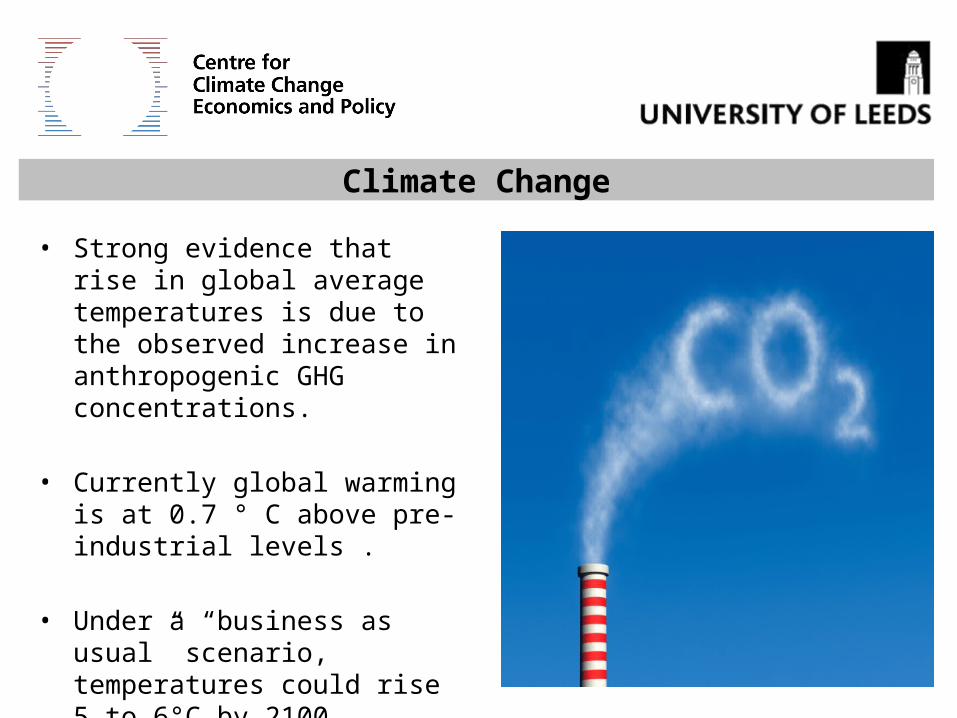
Climate Change
• Strong evidence that rise in global average temperatures is due to the observed increase in anthropogenic GHG concentrations.
• Currently global warming is at 0.7 ° C above pre-industrial levels .
• Under a “business as usual” scenario, temperatures could rise 5 to 6°C by 2100.
Source: (IPCC, 2007)
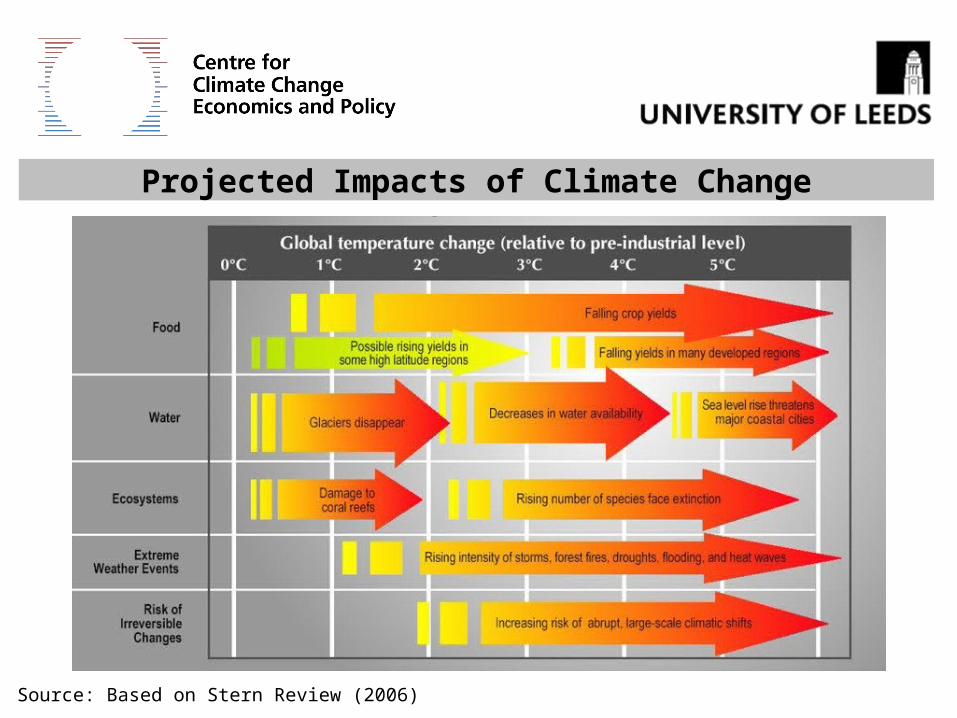
Projected Impacts of Climate Change
Source: Based on Stern Review (2006)

Multilateral emissions reduction targets
• Kyoto protocol: Some Annex B countries agreed to reduce emissions by 2012 relative to 1990 baseline (e.g. EU15 and other European nations -8%).
• EU ETS: Cuts of at least 20% by 2020 and >80% by 2050 relative to 1990.
• Cancun Agreements: Industrialized countries proposed reduction targets, including some developing countries (e.g. Brazil, China, Indonesia, Mexico, South Africa).
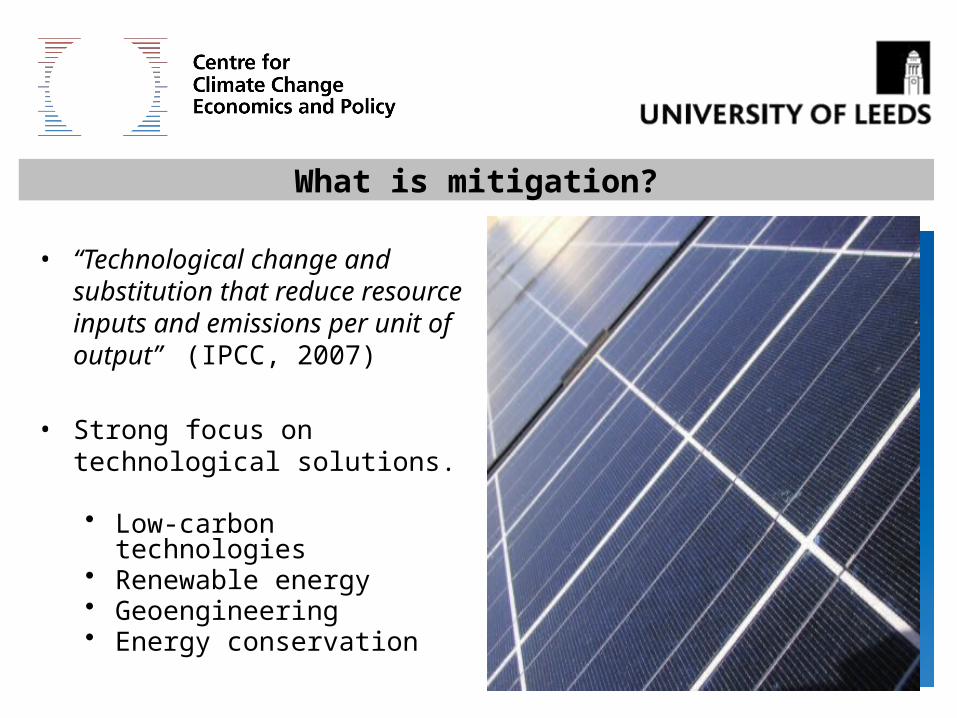
What is mitigation?
• “Technological change and substitution that reduce resource inputs and emissions per unit of output” (IPCC, 2007)
• Strong focus on technological solutions.
• Low-carbon technologies• Renewable energy• Geoengineering• Energy conservation
Can technology save us?
• 90% to 130% emission intensity improvement is required (Jackson, 2010)
• 80% of projected 2020 emissions from the power sector are already locked in (IEA, 2011)
• Window for cutting emissions (to 450 ppm - 2°) is closing fast (Stern, 2011)
• Not enough just to rely on technology (HM Government, 2005)

Other mitigation actions
• Social and economic policies oriented towards emission reductions and enhancement of sinks (IPCC, 2007).
• Beneficial aspects of creating synergies between developed and developing nations
• Clean Development Mechanism (CDM)
• Reducing Emissions Reducing Emissions from Deforestation and forest Degradation (REDD).
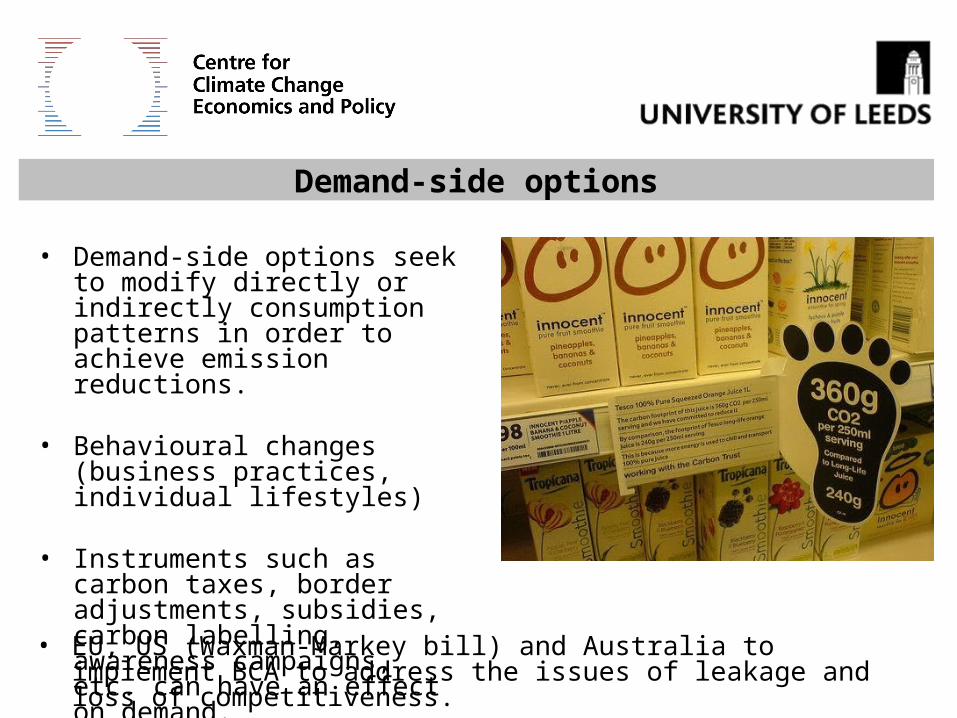
Demand-side options
• Demand-side options seek to modify directly or indirectly consumption patterns in order to achieve emission reductions.
• Behavioural changes (business practices, individual lifestyles)
• Instruments such as carbon taxes, border adjustments, subsidies, carbon labelling, awareness campaigns, etc. can have an effect on demand.
• EU, US (Waxman-Markey bill) and Australia to implement BCA to address the issues of leakage and loss of competitiveness.
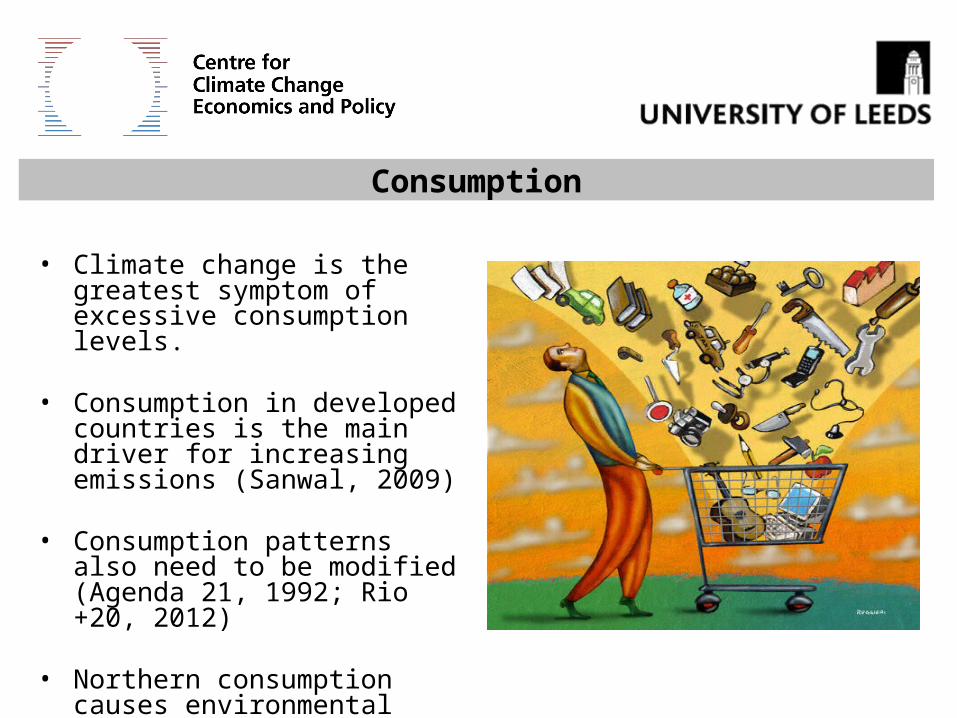
Consumption
• Climate change is the greatest symptom of excessive consumption levels.
• Consumption in developed countries is the main driver for increasing emissions (Sanwal, 2009)
• Consumption patterns also need to be modified (Agenda 21, 1992; Rio +20, 2012)
• Northern consumption causes environmental impacts in the South.

0
5
10
15
20
25
30
35
40
1970 1974 1978 1982 1986 1990 1994 1998 2002 2006 2010
Tri
llio
ns
of 2
005
US
D
Year
Source: Own graph based on data by UN Stats.
Final consumption expenditure(1970-2010)
High Income Countries(15% of world population)
Rest of the World
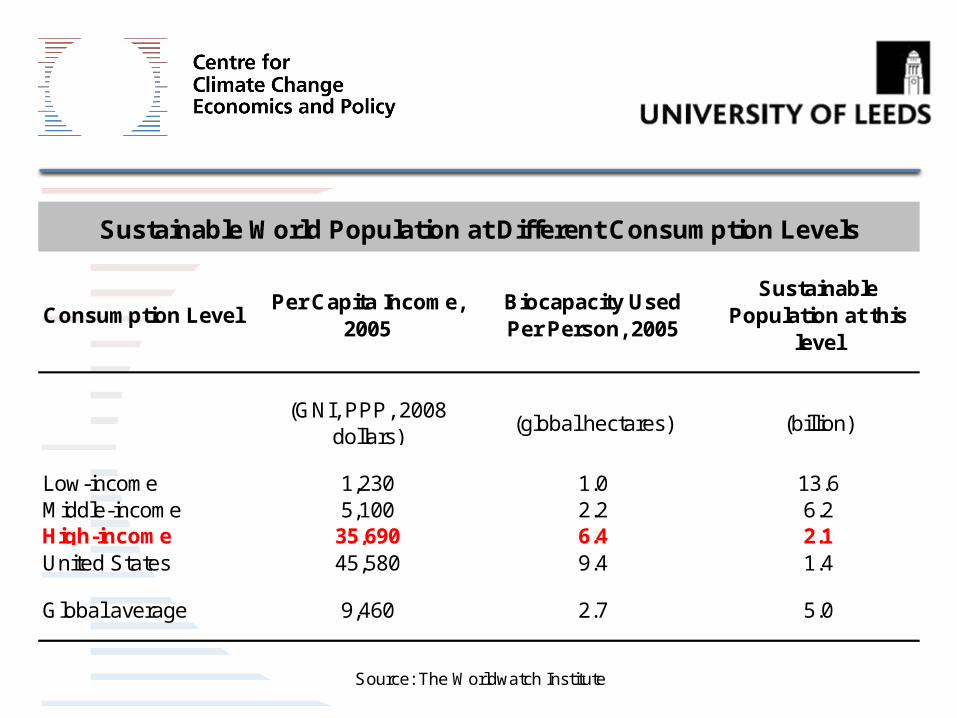
Consumption LevelPer Capita Income,
2005Biocapacity Used Per Person, 2005
Sustainable Population at this
level
(GNI, PPP, 2008 dollars)
(global hectares) (billion)
Low-income 1,230 1.0 13.6Middle-income 5,100 2.2 6.2High-income 35,690 6.4 2.1United States 45,580 9.4 1.4
Global average 9,460 2.7 5.0
Sustainable World Population at Different Consumption Levels
Source: The Worldwatch Institute

0.5
0.6
0.7
0.8
0.9
1.0
1.1
1.2
1.3
1.4
1.5
1961 1970 1980 1990 2000 2006
Year
Num
ber
of P
lane
t Ear
ths
Source: Own graph based on data by the Global Footprint Network.
Humanity's Ecological Footprint(1961-2006)
World's Biocapacity
Ecological Footprint
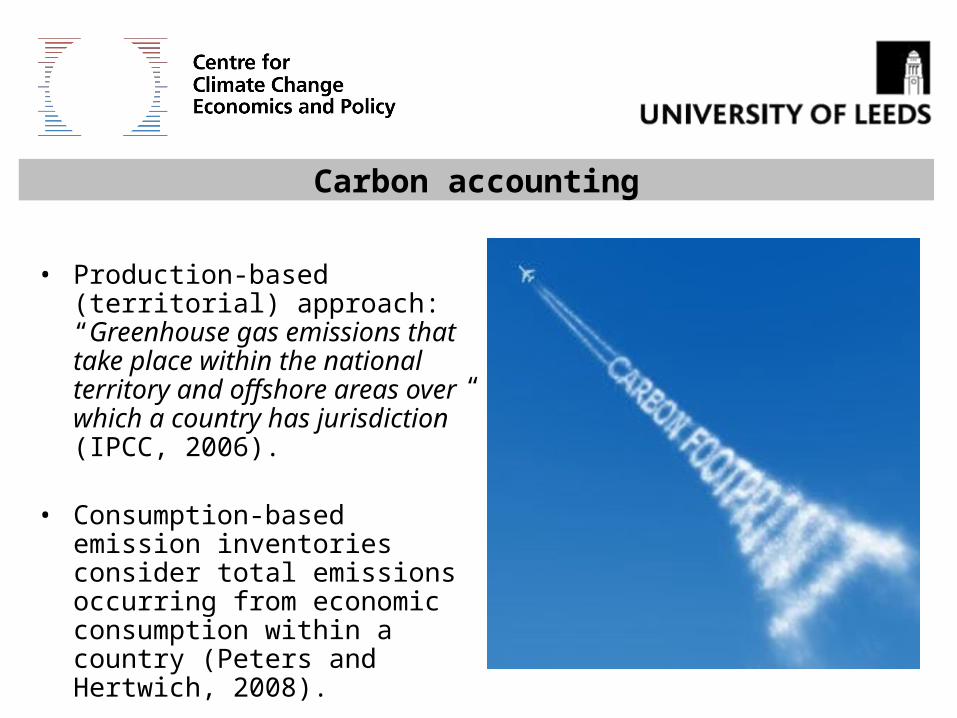
Carbon accounting
• Production-based (territorial) approach: “Greenhouse gas emissions that take place within the national territory and offshore areas over which a country has jurisdiction” (IPCC, 2006).
• Consumption-based emission inventories consider total emissions occurring from economic consumption within a country (Peters and Hertwich, 2008).
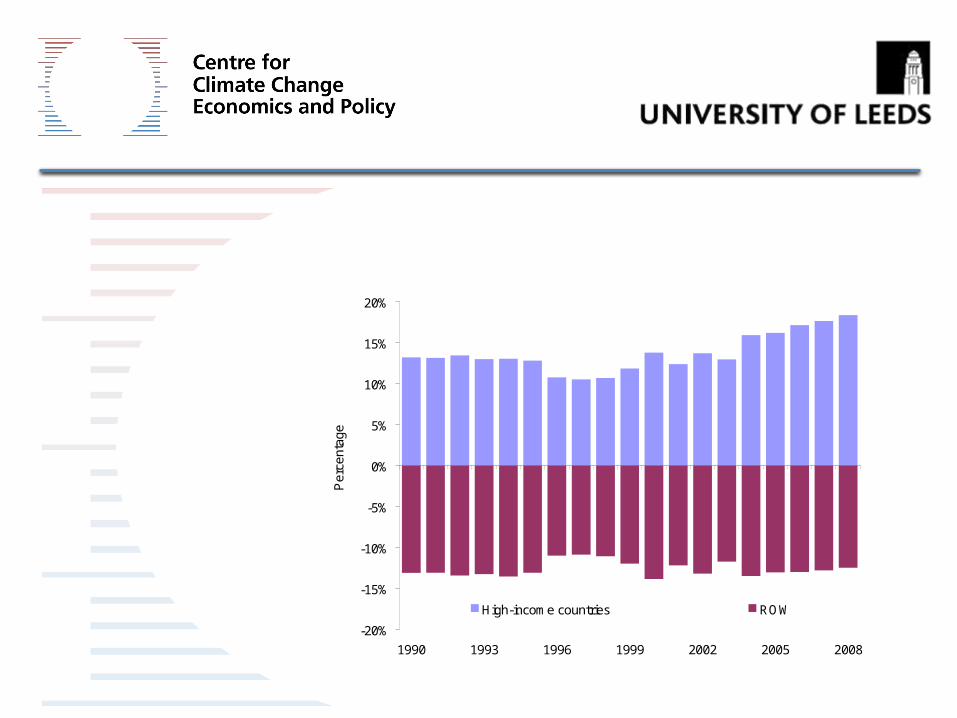
-20%
-15%
-10%
-5%
0%
5%
10%
15%
20%
1990 1993 1996 1999 2002 2005 2008
Per
cent
age
High-income countries ROW
Source: Own graph based on data by Peters et al. (2011)
Consumption-induced emissions as a percentage of territorial emissions
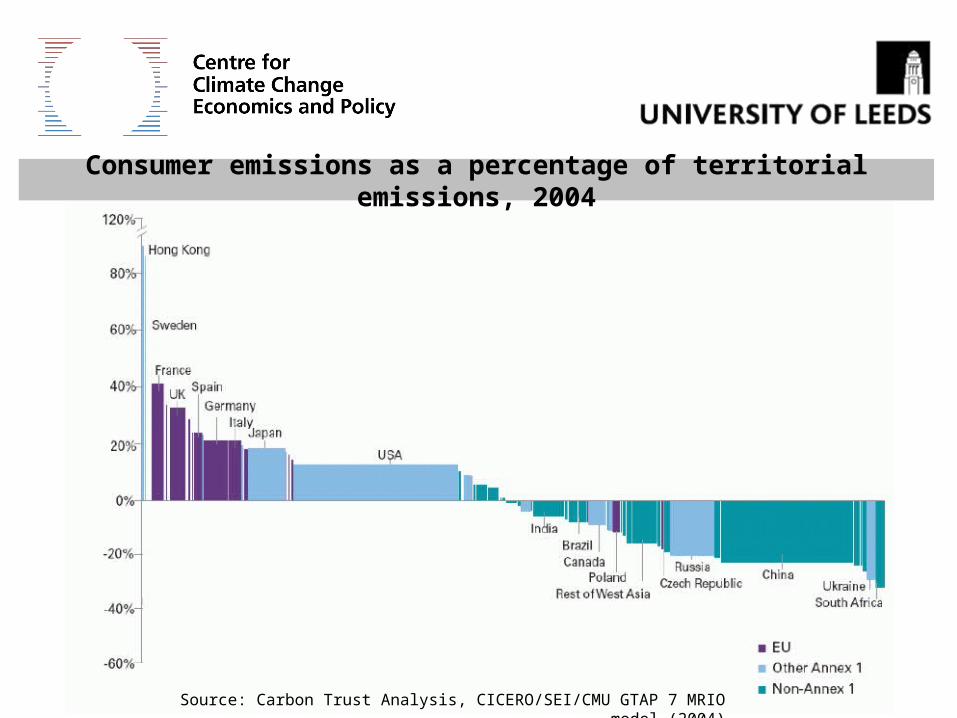
Consumer emissions as a percentage of territorial emissions, 2004
Source: Carbon Trust Analysis, CICERO/SEI/CMU GTAP 7 MRIO model (2004)
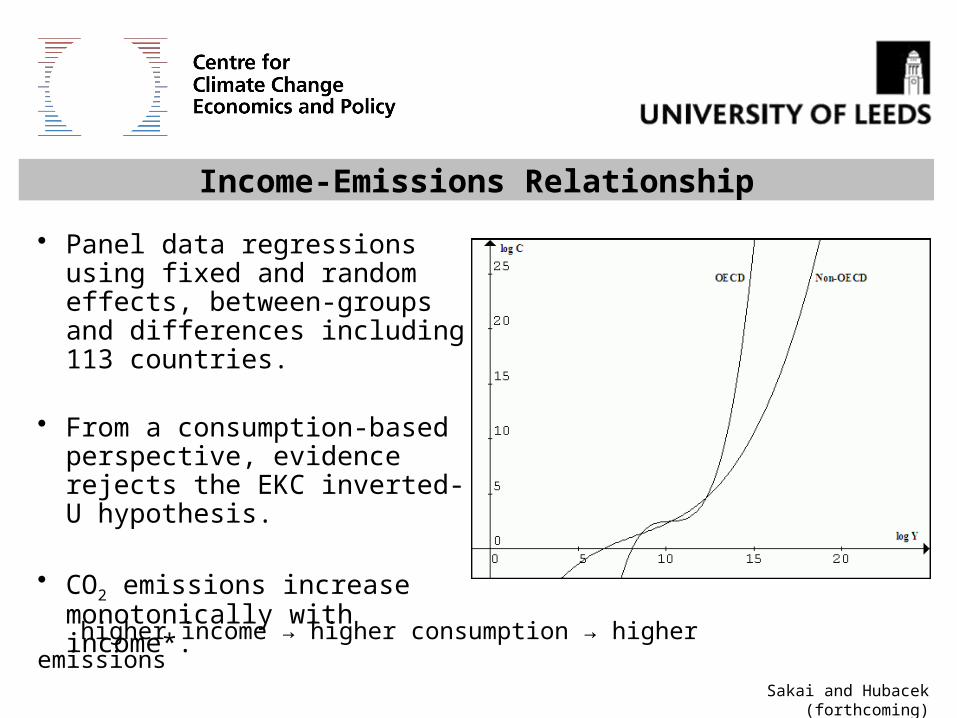
Income-Emissions Relationship
• Panel data regressions using fixed and random effects, between-groups and differences including 113 countries.
• From a consumption-based perspective, evidence rejects the EKC inverted-U hypothesis.
• CO2 emissions increase monotonically with income*.
Sakai and Hubacek (forthcoming)
higher income → higher consumption → higher emissions
50,000
150,000
250,000
350,000
450,000
550,000
650,000
1992 1998 2004 2010 2016 2022 2028 2034 2040 2046
Year
kt C
O2e
q
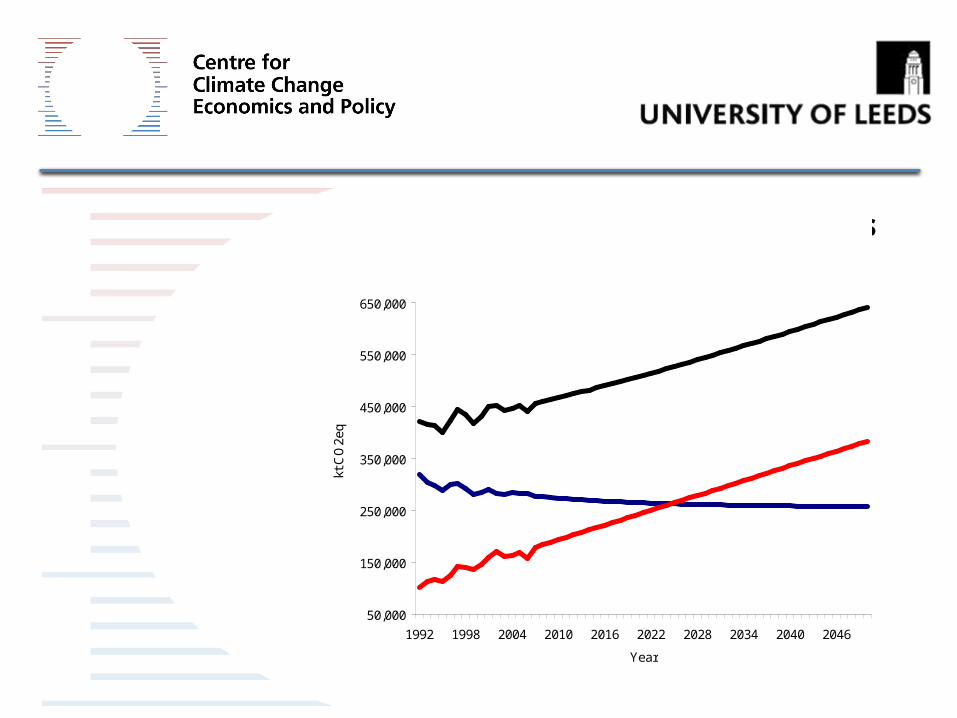
Source: Own graph based on data by SEI.
Projected CO2 UK Household EmissionsBusiness as usual (1990-2050)
Total (Δ50%)
Imports(Δ250%)
Domestic(Δ-20%)
50,000
150,000
250,000
350,000
450,000
550,000
650,000
1992 1998 2004 2010 2016 2022 2028 2034 2040 2046
Year
kt C
O2e
q
Source: Own graph based on data by SEI.
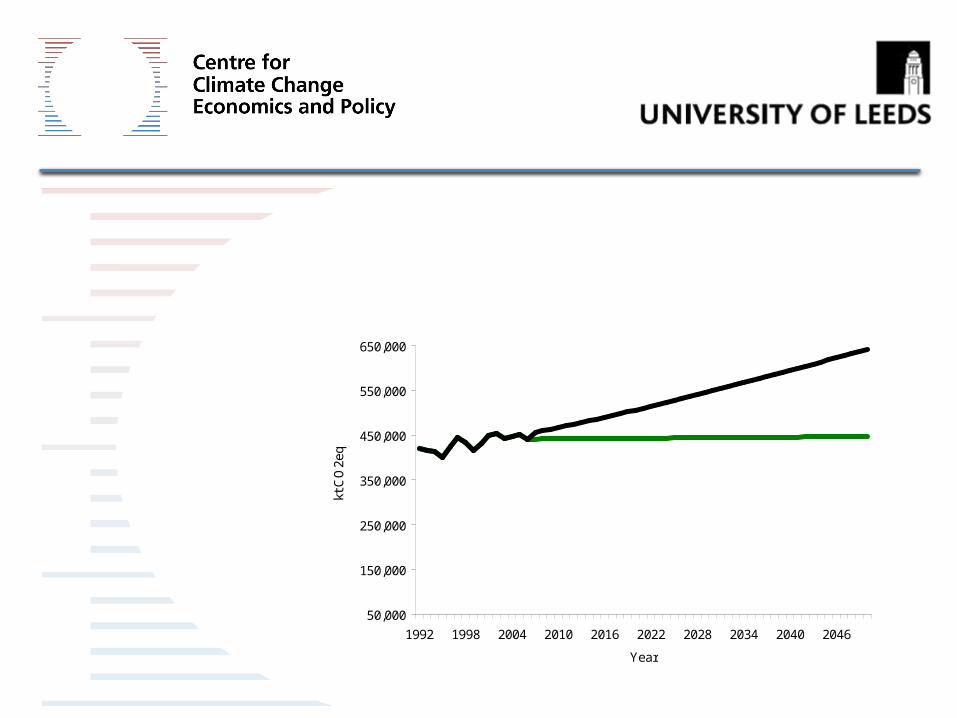
Scenarios for Total UK Household Consumption-Based CO2 Emissions
(1990-2050)Business as usual
80% cut

50,000
150,000
250,000
350,000
450,000
550,000
650,000
1992 1998 2004 2010 2016 2022 2028 2034 2040 2046
Year
kt C
O2e
q
Source: Own graph based on data by SEI.
Scenarios for Total UK Household Consumption-Based CO2 Emissions
(1990-2050)Business as usual
80% cut
80% additional cut in imports

Source: Carbon Trust
Impacts on the developing world
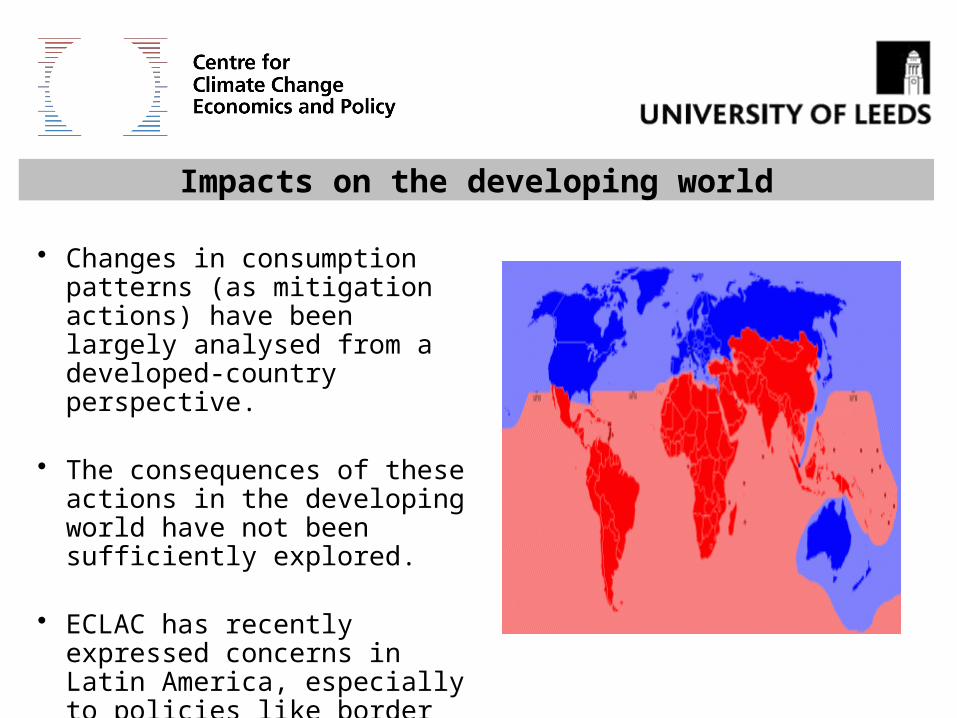
• Changes in consumption patterns (as mitigation actions) have been largely analysed from a developed-country perspective.
• The consequences of these actions in the developing world have not been sufficiently explored.
• ECLAC has recently expressed concerns in Latin America, especially to policies like border adjustments and carbon labelling.
International Trade
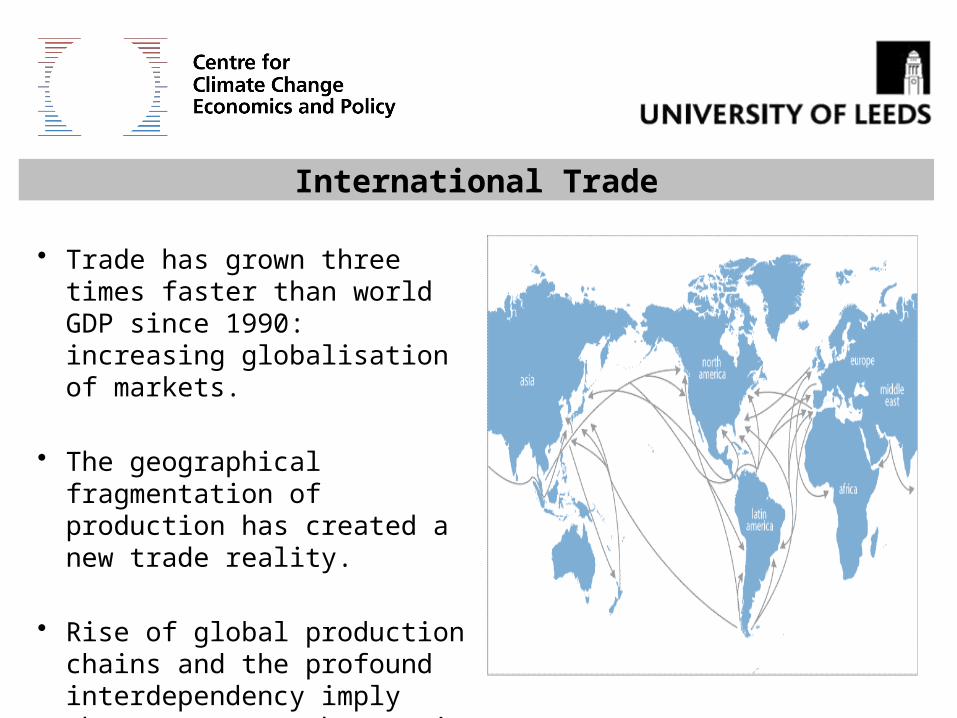
• Trade has grown three times faster than world GDP since 1990: increasing globalisation of markets.
• The geographical fragmentation of production has created a new trade reality.
• Rise of global production chains and the profound interdependency imply that exogenous changes in one country may induce effects in several other economies.

Fragmentation of production
Source: WTO (2011) and Meng and Miroudot (2011)

The Method
• Increasing use of environmentally- extended MRIO Analysis to understand environmental effects caused by consumption.
• Shows the underlying structure of several economies.
• Capture the interdependencies between different industries located in diverse regions.
• 113 countries and 57 sectors – GTAP7

EEin
EEi
EEi
EDin
EDi
EDi
EEn
EEEEEDn
EDED
EEn
EEEEEDn
EDED
DEin
DEi
DEi
DDin
DDi
DDi
DEn
DEDEDDn
DDDD
DEn
DEDEDDn
DDDD
aaaaaa
aaaaaa
aaaaaa
aaaaaa
aaaaaa
aaaaaa
A
2121
2222122221
1121111211
2121
2222122221
1121111211
The MRIO Model
Technology matrix (6441*6441)
Value Added
Total Inputs
CO2 emissions
FD(6441*113)
Tota
l Out
puts
Import matrices
𝑋= (1− 𝐴)−1𝑌 𝑇𝐼𝑀𝑆= ሺ𝐶𝑂2𝑖𝑋𝑖−1ሻሺ1− 𝐴ሻ−1 𝐼𝑛𝑑𝑖𝑟𝑒𝑐𝑡 𝑎𝑛𝑑 𝑑𝑖𝑟𝑒𝑐𝑡 𝑒𝑚𝑖𝑠𝑠𝑖𝑜𝑛𝑠= 𝑇𝐼𝑀𝑆∗𝑌

-100%
-80%
-60%
-40%
-20%
0%
20%
40%
60%
80%
100%
USA EU 15 Other high-
income
Other Annex I
China EiT G20 emerg
ing
Other Middle-
income
Low Income
Pe
rce
nta
ge
Agriculture, hunting, forestry and fishing Mining and quarrying
Light industry Heavy industry
Transport and communications
CO2 embodied in trade
-100%
-80%
-60%
-40%
-20%
0%
20%
40%
60%
80%
100%
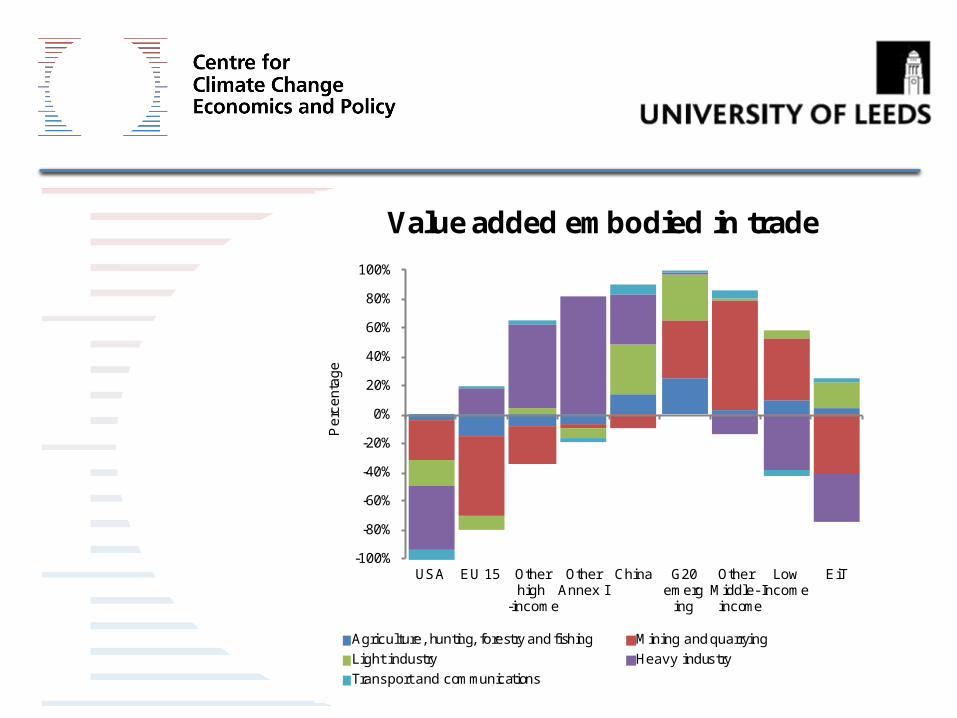
USA EU 15 Other high
-income
Other Annex I
China G20 emerg
ing
Other Middle-
income
Low Income
EiT
Pe
rce
nta
ge
Agriculture, hunting, forestry and fishing Mining and quarrying
Light industry Heavy industry
Transport and communications
Value added embodied in trade
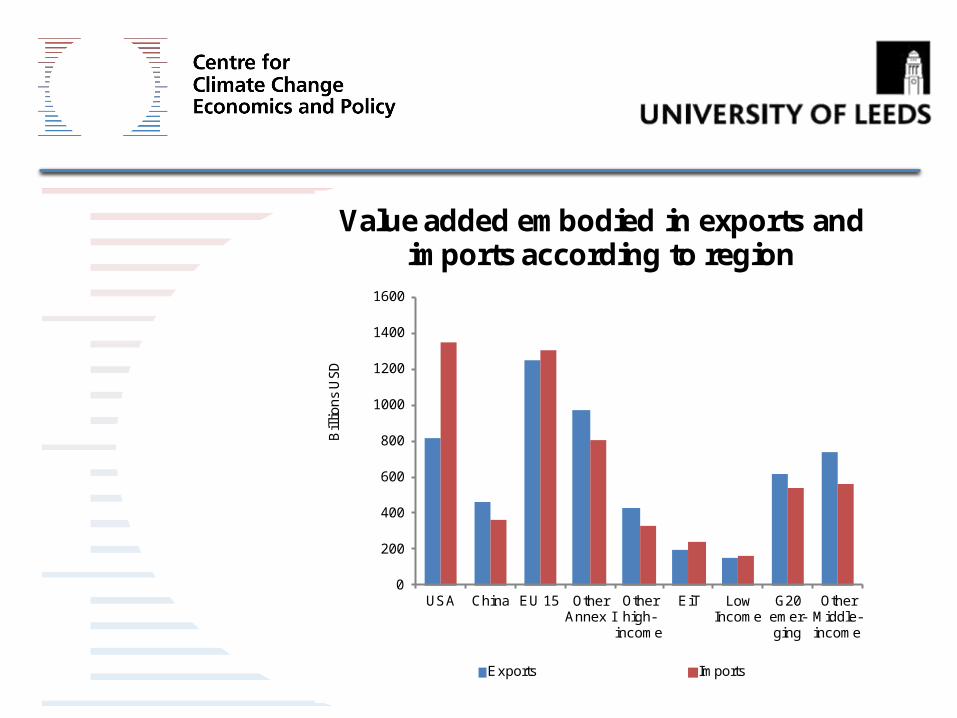
0
200
400
600
800
1000
1200
1400
1600
USA China EU 15 Other Annex I
Other high-
income
EiT Low Income
G20 emer-ging
Other Middle-income
Bil
lio
ns
US
D
Exports Imports
Value added embodied in exports and imports according to region

USA31%
China4%
EU 1528%
Other Annex I17%
Other high-income
3%
EiT2%
Low Income1% G20
emerging8%
Other Middle-income
6%
Share of consumption-based value added (domestic + imports)
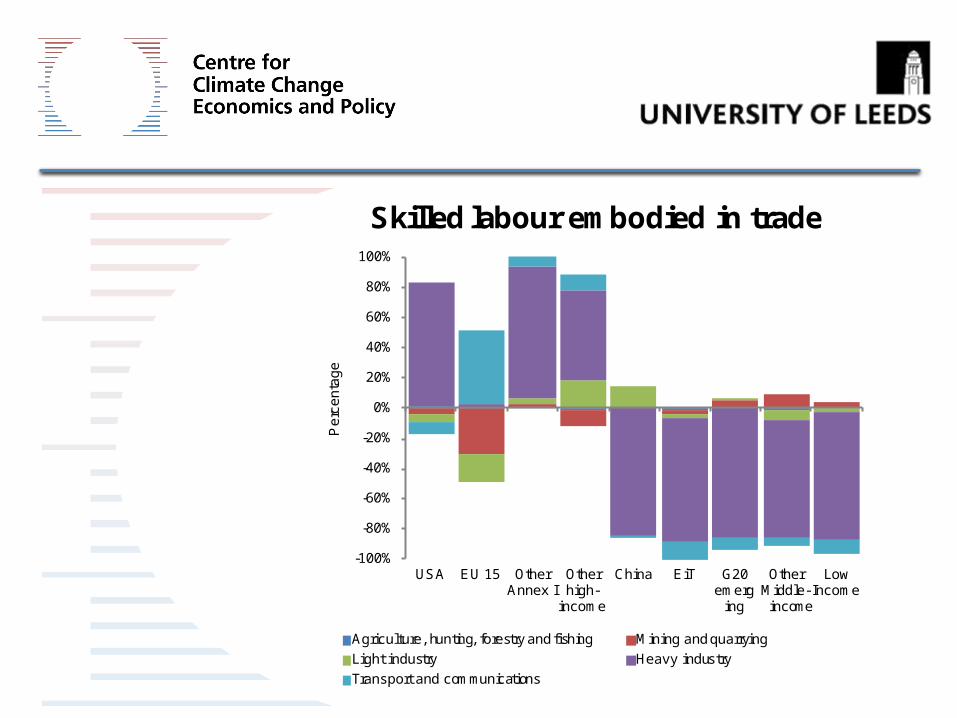
-100%
-80%
-60%
-40%
-20%
0%
20%
40%
60%
80%
100%
USA EU 15 Other Annex I
Other high-
income
China EiT G20 emerg
ing
Other Middle-
income
Low Income
Pe
rce
nta
ge
Agriculture, hunting, forestry and fishing Mining and quarrying
Light industry Heavy industry
Transport and communications
Skilled labour embodied in trade

-100%
-80%
-60%
-40%
-20%
0%
20%
40%
60%
80%
100%
USA EU 15 Other Annex I
Other high-
income
China EiT G20 emerg
ing
Other Middle-
income
Low Income
Pe
rce
nta
ge
Agriculture, hunting, forestry and fishing Mining and quarrying
Light industry Heavy industry
Transport and communications
Unskilled labour embodied in trade

0
0.05
0.1
0.15
0.2
0.25
0.3
0.35
0.4
0.45
0.5
Agriculture Mining L-industry H-industry Transport
US
D
Skilled labour Unskilled labour
Total intensity (wages/$), low-income countries, skilled and unskilled
labour
0
2
4
6
8
10
12
14
16
Agriculture Mining L-industry H-industry Transport
Kg
. C
O2
eq
/$
GHGs
Total intensity (GHGs/$), low-income countries, GHGs

0
0.05
0.1
0.15
0.2
0.25
0.3
0.35
0.4
Agriculture Mining L-industry H-industry Transport
US
D
Skilled labour Unskilled labour
Total intensity (wages/$), other middle-income countries, skilled and
unskilled labour
0
1
2
3
4
5
6
Agriculture Mining L-industry H-industry Transport
Kg
. C
O2
eq
/$
GHGs
Total intensity (GHGs/$), other middle-income countries, GHGs
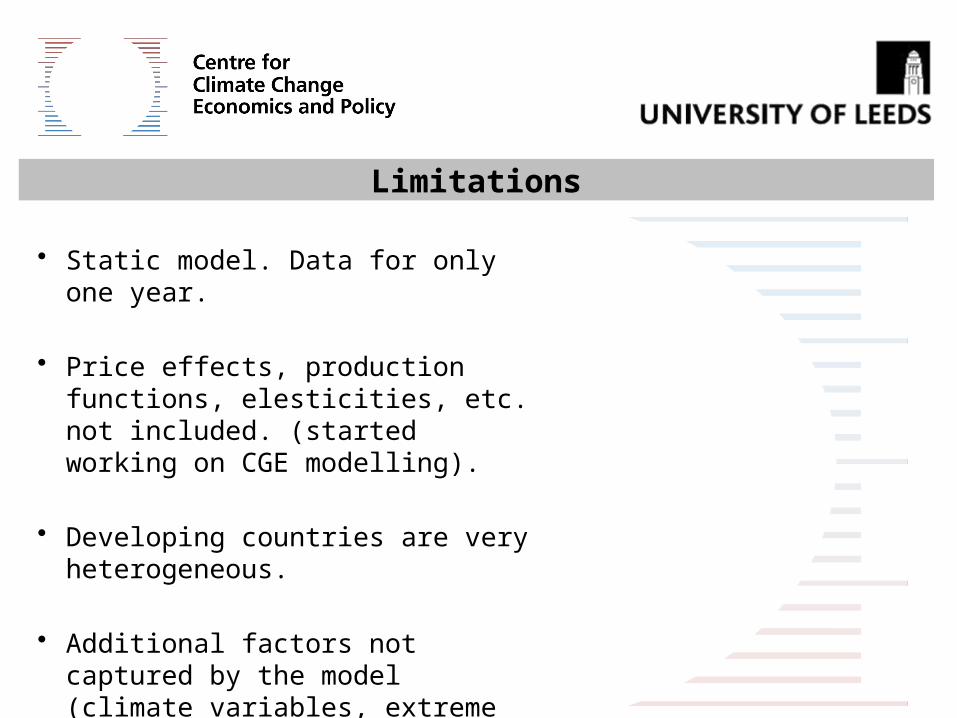
Limitations
• Static model. Data for only one year.
• Price effects, production functions, elesticities, etc. not included. (started working on CGE modelling).
• Developing countries are very heterogeneous.
• Additional factors not captured by the model (climate variables, extreme climate events, etc.).

Conclusions
• Need to lower consumption and change patterns, especially in wealthy countries, but this may cause alterations in the structure of global trade.
• Poor countries are vulnerable to changes in structure of trade.
• Negative consequences on welfare in the developing world aggravating adaptation costs.
• Need for financial and technological transfers and strengthening absorptive capacities.
• Policies should be regarded from an inclusive viewpoint that considers the needs of both developed and developing nations.

30% domestic and 15% import improvements in energy emission intensity Source: Own projections based on data by SEI
17.9% 16.5% 16.2%
42.2%34.6%
26.8%
11.9%
17.3%23.7%
5.2% 8.3% 10.8%
0%
10%
20%
30%
40%
50%
60%
70%
80%
90%
100%
1992
2007
2025
Per
cent
age
Food & beverages Alcohol & tobacco Clothing & footwear
Water, energy Maintenance Health
Transport Communication Recreation & culture
Education Rest. & hotels Misc. goods & services
Projected structure of emissions for UK households according to consumption
category

0
1
2
3
4
5
6
7
8
9
Agriculture Mining L-industry H-industry Transport
Kg
. C
O2
eq
/$
GHGs
Total intensity (GHGs/$), China, GHGs
0
0.05
0.1
0.15
0.2
0.25
0.3
0.35
0.4
0.45
0.5
Agriculture Mining L-industry H-industry Transport
US
D
Skilled labour Unskilled labour
Total intensity (wages/$), China, skilled and unskilled labour

0
1
2
3
4
5
6
7
8
9
Agriculture Mining L-industry H-industry Transport
Kg
. C
O2
eq
/$
GHGs
Total intensity (GHGs/$), emerging G20, GHGs
0
0.05
0.1
0.15
0.2
0.25
0.3
0.35
0.4
Agriculture Mining L-industry H-industry Transport
US
D
Skilled labour * Unskilled labour *
Total intensity (wages/$), emerging G20, skilled and unskilled labour


