Page 1
Does soil pH and water content explain the plant distribution or not?
Supervisor: Peter Frederiksen
Basic Studies in the Natural Science, RUC
2nd Semester, Fall 2005
Group 13
Grey
Jesper
Jerry
Gary
Page 2
2
Table of content
Abstract…………………………………………………………………4
Introduction ………………………………………………………….....4
Study area for the project……………………………………………...6
Problem formulation…………………………………………………...6
A priori Model and theories …………………………………….……..7
Community-unit theory…………………………………………….….7
Principal of limiting factors……………………………………….......7
Hypothesis generation………………………………………………….8
Experimental design…………………………………………………....9
Definition……………………………………………………………...9
Description classification………………………………………….…..9
Measurement……………………………………………………….….9
Data collection……………………………………………………..……10
Statistical analysis………………………………………………….…...12
Laws and theory construction………………………………….….…...13
Explanation of model........................................................................…...14
Soil pH...................................................................................................14
Soil water...............................................................................................16
Conclusion and discussion……………………………………….….…18
References……………………………………………………….….…..19
Page 3
3
Glossary………………………………………………………………...20
Appendix……………………………………………………………….21
Experiments……………………………………………………………25
Page 4
4
Abstract
The project is mainly focused on vegetation in the field behind RUC. It aims to
explain the plant distribution by considering water content and soil pH factors.
Deductive approach is commonly used in vegetation science, we used it for the
project. Two theories are introduced: Community-unit theory & Principal of limiting
factors, the model is based on these two theories. We got the first hand data from field
work, data analysis is followed afterward. For the conclusion, topography is
associated with water content in soil, water is absorbed by soil from the water table, a
relative higher topography has less soil water, and because different plant species
need different amount of water, our simple model can explain the plant distribution
for the study area.
Key words
Soil water, soil pH, topography, water potential, free energy
Introduction
Topographies are varying in the study area and are apportioned to the vegetation.
There are many trees at the highest topography; and water-like bushes are only
located at the lowest topography, water can been seen in this area; Grass and herbs are
in between, where there is a relative in-between topography.
There are 6 essential elements are common recognized for plants: (a),light, (b)
mechanical support, (c), heat, (d), air, (e) water, and (f), nutrients. The soil is an agent
for supplying these elements, except lights. (Brady, 1974)
Since our study area is really small, light, heat and air differences can be avoided,
because they are not different in such small area. Water is easily the first factor to
consider. Plants get water from rainfall and groundwater; rainfall can be avoided also
Page 5
5
for the same reason. As mentioned before, water can be seen at the lowest area (see
picture 6 in Appendix), which actually shows the groundwater table in this area. And
we tested the water content from our experiment
Plants also need nutrients to live, soil pH determines to availability of nutrients,
(which we will discuss in the soil pH part later). For example, Trees are particularly
tolerant of acid soils, they exist as natural vegetation in regions of acid soil. (Brady,
1974) And because of that we also tested the soil pH.
After several experiments, we had got our data and set up a model
Page 6
6
Study area for the project
Our study area is right behind RUC, we divided the vegetation area into 7 zones
according to plant species and their boundaries, reasons discussed in latter sections.
figure 1: A draft vegetation map of study area
A number refers to a study zone, where grows a group plants (see pictures in
Appendix). The red point was used as a standard topography when we tested relative
topographies.
Problem formulation
Why the vegetation in the study area different from one to another? Does the water
content and soil pH explain the distribution?
We noticed that there were several plant species in the study area, the interesting thing
is scrubs only grow at the lowest topography, and trees only grow at the highest places,
we thought it might be the water content.
Page 7
7
A priori Model and theories
There are two theories we used for the project: Community-unit theory & Principal of
limiting factors
Community-unit theory
There is a community-unit theory invented by Whittaker (1953), which indicates plant
vegetation is repeating in a certain area, because of similar conditions of
environmental factors and limiting factors. Where the environmental factors repeated,
the vegetation is also repeated (Martin & Paddy 1992) E.g. at a mountain, trees type A
grow at the top of the mountain, whereas tress type B grow at a relative lower
topography, ect.
Principal of limiting factors
Plant growth is dependent upon a favorable combination of these 6 elements and if
any of them is out of balance with the others, can reduce or even entirely prevent the
growth of plants.(Brady,1974)
There is a common principal for plant growth, called the Principle of limiting factors:
the level of crop production can be no greater than that allowed by the most limiting
of the essential plant growth factors(Brady,1974). In the other way, in a certain
availability of elements, plant meets certain level until the next limit element is
reached. This can be well explained in figure showing below:
Page 8
8
Figure 2 explains the principal of limiting factors. The height of each strip represents
the amount of an element. The inside water level represents crop production. Notice
the same amount of light heat and other elements. There are only two elements are
different, nitrogen and potassium. The left barrel has a less production because it is
limited by nitrogen, when nitrogen is added, the level of crop production is raised
until it is controlled by the next most limiting factor, in this case that is potassium
The figure is taken from the book The Nature and Properties of Soils. Nyle C. Brady
(1974)
Hypothesis generation
‘The water table is often believed to be a subdued replica of the topography’. (H.M.
Haitjema, S. Mitchell-Bruker 2005) According to the theories of Community-unit
theory & Principal of limiting factors, we assume the vegetation distribution is due to
water content for each plant group.
Page 9
9
Experimental design
Definition
We measured three aspects in the study area:
Measurement of moisture content
Topography of each plant group
Measurement of Soil pH
Description classification
Moisture content. Measuring wet percentage is a common method of expressing.
Moisture content is also expressed as volumn percentage, the volume of soil water as
a percentage of the volume of the soil sample (Brady, 1974) this measure shows the
available soil water to plant roots.
Topography is related to soil water, reasons had explained in previous section, it is
commonly believed. For details we now introduce the concepts of soil water content
and soil pH, discussed in latter sections
Measurement
Measurements discussed in Experiment section
Page 10
10
Data collection
Here are the data we collected from field experiments
Table 1
Results from topography experiment
Zone numberZone numberZone numberZone number 1111 2222 3333 4444 5555 6666 7777
AverageAverageAverageAverage
topography(topography(topography(topography(OriginalOriginalOriginalOriginal
data)(mdata)(mdata)(mdata)(m))))
>4*>4*>4*>4* 0.06 -0.44 -1.15 -1.51 -1.68 -1.55
Plus 1.68Plus 1.68Plus 1.68Plus 1.68 5.68 1.74 1.24 0.53 0.17 0 0.13
*Estimated
Here topography is relative, for it is easier to compare positive data, and since the
groundwater table can be seen in the study area, water flows upwards due to the
osmotic potential, we use the water table as the reference elevation. That is why the
original data plus 1.68.
We divided the plants of study area into 7 groups according to the clear boundaries.
Page 11
11
Table 2
Results of Water volume percentage from experiment
Zone Water volume percentage
Number
1 3.33%
2 20.18%
3 14.79%
4 19.82%
5 36.21%
6 70%
7 41.01%
Soil moisture measurement
Moisture content. Measuring wet percentage is a common method of expressing.
Moisture content is also expressed as volumn percentage, the volume of soil water as
a percentage of the volume of the soil sample (Brady, 1974) this measurement shows
the available soil water to plant roots
Page 12
12
Statistical analysis
We made graphs using the data collected from the field.
0
1
2
3
4
5
6
1 2 3 4 5 6 7Zone Number
Rela
tive
top
ogra
phy
(m)
Figure 3: Changes of topography of study zones.
Here we can see the relative topography decrease from zone 1 to zone 6, and then
increase a bit. Each zone refers to a different plant group; pictures are shown in
appendix at the end of the project.
0. 00%10. 00%20. 00%30. 00%40. 00%50. 00%60. 00%70. 00%80. 00%
1 2 3 4 5 6 7Zone numberZone numberZone numberZone number
Wate
r Vo
lume
Per
cent
age
Wate
r Vo
lume
Per
cent
age
Wate
r Vo
lume
Per
cent
age
Wate
r Vo
lume
Per
cent
age
Page 13
13
Figure 4: Changes of water volume percentage of study zones.
Compare with changes of topography above (Figure 3), water volume percentage
tends to be more when relative topography decreases, with only one exception of zone
2, which might be a result of soil structure or experiment error.
Laws and theory construction
Now we have the data analyzed, we made our model afterwards.
Here is our model
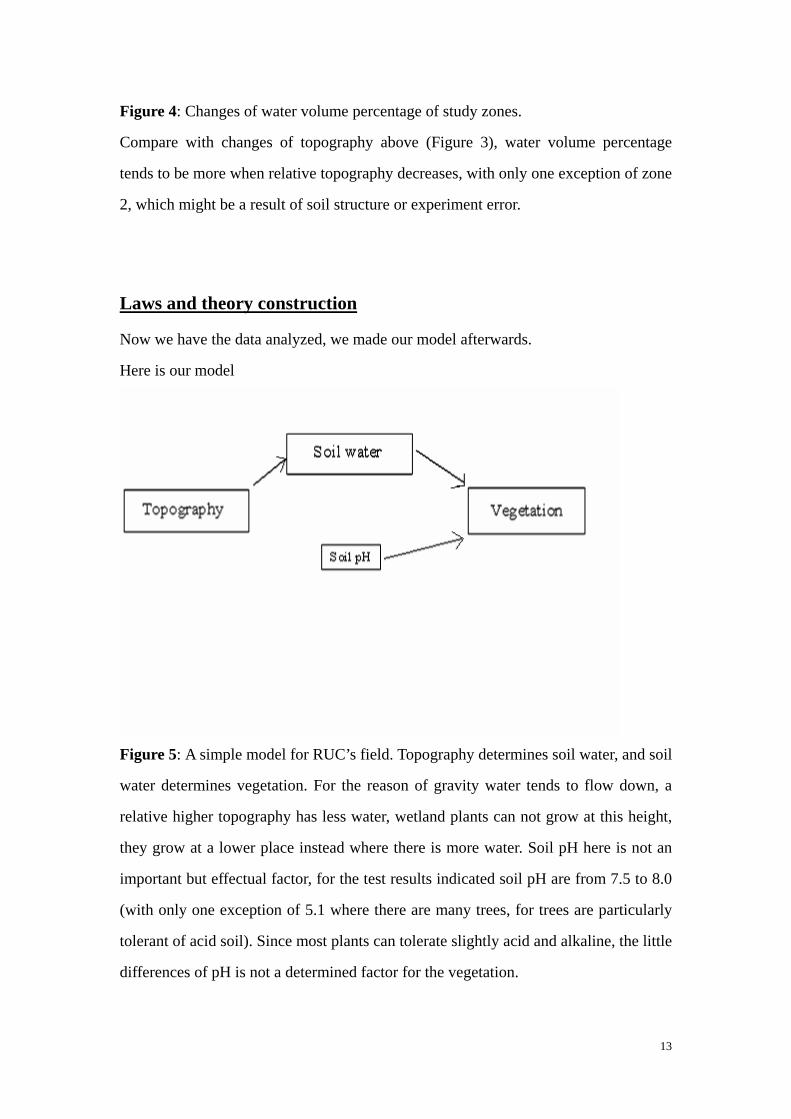
Figure 5: A simple model for RUC’s field. Topography determines soil water, and soil
water determines vegetation. For the reason of gravity water tends to flow down, a
relative higher topography has less water, wetland plants can not grow at this height,
they grow at a lower place instead where there is more water. Soil pH here is not an
important but effectual factor, for the test results indicated soil pH are from 7.5 to 8.0
(with only one exception of 5.1 where there are many trees, for trees are particularly
tolerant of acid soil). Since most plants can tolerate slightly acid and alkaline, the little
differences of pH is not a determined factor for the vegetation.
Page 14
14
Explanation of model
Now we should explain the concepts of soil pH and soil water
Soil pH
Overview
There are 6 essential elements are common recognized for plants: (a),light, (b)
mechanical support, (c), heat, (d), air, (e) water, and (f), nutrients. The soil is an agent
for supplying these elements, except lights. (Brady, 1974)
The acidity or alkalinity of the soil is defined by its pH, soil pH. Normally pH 7.0 is
neutral. From 7 to lower values are acid, from 7 to higher values are alkaline. Most
plants do not grow well at an extreme acid or alkaline soil.
Soil pH affects root growth, soil microbes, and nutrient availability. Root growth is
generally favored in slightly acidic soils, at pH values between 5.5 and 6.5. fungi
generally predominate in acidic soils; bacteria become more powerful in alkaline
soils(Taiz & Zeiger 2002)
soil pH greatly affects the availibility of nutrients in soil. Iron and zinc become less
available to plants as the pH increase. and more molybdenum is available at higher
pH levels. Phosphorus is more available at a soil pH of about 6.5 to 7.0 than at either
higher of lower values.(Hudson T. et al. 1981)
Essential nutrient elements
From 94% to 99.5% of fresh plant tissue is made up of carbon, hydrogen, and oxygen,
which are from air by photosynthesis. Only from 0.5 to 5-6% is from soil. In spite of
this, nutrient elements from soil usually limit crop development(Brady,1974). There is
no different light, heat, air in RUC’s little area.
Page 15
15
Certain nutrient elements are necessary for the normal plant growth. 17 elements are
demonstrated to be essential for plant growth.(Brady,1974) they are classified
according to sources, some are from air and water. Some are from soil. Nutrients
mostly from air and water: carbon, hydrogen, oxygen (C, H, O)
From soils:
Macronutrients: nitrogen, phosphorus, potassium, calcium, magnesium, and sulfur.
(N,K,P,Ca,Mg,S)
Micronutrients: iron, manganese, zinc, boron, copper, chlorine, cobalt, molybdenum.
Plants use them in very small amounts, but also important.
Plants growth can be retarded because of lacking of these elements or they become
available to plants too slowly (Brady,1974)
Soil pH effect on nutrients availability
Soil pH may influence nutrient absorption and plant growth in two ways: (a) through
the direct effect of the hydrogen ion; or (b) indirectly through its influence on nutrient
availability and the presence of toxic ions. (Brady,1974) at extreme pH values,
however most plants are able to tolerate hydrogen ion concentration as long as a
proper balance of the other elements is maintained.(Brady,1974)
Page 16
16
Figure 6 indicates soil pH effect on nutrients availability, listed all the 6
macronutrients and some micronutrients. The width of the shaded areas represents the
degree of nutrient availability to the plant root. All of these nutrients are available in
the pH range of 5.5 to 6.5. (From Lucas and Davis 1961)
Soil Water
Water is an important factor to plants,soil is an agent for supplying water, plant roots
absorb water from soil water. Different species need different amount of water. For
example, in desert where little soil water is available to plants, grows drought tolerate
plants like cactus; Wetland plants can only grow when there is enough soil water.
Free energy is the term use to characterize the energy status of water. Soil water
Page 17
17
moves from high energy level to a relative lower level. Water potential determines the
free energy of soil water. Water potential is the sum of forces acting on soil water
(Brady, 1974), three major forces effecting free energy, and they are: gravitational
potential (Pg); matric potential (Pm); and osmotic potential (Po)
Pt = Pg + Pm + Po+……. (Brady, 1974)
Pt is the total water potential,
Matric potential: water is attracted by soil solid. It provides a force reduces the free
energy of the absorbed water molecules. Osmotic potential provides a force reduce the
free energy of soil solution; gravitational potential is a result of gravity, it drives water
flow downward.
Pg = G*h (Brady 1974)
G is the acceleration of gravity, it is same everywhere on earth; h is the height of the
soil water above a reference elevation. The groundwater table can be seen in the study
area (see picture 6), we use it as the reference elevation.
According to the formula Pt = Pg + Pm + Po+…….
Gravitational potential (Pg) is a result of topography, a relative higher height has more
Pg; we assume matric potential (Pm) is same for this area (we didn’t consider soil
texture and structure, but it might be a little different and could be one of the reasons
for zone 1, we have discussed in later sections); Osmotic potential (Po) drives water
from groundwater to a relative higher topography.
If we look at figure 3 and 4
When topography decreases, water content increases, and water content is a result of
total water potential
Therefore,
Page 18
18
Topography can be expressed as a function of the total water potential. Topography is
in inverse proportion to water potential.
Topography Pt
From the reference elevation (groundwater table), topography increases as the total
water potential decreases. Since water here is the limiting factor for plants (other
factors are same or not limited for plant growth in the study area, and different species
need different amount of water) here comes our model, topography determines soil
water determines vegetation
Conclusion and disscussion
Finally we made our model: topography determines water content determines
vegetation. Water content explains the vegetation distribution of the study area. There
might be error with the experimental results due to few of data; much data could
reduce the error. And the data location could be on the boundaries. We should pay
more attention on soil itself, for the differences between zone 5 and zone 7 (they have
a relative same topography, should have the same vegetation according to the model,
but they are slightly different, see picture 5 and 7) is probably due to soil texture.
Furthermore, we should find out the exact name of each species and taxonomy.
Page 19
19
References
Huson T. Hartmann, William J. Flocker, Anton M. Kofranek (1981): Plant Science.
Prentice-Hall, Inc. New Jersey
Nyle C. Brady (1974): The Nature and Properties of Soils (8th edition). Mscmillan
Publishing Co., Inc, New York
Lucas, R.E., and Davis, J.F.(1961): ‘Relationships between pH values of organic soils
and availabilities of 12 plant nutrients’. Soil Sci. 92: 177-182
Lincoln Taiz and Eduardo Zeiger (2002): Plant Physiology (3rd edition). Sinauer
Associates, Inc. Sunderland, MA
H.M. Haitjema, S. Mitchell-Bruker (2005): ‘Are water tables a subdued replica of the
topography?’ GROUND WATER. 43:781
Bouma J., R.B. Brown, and P.S.C. Rao. (1982): ‘Basics of Soil-Water Relationships
-Part I. Soil as a Porous Medium.’ Soil Science. Florida Cooperative Extension
Service. IFAS. Gainesville, FL.
Page 20
20
Glossary
Soil water: water in soil.
Microbes: A living thing so tiny as to be seen only under the microscope; esp. a germ
carrying disease and fermentation.
Macronutrients : Plants used in large amounts from soil.
Micronutrients : Plants used in relatively small amounts.
pH values: normally pH values below 4 and above 10 can be called extreme pH
value.
Priori : in the project refers to previous
Taxonomy: the classification used in science, e.g. of plants and animals
Page 21
21
Appendix
Pictures were taken from the field
Picture 1: Zone 1 (trees)
Picture 2: Zone 2 (Green grass)
Page 22
22
Picture 3: Zone 3 (combination zone, herbs and grasses)
Picture 4: Zone 4 (grass lay down)
Page 23
23
Picture 5: Zone 5 (high grass 1)
Picture 6: Zone 6 (trees grow in water)
Page 24
24
Picture 7: Zone 7 (High grass 2)
Page 25
25
Experiments
When we come to a biotope, we look different type of plant to be growing. What
reasons influence plant distribution? As you know the main factor is soil, including
soil texture, water available, and soil pH. However, vegetation distribution relates
rainfall and landscape. So we build a general ecological model that explains how
conditions and resources influence the distribution of plant that will be discussed in
the models.
In order to find deep evidence as specific as possible. We will study how the soil pH
to effect on vegetation distribution in the RUC-biotope (Behind the University).
Indeed, we are looking forward this experiment shall be tell us the relation between
plant and soil pH, water content. Then the fieldwork will display how to work go to
the RUC-biotope and how to do experiment in the laboratory.
Fieldwork
As we know vegetative growth not only need so many water but also absorb
minerals from soil enter through the root. Is it most important reasons effect on plant
distribution? Apparently in order to get as specific data as possible, we need a
fieldwork to explain it. The fieldwork will go to RUC-biotope as shown in (Pictrue
10). The area has different species of vegetation and those are natural plants that will
be helpful to get precise data. We plan as completely overview of the fieldwork as
possible.
Idea and Plan
We were planned to draw a map of vegetation distributions in the whole of the
RUC-biotope after we carefully survey the area. Because mapping vegetation
distributions can help us to observe distributive zones of plant. So, second step we
will find lines in which through as much vegetation grids as when we finish first step.
Third step we will measure the difference in level between several distributive zones
Page 26
26
of plant. Water differences need us make new plan that will be text from high to low
level’ areas. Each area need three different levels soil, they are 10cm deep soil
measure ph, 50cm and 100cm measure water content.
We will use this overview find soil ph and water how to influence plant distribution.
Whatever the answer isn’t positive.
Work
First step, we walked RUC-biotope to draw mapping vegetation distribution. We used
hand-held sighting compass make sure northerly direction and locate original position.
Then we measured 130 m distance to use 50 m rule from south to north and labeled
second sign. Why do we need 130 m distance? Because we use our eyes to survey
different vegetation zones from west to east in 130 m distance. Then draw original
points of different vegetation zones in the map. Finally we measured about which
change vegetation distributive direction in two measurable points between. Signing all
data on map, we drew a mapping vegetation distribution.
Page 27
27
Picture 11 Levels of Line A and Line B
Second step we could observe clearly two plant distributive lines on the map as shown
in (Line A and Line B in Figure 2.2). Line A and line B through severally different
plant distributive zones of each line. In the process of determining line A and line B
we found to measure the difference in level between several distributive zones of
plant of points.
Third step we used temporary bench mark (TBM) measure different heights in line A
and line B. How to carry out series levelling? The basic procedure is several level
stations and staff points to be established. If we got a positive result indicates a rise in
level, a negative result indicates a fall (e.g. Practical Skills in Environmental Science
Line A
Bush Lay grasses
A B C D E F G
Low grasses Herb and grasses
High grasses
Herb, grasses, low grasses and others
Line B
H LK JI M
a
g
d’
d
h k ’
k m
Page 28
28
in 2000: Surveys and surveying). The difference in level between A and G Line A, H
and M Line B:
Line A = Aa – Dd + Dd’ – Gg
= (Aa + Dd’) - (Dd + Gg)
= (∑ back sights) – (∑ fore sights)
Line B = Hh – Kk’ + Kk – Mm
= (Hh + Kk) - (Kk’ + Mm)
= (∑ back sights) – (∑ fore sights)
Definitions
Back sight: the first sight taken from a new position of the level.
Fore sight: the last sight taken from a position of the level.
We got the level in Line A between different vegetation zones. So that would help us
easily find out which factors influence plant distribution.
Final step, we used corkscrew soil auger to get soil from each area and keep soil on
three bags. But, how to distinguish soil pH and water content that will to be measured?
We packed away soil of testing soil ph in paper bag. Nevertheless, we tested water
content‘s soil that should use plastic bag to pack away soil. Because this way can keep
as more water of soil as possible. Finally, we took eighteen bags come back laboratory,
waiting for measure them in laboratory.
Results
In the process of doing fieldwork, we observed lower levelling’s plants grow in more
water soil. On the other hand we can observe groundwater overflow surface earth.
After finishing whole of fieldwork, our used two days to test soil ph and water
content. Because need waiting for 24 hours at 105°C when we test water content. So,
first day experiment recorded weight of soil and finish testing of soil pH.
Page 29
29
At first, we measured soil’s weight and soil ph from each plastic bag and paper bag.
Because we need shake solution about soil pH 1 hour after we add Calcium Chloride
to soil. So, we start to test water content when we finished first step. We recorded
number of the digel (Digel look like smaller cup, making it use china). Then we
measured weight of digel and weight of digel soils amp 5 g. At the time, record result
in notebook. Finally, we took nine digels into oven and wait tomorrow testing result.
After 1 hour we took nine bottles to measure pH that should use pH meter to get each
bottle’s pH
Other day, we took nine digels from oven to continue testing weight soil after 24
hours at 105°C
Soil Digel Weight
Digel
Weight
Digel Weight After
Water
volume
percentage
Number Number Empty Soils amp 5
g 105°C 24 hours
1 ( 50 cm ) 38 41.1366 g 46.3584 g 46.1845 g 3.33%
2 ( 100 cm ) Z 21 37.9542 g 43.5653 g 42.4329 g 20.18%
3 ( 100 cm ) 5 29.3179 g 34.3071 g 33.5693 g 14.79%
4 ( 100 cm ) B 51 28.7810 g 34.4485 g 33.3251 g 19.82%
5 ( 100 cm ) L 10 39.8420 g 44.0744 g 41.6231 g 36.21%
6 ( 100 cm ) 60 39.3883 g 44.1970 g 40.8059 g 70%
7 ( 50 cm ) L 21 29.6620 g 34.0889 g 32.2735 g 41.01%
Table 3: Water Content testing result
Page 30
30
Zone
Number Soil pH
1 5.165
2 7.587
3 7.57
4 7.703
5 8.06
6 7.616
7 7.596
Table 4: Soil pH testing result
Data calculation
We need calculate water percentage in soil use (water weight / soil sample *100). The
result is in Table 2.3.