University of Cape Town Does the availability of shade limit use of waterholes by desert birds? Salamatu Abdu Supervisors: Dr Susan J. Cunningham Prof. Peter G. Ryan Prof. Andrew E. McKechnie DST/NRF Centre of Excellence Percy FitzPatrick Institute of African Ornithology University of Cape Town Rondebosch 7701 South Africa Submitted in partial fulfilment of the requirements for the degree of Master of Science in Conservation Biology by coursework and dissertation February 2015
Transcript
Univers
ity of
Cap
e Tow
n
Does the availability of shade limit use of
waterholes by desert birds?
Salamatu Abdu
Supervisors:
Dr Susan J. Cunningham Prof. Peter G. Ryan
Prof. Andrew E. McKechnie
DST/NRF Centre of Excellence Percy FitzPatrick Institute of African Ornithology
University of Cape Town Rondebosch 7701
South Africa
Submitted in partial fulfilment of the requirements for the degree of Master of Science in Conservation Biology by coursework and dissertation
February 2015
The copyright of this thesis vests in the author. No quotation from it or information derived from it is to be published without full acknowledgement of the source. The thesis is to be used for private study or non-commercial research purposes only.
Published by the University of Cape Town (UCT) in terms of the non-exclusive license granted to UCT by the author.
Univers
ity of
Cap
e Tow
n
2
The copyright of this thesis vests in the author. No quotation from it or information derived from it is to be published without full acknowledgement of the source. The thesis is to be used for private study or non-commercial research purposes only. Published by the University of Cape Town (UCT) in terms of the non-exclusive license granted to UCT by the author.
Climate change poses a major threat to living organisms, with maximum temperatures expected
to continue to rise over the next few decades. Hot desert environments are particularly at risk
because they experience high environmental temperatures, scarce vegetation, low productivity
and unpredictable water sources. Endotherms such as birds face the challenge of maintaining a
stable body temperature while avoiding dehydration. This study was carried out in the southern
Kalahari, in South Africa’s Northern Cape, where about 50% of bird species (36 species) depend
on free-standing drinking water. Livestock farms within this area provide artificial water points,
which benefit birds as well as livestock. This study determined the role of shade and cover in the
use of these artificial water points by birds. An experiment was conducted at six waterholes
using the Before-After, Control-Impact (BACI) design. After an initial baseline was established,
three waterholes were shaded while the other three were left unshaded. Camera traps were used
to record the pattern and intensity of water use by bird species at different times of the day and at
varying air temperatures.
A total of 36 bird species drank at the waterholes, but data analysis was confined to the ten most
abundant species. Of the ten, six species responded to the presence of shade/cover, with four
species reacting positively (Cape Glossy Starling Lamprotornis nitens, Red-headed Finch
Amadina erythrocephala, Black-throated Canary Serinus atrogularis, and Laughing Dove
Spilopelia senegalensis), four showing no significant change in drinking patterns, and two
showing a decrease in visitor numbers when the site was shaded (Cape Turtle-Dove Streptopelia
capicola, Namaqua Dove Oena capensis). This suggests that providing shade at waterholes is not
a universal solution to the problem of increasing heat stress experienced by birds coming to
5
drink. Certain species such as the Laughing Doves and Cape Turtle-Doves avoided waterholes
during the warmest time of the day while the Namaqua Doves were frequent visitors at this time.
However, the Laughing Dove took advantage of the shade provided at midday (warmest
temperatures) as their numbers increased. The Red-headed Finch and Black-throated Canary also
increased at waterholes with temperature irrespective of the time of day. These patterns imply
that the provision of shade modifies the behavior of some bird species in response to predation
risk or heat stress. These species utilized shade at different times of day and with varying
intensities as temperatures rose.
6
Plagiarism declaration
1. I know that plagiarism is wrong. Plagiarism is to use another's work and pretend that it is one's
own.
2. I have used the Conservation Biology journal style for citation and referencing. Each
contribution to, and quotation in, this assignment from the work(s) of other people has been
attributed, and has been cited and referenced.
3. I acknowledge that copying someone else’s assignment or essay, or part of it, is wrong and
that this assignment is my own work.
4. I have not allowed, and will not allow, anyone to copy my work with the intention of passing
it off as his or her own work.
Signature
Date: 13 February 2015
Signature Removed
7
Acknowledgements
I am very grateful to my family who has always had me in their thoughts and prayers. To my
siblings (Hannatu Abdu, Ayuba Abdu and Ibrahim Abdu) thanks for encouraging me every step
of the way and having faith in me even when I thought I couldn’t make it. Thanks to the best
Dad for sharing his wonderful ideas and always been there for me. My Mum (although no longer
with us) was my biggest fan and my great source of encouragement over the past years.
The FitzPatrick and BioSciences support staff helped me in innumerable ways. Chris Tobler
assisted with designing my wooden frames and getting all the wood and shade cloth needed.
George du Plessis and Granville Faulmann helped to prepare the wood frames. Anthea Links
assisted with shopping and made sure I had all the equipment and materials I required. Tania
Jansens helped with finances, and made sure I had enough money in the field. Hilary Buchanan
was like a mother even before I arrived at the Fitz and always gave a helping hand any time it
was wanted.
I also thank Willie and Susanne Rossouw, for their warm and welcoming arms and in giving me
the opportunity to work on Farm Murray. Sue Schultz, thanks for being a good partner while
walking under the burning Kalahari sun in search of birds. Thanks to my friends both in South
Africa and at home in Nigeria for being supportive. Thanks also to the conservation biology class
of 2014 for the advice, support, encouragements and fun times; you were my second family.
I thank my supervisors and the Hot Bird’s project team whom I worked with over the past few
months for providing constructive criticisms, support and advice. Andrew McKechnie, thanks for
your inputs and quick responses despite your tight schedules. Peter Ryan provided funding and
8
assisted when needed in spite of his busy schedule. Michelle Thompson thanks for the fun times
when we dug holes, erected wooden frames and stapled shade cloths. You were the best
company one could have out in the Kalahari. And finally, Susan Cunningham, thank you for
being the best supervisor one could ever ask for, for making efforts to be with me in the field and
pushing me to put in my best.
9
Introduction
Climate change poses a major threat to organisms and ecosystems with global temperatures
predicted to continue rising rapidly over the coming decades (Hoffman 2010). The impact of this
warming will not only result in record extreme temperatures, but average temperatures will also
increase (IPCC 2011). General circulation models predict increases in maximum temperatures
and frequency, intensity and duration of heat waves (IPCC 2011). Climate change is also
associated with increasingly severe weather conditions such as droughts and floods (Kusangaya
et al. 2014). Human activities such as urbanization, deforestation and industrialization have also
played a major role in accelerating climate change (Trenberth et al. 2007). Africa has been
regarded as a continent susceptible to climate change (Callaway 2004), with average
temperatures expected to increase by 0.02ºC per year in southern Africa (Morishima and
Akasaka 2010). The southern Kalahari and surrounding areas in north-western South Africa are
undergoing the fastest rates of warming compared to other regions of the country, potentially
leading to a negative impact on biodiversity due to the increase in evaporation rates and rising
temperatures (Kruger and Sekele 2012).
Climate change has led to major range shifts (Hughes 2000; Wuethrich 2000; McCarty 2001;
Ottersen et al. 2001; Walther et al. 2001) and increased extinction risk for many organisms
globally (Chown et al. 2010). High environmental temperatures have had major impacts on
species geographical distributions (Hughes 2000; Wuethrick 2000; McCarty 2001; Ottersen et al.
2001; Walther et al. 2001). The factors influencing the movement of species are complex. Range
shifts do not necessarily occur due to gradual changes observed within the environment but could
be due to episodic events (Walther et al. 2001). However species also move in search of food,
10
water and habitats suitable for reproduction (Walther et al. 2002). Water resources are expected
to be most impacted due to increasing evaporation rates, with decreases in the amount of run-off,
soil moisture content and the availability of groundwater (Gleick 1989; IPCC 2007). Research
efforts in this field have focused on modelling future changes and expected consequences
(Chown et al. 2010) in order to tackle this dilemma.
Water regulation in endotherms
The performance of biochemical and organismal systems depends a great deal on temperature
(Boyles et al. 2011). Endotherms, such as mammals and birds, possess the ability to maintain a
stable body temperature through metabolic processes. All endotherms (animals that can regulate
their body temperatures) have a range of environmental temperatures within which the metabolic
costs of maintaining a stable body temperature are minimized, the thermo-neutral zone (TNZ).
Birds as well as mammal body temperatures vary among and within species (Geiser and Ruf
1995; McKechnie and Lovegrove 2002). When active, birds can attain mean body temperatures
ranging from 36-45°C (Prinzinger et al. 1991). Endotherms have to expend energy when the
environmental temperature falls outside the TNZ (McNab 2002; Kronfeld-Schor and Dayan
2013). Water plays a key role in regulating body temperature when environmental temperatures
approach or exceed body temperature (Boyles et al. 2011). Above the TNZ, endotherms can
reduce their heat burden through changes in location (microhabitat), posture and behaviour.
However, once environmental temperatures approach or exceed body temperature, they rely
heavily on evaporative water loss to regulate heat loss, increasing the demand for water and
risking dehydration, which impairs performance and can result in death (Calder and King 1974;
Tieleman and Williams 1999). Evaporative water loss is particularly crucial for terrestrial
organisms that have limited access to external water sources. Therefore in hot arid environments
11
animals try to balance thermoregulation and hydration. In dealing with this dehydrated mammals
and birds allow body temperatures to rise (Angilleta et al. 2010). For instance by waiting twice
as long before panting began, Emus (Dromaius novaehollandiae) conserved body water by
avoiding evaporative cooling when dehydrated at air temperatures of about 45°C. Brain cooling
is another strategy endotherms can use to tolerate elevated body temperatures when dehydrated.
This strategy stops the brain from acting on mechanisms associated with evaporative cooling
allowing body temperature to continue rising while preventing water loss (Mitchell et al. 2002).
It has been noted in sheep where those dehydrated and involved in brain cooling attained higher
body temperatures than hydrated individuals (Fuller et al. 2007). Although all these strategies
help endotherms to deal with high temperatures, there are physiological constraints on the upper
temperature limits endotherms can tolerate (Boyles et al. 2011). Therefore, it is a challenge for
endotherms to be able to adapt and adjust body processes due to environmental changes fueled
by climate change.
Most birds and mammals are endotherms that can reduce their energy expenditure in the face of
harsh environmental conditions (Geiser and Ruf 1995; McKechnie and Lovegrove 2002). Surface
area to volume ratios generally increase with decreasing body size, which is of advantage and
efficient for individuals with a larger surface area to volume ratio in releasing heat passively and
therefore are less at risk of dehydration (Geiser 2004). Amongst endotherms, birds tend to
maintain higher body temperatures and mass-specific metabolic rates than mammals (McNab
1970). Birds inhabiting desert environments benefit from facultative (adaptive) hyperthermia
(Tieleman and Williams 1999). This is a situation whereby their body temperatures increase by
2–4ºC above normal to reduce the rate of evaporative water loss (Tieleman and Williams 1999).
This process also facilitates the passive loss of heat through radiation and convection (Calder and
12
King 1974; Tieleman and Williams 1999). Hyperthermia could be advantageous where birds
retain heat within their body tissues and only release it when environmental conditions improve
through non-evaporative ways (Bartholomew and Dawson 1968; Calder and King 1974).
Birds make use of cutaneous and respiratory water loss as mechanisms for evaporative cooling,
but the importance of these pathways varies among taxa (McKechnie and Wolf 2004). Cutaneous
evaporation involving loss of water through the skin commonly utilized by Columbiformes
(McKechnie and Wolf 2004) plays an important role in dealing with heat stress than previously
thought (Webster and King 1987). While respiratory evaporation includes heat dissipation
behaviours such as panting and gular fluttering. Panting, which is common in Passeriformes,
enhances evaporative water loss and allows the birds to cool down faster through increased
respiratory ventilation (Robertshaw 2006) in the buccal cavity and trachea of pigeons (Ramirez
and Bernstein 1976) and flamingos (Bech et al. 1979). Gular fluttering uses rapid movements of
the gular pouch within the throat to enhance heat loss (Robertshaw 2006). These behaviours may
occur at mild to warm temperatures (30-40ºC), usually below a bird’s body temperature
(Webster and King 1987; Powers 1992). Evaporative heat dissipation is affected by the humidity
of the atmosphere (Lasiewski et al. 1966; Webster and King 1987; Powers 1992; Gerson et al.
2014). Evaporative cooling is less suitable for birds faced with the challenge of increasing air
temperatures on cloudy days prior to rain, when there is high moisture content within the
atmosphere as compared to clear, sunny and cloudless days (Lovegrove 2000). High humidity
reduces the efficiency of heat lost through evaporation (Calder and King 1974; Weathers 1997).
13
Vulnerability of birds to high temperatures
Birds, because of their small body size, predominantly diurnal habits and limited use of
thermally buffered microsites, are particularly vulnerable to extreme heat waves (Wolf and
Walsberg 1996). When air temperatures exceed their body temperature, even inactive small birds
in shaded microsites can experience rates of evaporative water loss exceeding 5% of body mass
per hour (Wolf and Walsberg 1996), rapidly exceeding their limits of dehydration tolerance.
Under these conditions, birds have insufficient water to maintain body temperatures below lethal
limits. As a result, extremely hot weather events occasionally lead to high avian mortality rates
(McKechnie and Wolf 2010). Increasing body temperatures alter enzyme activity (Daniel et al.
2010), damage mitochondrial membranes, affect other organelle functions, and decrease
adenosine triphosphate (ATP) production (Abele et al. 2002), thereby starving body cells,
reducing an individual’s lifespan and decreasing fitness (Monaghan et al. 2009). In 2009,
thousands of birds died near Carnarvon in Western Australia during a severe heat wave (Towie
2009). Numbers of endangered Carnaby's Black Cockatoos (Calyptorhynchus latirostris) have
continued to decline due to intense heat waves and associated severe hail storms, which led to
injuries, multi-organ hemorrhage and ultimately death (Saunders et al. 2011). These extreme
events also lead to alterations in demographic structures and genetic diversity, affect species
within populations and deaths which may affect different age classes. Birds are not the only taxa
vulnerable to extreme temperature events, bats (only mammals capable of flying) face similar
challenges. For example a greater number of tropical black flying foxes Pteropus Alecto (10 –
13%) died than temperate gray-headed foxes Pteropus poliocephalus (< 1%) exposed to similar
high air temperatures with a higher mortality in young and adult females than in adult males
14
(Welbergen et al. 2008). This implies that both sub-species have varying abilities in coping with
high air temperatures.
Challenges faced by birds relying on preformed water
Desert birds show considerable interspecific variation in their drinking requirements, and a large
proportion (60–70%) of species in Australian and Namib desert bird communities are considered
to be independent of free water, either being never observed drinking water or only visiting water
resources occasionally (Fisher et al. 1972). In the Kalahari, 50% of the bird community (36 bird
species) seldom drinks, although a few of these species visit waterholes on days when maximum
temperatures were about 37ºC (Smit 2013), suggesting that they may have been pushed close to
their thermal limits. Species that seldom if ever drink free-standing water rely largely on their
diets to supply them with pre-formed water (Smit 2013). In the Americas for example, White-
winged Doves (Zenaida asiatica) feed on water-rich saguaro cactus (Carnegiea gigantea) fruit in
mid-summer, which serves as a major source of water (Wolf et al. 2002). Other species feed on
water-rich prey such as insects, other birds or small mammals (Labuschagne 1959).
Alternatively, oxidative water is available to birds feeding on low-water content diets such as
seeds e.g. Dune Larks Calendulauda erythrochlamys in the Namib Desert (Williams 1999;
2001). In most cases the oxidative water gained exceeds the amount lost through evaporation
(Williams 1999). Limited food resources often force desert birds to forage during hot weather
conditions (Tieleman and Williams 2002), posing the potential risk of water and energy
expenditure rates exceeding intake rates (du Plessis et al. 2012). This can result in a serious
threat of dehydration, especially because increasing environmental temperatures can interfere
with foraging activities. For instance foraging efficiency by Southern Pied Babblers (Turdoides
bicolor) is reduced on hot days (~ 35.5°C), resulting in their inability to obtain enough food to
15
compensate for body mass loss overnight (du Plessis et al. 2012). White-browed Sparrow-
weavers (Plocepasser mahali) forage less often at temperatures above 40°C, resulting in low
water consumption (Smit 2013). At such air temperatures these birds may be forced to drink
free-standing water to compensate for water lost via evaporation which cannot be offset due to
reduced foraging activities (Smit 2013).
Temperature dependency of birds on free-standing water
The presence of free-standing water in desert habitats could therefore be an important
determinant of local avian community structure and diversity. For example, proximity to
waterholes could play a major role in increasing the numbers of resident species that rely on
drinking water in the Kalahari. At Tswalu Game Reserve in the southern Kalahari, South Africa,
Smit (2013) reported that regular drinkers did not increase frequency of visits when daily air
temperatures rose, contrasting with what Fisher et al. (1972) found in Australia. A possible
explanation for this discrepancy observed by Williams and Koenig (1980) could be that at high
environmental temperatures frequent drinkers such as Laughing Doves (Spilopelia senegalensis),
Cape Turtle-Doves (Streptopelia capicola) and Namaqua Doves (Oena capensis) drank more
water during a single visit rather than increasing the number of visits to avoid expending more
energy (Smit 2013).
Trade-offs involved in accessing scarce water resources at unshaded microsites
At high ambient temperatures, when bird activity levels such as food consumption become low
(Seibert 1949) and evaporative water loss increases (Wolf and Walsberg 1996), some birds may
need to visit water sources to maintain a hydrated state and in doing so they are faced with
tradeoffs (McKechnie et al. 2012). Some birds, for example sandgrouse (Pterocles spp.), fly
16
great distances to drink, increasing energy expenditure and facing the risk of their body
temperature reaching lethal limits (Hudson and Bernstein 1981). Significant amounts of water
just obtained from surface water could be lost when embarking on a return flight under hot
weather conditions (Smit 2013). In addition, the risk of predation is high at isolated free-standing
water surfaces because birds can be easily spotted by their predators (Cade 1965). Foraging
within shaded habitats served as cover from predators while birds felt insecure even at open sites
closer to shelter (Molokwu et al. 2010). Birds visiting water sources or foraging grounds shaded
by vegetation are expected to experience lower environmental temperatures and reduced
metabolic costs (Molokwu et al. 2010) as opposed to those located in the sun (Smit 2013). The
type of shade could also influence the amount of sun that would be blocked. Provision of shade
at waterholes could therefore be important under climate change because temperatures are
expected to keep rising. Direct hyperthermia associated with reduced performance could lead to
more deaths in birds than dehydration as observed by Finlayson (1932) where thousands of birds
were found dead around a waterhole unable to drink after an extreme heat wave (~ 49ºC).
Therefore at shaded waterholes the tradeoff between dehydration and hyperthermia could be
greatly reduced during intense heat waves (McKechnie et al. 2012).
Aim of study
This study assessed whether the use of artificial water points by Kalahari birds was limited by
the availability of shade, by experimentally providing shade at some waterholes. It also assessed
whether some bird species only drank once shade was provided. The outcome of this study will
help in making conservation management aware of birds within this community at risk due to
rising environmental temperatures driven by climate change as well as seeking solutions to assist
certain bird species. This can be achieved by noting which species are highly dependent on free-
17
standing water surfaces when temperatures get hotter and how they respond to shade. This study
first examined patterns of water use by Kalahari bird species in terms of which species drank and
when they drank in relation to time of day and temperature. Secondly, it evaluated the effect of
experimental shading on patterns of water use by bird species in the Kalahari.
Research question
Does the availability of shade influence the pattern of waterhole use by birds at different
environmental temperatures?
Does shade influence bird behavior to perceived predation risk?
Does shade influence the intensity of waterhole use during heat stress?
In order to avoid dehydration during very hot weather, birds reliant on open water sources must
drink. However, there is no shade at most water sources available in the Kalahari, so birds are
exposed to high environmental temperatures in the full sun and predation risk while drinking.
Birds must therefore make a trade-off between avoiding dehydration and avoiding hyperthermia
and predation.
18
Methods
Study Area
The study took place during October and November 2014 at Farm Murray (26° 59’S, 20° 52’E)
in the southern Kalahari Desert, Northern Cape, South Africa (Figure 1). This is a semi-desert
region with maximum air temperatures of over 40°C and average air temperatures of about 35ºC
usually higher than most of southern Africa during summer (October – April; Kruger and
Shongwe 2004). The area is characterized by sparse, arid savannas on deep red sands and
immobile dunes with a relatively low relief in comparism to other parts within the country
(Perkins and Thomas 1993). Rainfall is erratic and unpredictable with 100-400 mm per year
occurring predominantly during summer (Lovegrove 1993). The vegetation consists of grasses
(Stipagrostis amabilis), scattered shrubs (Rhigozum trichotomum) and woody cover (Vachellia
erioloba, Senegalia mellifera, V. haematoxylin, Boscia albitrunca; Palmer and van Rooyen
1998). The significant presence of woody cover is as a result of a dry river bed (the Kuruman
River) at the northern boundary of the farm, which supplies underground water. Farm Murray
conducts pastoral agriculture with sheep and cattle as well as game hunting. The six
experimental sites (Figure 1) selected were located on the farm within dune streets with
waterholes usually made out of plastics or metal. The six waterholes were chosen based on those
accessible while others were restricted, this included waterholes frequently utilized by cattle as
they could pull down wooden frames and destroy cameras. In spite of this, it was ensured that
each one represented the community of birds in those areas on Farm Murray while avoiding an
overlap where two or more waterholes were within close distances as shown below.
19
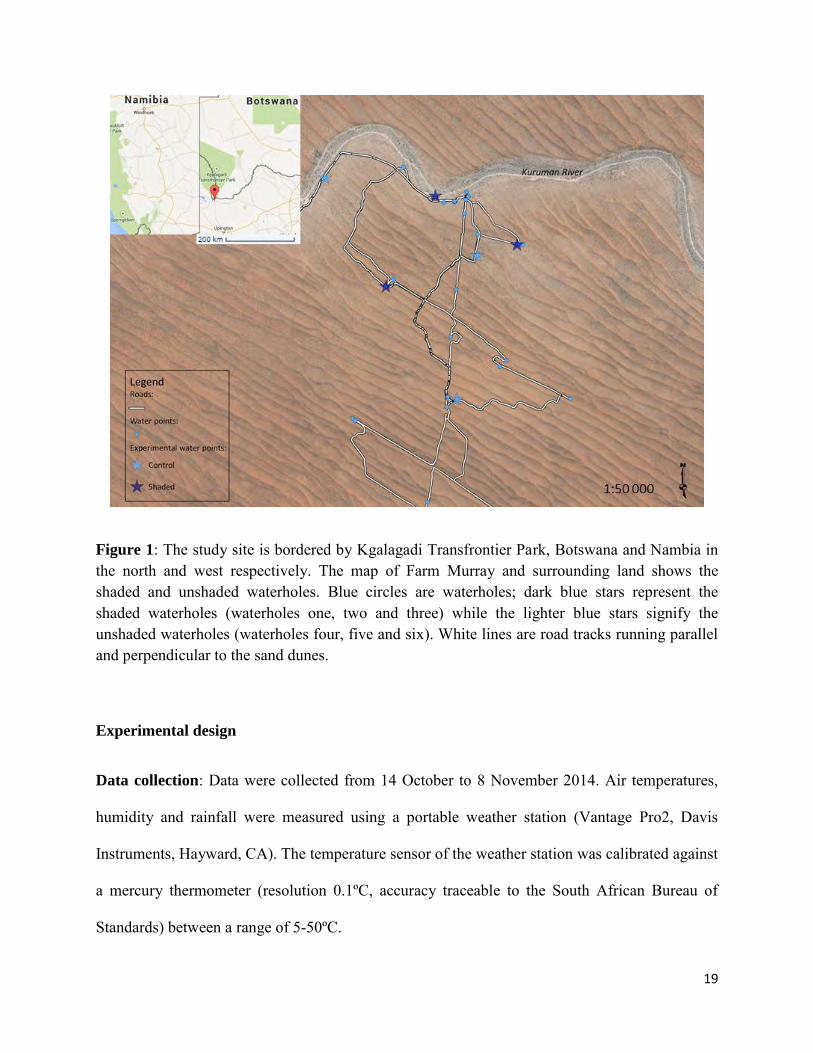
Figure 1: The study site is bordered by Kgalagadi Transfrontier Park, Botswana and Nambia in the north and west respectively. The map of Farm Murray and surrounding land shows the shaded and unshaded waterholes. Blue circles are waterholes; dark blue stars represent the shaded waterholes (waterholes one, two and three) while the lighter blue stars signify the unshaded waterholes (waterholes four, five and six). White lines are road tracks running parallel and perpendicular to the sand dunes.
Experimental design
Data collection: Data were collected from 14 October to 8 November 2014. Air temperatures,
humidity and rainfall were measured using a portable weather station (Vantage Pro2, Davis
Instruments, Hayward, CA). The temperature sensor of the weather station was calibrated against
a mercury thermometer (resolution 0.1ºC, accuracy traceable to the South African Bureau of
Standards) between a range of 5-50ºC.
20
Experiment design: A before-after, control-impact (BACI) design was employed to test main
effects and interactions between two experimental phases (before and after shading waterholes)
and two treatments (troughs that stayed unshaded throughout and waterholes shaded in the
second phase of the experiment; Green 1979; Stewart-Oaten et al. 1986; Skalski and Robson
1992). There were six waterholes; three experimental and three controls. The main focus of the
experiment was to determine if the intensity of waterhole use by bird species is altered by
providing additional shade. A secondary goal was to examine the effect of factors such as time of
day and air temperature on the number of birds drinking (Box and Norman 1971). BACI is a
recommended approach to help determine changes by examining both experimental phases and
the shaded versus unshaded sites. This eliminates the possibility that variables not considered
might influence observations (McDonald et al. 2000). In this study it separates the effect of the
treatment from the background effects of changes in temperature and rainfall as the season
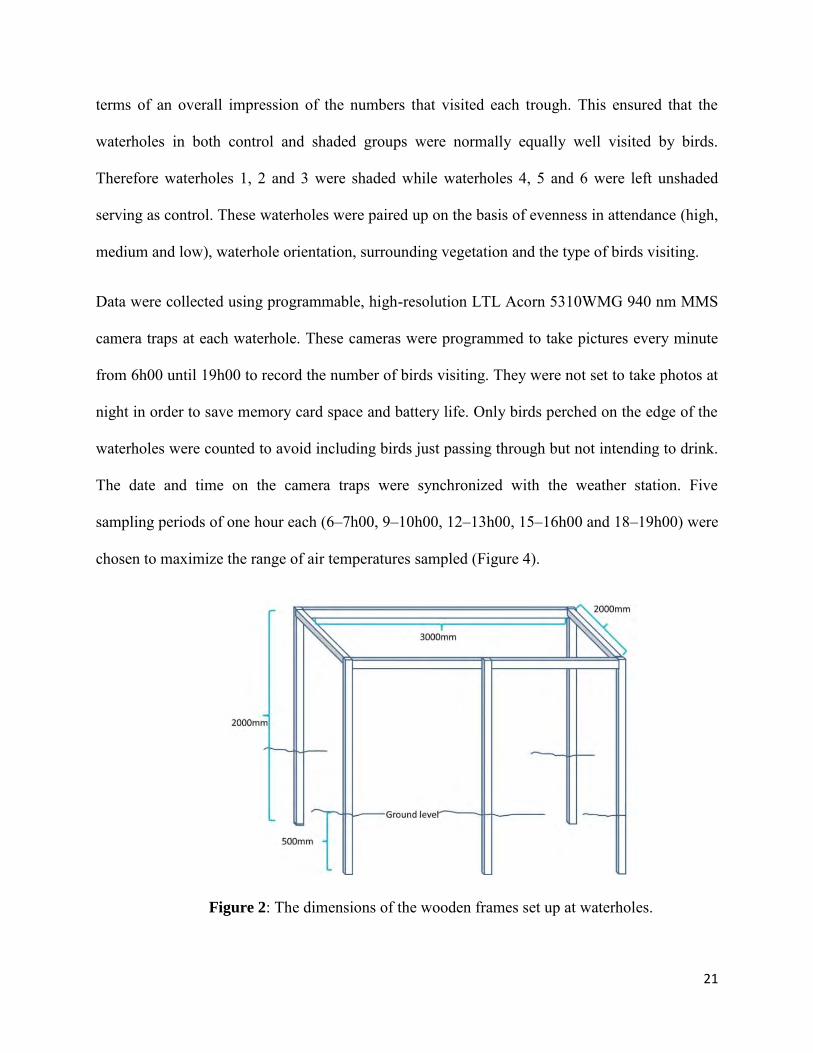
progressed. Wooden frames were erected over six waterholes. The frames were designed to
support a heavy-weight dark blue shade-cloth canopy that blocked approximately 80% of solar
radiation to shade the waterholes during the hottest period of the day (12h00–16h00). The shade
frames were 3 m x 2 m and raised 1.5 m above the ground (supported by poles sunk 0.5 m in the
ground; Figure 2). No data were collected in the six days after the frames were erected and five
days after the shade cloth were added to allow the birds to acclimatize to the frames and cloth
respectively. No observations were made before the start of the experiment and little time was
allocated for birds to acclimatize due to time constraint. Thereafter observations were made for
12 days excluding rainy days. From 30 October to 8 November 2014 three of the six frames were
covered with the heavy-weight dark blue shade cloth (Figure 3). Experimental waterholes were
chosen by examining the intensity of use by birds during the first phase of the experiment, in
21
terms of an overall impression of the numbers that visited each trough. This ensured that the
waterholes in both control and shaded groups were normally equally well visited by birds.
Therefore waterholes 1, 2 and 3 were shaded while waterholes 4, 5 and 6 were left unshaded
serving as control. These waterholes were paired up on the basis of evenness in attendance (high,
medium and low), waterhole orientation, surrounding vegetation and the type of birds visiting.
Data were collected using programmable, high-resolution LTL Acorn 5310WMG 940 nm MMS
camera traps at each waterhole. These cameras were programmed to take pictures every minute
from 6h00 until 19h00 to record the number of birds visiting. They were not set to take photos at
night in order to save memory card space and battery life. Only birds perched on the edge of the
waterholes were counted to avoid including birds just passing through but not intending to drink.
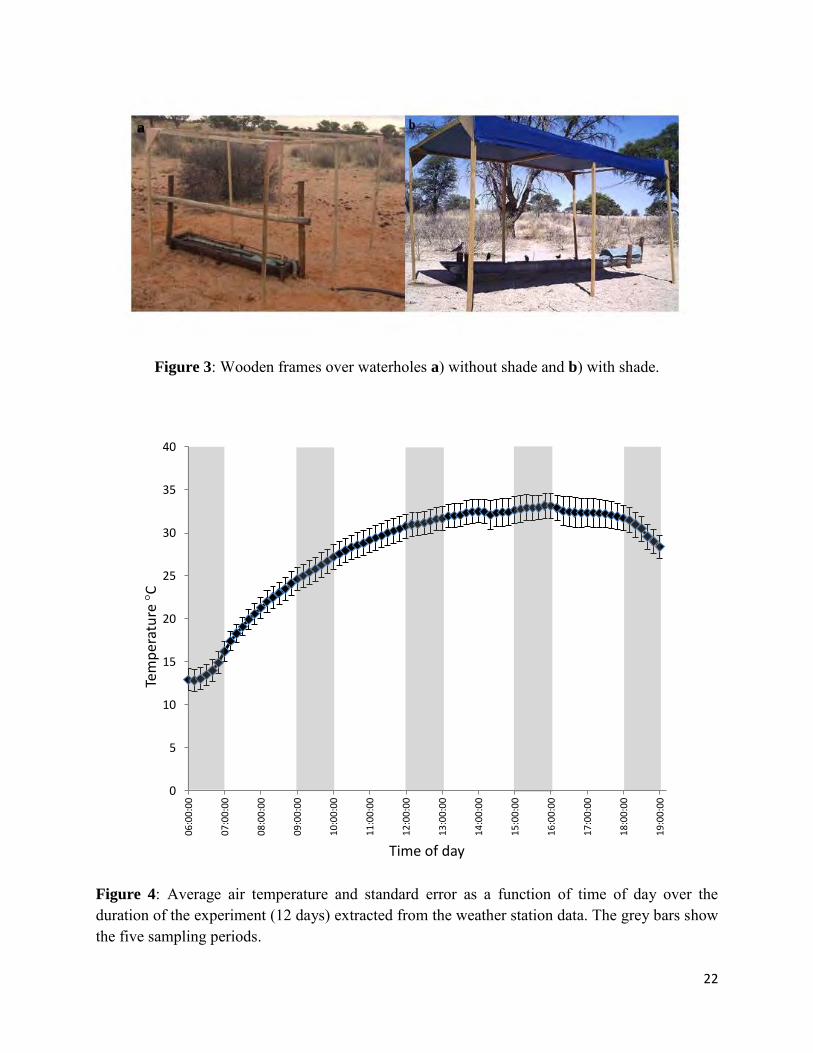
The date and time on the camera traps were synchronized with the weather station. Five
sampling periods of one hour each (6–7h00, 9–10h00, 12–13h00, 15–16h00 and 18–19h00) were
chosen to maximize the range of air temperatures sampled (Figure 4).
Figure 2: The dimensions of the wooden frames set up at waterholes.
22
Figure 3: Wooden frames over waterholes a) without shade and b) with shade.
Figure 4: Average air temperature and standard error as a function of time of day over the duration of the experiment (12 days) extracted from the weather station data. The grey bars show the five sampling periods.
0
5
10
15
20
25
30
35
40
06
:00
:00
07
:00
:00
08
:00
:00
09
:00
:00
10
:00
:00
11
:00
:00
12
:00
:00
13
:00
:00
14
:00
:00
15
:00
:00
16
:00
:00
17
:00
:00
18
:00
:00
19
:00
:00
Tem
per
atu
re °C
Time of day
a
23
Statistical Analysis
All analyses were carried out in the R statistical environment (R version 0.98.1091, RStudio
2014) using the R-studio interface (R Development Core Team 2014). Results were deemed
statistically significant if p < 0.05. Differences in mean daily temperature between the first and
second phase of the experiment was assessed using a two-tailed t-test.
General patterns of water use
A Generalized Linear Model (GLM) with Poisson distribution was fitted to data collected during
the initial phase of the experiment (before shading), in order to examine general patterns of water
use by the abundant bird species recorded drinking. The response variable for this model was the
number of birds per hour calculated by summing up the number of birds seen drinking across an
entire hour. Fixed factors included time of day, temperature and waterhole identity. Model
assumptions were checked by visually examining residual plots.
Effect of experimental shading on intensity of water use
A Generalized Linear Mixed-Effects Models (glmer) from the package lme4 version 1.1-7 (Bates
et al. 2014) was used to assess the impact of adding artificial shade to waterhole use by birds.
The intensity of waterhole use by birds was modeled as a function of experiment phase (Phase 1:
before shading and Phase 2: after shades were put up at half of the waterholes), treatment group
(control: waterholes that were never shaded; and shade: waterholes that were shaded in Phase 2),
and the interaction between the two. Waterhole identity was treated as a random factor to allow
for repeated measures and to accommodate differences between the six waterholes. A model of
the number of birds per hour, assuming a Poisson error distribution, would not converge, so it
24
was re-run as a binomial distribution of the proportion of photos out of the 60 taken in an hour in
which the species of interest were present. This variable was used as an index of the intensity of
use of the waterhole by each bird species. This glmer was run on the entire dataset to examine
the effect of shading on the abundant bird species as a whole, as well as on each of the 10
abundant bird species in Table 1. Each model was checked for over-dispersion, and only the
model for Sociable Weavers was found to be over-dispersed. Therefore an individual-level
random factor was included in this model to compensate for the over-dispersion.
To investigate patterns of waterhole use by birds in relation to temperature and time of day, and
to assess whether providing shade altered these patterns of use, the data set was subset into
“Phase 1” and “Phase 2” sections. Binomial models were fitted to these data, with response
variable the proportion of photographs with birds present out of the 60 photographs taken per
hour, while the explanatory variables included time of day, temperature, treatment and all three
interaction terms. Waterhole was excluded as a random factor because it prevented the models
from converging, but was instead included as a fixed factor to control for waterhole specific
effects during Phase 1 of the experiment. This could be due to too few data.
Baseline patterns of water use during Phase 1 of the experiment (before shading)
To determine the pattern of use of waterholes before shading by different bird species the
explanatory variables included the waterhole (wtr), time of day (h), quadratic function of time of
day (h2), temperature (Ta), and the interaction between time of day and temperature (h*Ta). All
variables were treated as categorical except for temperature measured as a continuous variable.
The dredge function in the MuMIn package version 1.12.1 performed an automated selection of
models with all possible different combinations of the above variables with associated model
25
weights, degree of freedom, loglikelihood and AICc (Second-order Akaike Information Criterion
values). Using AICc, a subset of models was chosen, including all models within 2 AICc points
of the best model. From this subset, the simplest nested model (containing the smallest number
of factors) was chosen as the best model, following Arnold (2010). After running the chosen
models the summary included variables that were important to certain species. It is important to
note the variables that influence a bird’s behavior in the absence of shade.
Patterns of water use during Phase 2 of the experiment: the effects of providing shade
To determine whether providing shade altered the pattern of use of waterholes during Phase 2 of
the experiment (after shading) by different bird, species the explanatory variables included the
time of day (h), quadratic function of time of day (h2), temperature (Ta), treatment (trt),
interaction between time of day and temperature (h*Ta), interaction between temperature and
treatment (Ta*trt) and finally the interaction between time of day and treatment (h*trt). Selection
of the best model for each bird species was carried out as described above. Shading was deemed
to have had an effect on bird behavior if interaction terms between treatment and time of day,
and treatment and temperature were statistically significant: that is, if birds used the shaded
waterholes in a different manner from the control (unshaded) waterholes, during this time period.
After shading, it is important to note the variables that interact with treatment in order to identify
what variable influences the use of shade.
26
Results
Study Species
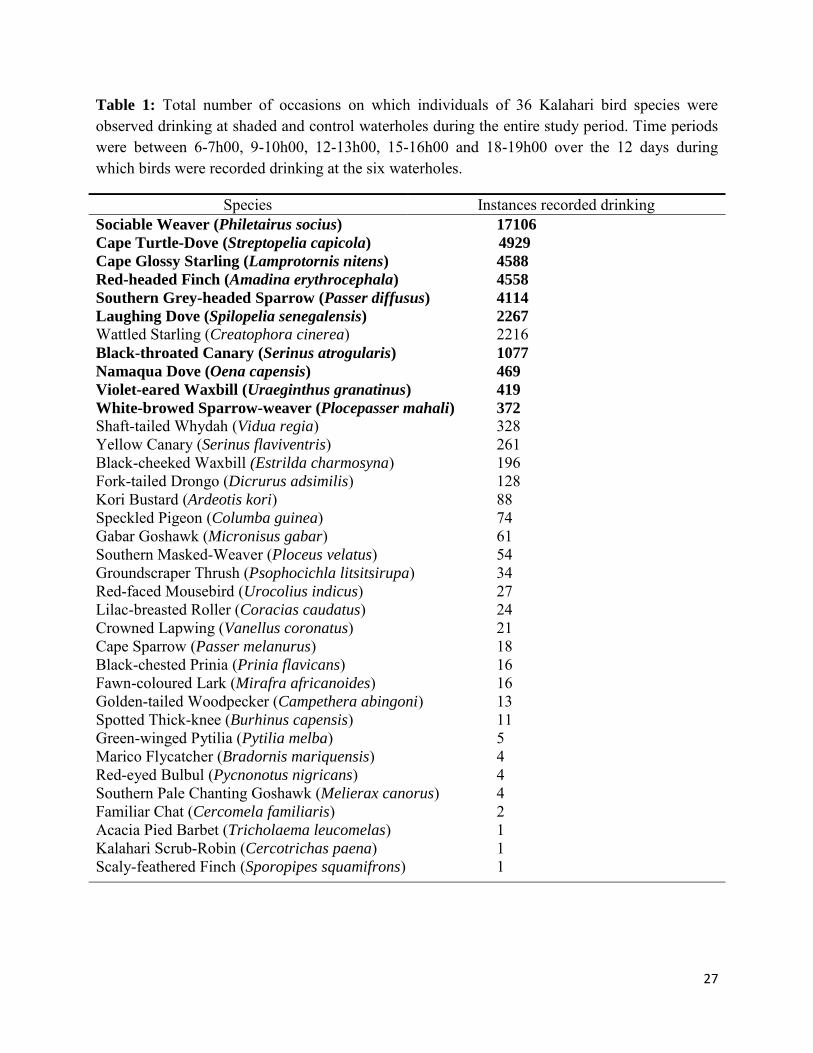
A total of 36 bird species were recorded drinking at farm waterholes during this study. Excluding
nomadic Wattled Starlings (Creatophora cinerea), which were present only until the end of
October, the ten most abundant species found drinking at waterholes were selected for further
analysis (Table 1). Drinking records for each of these species ranged from several hundreds to
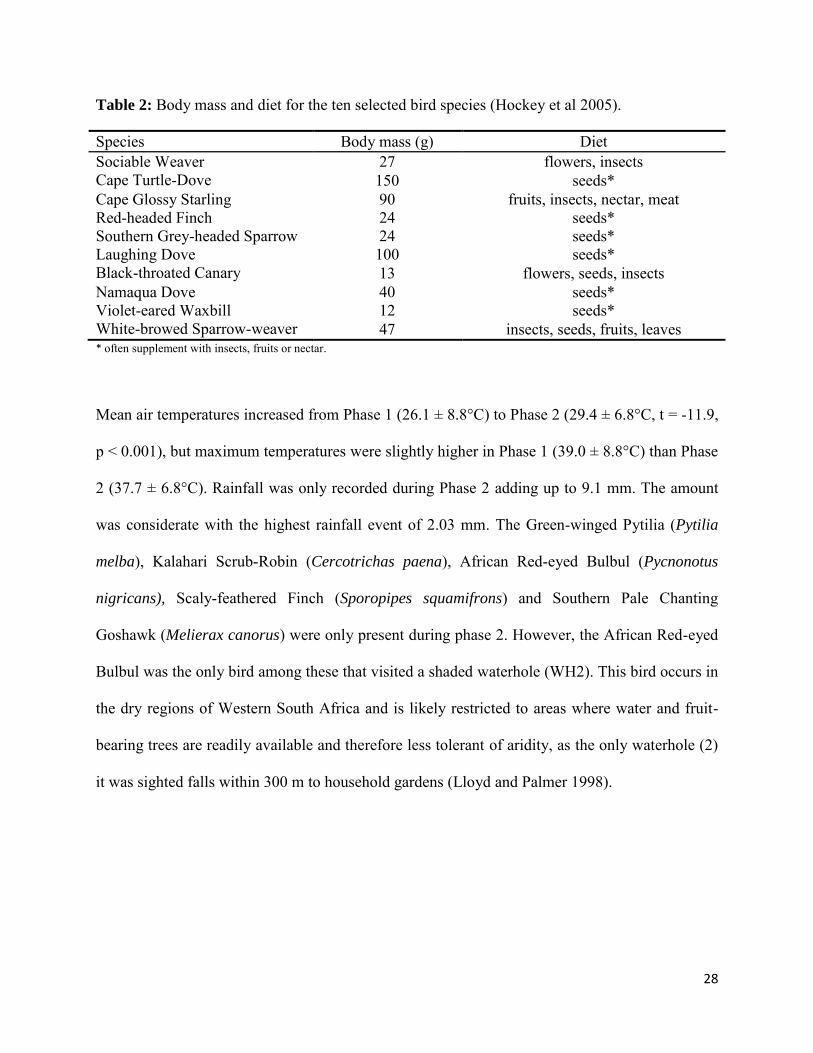
several thousands. Their associated body masses and diets are listed (Table 2).
27
Table 1: Total number of occasions on which individuals of 36 Kalahari bird species were observed drinking at shaded and control waterholes during the entire study period. Time periods were between 6-7h00, 9-10h00, 12-13h00, 15-16h00 and 18-19h00 over the 12 days during which birds were recorded drinking at the six waterholes.
Species Instances recorded drinking Sociable Weaver (Philetairus socius) 17106
nigricans), Scaly-feathered Finch (Sporopipes squamifrons) and Southern Pale Chanting
Goshawk (Melierax canorus) were only present during phase 2. However, the African Red-eyed
Bulbul was the only bird among these that visited a shaded waterhole (WH2). This bird occurs in
the dry regions of Western South Africa and is likely restricted to areas where water and fruit-
bearing trees are readily available and therefore less tolerant of aridity, as the only waterhole (2)
it was sighted falls within 300 m to household gardens (Lloyd and Palmer 1998).
29
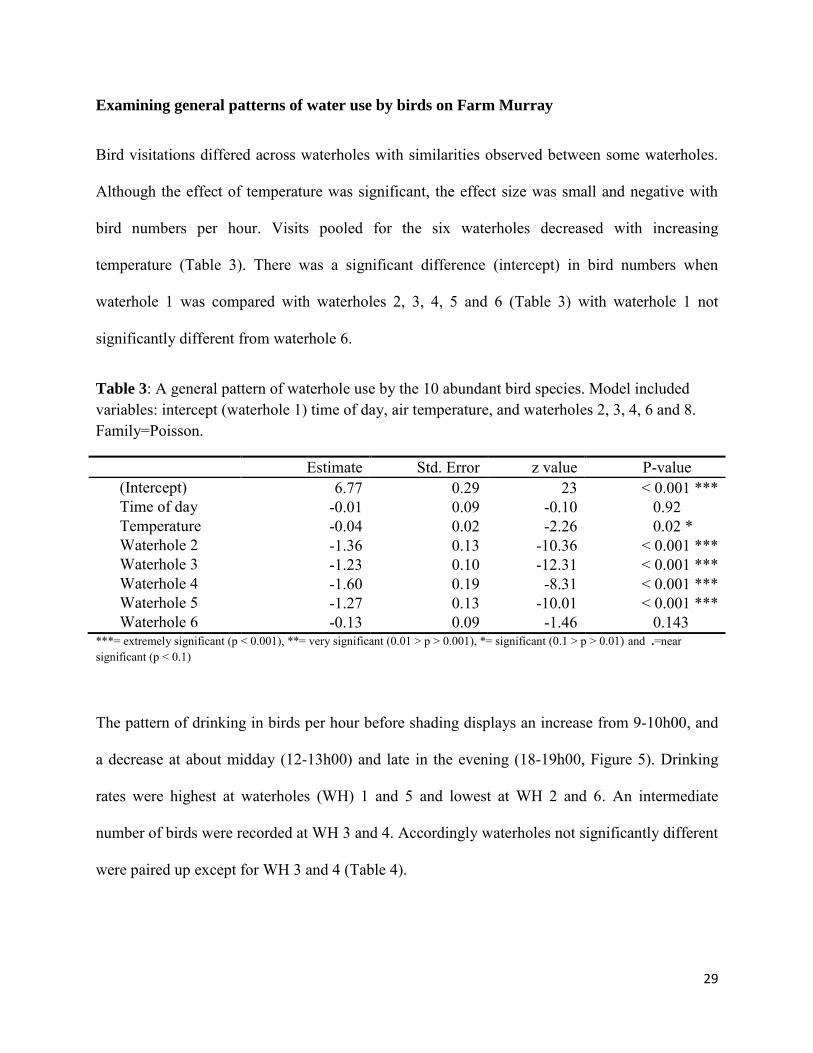
Examining general patterns of water use by birds on Farm Murray
Bird visitations differed across waterholes with similarities observed between some waterholes.
Although the effect of temperature was significant, the effect size was small and negative with
bird numbers per hour. Visits pooled for the six waterholes decreased with increasing
temperature (Table 3). There was a significant difference (intercept) in bird numbers when
waterhole 1 was compared with waterholes 2, 3, 4, 5 and 6 (Table 3) with waterhole 1 not
significantly different from waterhole 6.
Table 3: A general pattern of waterhole use by the 10 abundant bird species. Model included variables: intercept (waterhole 1) time of day, air temperature, and waterholes 2, 3, 4, 6 and 8. Family=Poisson.
***= extremely significant (p < 0.001), **= very significant (0.01 > p > 0.001), *= significant (0.1 > p > 0.01) and .=near significant (p < 0.1)
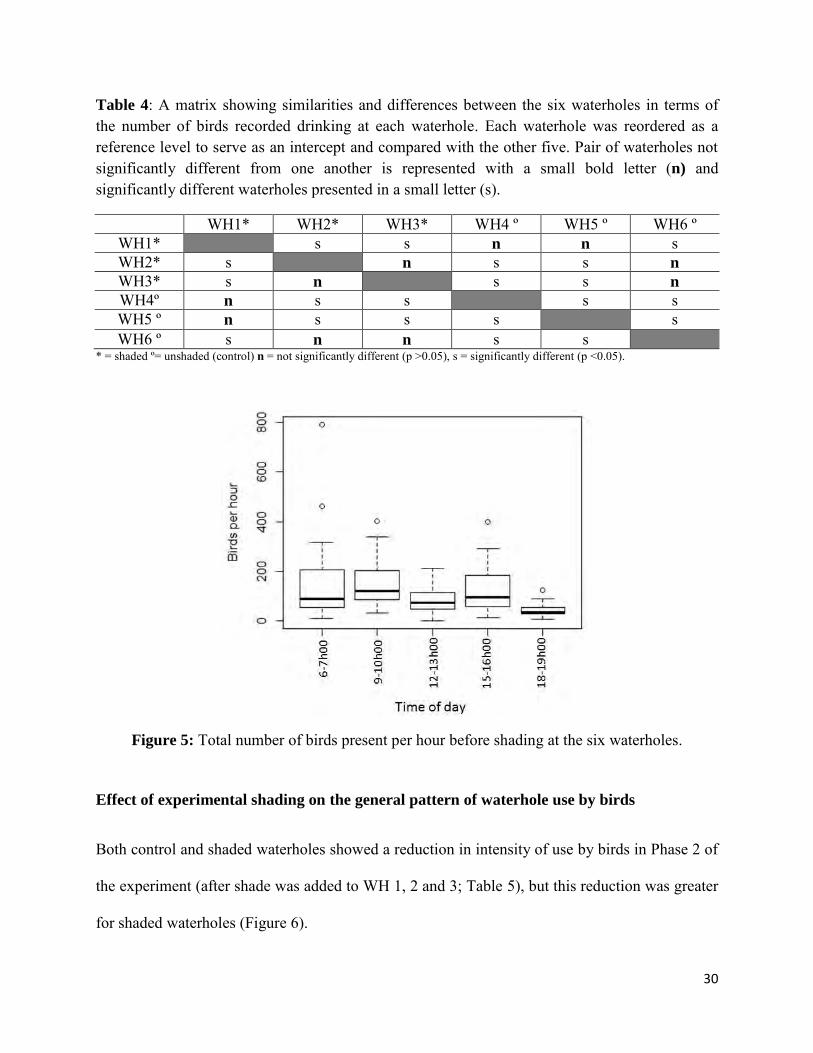
The pattern of drinking in birds per hour before shading displays an increase from 9-10h00, and
a decrease at about midday (12-13h00) and late in the evening (18-19h00, Figure 5). Drinking
rates were highest at waterholes (WH) 1 and 5 and lowest at WH 2 and 6. An intermediate
number of birds were recorded at WH 3 and 4. Accordingly waterholes not significantly different
were paired up except for WH 3 and 4 (Table 4).
30
Table 4: A matrix showing similarities and differences between the six waterholes in terms of the number of birds recorded drinking at each waterhole. Each waterhole was reordered as a reference level to serve as an intercept and compared with the other five. Pair of waterholes not significantly different from one another is represented with a small bold letter (n) and significantly different waterholes presented in a small letter (s).
WH1* WH2* WH3* WH4 º WH5 º WH6 º WH1* s s n n s WH2* s n s s n
WH3* s n s s n
WH4º n s s s s WH5 º n s s s s WH6 º s n n s s
* = shaded º= unshaded (control) n = not significantly different (p >0.05), s = significantly different (p <0.05).
Figure 5: Total number of birds present per hour before shading at the six waterholes.
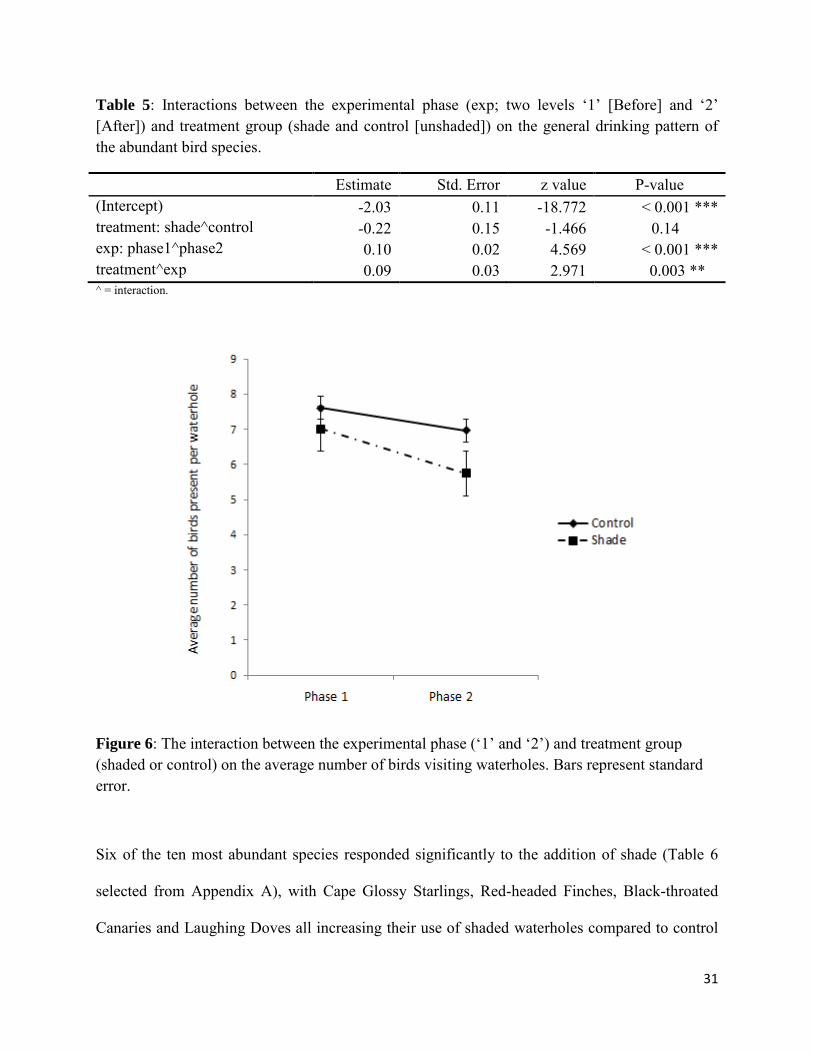
Effect of experimental shading on the general pattern of waterhole use by birds
Both control and shaded waterholes showed a reduction in intensity of use by birds in Phase 2 of
the experiment (after shade was added to WH 1, 2 and 3; Table 5), but this reduction was greater
for shaded waterholes (Figure 6).
31
Table 5: Interactions between the experimental phase (exp; two levels ‘1’ [Before] and ‘2’ [After]) and treatment group (shade and control [unshaded]) on the general drinking pattern of the abundant bird species.
Figure 6: The interaction between the experimental phase (‘1’ and ‘2’) and treatment group (shaded or control) on the average number of birds visiting waterholes. Bars represent standard error.
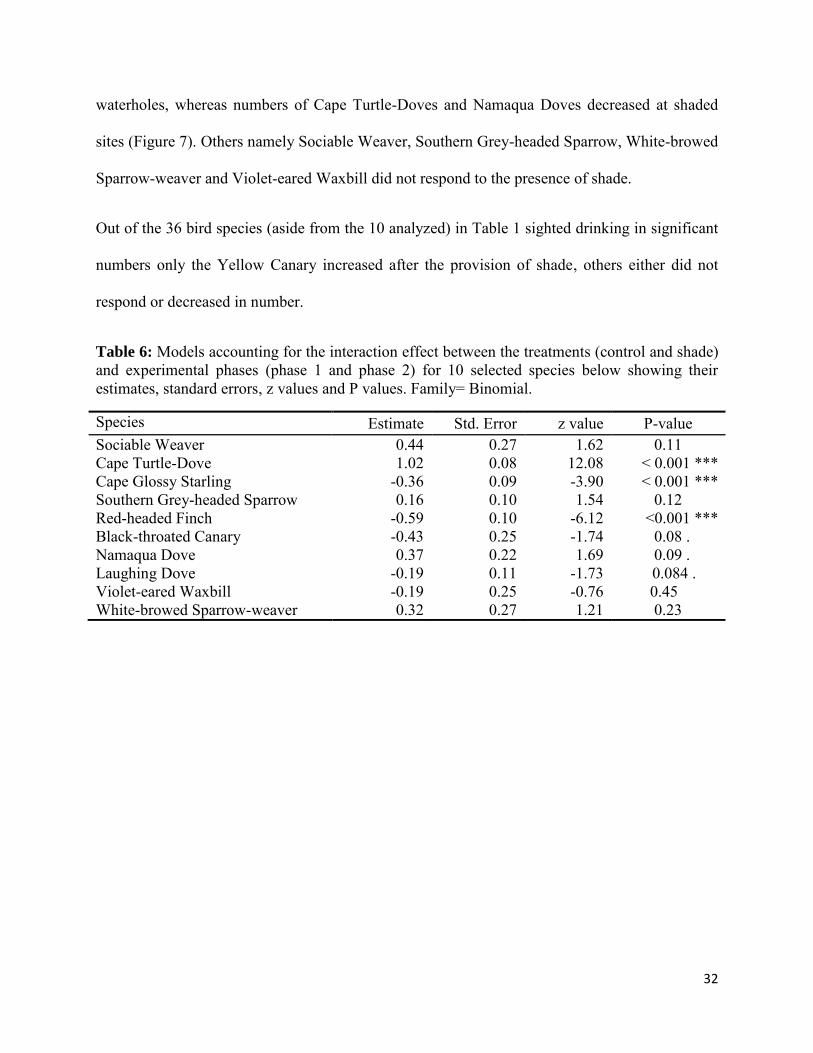
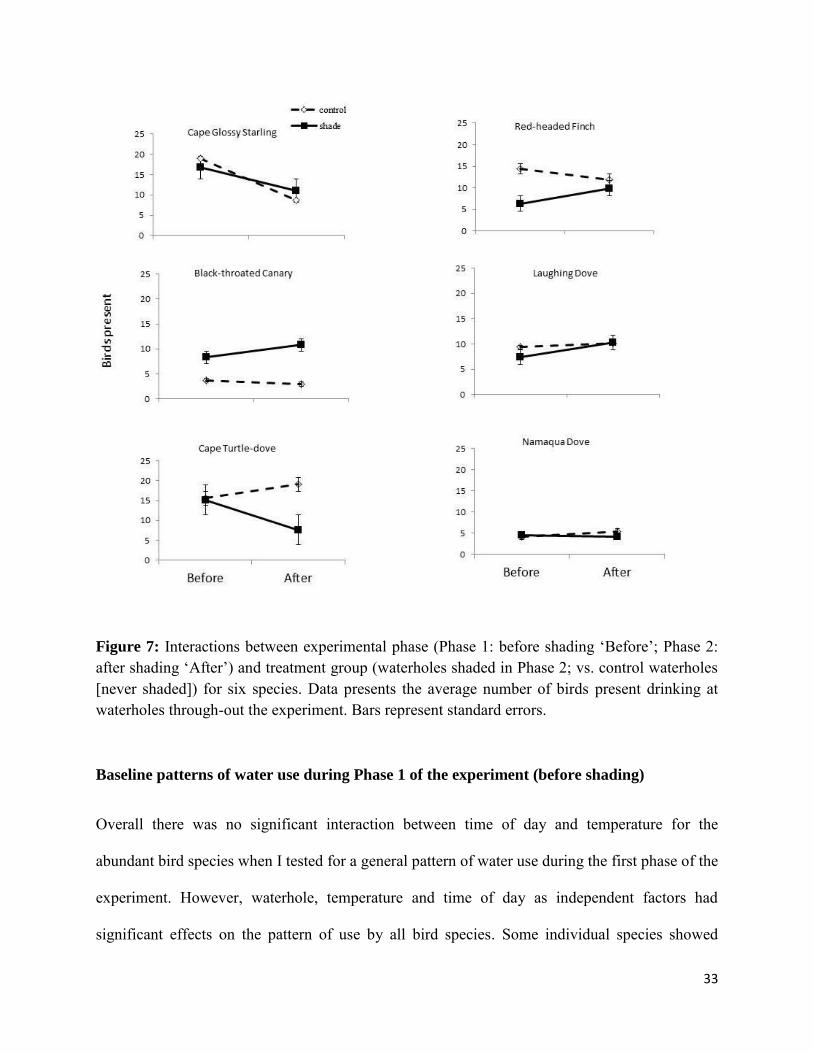
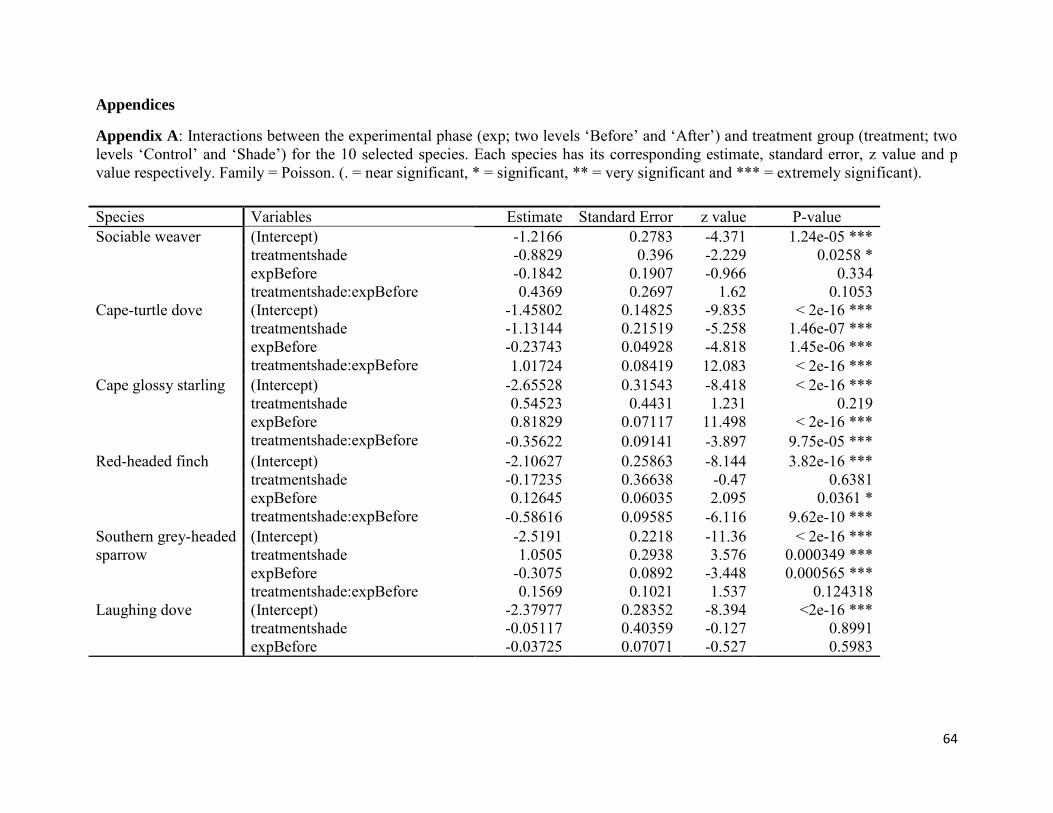
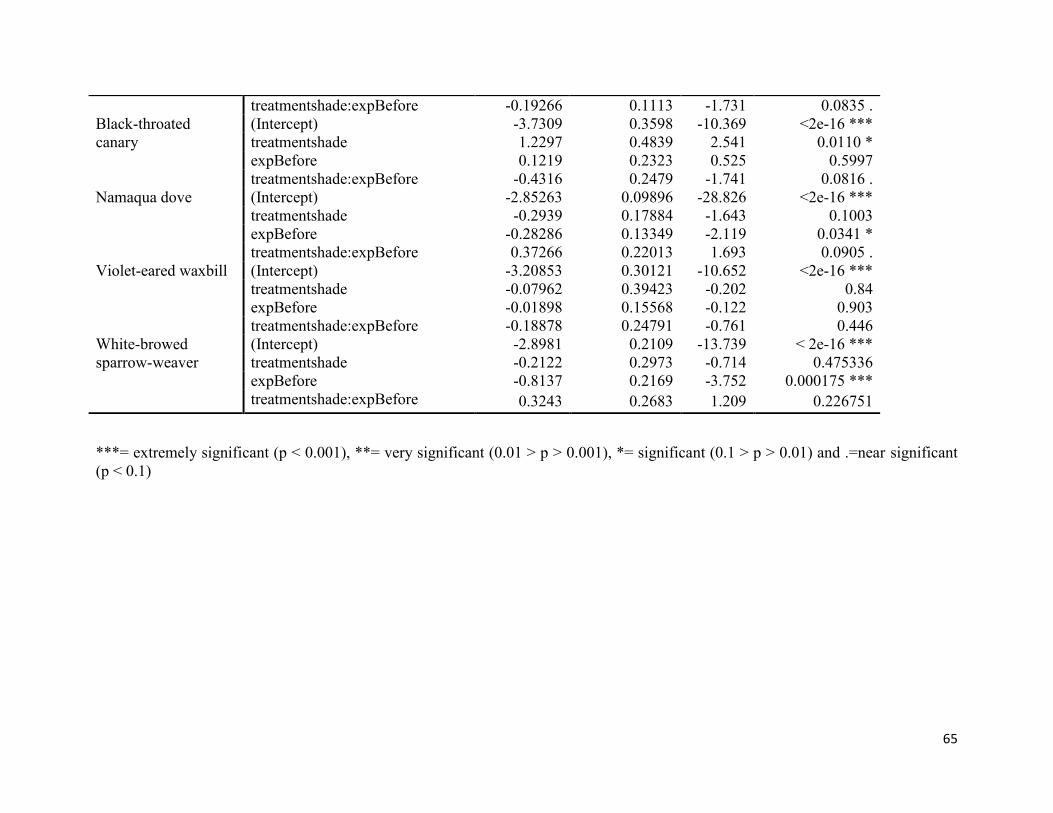
Six of the ten most abundant species responded significantly to the addition of shade (Table 6
selected from Appendix A), with Cape Glossy Starlings, Red-headed Finches, Black-throated
Canaries and Laughing Doves all increasing their use of shaded waterholes compared to control
32
waterholes, whereas numbers of Cape Turtle-Doves and Namaqua Doves decreased at shaded
Sparrow-weaver and Violet-eared Waxbill did not respond to the presence of shade.
Out of the 36 bird species (aside from the 10 analyzed) in Table 1 sighted drinking in significant
numbers only the Yellow Canary increased after the provision of shade, others either did not
respond or decreased in number.
Table 6: Models accounting for the interaction effect between the treatments (control and shade) and experimental phases (phase 1 and phase 2) for 10 selected species below showing their estimates, standard errors, z values and P values. Family= Binomial.
Figure 7: Interactions between experimental phase (Phase 1: before shading ‘Before’; Phase 2: after shading ‘After’) and treatment group (waterholes shaded in Phase 2; vs. control waterholes [never shaded]) for six species. Data presents the average number of birds present drinking at waterholes through-out the experiment. Bars represent standard errors.
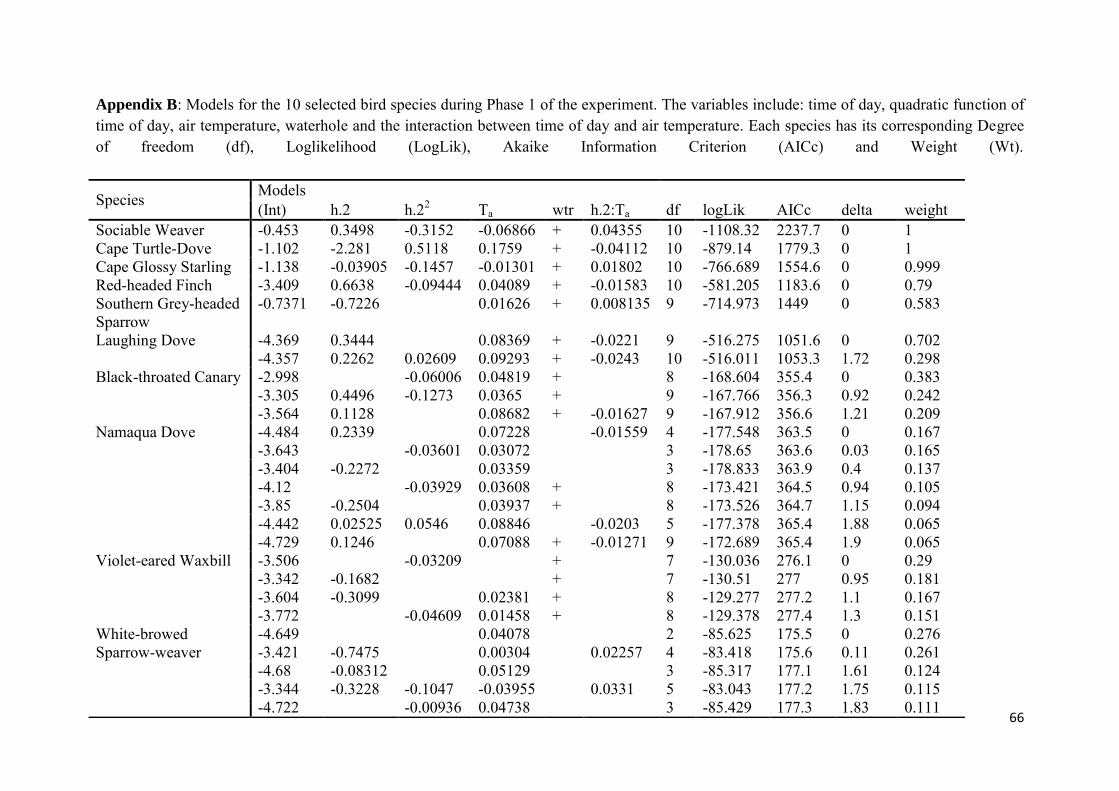
Baseline patterns of water use during Phase 1 of the experiment (before shading)
Overall there was no significant interaction between time of day and temperature for the
abundant bird species when I tested for a general pattern of water use during the first phase of the
experiment. However, waterhole, temperature and time of day as independent factors had
significant effects on the pattern of use by all bird species. Some individual species showed
34
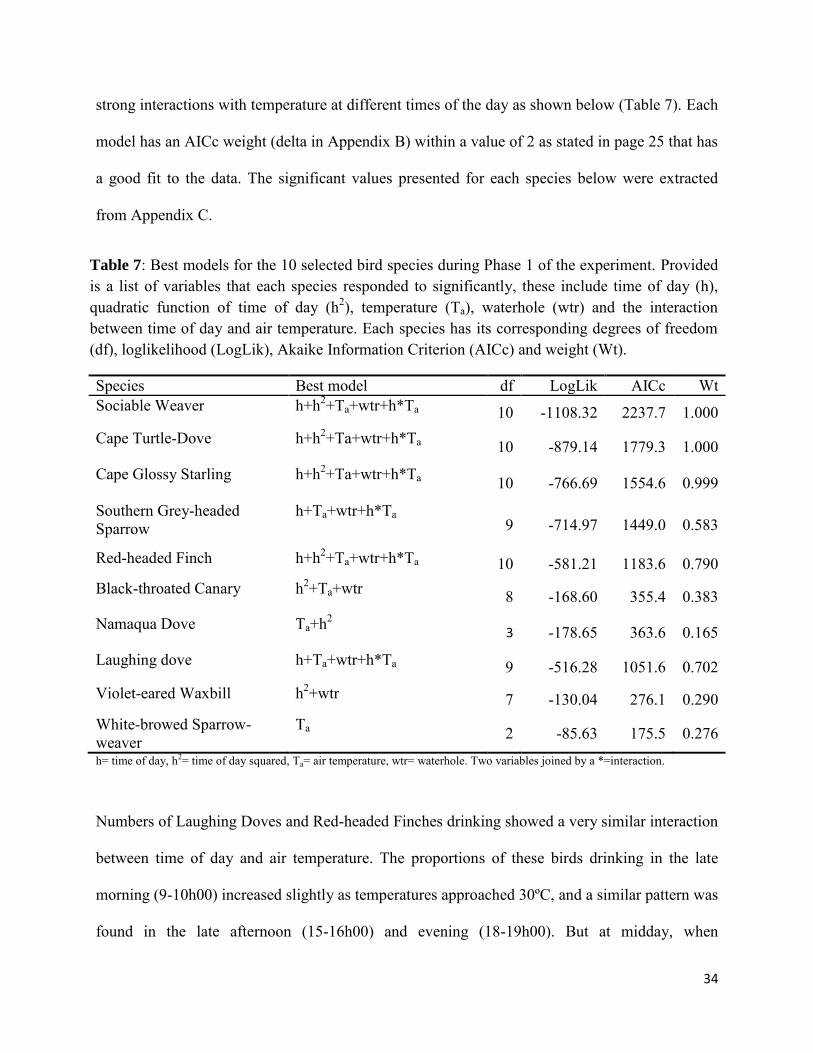
strong interactions with temperature at different times of the day as shown below (Table 7). Each
model has an AICc weight (delta in Appendix B) within a value of 2 as stated in page 25 that has
a good fit to the data. The significant values presented for each species below were extracted
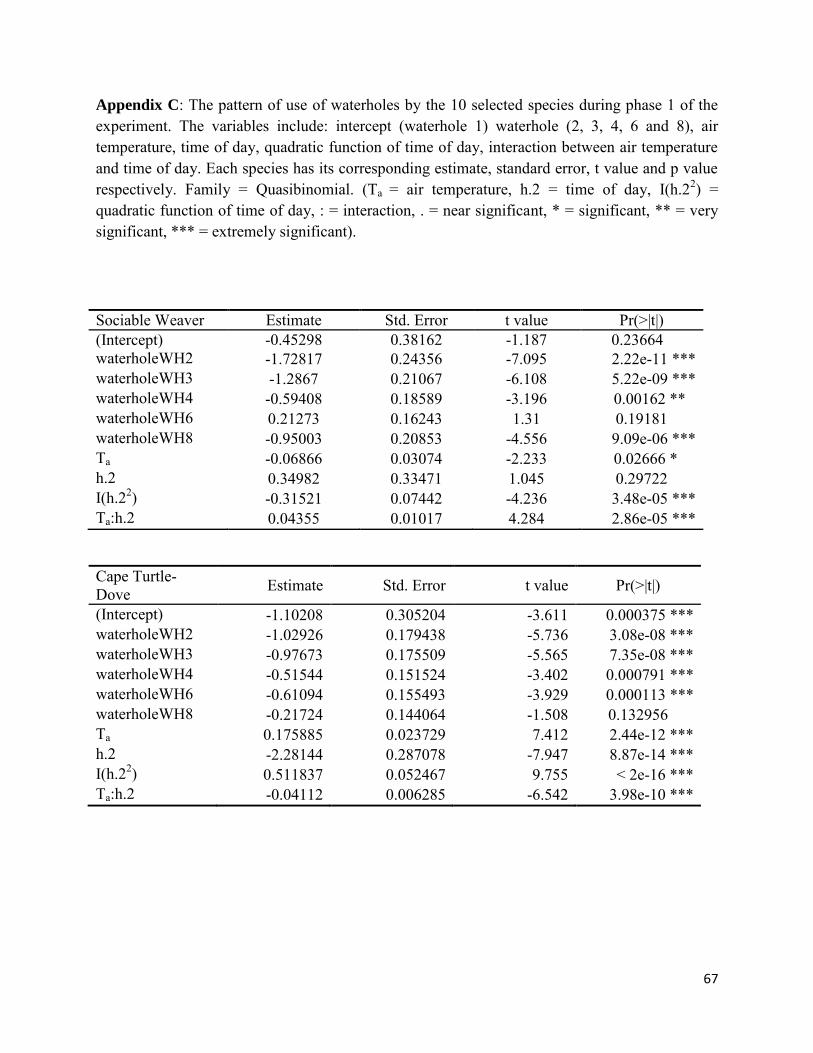
from Appendix C.
Table 7: Best models for the 10 selected bird species during Phase 1 of the experiment. Provided is a list of variables that each species responded to significantly, these include time of day (h), quadratic function of time of day (h2), temperature (Ta), waterhole (wtr) and the interaction between time of day and air temperature. Each species has its corresponding degrees of freedom (df), loglikelihood (LogLik), Akaike Information Criterion (AICc) and weight (Wt).
Species Best model df LogLik AICc Wt Sociable Weaver h+h2+Ta+wtr+h*Ta 10 -1108.32 2237.7 1.000 Cape Turtle-Dove h+h2+Ta+wtr+h*Ta 10 -879.14 1779.3 1.000
Ta 2 -85.63 175.5 0.276 h= time of day, h2= time of day squared, Ta= air temperature, wtr= waterhole. Two variables joined by a *=interaction.
Numbers of Laughing Doves and Red-headed Finches drinking showed a very similar interaction
between time of day and air temperature. The proportions of these birds drinking in the late
morning (9-10h00) increased slightly as temperatures approached 30ºC, and a similar pattern was
found in the late afternoon (15-16h00) and evening (18-19h00). But at midday, when
35
temperatures approached 36°C, numbers of these birds decreased. This interaction was
significant for both species (Red-headed Finch estimate = -0.03, t = -3.96, p < 0.001; Laughing
Dove estimate = -0.02, t = -2.80, p = 0.01).
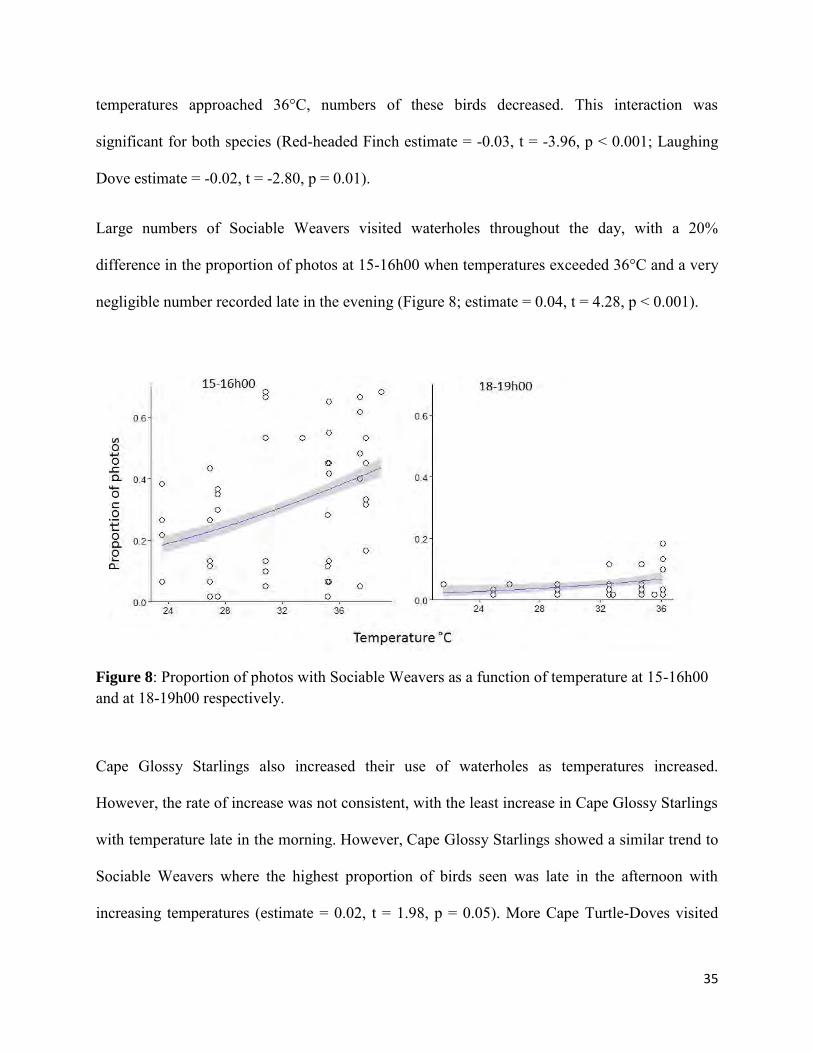
Large numbers of Sociable Weavers visited waterholes throughout the day, with a 20%
difference in the proportion of photos at 15-16h00 when temperatures exceeded 36°C and a very
negligible number recorded late in the evening (Figure 8; estimate = 0.04, t = 4.28, p < 0.001).
Figure 8: Proportion of photos with Sociable Weavers as a function of temperature at 15-16h00 and at 18-19h00 respectively.
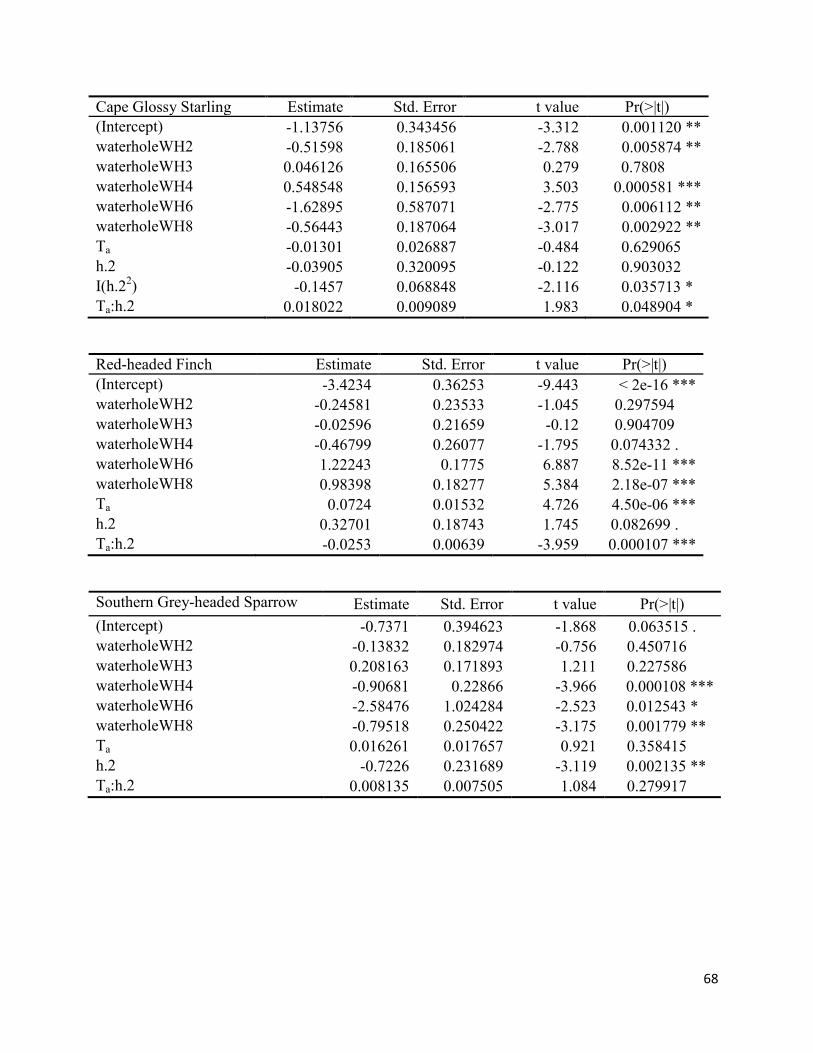
Cape Glossy Starlings also increased their use of waterholes as temperatures increased.
However, the rate of increase was not consistent, with the least increase in Cape Glossy Starlings
with temperature late in the morning. However, Cape Glossy Starlings showed a similar trend to
Sociable Weavers where the highest proportion of birds seen was late in the afternoon with
increasing temperatures (estimate = 0.02, t = 1.98, p = 0.05). More Cape Turtle-Doves visited
36
early in the morning, as temperatures approached about 25°C. At midday, when temperatures
were about 30°C, Cape Turtle-Doves recorded were relatively low. Thereafter there was a greater
occurrence of Cape Turtle-Doves drinking late in the evening with warmer temperatures of about
35°C (estimate = -0.04, t = -6.54, p < 0.001)
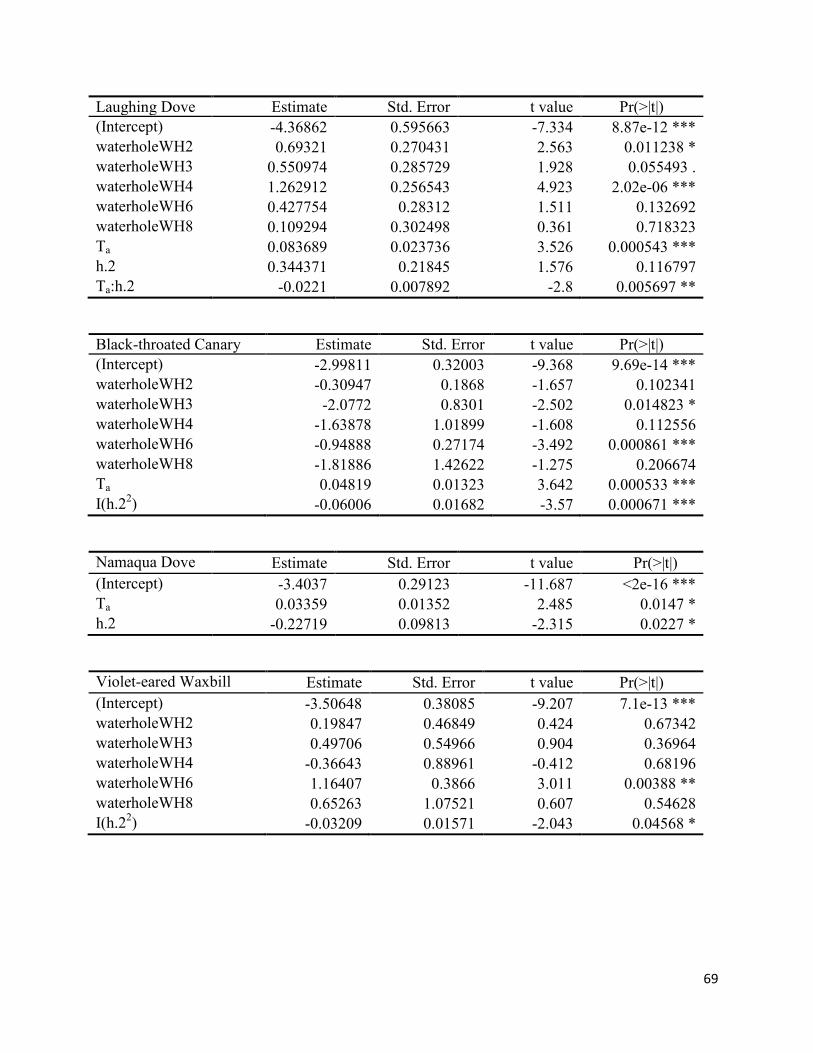
Air temperature and the quadratic function of time of day had independent effects on the
proportion of Black-throated Canaries drinking, with numbers generally increasing with
temperature (estimate = 0.05, t = 3.64, p < 0.001), but with fewer numbers at midday than in the
late morning and late afternoon (estimate = -0.06, t = -3.57, p < 0.001). Namaqua Doves also
responded to time of day and air temperature separately, increasing with air temperature
(estimate = 0.03, t = 2.49, p = 0.02) and peaking at midday (estimate = -0.23, t = -2.32, p = 0.02).
Use of water by Southern Grey-headed Sparrows and Violet-eared Waxbills varied with time of
day, but for Violet-eared Waxbills it was best explained by the quadratic function of temperature,
with highest waterhole use in the middle of the day (estimate = -0.03, t = -2.04, p = 0.05). By
contrast, few Southern Grey-headed Sparrows were recorded drinking at midday (estimate = -
0.72, t = -3.12, p = 0.002). The only variable with a significant effect on use of waterholes by
White-browed Sparrow-weavers was air temperature, with numbers increasing with temperature
(estimate = 0.04, t = 3.43 and p = 0.001).
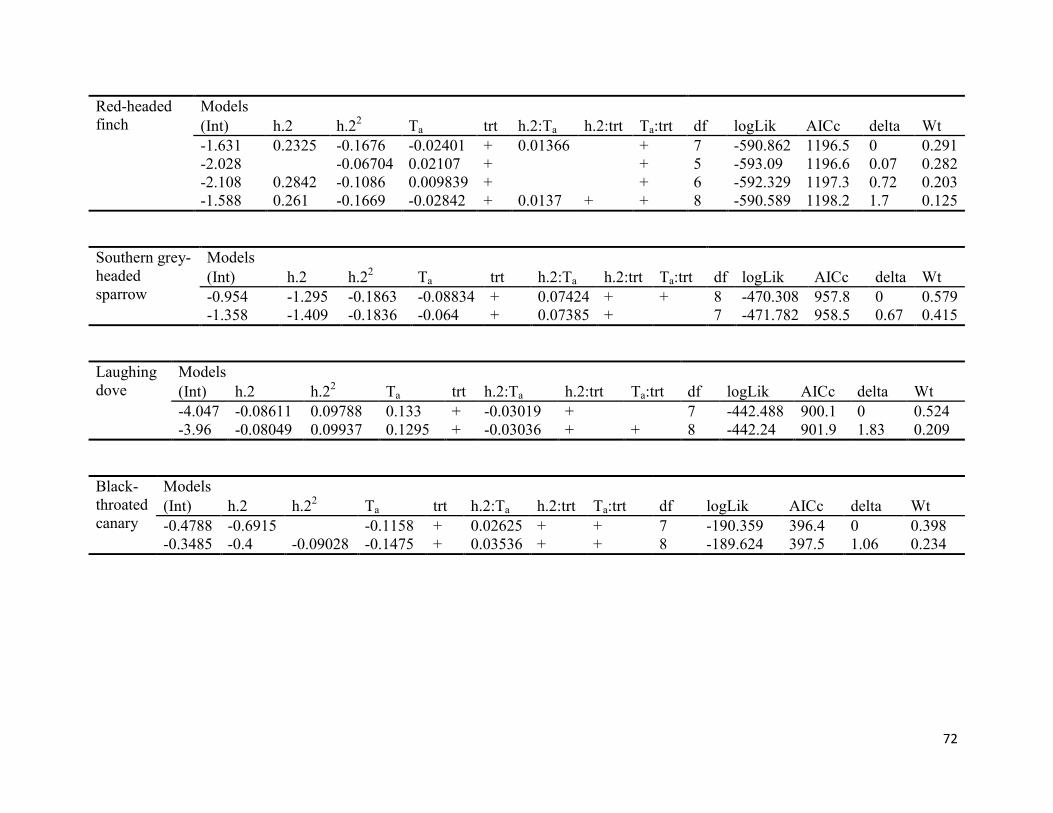
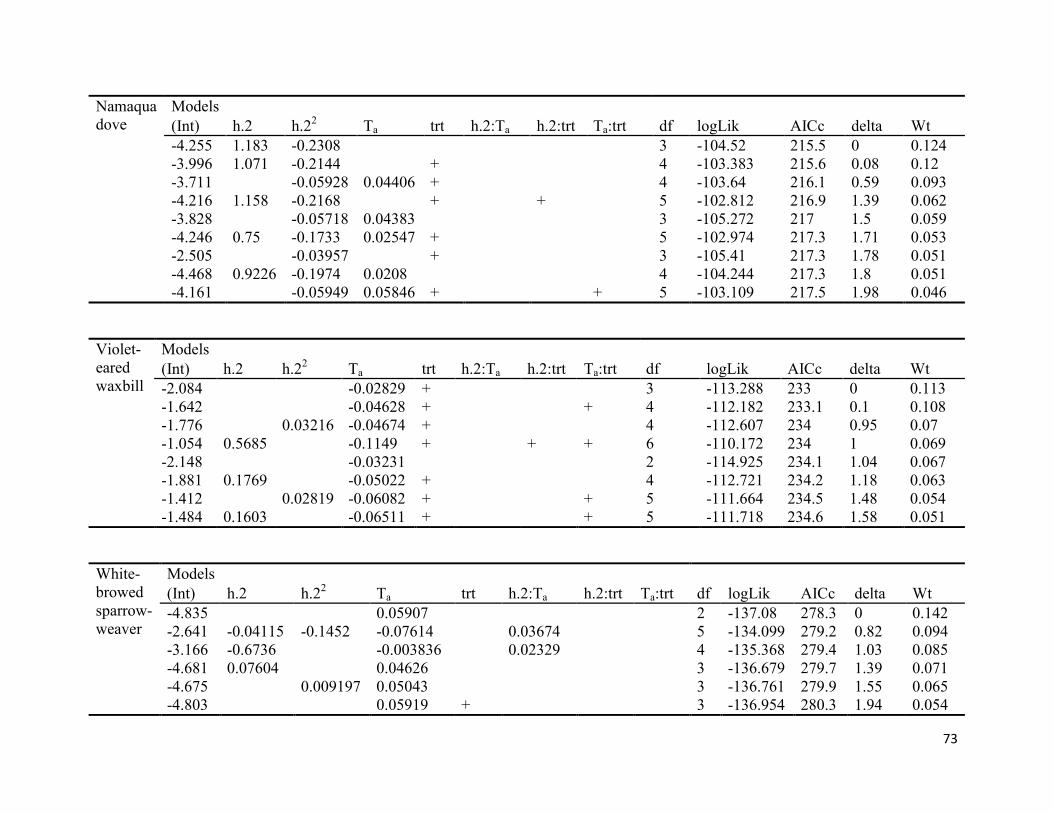
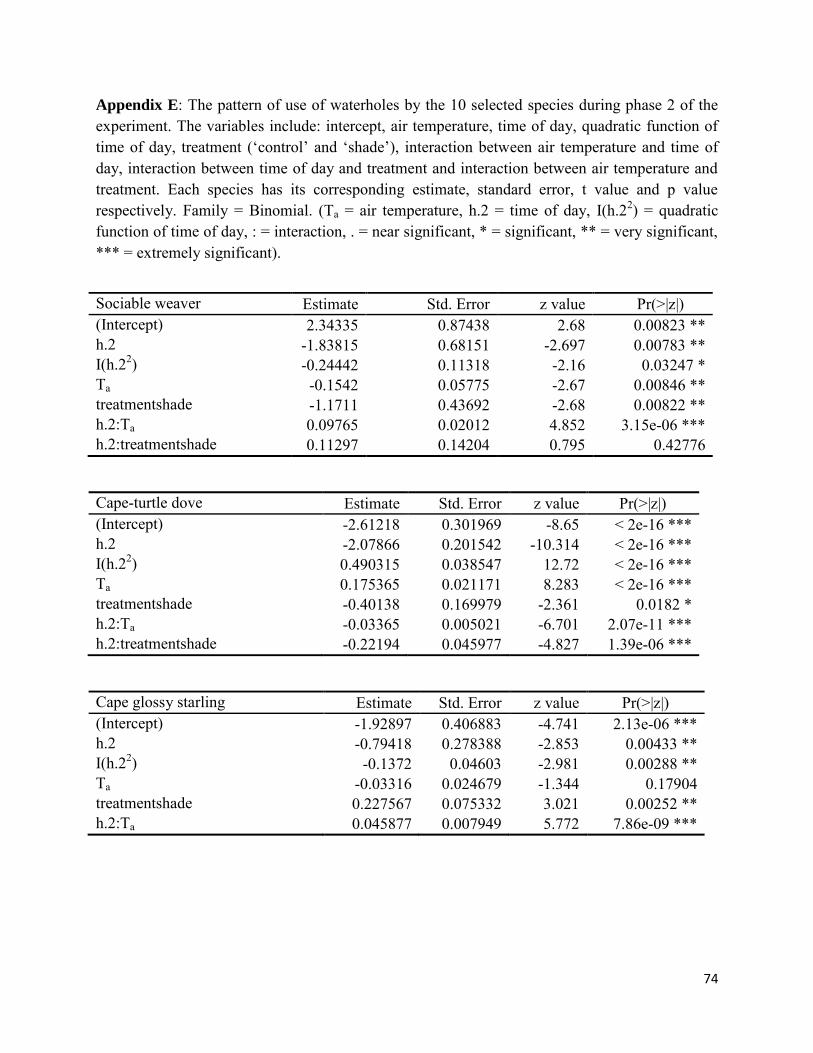
Patterns of waterhole use during Phase 2 of the experiment: the effects of providing shade
Addition of shade resulted in altered patterns of use of water in relation to either temperature or
time of day by six of the 10 selected Kalahari bird species. Best models for these six species
contained interaction terms between treatment (shaded/unshaded) and temperature (Red-headed
Finch), time of day (Sociable Weaver, Cape Turtle-Dove, Southern Grey-headed Sparrow,
Laughing dove) or both (Black-throated Canary) (Table 8; each model was chosen from
37
Appendix D). The significant values presented for each species below were extracted from
Appendix E.
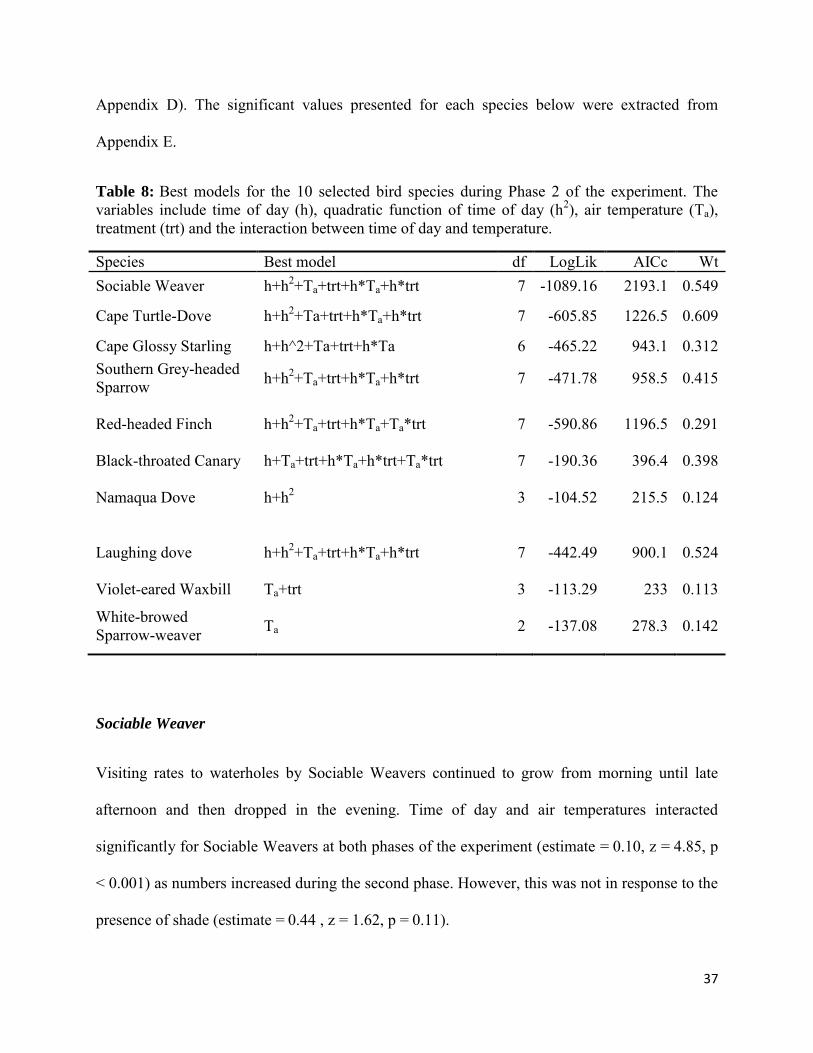
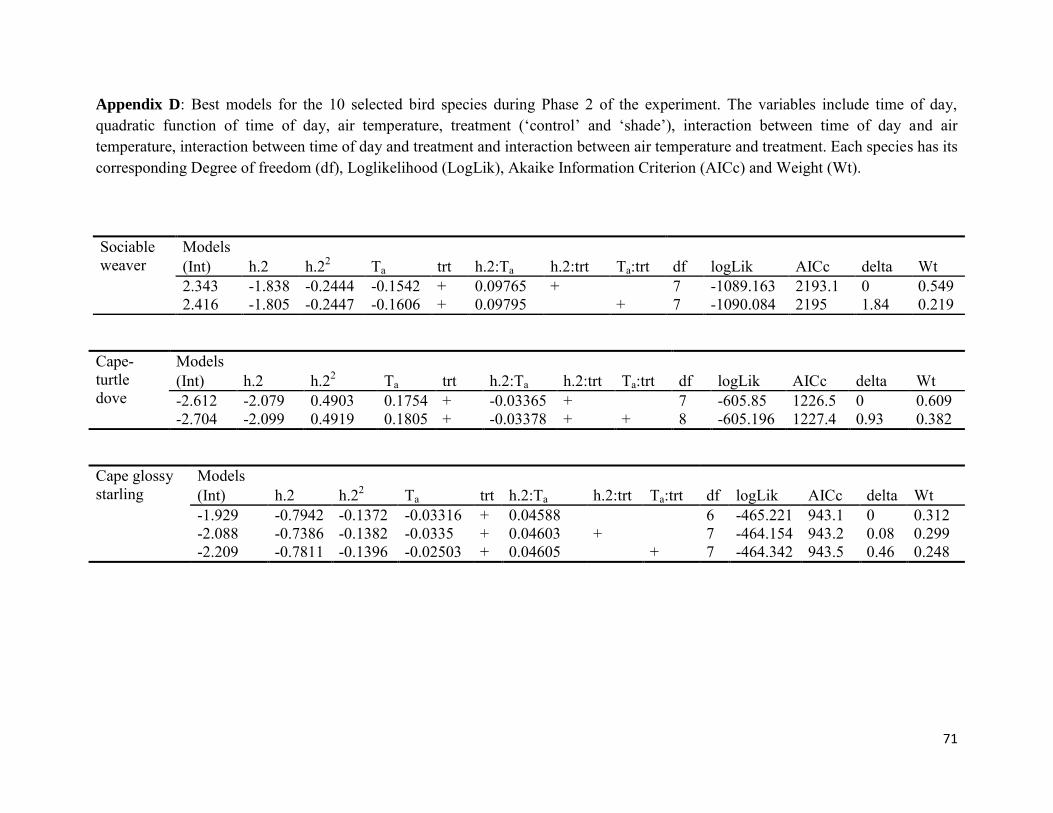
Table 8: Best models for the 10 selected bird species during Phase 2 of the experiment. The variables include time of day (h), quadratic function of time of day (h2), air temperature (Ta), treatment (trt) and the interaction between time of day and temperature.
Species Best model df LogLik AICc Wt Sociable Weaver h+h2+Ta+trt+h*Ta+h*trt 7 -1089.16 2193.1 0.549
Laughing dove h+h2+Ta+trt+h*Ta+h*trt 7 -442.49 900.1
0.524
Violet-eared Waxbill Ta+trt 3 -113.29 233 0.113
White-browed Sparrow-weaver Ta 2 -137.08 278.3
0.142
Sociable Weaver
Visiting rates to waterholes by Sociable Weavers continued to grow from morning until late
afternoon and then dropped in the evening. Time of day and air temperatures interacted
significantly for Sociable Weavers at both phases of the experiment (estimate = 0.10, z = 4.85, p
< 0.001) as numbers increased during the second phase. However, this was not in response to the
presence of shade (estimate = 0.44 , z = 1.62, p = 0.11).
38
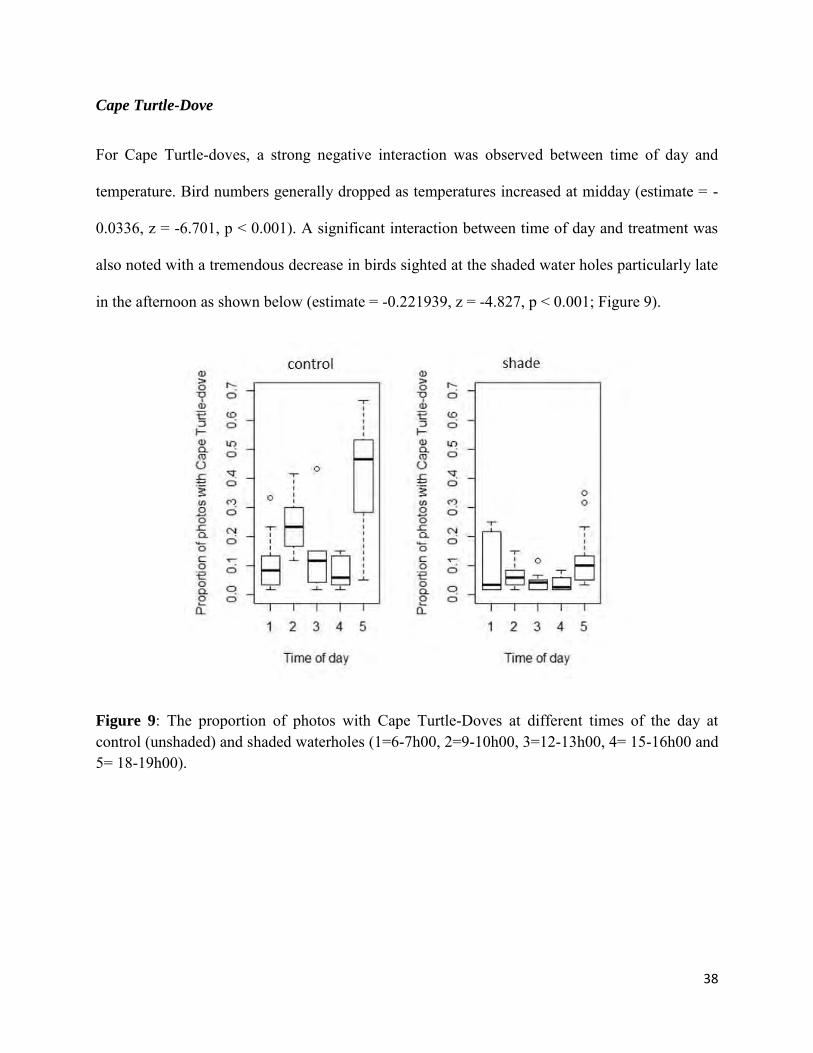
Cape Turtle-Dove
For Cape Turtle-doves, a strong negative interaction was observed between time of day and
temperature. Bird numbers generally dropped as temperatures increased at midday (estimate = -
0.0336, z = -6.701, p < 0.001). A significant interaction between time of day and treatment was
also noted with a tremendous decrease in birds sighted at the shaded water holes particularly late
in the afternoon as shown below (estimate = -0.221939, z = -4.827, p < 0.001; Figure 9).
Figure 9: The proportion of photos with Cape Turtle-Doves at different times of the day at control (unshaded) and shaded waterholes (1=6-7h00, 2=9-10h00, 3=12-13h00, 4= 15-16h00 and 5= 18-19h00).
39
Cape Glossy Starling
More starlings were recorded at shaded than unshaded waterholes during the second phase of the
experiment (estimate = 0.23, z = 3.02, p = 0.003). There was a strong, positive interaction
between time of day and temperature, with numbers increasing with temperature throughout the
day, but especially at noon (estimate = 0.05, z = 5.77, p < 0.001). A similar trend was noticed at
experimental phase 1 but with smaller numbers of starlings visiting waterholes.
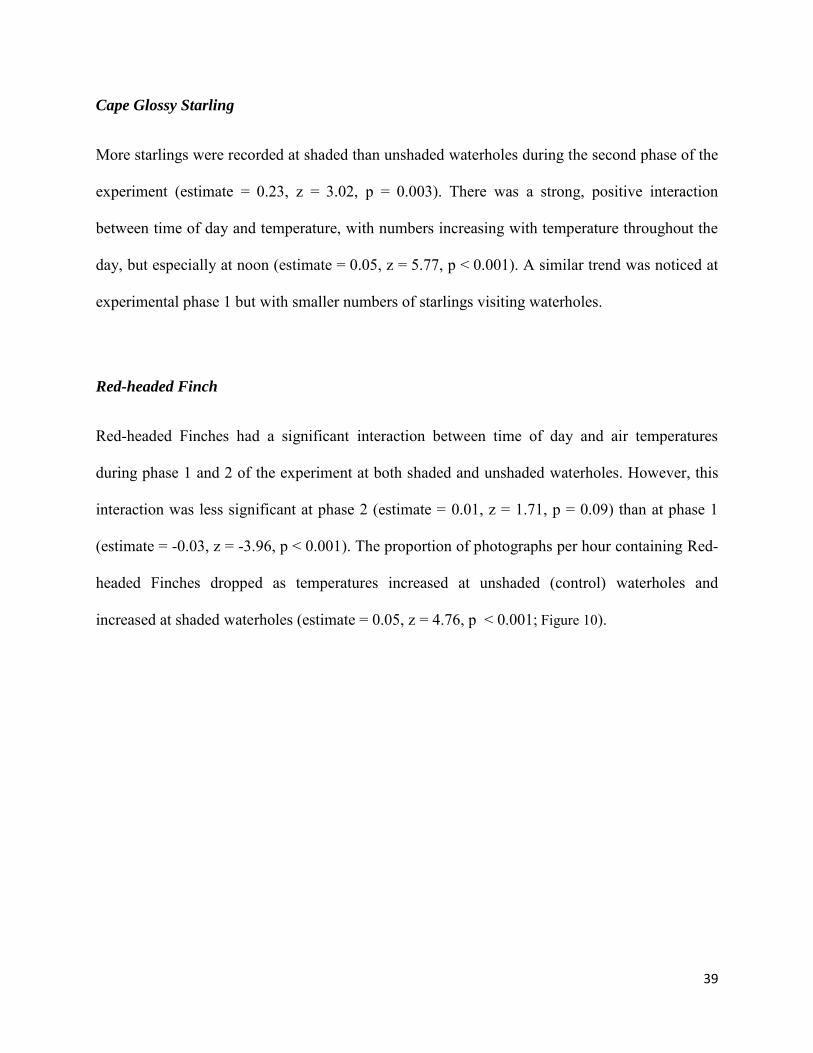
Red-headed Finch
Red-headed Finches had a significant interaction between time of day and air temperatures
during phase 1 and 2 of the experiment at both shaded and unshaded waterholes. However, this
interaction was less significant at phase 2 (estimate = 0.01, z = 1.71, p = 0.09) than at phase 1
(estimate = -0.03, z = -3.96, p < 0.001). The proportion of photographs per hour containing Red-
headed Finches dropped as temperatures increased at unshaded (control) waterholes and
increased at shaded waterholes (estimate = 0.05, z = 4.76, p < 0.001; Figure 10).
40
Figure 10: The proportion of photos with Red-headed Finch as a function of temperature at unshaded (control) and shaded waterholes respectively.
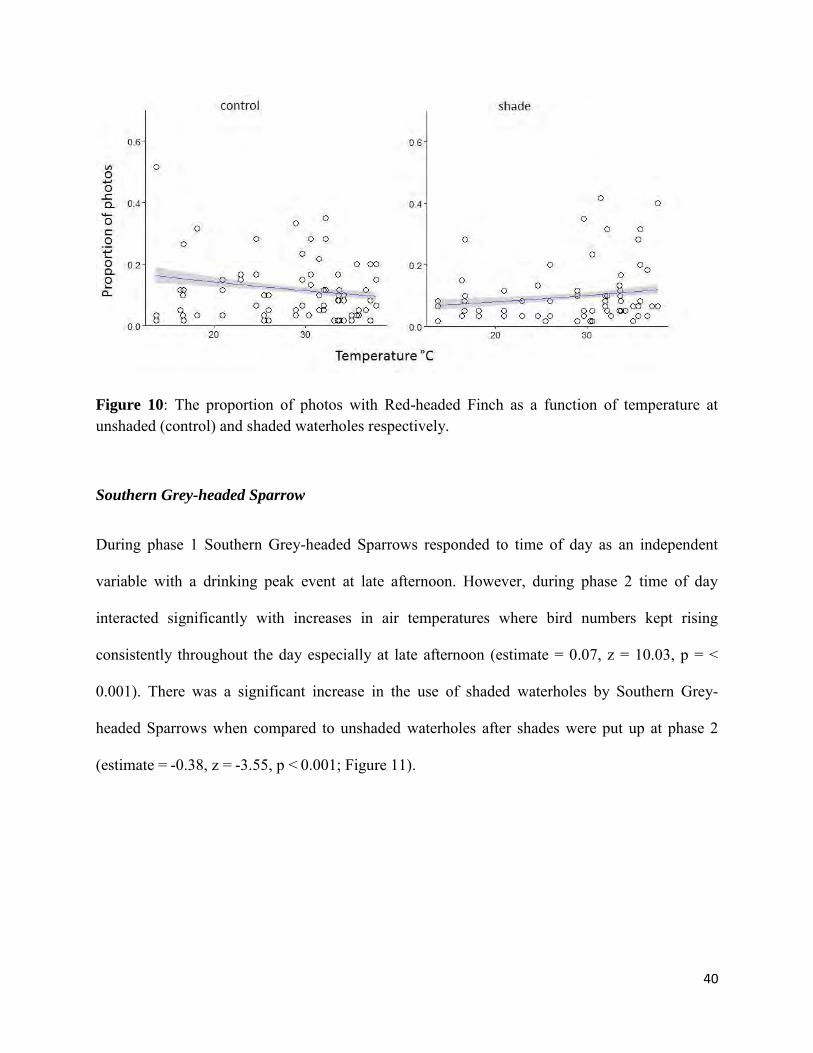
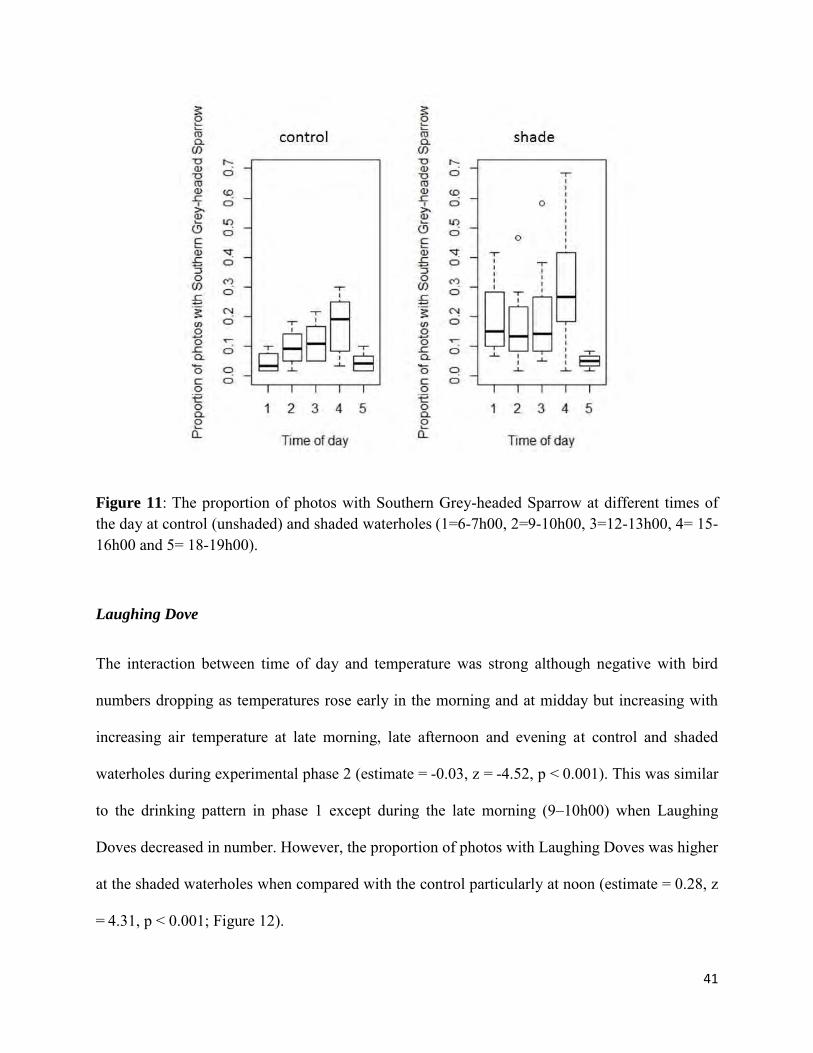
Southern Grey-headed Sparrow
During phase 1 Southern Grey-headed Sparrows responded to time of day as an independent
variable with a drinking peak event at late afternoon. However, during phase 2 time of day
interacted significantly with increases in air temperatures where bird numbers kept rising
consistently throughout the day especially at late afternoon (estimate = 0.07, z = 10.03, p = <
0.001). There was a significant increase in the use of shaded waterholes by Southern Grey-
headed Sparrows when compared to unshaded waterholes after shades were put up at phase 2
(estimate = -0.38, z = -3.55, p < 0.001; Figure 11).
41
Figure 11: The proportion of photos with Southern Grey-headed Sparrow at different times of the day at control (unshaded) and shaded waterholes (1=6-7h00, 2=9-10h00, 3=12-13h00, 4= 15-16h00 and 5= 18-19h00).
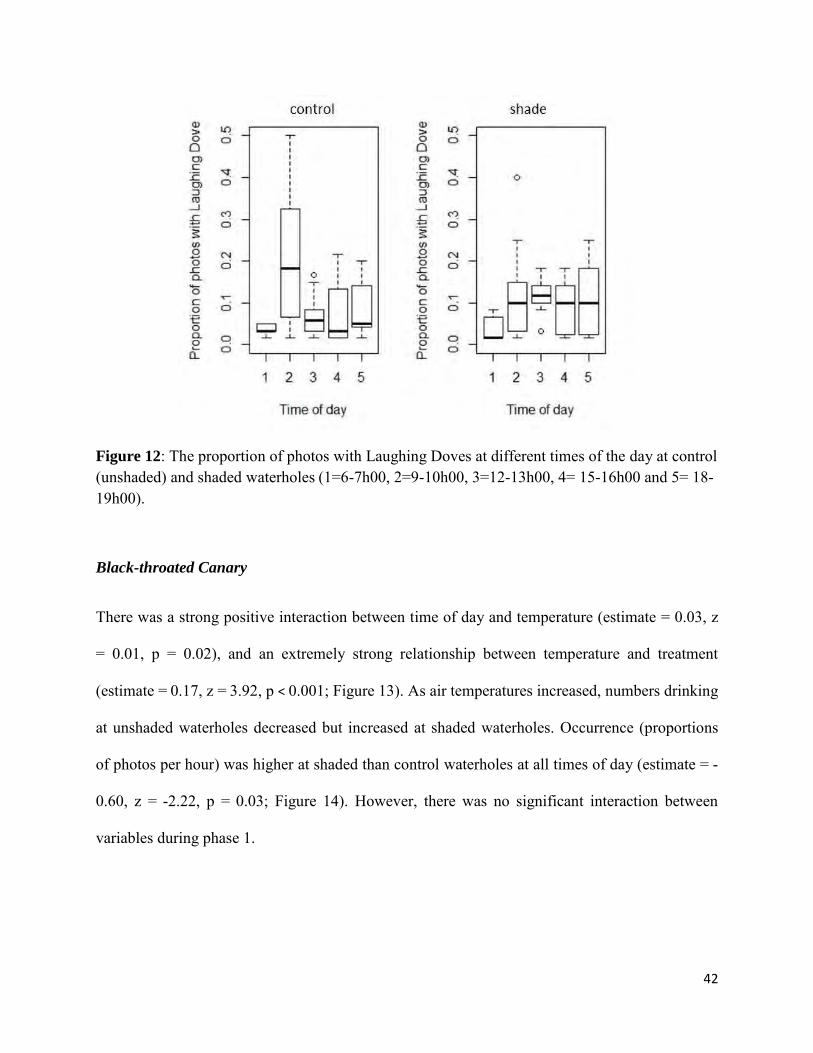
Laughing Dove
The interaction between time of day and temperature was strong although negative with bird
numbers dropping as temperatures rose early in the morning and at midday but increasing with
increasing air temperature at late morning, late afternoon and evening at control and shaded
waterholes during experimental phase 2 (estimate = -0.03, z = -4.52, p < 0.001). This was similar
to the drinking pattern in phase 1 except during the late morning (9–10h00) when Laughing
Doves decreased in number. However, the proportion of photos with Laughing Doves was higher
at the shaded waterholes when compared with the control particularly at noon (estimate = 0.28, z
= 4.31, p < 0.001; Figure 12).
42
Figure 12: The proportion of photos with Laughing Doves at different times of the day at control (unshaded) and shaded waterholes (1=6-7h00, 2=9-10h00, 3=12-13h00, 4= 15-16h00 and 5= 18-19h00).
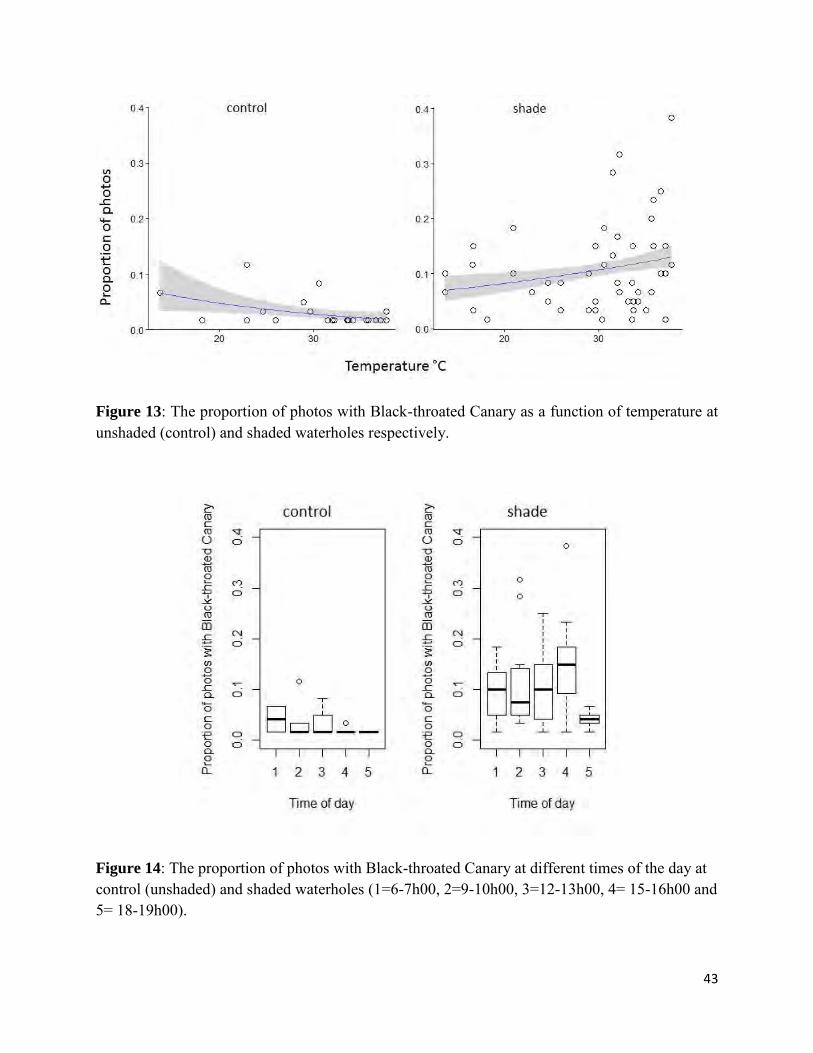
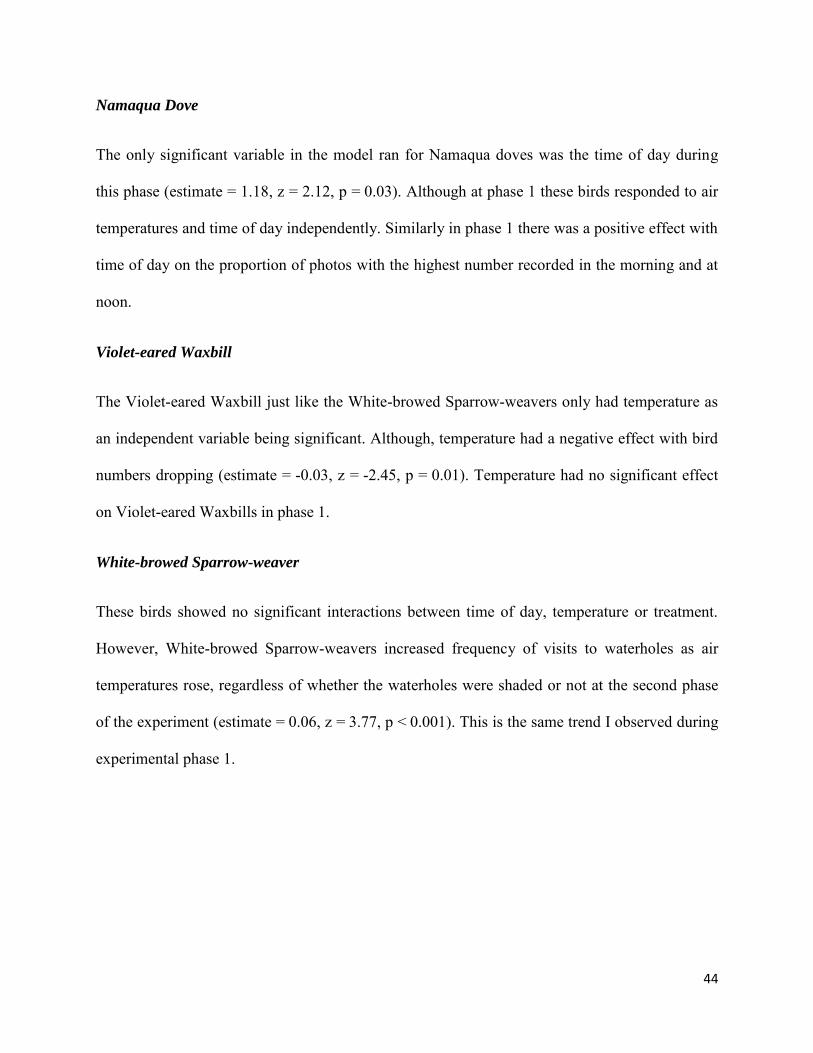
Black-throated Canary
There was a strong positive interaction between time of day and temperature (estimate = 0.03, z
= 0.01, p = 0.02), and an extremely strong relationship between temperature and treatment
(estimate = 0.17, z = 3.92, p < 0.001; Figure 13). As air temperatures increased, numbers drinking
at unshaded waterholes decreased but increased at shaded waterholes. Occurrence (proportions
of photos per hour) was higher at shaded than control waterholes at all times of day (estimate = -
0.60, z = -2.22, p = 0.03; Figure 14). However, there was no significant interaction between
variables during phase 1.
43
Figure 13: The proportion of photos with Black-throated Canary as a function of temperature at unshaded (control) and shaded waterholes respectively.
Figure 14: The proportion of photos with Black-throated Canary at different times of the day at control (unshaded) and shaded waterholes (1=6-7h00, 2=9-10h00, 3=12-13h00, 4= 15-16h00 and 5= 18-19h00).
44
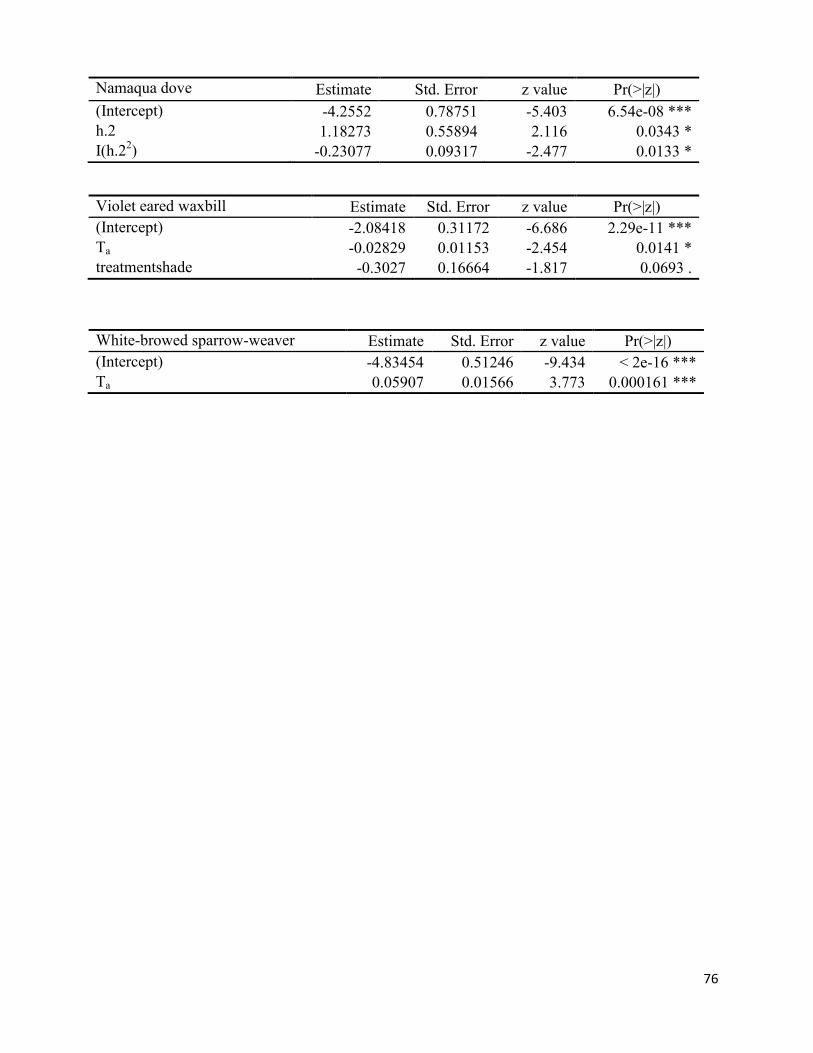
Namaqua Dove
The only significant variable in the model ran for Namaqua doves was the time of day during
this phase (estimate = 1.18, z = 2.12, p = 0.03). Although at phase 1 these birds responded to air
temperatures and time of day independently. Similarly in phase 1 there was a positive effect with
time of day on the proportion of photos with the highest number recorded in the morning and at
noon.
Violet-eared Waxbill
The Violet-eared Waxbill just like the White-browed Sparrow-weavers only had temperature as
an independent variable being significant. Although, temperature had a negative effect with bird
numbers dropping (estimate = -0.03, z = -2.45, p = 0.01). Temperature had no significant effect
on Violet-eared Waxbills in phase 1.
White-browed Sparrow-weaver
These birds showed no significant interactions between time of day, temperature or treatment.
However, White-browed Sparrow-weavers increased frequency of visits to waterholes as air
temperatures rose, regardless of whether the waterholes were shaded or not at the second phase
of the experiment (estimate = 0.06, z = 3.77, p < 0.001). This is the same trend I observed during
experimental phase 1.
45
Discussion
Overall, my study found that the addition of shade to waterholes had a significant effect on the
drinking behaviour of six out of ten common Kalahari bird species analyzed. However, not all
six species responded positively to the provision of shade. A concurrent study which took place
at the same study area supports Smit’s (2013) findings that half of the common bird species
identified in this community utilized waterholes (Abdu n.d.). It is important to note that bird
species never sighted drinking (such as the Chestnut-vented Tit-babbler) and those found
drinking occasionally (such as the Scaly-feathered Finch and Black-chested Prinia) are very
common within this community (pers. Obs.). From Smit’s (2013) previous study most of the
Kalahari birds dependent on free-standing surface water were identified as granivores. These
birds are difficult to classify into dietary groups as only a few feed mainly on a particular diet.
The Cape Turtle-Dove, Namaqua Dove, Laughing Dove and Violet-eared Waxbill are
considered granivores because seeds comprise a major part of their diet (Hockey et al. 2005).
The Sociable Weaver as well feeds primarily on insects while other species such as the White-
browed Sparrow-weaver has a highly variable diet, feeding on insects, seeds, fruits as well as
leaves (Hockey et al. 2005).
The majority of the 10 bird species analyzed are found all year round in the Kalahari except for
highly nomadic species such as Wattled Starlings and Red-headed Finches, which may depart in
response to the availability of food and water (Hockey et al. 2005). Few species such as Black-
throated Canaries, Namaqua Doves and Violet-eared Waxbills also move locally within their
ranges predominantly north-east South Africa (Hockey et al. 2005). The Cape Turtle-Dove and
Sociable Weaver were resident species among others considered as ‘abundant’ in the Kalahari,
each of which has seeds present in their diets (Maclean 1970). Amongst the nomadic species the
46
Namaqua Dove was one of the species described as ‘abundant’ (Maclean 1970). This relates to
their current abundance around waterholes in this study. The movement of these birds could have
an effect on the drinking patterns in relation to temperature dependency at different times of the
year.
Water is the major driver of vegetation structure and persistence while species and structural
diversity are highly dependent on the quality of desert ecosystems (Tews et al. 2004).
Commuting to drink incurs travel costs and interrupts foraging activities, and thus impacts both
energy expenditure and intake. In addition, bird community structures were altered decades ago
when livestock were introduced (Perkins 1996) into the semi-desert Sandveld (land characterized
by dry, sandy soils) known to be comprised of a variety of unaffected savannah tree species
supporting high species diversity (Debenham 1952). Artificial waterholes are provided for
livestock which are usually moved from one place to another occasionally (Perkins 1996).
Waterholes are often fully exposed to the sun with little surrounding vegetation, so birds have to
remain at some distance away to shelter from the sun (Tolsma et al. 1987) and predation.
Overstocking of livestock and overgrazing have degraded rangelands causing a ‘piospheric
effect’ around waterholes (Perkins 1996). Restoration of these sites seems impossible (Stoddart
et al 1975) because of the concentration of waste (dung and urine) released by livestock into the
soil (Perkins 1996). However, these artificial waterholes could be advantageous to some bird
species in compensating for water loss associated with elevated air temperatures and reduced
foraging in spite of degradation around waterholes.
47
Responses of bird species
The reasons for avoiding waterholes at midday could be to avoid high environmental
temperatures which come with costs of dehydration or hyperthermia and rather spend more time
drinking at cooler temperatures of the day (Smit 2013). A number of factors played a role in the
number of birds visiting waterholes. Sociable Weaver colonies bordering waterholes in my study
may be contributing to the peak at some waterholes. Relatively low numbers at some of these
waterholes may be as result of close distances (~200 m) to the road with disturbances coming
from automobile engines and also from human structures such as abandoned buildings and
houses located close by. The activity from livestock and other wild game animals at waterholes
may also have an effect as large congregations prevent birds from drinking.
Warmer temperatures (29.4ºC) and the moderate amount of rainfall (9.1 mm) observed in the
second half of the experiment may have contributed to the decrease in the number of birds
visiting waterholes. Dead grasses, leaves or remains from dead trees serve as a substratum for
insects (Immelmann 1969). As temperatures continue to rise these insects may find their way to
the top of the substratum especially at the start of the rains to cool off. The beginning of the rainy
season is associated with a stream of insects (such as ants, termites, and caterpillars), millipedes,
new fruits and water-rich seeds which provide birds with preformed water (Coaton 1963).
The trade-off between dehydration avoidance (via drinking at hot temperatures) and
hyperthermia avoidance (via minimizing time spent drinking) in hot, sunlit microsites is
displayed in Red-headed Finches, Black-throated Canaries, Cape Glossy Starlings and Laughing
Doves at waterholes. Drinking under cooler (shaded waterholes) temperatures may be an
advantage taken by these birds. For example, Cactus Wrens (Campylorhynchus brunneicapillus)
48
were observed to remain within shaded microsites while reducing visits to nests at air
temperatures of about 35°C in the Sonoran Desert (Ricklefs and Hainsworth 1968). Irwin (1956)
noted that Laughing Doves in Botswana had two drinking peaks (morning and late in the
evening) while in the Namib Desert they had a main peak in the morning and a lesser one at
midday (Willoughby and Cade 1967).
Other common species may have employed similar strategies in dealing with water costs at high
temperatures but this was not picked up probably due to their higher distribution around
unshaded waterholes. Some of these species could also have a slightly higher tolerance to heat
stress. Namaqua Doves for example usually drink in the middle of the day when temperatures are
high (Rowan 1983). They decreased their total daily water loss by 10% when compared with the
Cloven-feathered Dove (Drepanoptila holosericea) even at air temperatures of over 40°C
(Williams 1996; Schleucher et al 1991, Schleucher 1999). Diamond Doves (Geopelia cuneate)
and Namaqua Doves (studied in captivity) may not go completely without water but they are
able to reduce drinking events considerably and could sometimes go for two days without
drinking (Schleucher 1993). In the Negev, Beersheba and Sinai Bedouin fowls (Gallus
domesticus) when exposed to air temperatures of 45ºC for 4 hours attained average body
temperatures of 43.3ºC and 43.6ºC respectively (Marder et al. 1974). Similarly Violet-eared
Waxbills could attain body temperatures of about 41.8°C (Anon 1976). In an attempt to remain
hydrated White-browed Sparrow-weaver body temperatures have been observed to elevate by
about 2.3°C during the warmest time of the day (Smit et al 2013). The Rock Pigeons (Columba
livia) unlike the doves mentioned in this study as fledglings are able to withstand high air
temperatures of about 50ºC, as adults they develop a good respiratory mechanism and are able to
withstand air temperatures that range between 48ºC and 60ºC (Marder and Gavrieli-Levin 1987).
49
Birds could be using shade for different purposes. In addition to this trade-off mentioned above,
risks such as predation is associated particularly with avoiding hyperthermia due to the shade I
provided at waterholes. Aside from aerial predators, ground predators such as mongooses and
snakes put birds drinking at risk (Lazarus and Symonds 1992). To avoid heat stress associated
with open grounds (Kenagy et al. 2004; Molokwu et al. 2010) or to hide away from predators
(Molokwu et al. 2008) some animals are forced to forage closer to shaded microsites (Molokwu
et al. 2010). However the presence of cover can be described as ‘protective’ and ‘obstructive’ to
the prey or ‘obstructive’ to the predator. Molokwu et al. (2010) suggests that the risk of predation
had a stronger influence on foraging bird behaviours than high temperatures within the African
savannah (West Africa). Drinking in large groups is of advantage to Sociable Weavers where
more eyes can watch out for predators (Ferns and Hinsley 1995). For example the Village
Weavers (Ploceus cucullatus) and Speckle-fronted Weavers (Sporopipes frontalis) studied in the
savannah foraged in the sun and only fled back to cover when pursed by a predator (Molokwu et
al. 2010). The Red-headed Finches, Black-throated Canaries, Cape Glossy Starlings and
Laughing Doves may be utilizing shade as cover in addition to taking advantage of cooler
temperatures as demonstrated by the Rock Firefinch (Lagonosticta sanguinodorsalis) which
preferred to remain within cover (shaded vegetation) away from predators (Molokwu et al.
2010). Cape Turtle-Doves, Laughing Doves and Namaqua doves arrived at waterholes
individually or sometimes in pairs, usually perching on the wooden frames or tall trees scanning
around before coming down to drink. Although no kills were recorded when the Southern Pale
Chanting Goshawks or Gabar Goshawks came to drink, no other birds were seen at the
waterholes or around it while they were drinking (pers. obs.). Falcons and goshawks were
frequently observed hunting at artificial water points, mainly targeting doves in the Namib
50
Desert (Cade 1965). Cape Turtle-Doves and Namaqua Doves drinking at open waterholes may
have associated shade with increasing predation risks (by reducing the visibility of predators).
This was a similar observation made in Black-bellied Sandgrouse (Pterocles orientalis) which
considered cover as being obstructive (Ferns and Hinsley 1995). Body mass could also
contribute to a higher risk of predation. Cape Turtle-Doves, Cape Glossy Starlings and Laughing
Doves could be more susceptible to predation because of their body masses relative to other
birds species (Table 2) sighted drinking. Adult Cape Turtle-Doves weigh up to 148 g (Underhill
et al. 1999) and tend to be abundant at waterholes as such they could be a good target for raptors
such as the Southern Pale Chanting Goshawk.
Body size in birds is expected to have an impact on the trade-off between hydration and
avoidance of hyperthermia. Smaller species such as Violet-eared Waxbills, Black-throated
Canaries and Red-headed Finches are more likely to experience differences in environmental
temperatures between shaded and unshaded microsites because the surface to volume ratio in
birds increases with decreasing body size. Thereby, they lose water more quickly when heat
stressed. In Verdins (Auriparus flaviceps) for example heat stress is lessened by about 12°C
when resting within shaded microsites (Wolf and Walsberg 1996). In the Arabian Desert, Larks
(Alaudidae) use thermally buffered burrows (41°C) of Egyptian spiny-tailed lizard (Uromastyx
aegyptia) when air temperatures were about 44°C (William et al. 1999). In this study however,
there was no clear pattern of this effect on the trade-off among the 10 bird species in relation to
body size. For the smaller species, the Violet-eared Waxbill and Red-headed Finch are of the
same size measuring 14 cm, while the Black-throated Canary is slightly smaller measuring 11 –
12 cm (Hockey et al. 2005). Although the Violet-eared Waxbill was observed to increase visits
to waterholes, this was negligible in comparison to the Black-throated Canary and Red-headed
51
Finch numbers. In addition the increase in Violet-eared Waxbill could not be correlated with
changes in air temperatures as noted in the other two species.
Finally, the availability of shade modifies the behavior of birds drinking at waterholes in the
Kalahari. The Black-throated Canary and Red-headed Finch display a clear pattern that could be
attributed to heat stress while shade could be utilized as cover from predators, species such as the
Cape Turtle-Dove may rather resort to flying away from predators.
Conservation implications
In the face of increasing average and maximum air temperatures, birds such as Laughing Doves,
Red-headed Finches, Cape Glossy Starlings and Black-throated Canaries can be partially
managed by simply providing shade at drinking pools. This will aid in minimizing other
challenges they face such as interruptions in breeding. However, if these bird species did not feel
comfortable around artificial structures, waterholes could be moved within close distances to
large Acacia and Boscia trees (common indigenous species) providing natural shade where birds
can quickly fly to shelter during the heat or in avoiding predators. Less perceived predation risks
at shaded waterholes may encourage non-drinkers to utilize it as cover. However, shade may be
used by predators as well thereby increasing perceived predation risk as observed in the Cape
Turtle-Dove. In addition, rotating access to certain waterholes frequently could potentially lead
to the growth of vegetation around waterholes which could encourage more bird species to visit.
Artificial waterholes though advantageous may have caused bird species to expand their
geographical ranges as observed with the Crested Pigeon (Ocyphaps lophotes) and Zebra Finch
(Taeniopygia guttata) in Australia (James et al. 1999).
52
Limitations of the study
During the course of study some of the limitations which could not be avoided or could be
improved upon are as follows. Firstly, air temperatures during this study were not hot enough
and hardly exceeded avian diurnal body temperatures (40-41°C) (Dawson and Schmidt-Nielsen
1964; Dawson and Bennett 1973). The trade-off between avoiding hyperthermia and dehydration
may not be clearly defined by the birds in this region. Therefore carrying out a similar study in
hotter regions (maximum air temperatures of about 45°C and above) such as Australia and North
America (Wolf 2000) may provide a firmer conclusion. Secondly, the time frame allocated may
have not been sufficient enough to view other changes exhibited by some bird species in
responding to the presence of shade and needed more time to acclimatise. A longer time frame
could also provide a larger sample size which is of importance in statistical analysis. Thirdly, the
Kalahari rains arriving in October and November made temperatures on some days cooler for
these birds and therefore had no reason to visit waterholes. Fourthly, the effect of the
surrounding vegetation and animals drinking on bird visitations was not analyzed. Lastly, the
shade cloth (dark blue in colour) and design may have prevented some bird species from
drinking at waterholes because they looked foreign. Inventing new shade designs with more
natural materials and taking into account the location and orientation of waterholes may improve
the pattern of utilization by birds.
Conclusions and recommendations
Provision of shade increased the numbers of Laughing Doves, Black-throated Canaries, Red-
headed Finches and Cape Glossy Starlings drinking at waterholes. This potentially enhanced
their ability to remain hydrated and maintain a stable body temperature in response to potentially
53
increasing environmental temperatures. However, not all species benefited from the provision of
shade, with numbers of Cape Turtle-Doves and Namaqua Doves decreasing when waterholes
were shaded. Factors that might explain this include nervousness of the novel structures, or
increased fear of predation due to impaired lines of sight. As a complement to this study, other
aspects which could improve the knowledge about these birds and how they react to
environmental changes include: 1) studying the duration of time spent drinking by different bird
species at control waterholes versus shaded ones; 2) the amount of water swallowed on a single
trip to waterholes (in relation to air temperature); 3) measuring vigilance of drinking birds at
different times of the day; and 4) examining trade-offs between dehydration avoidance and
predation avoidance by comparing the drinking pattern at a site with relatively fewer predators
(such as Farm Murray) to one with higher number of predators (such as Kgalagadi Transfrontier
Park). Together, answering these questions will improve our understanding of drinking
behaviour in this environment.
54
References
Abdu, S. n.d. Spatial use of the landscape by Kalahari birds in relation to temperature and the
location of waterholes. University of Cape Town. Unpublished manuscript.
Abele, D., K. Heise, H. O. Pörtner, and S. Puntarulo. 2002. Temperature-dependence of
mitochondrial function and production of reactive oxygen species in the intertidal mud
clam Mya arenaria. J Exp Biol 205:1831-41.
Angilletta, M. J., B. S. Cooper, M. S. Schuler, and J. G. Boyles. 2010. The evolution of thermal
physiology in endotherms. Frontiers in Bioscience E 2:861-881.
Anon. 1976. Drinking. Ostrich 47(S1):20-24.
Arnold, T. W. 2010. Uninformative parameters and model selection using Akaike’s Information
Criterion. J. Wildl. Man. 74:1175-1178.
Bartholomew, G. A. and T. J. Cade. 1963. The water economy of land birds. Auk 80:504–539.
Bartholomew, G. A., and W. R. Dawson. 1968. Temperature regulation in desert mammals.
Desert Biol. 1:395-421.
Bates, D., M. Maechler, B. Bolker, and S. Walker. 2014. (lme4): Linear mixed-effects models
using Eigen and S4. R package version 1.1-7.
Bech, C., K. Johansen, and G. M. O. Maloiy. 1979. Ventilation and expired gas composition in
the flamingo, Phoenicopterus ruber, during normal respiration and panting. Physiol.
Zool. 52:313-328.
Box, M. J., and R. D. Norman. 1971. Factorial designs, the| X′ X| criterion, and some related
matters. Technometrics 13(4):731-742.
Boyles, J. G., F. Seebacher, B. Smit, and A. E. McKechnie. 2011. Adaptive Thermoregulation in
Endotherms May Alter Responses to Climate Change. Integrative and Comparative
Biology pp 1-15.
55
Cade, T. J. 1965. Relations between raptors and columbiform bird at a desert waterhole. Wilson
Bulletin 77:340-345.
Calder, W. A., and J. R. King. 1974. Thermal and caloric relations of birds. in Farner, D. S. and
King, J. R. eds. Avian biology 4:259-413 Academic Press, New York.
Callaway, J. M. 2004. Adaptation benefits and costs: how important are they in the global policy
picture and how can we estimate them? Global Environ. Change 14:273-284.
Chown, S. L., A. A. Hoffmann, T. N. Kristensen, M. J. Angilletta Jr, N. C. Stenseth, and C.
Pertoldi. 2010. Adapting to climate change: a perspective from evolutionary
physiology. Climate research 43(1):3.
Coaton, W. G. H. 1963. Survey of the termites (Isoptera) of the Kalahari thornveld and shrub
bushveld of the R.S.A. Koedoe 6:38-50.
Daniel, R. M., M. E. Peterson, M. J. Danson, N. C. Price, S. M. Kelly, C. R Monk, C. S.
Weinberg, M. L. Oudshoorn, and C. K. Lee. 2010. The molecular basis of the effect of
temperature on enzyme activity. Biochem J 425:353-60.
Dawson, W. R., and A. F. Bennett. 1973. Roles of metabolic level and temperature regulation in
the adjustment of western plumed pigeons to desert conditions. Comp. Biochem. Physiol.
A 44:249-266.
Dawson, W. R., and K. Schmidt-Nielsen. 1964. Terrestrial animals in dry heat: desert birds. In
Handbook of Physiology. Sect. 4. Adaptation to the Environment (ed. D. B. Dill).
Washington, D.C.: American Physiological Society.
Debenham, F. 1952. The Kalahari today. Geographical Journal 118:12-24.
du Plessis, K. L., R. O. Martin, P. A. R. Hockey, S. J. Cunningham, and A. R. Ridley. 2012. The
costs of keeping cool in a warming world: implications of high temperatures for foraging,
thermoregulation and body condition of an arid-zone bird. Global Change Biol. 18:3063-
3070.
56
Ferns, P. N., and S. A. Hinsley. 1995. Importance of topography in the selection of drinking sites
by sandgrouse. Func. Ecology 371-375.
Finlayson, H. H. 1932. Heat in the interior of South Australia – holocaust of bird-life. S. Austral.
Ornithol. 11:158-160.
Fisher, C. D., E. Lindgren, and W. R. Dawson. 1972. Drinking patterns and behaviour of
Australian Desert birds in relation to their ecology and abundance. Condor 74:111-136.
Fuller, R. A., K. N. Irvine, P. Devine-Wright, P.H. Warren and K. J. Gaston. 2007.
Phychological benefits of green space increase with biodiversity. Biol. Lett. 3:390-394.
Geiser, F. 2004. Metabolic rate and body temperature reduction during hibernation and daily
torpor. Annu. Rev. Physiol. 66:239-274.
Geiser, F., and T. Ruf. 1995. Hibernation versus daily torpor in mammals and birds:
physiological variables and classification of torpor patterns. Physiol. Zool. 68:935-66.
Gerson, A. R., E. K. Smith, B. Smit, A. E. McKechnie, and B. O. Wolf. 2014. The impact of
humidity on evaporative cooling in small desert birds exposed to high air temperatures.
Physiol. Biochem. Zool. 87:782-795.
Gleick, P. H. 1989. Climate change, hydrology and water resources. Rev. Geophys. 27:329-344.
Green, R. H. 1979. Sampling Design and Statistical Methods for Environmental Biologists, New
York: Wiley.
Hockey, P. A. R., W. R. J. Dean, and P. G. Ryan. (eds) 2005. Roberts birds of southern Africa
(7th edn). Cape Town: Trustees of the John Voelcker Bird Book Fund.
Hoffmann, A. A. 2010. Physiological climatic limits in Drosophila: patterns and implications.
Journal of Experimental Biology 213:870-880.
Hudson, D. M., and M. H. Bernstein. 1981. Temperature regulation and heat balance in flying
White-necked Ravens, Corvus cryptoleucus. J. Exp. Biol. 90:267-281.
57
Hughes, L. 2000. Biological consequences of global warming: is the signal already apparent?
Trends Ecol. Evol. 15:56-61.
Immelmann, K. 1969. Environmental factors controlling reproduction in African and Australian
birds — A comparison. Ostrich: Journal of African Ornithology 40:193-204.
IPCC. 2007. Climate change 2007: Fourth assessment report of the Intergovernmental Panel on
Climate Change. Cambridge University Press, Cambridge, UK.
IPCC. 2011. Intergovernmental Panel on Climate Change Special Report on Managing the Risks
of Extreme Events and Disasters to Advance Climate Change Adaptation. Cambridge
University Press, Cambridge, UK.
Irwin, M. P. S. 1956. Notes on the drinking habits of birds in semi desertic Bechuanaland. Bull.
Br. Om. Club 76:99-101.
James, C. D., J. Landsberg, and S. R. Morton. 1999. Provision of watering points in the
Australian arid zone: a review of effects on biota. Journal of arid environments 41(1):87-
121.
Kenagy, G. J, R. A. Vasquez, B. M. Barnes, and F. Bozinovic. 2004. Microstructure of summer
activity bouts of Degus in a thermally heterogeneous habitat. J. Mammal 85:260-267.
Kronfeld-Schor, N., and T. Dayan. 2013. Thermal Ecology, Environments, Communities, and
Global Change: Energy Intake and Expenditure in Endotherms. Annu. Rev. Ecol. Evol.
Syst. 44:461-80.
Kruger, A. C., and S. S. Sekele. 2012. Trends in extreme temperature indices in South Africa:
1962–2009. Int. J. Climatol. 33:661-676.
Kruger, A. C., and S. Shongwe. 2004. Temperature Trends in South Africa: 1960–2003 Int. J.
Climatol. 24:1929-1945.
Kusangaya, S., M. L. Warburto, E. A. van Garderen, and G. P. W. Jewitt, 2014. Impacts of
climate change on water resources in southern Africa: A review. Physics and Chem.
Earth 67-69:47-54.
58
Labuschagne, R. J. 1959. Birds of the Kalahari Gemsbok National Park, Ostrich: Journal of
African Ornithology 30:86-95.
Lasiewski, R. C., A. L. Acosta, and M. H. Bernstein. 1966. Evaporative water loss in birds.
Characteristics of the open flow method of determination, and their relation to estimates
of thermoregulatory ability. Comp. Biochem. Physiol. 19:445-457.
Lazarus, J., and M. Symonds. 1992. Contrasting effects of protective and obstructive cover on
avian vigilance. Ani. Behav. 43:519-521.
Lloyd, P., and Palmer, A. G. 1998. Abiotic factors as Predictors of distribution in southern
African bulbuls. Auk 115(2):404-411.
Lovegrove, B. G. 1993. The Living Deserts of Southern Africa. Fernwood Press, Vlaeberg.
Lovegrove, B. G. 2000. The zoogeography of mammalian basal metabolic rate. The American
Nat. 156(2):201-219.
Lynn, J. C., C. L. Chambers, and S. S. Rosenstock. 2006. Use of wildlife water developments by
birds in southwest Arizona during migration. Wildl. Soc. Bull. 34:592–601.
Maclean, G. L. 1970. An analysis of the avifauna of the southern Kalahari Gemsbok National
Park. Zool. afi. 5:249-273.
Marder, J. A. C. O. B., and I. D. I. T. Gavrieli-Levin. 1987. The heat-acclimated pigeon: an ideal
physiological model for a desert bird. Journal of Applied Physiology 62(3):952-958.
Marder, J., Z. Arad, and M. Gafni. 1974. The effect of high ambient temperatures on acid-base
Robertshaw, D. 2006. Mechanisms for the control of respiratory evaporative heat loss in panting
animals. J. Appl. Physiol. 101:664-668.
Rowan, M. K. 1983. The doves, parrots and louries of southern Africa. David Phillip, Cape
Town.
RStudio (2014). RStudio: Integrated development environment for R (Version 0.98.1091)
[Computer software]. Boston, MA.
61
Saunders, D. A., P. Mawson, and R. Dawson. 2011. The impact of two extreme weather events
and other causes of death on Carnaby's Black Cockatoo: A promise of things to come for
a threatened species? Pac. Conserv. Biol. 17:141-148.
Schleucher, E. 1993. Life in extreme dryness and heat: a telemetric study of the behaviour of the
Australian Diamond Dove (Geopelia cuneata) in its natural habitat. Emu 93:251-258.
Schleucher, E. 1999. Energetics and body temperature regulation in pigeons and Doves of
extreme habitats. Ornis Fenn. 76:199-210.
Schleucher, E., R. Prinzinger, and P. C. Withers. 1991. Life in extreme environments:
Investigations on the ecophysiology of a desert bird, the Australian Diamond Dove
(Geopelia cuneata). Oecologia 88:72-76.
Seibert, H. C. 1949. Differences between migrant and non-migrant birds in food and water intake
at various temperatures and photoperiods. The Auk 128-153.
Skalski, J. R., and D. S. Robson 1992. Techniques for Wildlife Investigations, Design and
Analysis of Capture Data, New York: Academic.
Smit, B. 2013. Taking the heat: integrating behavioural and physiological variables to predict
avian responses to climate change in the Kalahari Desert. Ph.D Thesis, University of
Pretoria, Pretoria.
Smit, B., C. T. Harding, P. A. R. Hockey, and A. E. McKechnie. 2013. Adaptive
thermoregulation during summer in two populations of an arid-zone passerine. Ecological
society of America 94:1142-1154.
Stewart-Oaten, A., W. W. Murdoch, and K. R. Parker. 1986. Environmental Impact Assessment:
Pseudo replication in Time? Ecology 67:929-940.
Stoddart, L. A., A. D. Smith, and T. W. Box. 1975. Range Management. McGraw-Hill, New
York.
Tews, J., N. Blaum, and F. Jeltsch. 2004. Structural and animal species diversity in arid and
semi-arid savannas of the southern Kalahari. Annals of Arid Zone 43:413-425.
62
Tieleman, B. I., and J. B. Williams. 1999. The role of hyperthermia in the water economy of
desert birds. Physiol. Biochem. Zool. 72:87-100.
Tieleman, B. I., and J. B. Williams. 2002. Effects of food supplementation on behavioural
decisions of hoopoe-larks in the Arabian Desert: balancing water, energy and
thermoregulation. Anim. Behav. 63:519-529.
Tolsma, D. J., W. H. O. Ernst, and R. A. Verwey. 1987. Nutrients in the soil and vegetation
around two artificial water points in eastern Botswana. Journal of Applied Ecology
24:991-1000.
Towie, N. 2009. Thousands of birds die in sweltering heat. PerthNow, 13 January 2009.
Trenberth, K. E., P. D. Jones, P. Ambenje, R. Bojariu, D. Easterling, A. Klein Tank, D. Parker,
F. Rahimzadeh, J. A. Renwick, M. Rusticucci, B. Soden, and P. Zhai. 2007.
Observations: surface and atmospheric climate change. In Climate Change 2007: The
Physical Science Basis. Contribution of Working Group I to the Fourth Assessment
Report of the Intergovernmental Panel on Climate Change 2001, Solomon S, Qin D,
Manning M, Chen Z, Marquis M, Averyt Tignor, K. B., and M. Miller (eds). Cambridge
University Press: Cambridge, United Kingdom and New York, NY, USA.
Underhill, L. G., G. D. Underbill, and C. N. Spottiswoode. 1999. Primary moult and body-mass
of the Cape Turtle Dove (Streptopelia capicola), and its abundance relative to the
Laughing Dove (S. senegalensis), in the Western Cape. Ostrich 70:3-4.
Walther, G. R., C. A. Burga, and P. J. Edwards (eds). 2001. Fingerprints of Climate Change -
Adapted Behaviour and Shifting Species Ranges. Kluwer Academic/Plenum, New York.
Walther, G. R., E. Post, P. Convey, A. Menzel, C. Parmesank, T. J. C. Beebee, J. M. Fromentin,
O. Hoegh-Guldberg and F. Bairlein. 2002. Ecological responses to recent climate change.
Nature 416:389-395.
Weathers, W. W. 1997. Energetics and thermoregulation by small passerines of the humid,
lowland tropics. Auk 114:341-353.
63
Webster, M. D., and J. R. King. 1987. Temperature and humidity dynamics of cutaneous and
respiratory evaporation in pigeons, Columba livia. J. Comp. Physiol. B 157:253-260.
Welbergen, J. A., S. M. Klose, N. Markus, and P. Eby. 2008. Climate change and the effects of
temperature extremes on Australian flying-foxes. Proc R Soc Lond B Biol Sci 275:419-
25.
Williams, J. B. 1996. A phylogenetic perspective of water loss in birds. Auk 113:457-472.
Williams, J. B. 1999. Heat production and evaporative water loss of dune larks from the Namib
Desert. Condor 101:432–438.
Williams, J. B. 2001. Energy expenditure and water flux of free-living Dune Larks in the Namib:
a test of the reallocation hypothesis on a desert bird. Functional Ecology 15:175–185.
Williams, J. B., B. I. Tieleman, and M. Shobrak. 1999. Lizard burrows provide thermal refugia
for larks in the Arabian Desert. Condor 714-717.
Williams, P. L., and W. D. Koenig. 1980. Water dependence of birds in temperate oak woodland.
Auk 97:339–350.
Willouohby, E. J. and T. J. Cade. 1967. Drinking habits of birds in the central Namib Desert of
South West Africa. Scient. Pap. Namib Desert Res. St. 31:l-35.
Wolf, B. O. 2000. Global warming and avian occupancy of hot deserts; a physiological and
behavioral perspective. Revista Chilena de Historia Natural 73:395-400.
Wolf, B. O., and G. E. Walsberg. 1996. Respiratory and cutaneous evaporative water loss at high
environmental temperatures in a small bird. J. Exp. Biol. 457:451–457.
Wolf, B. O., C. Martinez del Rio, and J. Babson. 2002. Stable isotopes reveal that saguaro fruit
provides different resources to two desert dove species. Ecology 83:1286-1293.
Wuethrich, B. 2000. How climate change alters rhythms of the wild. Science 287:793-795.
64
Appendices
Appendix A: Interactions between the experimental phase (exp; two levels ‘Before’ and ‘After’) and treatment group (treatment; two levels ‘Control’ and ‘Shade’) for the 10 selected species. Each species has its corresponding estimate, standard error, z value and p value respectively. Family = Poisson. (. = near significant, * = significant, ** = very significant and *** = extremely significant).
Species Variables Estimate Standard Error z value P-value Sociable weaver (Intercept) -1.2166 0.2783 -4.371 1.24e-05 ***
Appendix B: Models for the 10 selected bird species during Phase 1 of the experiment. The variables include: time of day, quadratic function of time of day, air temperature, waterhole and the interaction between time of day and air temperature. Each species has its corresponding Degree of freedom (df), Loglikelihood (LogLik), Akaike Information Criterion (AICc) and Weight (Wt).
Species Models (Int) h.2 h.22 Ta wtr h.2:Ta df logLik AICc delta weight
Appendix C: The pattern of use of waterholes by the 10 selected species during phase 1 of the experiment. The variables include: intercept (waterhole 1) waterhole (2, 3, 4, 6 and 8), air temperature, time of day, quadratic function of time of day, interaction between air temperature and time of day. Each species has its corresponding estimate, standard error, t value and p value respectively. Family = Quasibinomial. (Ta = air temperature, h.2 = time of day, I(h.22) = quadratic function of time of day, : = interaction, . = near significant, * = significant, ** = very significant, *** = extremely significant).
Cape Turtle-Dove Estimate Std. Error t value Pr(>|t|)
White-browed Sparrow-weaver Estimate Std. Error t value Pr(>|t|) (Intercept) -4.64886 0.35273 -13.18 < 2e-16 *** Ta 0.04078 0.0119 3.427 0.00114 **
71
Appendix D: Best models for the 10 selected bird species during Phase 2 of the experiment. The variables include time of day, quadratic function of time of day, air temperature, treatment (‘control’ and ‘shade’), interaction between time of day and air temperature, interaction between time of day and treatment and interaction between air temperature and treatment. Each species has its corresponding Degree of freedom (df), Loglikelihood (LogLik), Akaike Information Criterion (AICc) and Weight (Wt).
Appendix E: The pattern of use of waterholes by the 10 selected species during phase 2 of the experiment. The variables include: intercept, air temperature, time of day, quadratic function of time of day, treatment (‘control’ and ‘shade’), interaction between air temperature and time of day, interaction between time of day and treatment and interaction between air temperature and treatment. Each species has its corresponding estimate, standard error, t value and p value respectively. Family = Binomial. (Ta = air temperature, h.2 = time of day, I(h.22) = quadratic function of time of day, : = interaction, . = near significant, * = significant, ** = very significant, *** = extremely significant).