Does the Stock Market See a Zero or Small Positive Earnings Surprise as a Red Flag?. Zhi-Xing Lin Michael Shih NUS Business School National University of Singapore. Earnings management is costly (reduces earnings in the future and heightens earnings expectations in the future) - PowerPoint PPT Presentation
25
1 Does the Stock Market See a Does the Stock Market See a Zero or Small Positive Zero or Small Positive Earnings Surprise as a Red Earnings Surprise as a Red Flag? Flag? Zhi-Xing Lin Zhi-Xing Lin Michael Shih Michael Shih NUS Business School NUS Business School National University of Singapore National University of Singapore
Transcript
11
Does the Stock Market See a Does the Stock Market See a Zero or Small Positive Earnings Zero or Small Positive Earnings
Surprise as a Red Flag?Surprise as a Red Flag?
Zhi-Xing LinZhi-Xing LinMichael ShihMichael Shih
NUS Business SchoolNUS Business SchoolNational University of SingaporeNational University of Singapore
22
Earnings management is costly (reduces earnings in the future and heightens earnings expectations in the future)
Manipulation of analyst expectations is costly (lose credibility with analysts)
Thus, firms are likely to manage earnings and/or analyst expectations just enough to meet or narrowly beat analysts’ earnings forecasts.
33
Hypothesis 1Hypothesis 1: Investors and analysts : Investors and analysts see a zero or small positive earnings see a zero or small positive earnings surprise as a red flag on the earnings surprise as a red flag on the earnings announcement date in their attempt to announcement date in their attempt to identify manipulators of earnings and/or identify manipulators of earnings and/or analyst earnings expectations. analyst earnings expectations.
44
there is an increasing tendency of firms to manage earnings and/or analyst expectations to avoid a small negative earnings surprise, as our test results show.
Academic research showed in late 1990s (Burghstahler and Dichev 1997; Degeorge et al. 1999) the frequency of firms meeting or narrowly beating earnings benchmarks is higher than expected.
Thus, investors and analysts should be more suspicious of firms that report a zero or small positive earnings surprise.
55
Hypothesis 2Hypothesis 2: Investors and analysts : Investors and analysts see a zero or small positive earnings see a zero or small positive earnings surprise as surprise as moremore of a red flag on the of a red flag on the earnings announcement date in late earnings announcement date in late 1990s and early 2000s. 1990s and early 2000s.
where where CARCAR is cumulative abnormal returns is cumulative abnormal returns attributed to the earnings announcement, attributed to the earnings announcement, ESES is the earnings surprise, calculated as is the earnings surprise, calculated as actual earnings per share minus the latest actual earnings per share minus the latest consensus analyst forecast, and consensus analyst forecast, and PP is the is the price per share. price per share.
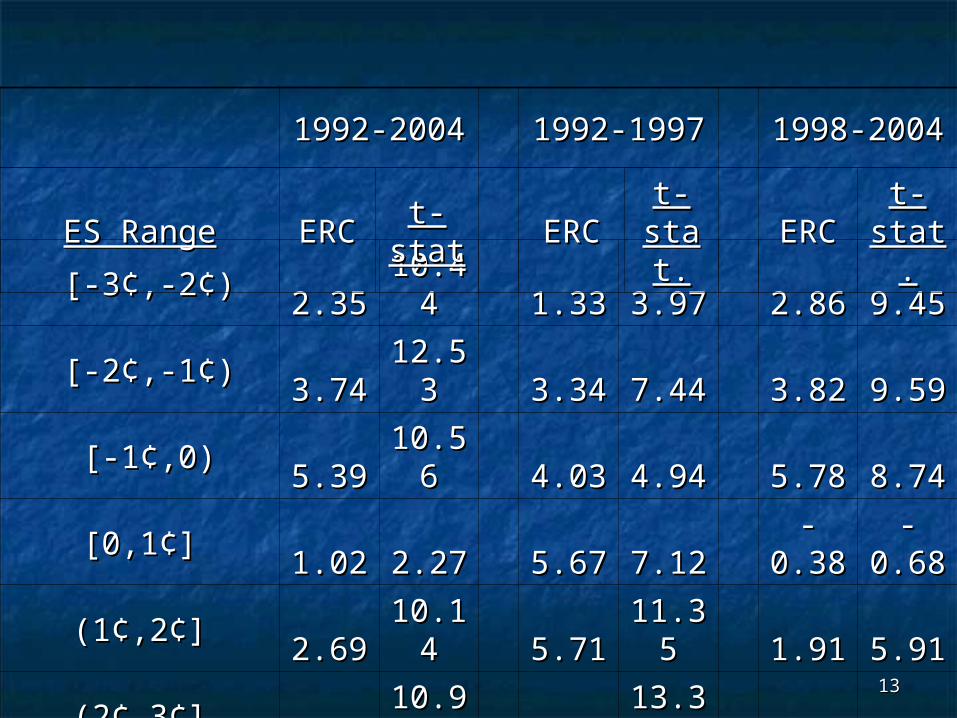
The coefficient β in the regression model is The coefficient β in the regression model is the earnings response coefficient (ERC). the earnings response coefficient (ERC).
77
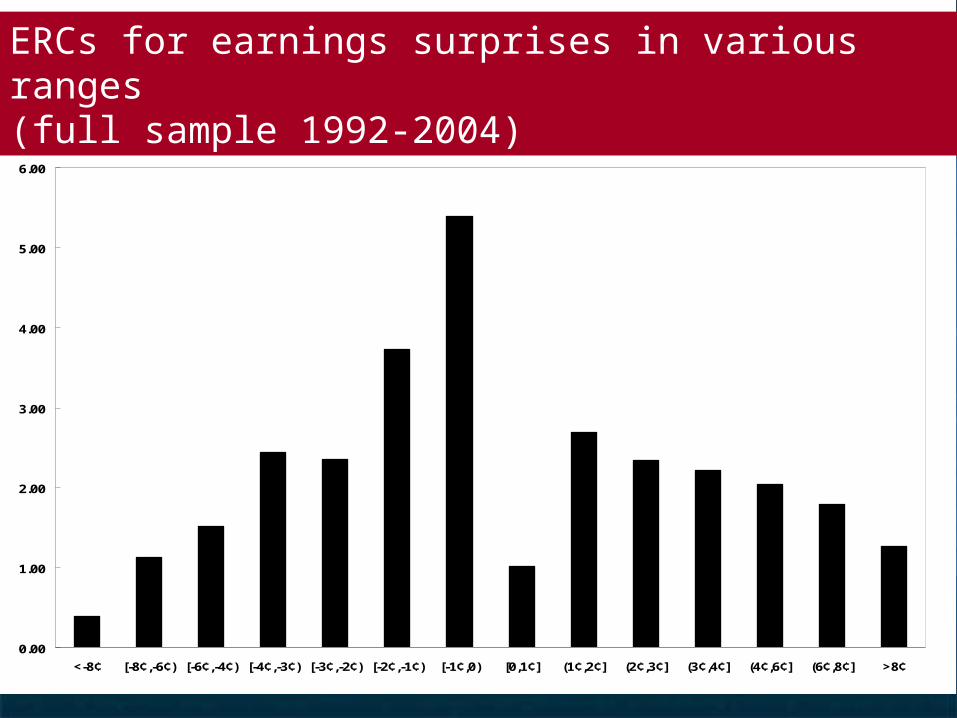
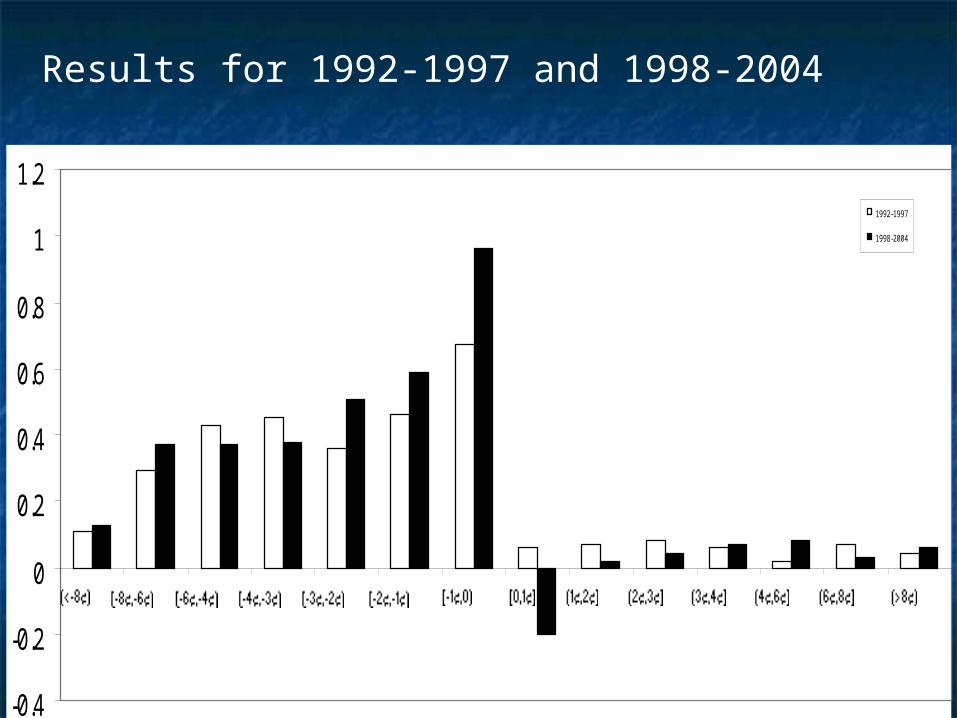
Divide sample into earnings surprise class/range:Divide sample into earnings surprise class/range:
Class Class R-7: R-7: Earnings surprises less than -8¢ per Earnings surprises less than -8¢ per share share
Class Class R-6 R-6 comprises ES’s in the [-8¢,-6¢) rangecomprises ES’s in the [-8¢,-6¢) range ClassClass R-5 R-5 comprises ES’s in the [-6¢, -4¢) range; comprises ES’s in the [-6¢, -4¢) range; Class Class R-R-4 comprises ES’s in the [ -4¢,-3¢) range; 4 comprises ES’s in the [ -4¢,-3¢) range; ClassClass R- R-3 comprises ES’s in the [-3¢ ,-2¢) range; 3 comprises ES’s in the [-3¢ ,-2¢) range; Class Class R-R-2 comprises ES’s in the [-2¢ , -1¢) range; 2 comprises ES’s in the [-2¢ , -1¢) range; ClassClass R- R-1 comprises ES’s in the [-1¢,0); 1 comprises ES’s in the [-1¢,0); Class Class R0R0 comprises ES’s in the [0, 1¢] range; comprises ES’s in the [0, 1¢] range; Class Class R1R1 comprises ES’s in the (1¢,2¢] range; comprises ES’s in the (1¢,2¢] range; ClassClass R2 R2 comprises ES’s in the (2¢,3¢] range; comprises ES’s in the (2¢,3¢] range; ClassClass R3 R3 comprises ES’s in the (3¢,4¢] range; comprises ES’s in the (3¢,4¢] range; Class Class R4 R4 comprises ES’s in the (4¢,6¢] range; comprises ES’s in the (4¢,6¢] range; ClassClass R5 R5 comprises ES’s in the (6¢,8¢] range; nd comprises ES’s in the (6¢,8¢] range; nd ClassClass R6 R6 comprises ES’s greater than 8¢. comprises ES’s greater than 8¢.
88
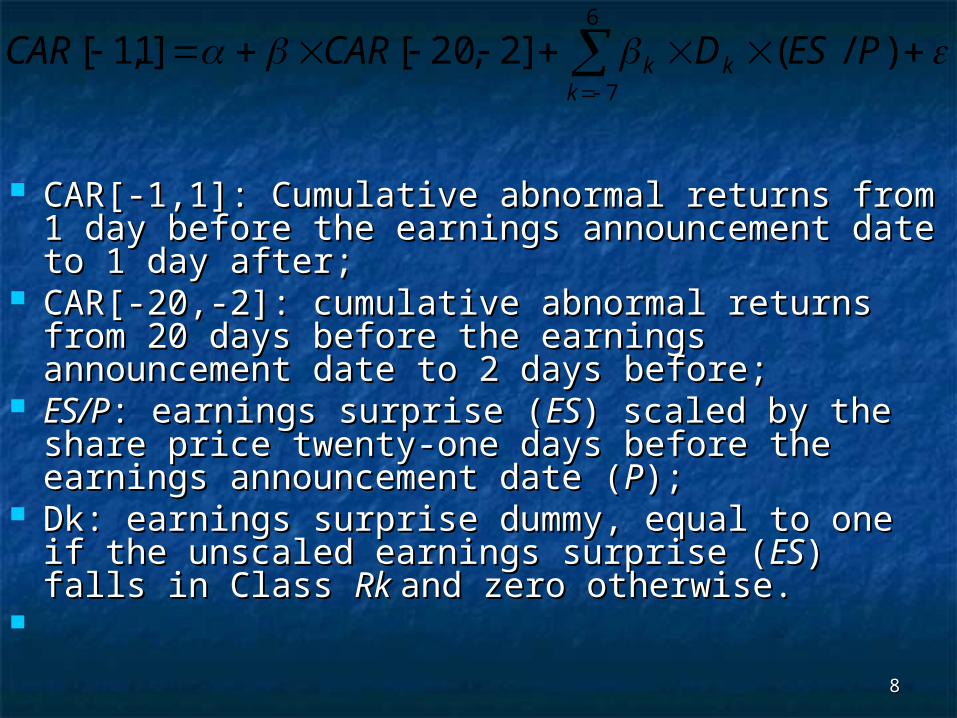
CAR[-1,1]: Cumulative abnormal returns from 1 CAR[-1,1]: Cumulative abnormal returns from 1 day before the earnings announcement date to 1 day before the earnings announcement date to 1 day after;day after;
CAR[-20,-2]: cumulative abnormal returns from CAR[-20,-2]: cumulative abnormal returns from 20 days before the earnings announcement date 20 days before the earnings announcement date to 2 days before;to 2 days before;
ES/PES/P: earnings surprise (: earnings surprise (ESES) scaled by the share ) scaled by the share price twenty-one days before the earnings price twenty-one days before the earnings announcement date (announcement date (PP););
Dk: earnings surprise dummy, equal to one if the Dk: earnings surprise dummy, equal to one if the unscaled earnings surprise (unscaled earnings surprise (ESES) falls in Class ) falls in Class Rk Rk and zero otherwise.and zero otherwise.
6
7
)/(]2,20[]1,1[k
kk PESDCARCAR
99
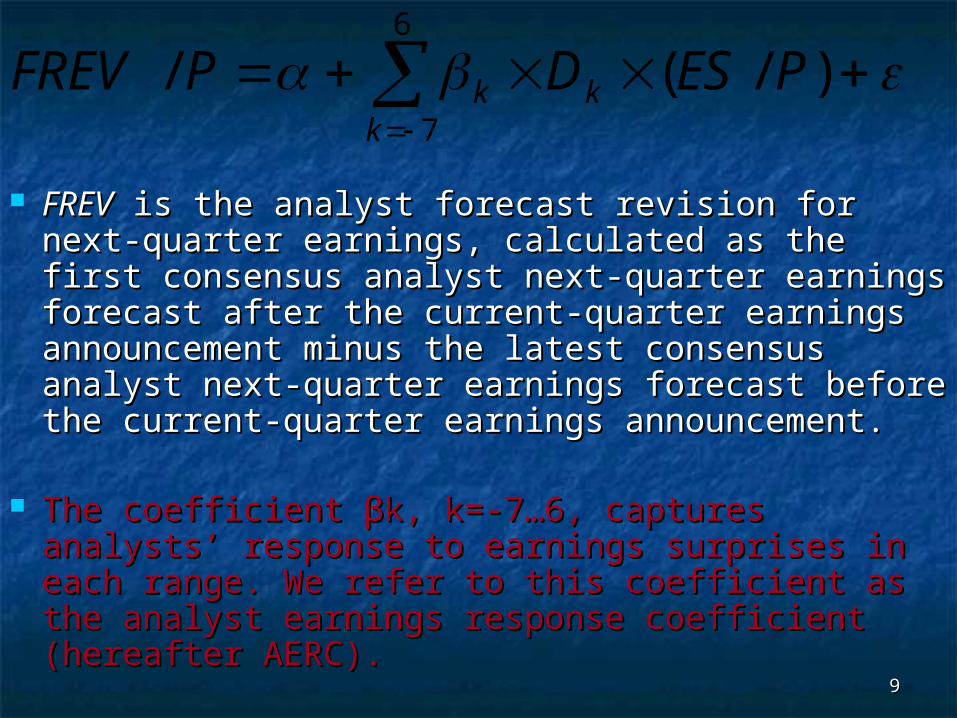
FREVFREV is the analyst forecast revision for next- is the analyst forecast revision for next-quarter earnings, calculated as the first quarter earnings, calculated as the first consensus analyst next-quarter earnings consensus analyst next-quarter earnings forecast after the current-quarter earnings forecast after the current-quarter earnings announcement minus the latest consensus announcement minus the latest consensus analyst next-quarter earnings forecast before analyst next-quarter earnings forecast before the current-quarter earnings announcement. the current-quarter earnings announcement.
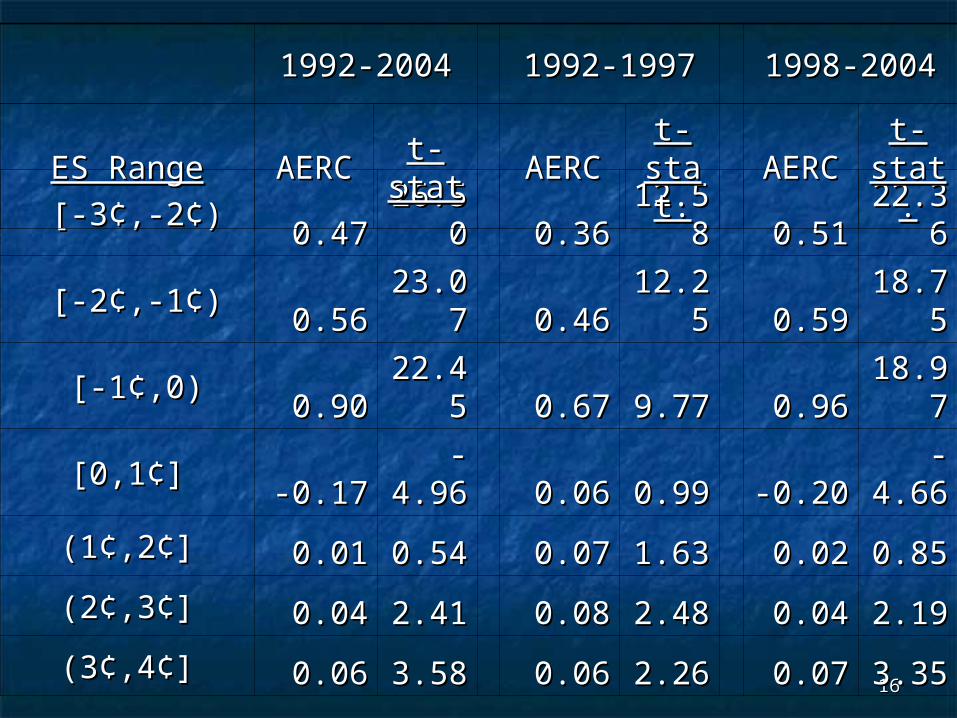
The coefficient βk, k=-7…6, captures analysts’ The coefficient βk, k=-7…6, captures analysts’ response to earnings surprises in each range. response to earnings surprises in each range. We refer to this coefficient as the analyst We refer to this coefficient as the analyst earnings response coefficient (hereafter AERC). earnings response coefficient (hereafter AERC).
6
7
)/(/k
kk PESDPFREV
1010
Sample: Firm-quarters in 1992-2004 Sample: Firm-quarters in 1992-2004 in the intersection of I/B/E/S, CRSP in the intersection of I/B/E/S, CRSP and Compustat. and Compustat.
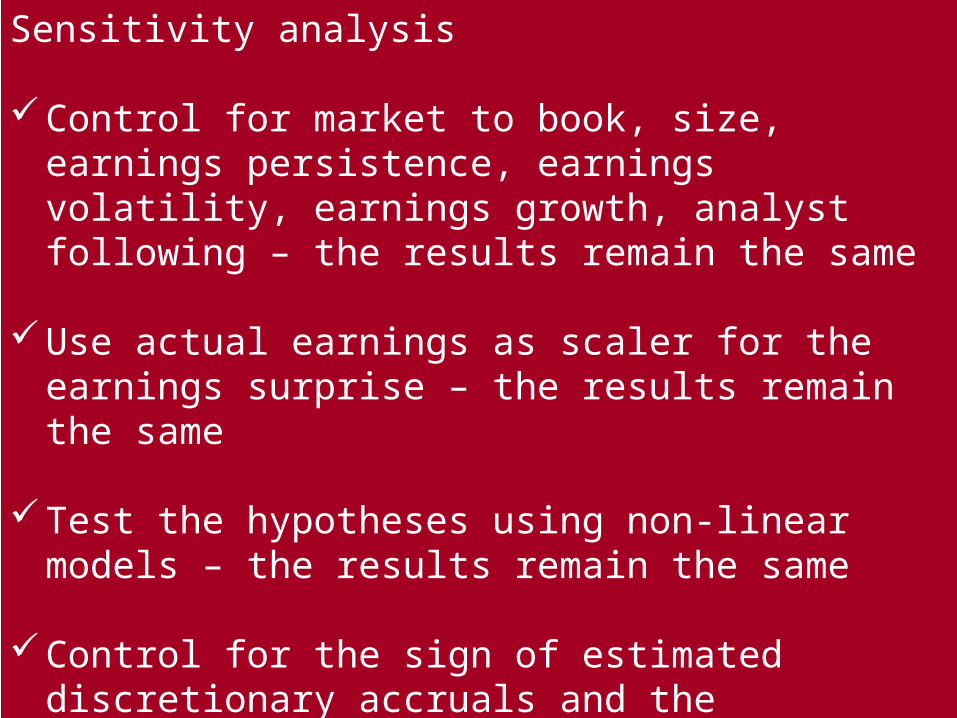
Control for market to book, size, earnings persistence, earnings volatility, earnings growth, analyst following – the results remain the same
Use actual earnings as scaler for the earnings surprise – the results remain the same
Test the hypotheses using non-linear models – the results remain the same
Control for the sign of estimated discretionary accruals and the trajectory of analyst earnings forecasts (see next slide)
1818
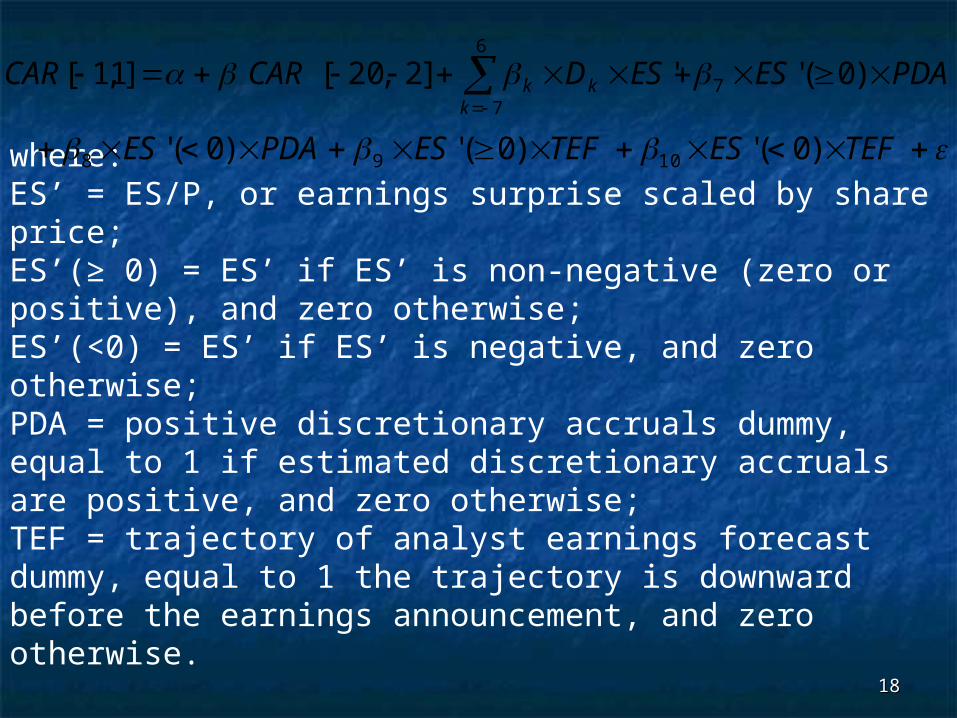
where:ES’ = ES/P, or earnings surprise scaled by share price; ES’(≥ 0) = ES’ if ES’ is non-negative (zero or positive), and zero otherwise; ES’(<0) = ES’ if ES’ is negative, and zero otherwise;PDA = positive discretionary accruals dummy, equal to 1 if estimated discretionary accruals are positive, and zero otherwise; TEF = trajectory of analyst earnings forecast dummy, equal to 1 the trajectory is downward before the earnings announcement, and zero otherwise.
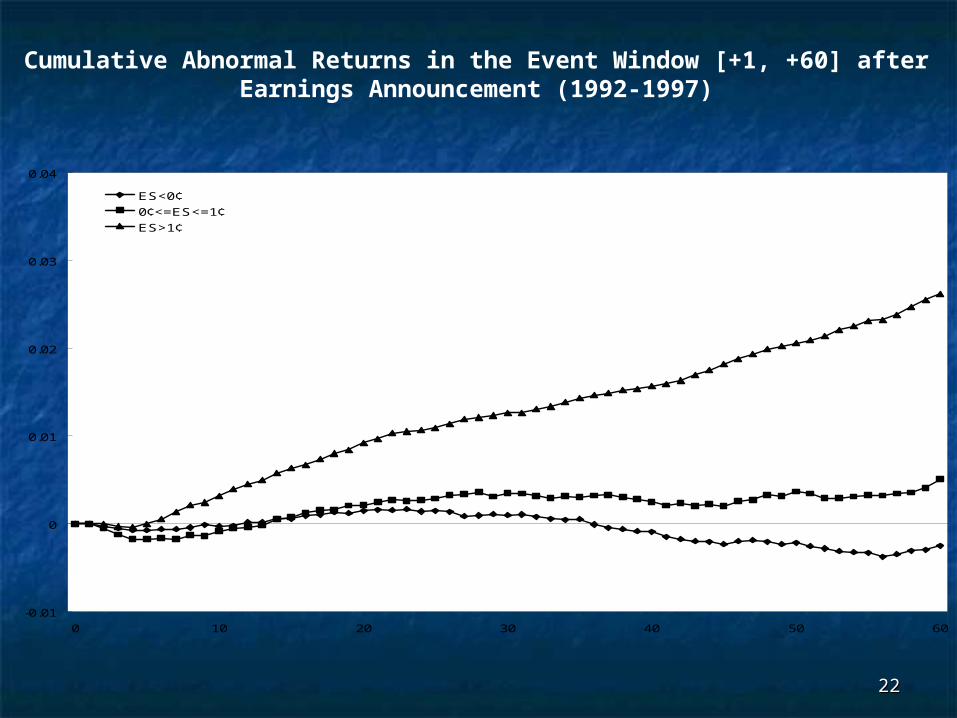
Cumulative Abnormal Returns in the Event Window [+1, +60] after Earnings Announcement (1992-1997)
2323-0.01
0
0.01
0.02
0.03
0.04
0 10 20 30 40 50 60
ES<0¢
0¢<=ES<=1¢
ES>1¢
Cumulative Abnormal Returns in the Event Window [+1, +60] after Earnings Announcement (1998-204)
2424
ttttttt MNBFREVBETASIZEMBSURPQRET 6543210 /
QRET: size-adjusted abnormal returns after the earnings announcement;SURP: scaled decile rank of quarter t’s earnings surprise divided by share price. MNB: dummy variable, equal to 1 if unscaled earnings surprise of quarter t is in the [0,1¢] range, and zero otherwise;B/M: .book to market ratio at the end of fiscal quarter t-1; SIZE : log market value at the end of fiscal quarter t-1;BETA: market beta, FREV: analyst earnings forecast revisions for quarter t+1 after the earnings announcement for quarter t,