Page 1
1
Does use of survey incentives degrade data quality?
James S. Cole, Ph.D.
Associate Scientist and Project Manager
Shimon A. Sarraf
Assistant Director for Survey Operations and Project Services
Xiaolin Wang
Research Project Associate
Center for Postsecondary Research
National Survey of Student Engagement
Indiana University
Bloomington, Indiana
Paper presented at the Association for Institutional Research Annual Forum
Denver, CO
May 2015
Page 2
2
Introduction
Student surveys are a widely used tool for collecting information about educational
quality. However, many institutional and educational researchers are well aware that response
rates for assessment surveys have been declining over the past few decades (Dey, 1997;
Laguilles, Williams, & Saunders, 2011). As a result, many researchers have noted that our ability
to adequately assess student academic experiences, satisfaction, engagement, use of campus
resources, and other important topics in higher education are at risk (Pike, 2008). Consequently,
use of incentives are one tool that many institutional researchers have come to rely on to boost or
hold steady their response rates for various campus student surveys. For example, more than
50% of the institutions participating in the National Survey of Student Engagement now use
incentives to boost response rates, a dramatic increase from only a few years ago (Sarraf & Cole,
2014). Though research regarding the efficacy of incentives to boost survey response rates in
higher education is scant, the research that does exist suggests that incentives are an effective
way to boost response rates (Heerwegh, 2006; Laguilles, Williams, & Saunders, 2011; Sarraf, &
Cole, 2014).
With the increased reliance on incentives though, some wonder if some students are
completing the survey merely to qualify for the incentive (Keusch, Batinic, & Mayerhofer,
2014). If so, one concern of educational survey researchers is the extent to which students
complete each survey item with sincerity and thoughtfulness. This study investigates the
association between use of incentives and survey data quality.
Use of Incentives for Web-Based Surveys
As with most higher education surveys, the data for this study comes from an online
survey instrument. Compared to traditional paper surveys, web surveys provide researchers with
Page 3
3
an easy platform to administer surveys and quickly access respondent data (Umbach, 2004).
However, along with this survey administration mode, researchers face increasing difficulty
convincing students to respond. Many researchers have noted decreasing response rates are a
threat to the validity and generalizability of survey data (Pike, 2008), though other higher
education research suggests low response rates provide reliable population estimates (Hutchison,
Tollefson, & Wigington, 1987; Fosnacht, Sarraf, Howe, & Peck, 2013). To counter these
decreasing response rates, many survey researchers employ incentives. These incentives take
many forms. Some examples include: incentive paid prior to completion (pre-paid); eligibility
for the incentive only upon completion of the survey (post-paid); lottery-based where the
respondent has a chance to win the incentive; participation based where every respondent
receives the incentive; one high-dollar, lottery-based incentive; many low dollar value incentives
with greater odds of winning, and many others. The primary purpose for using incentives is to
increase student motivation to respond, especially for those students that would otherwise refuse
(Singer & Ye, 2013). Many researchers have found incentives effective at increasing responses
rates for general population surveys using random digit dialing, mailed paper surveys, and face-
to-face interviews (Cobanoglu, & Cobanoglu, 203. 2003; Deutskens, De Ruyter, Wetzels, &
Oosterveld, 2004; Heerwegh, 2006). For example, in a study of motives for participating in a
survey panel participation, Keusch, Batinic, & Mayerhofer found that “reward seekers. . . .
participated in web surveys primarily because of the incentives they received” (2014, p 175).
They found that reward seekers were more likely to respond to the survey than respondents not
motivated by the incentive. In 2013, Sarraf and Cole reported that cash, gift cards and technology
prizes were all associated with increased response rates. In addition, these researchers found that
increased financial investment by the institution also resulted in higher responses rates.
Page 4
4
Leverage-Salience Theory
As noted by Groves, Singer, and Corning (2000), there have been “scores” of studies
investigating influences of survey cooperation in a variety of fields. However, many of these
studies provided idiosyncratic results with interventions for one study proving effective, but the
same intervention in another study proving ineffective. So many inconsistent results led Groves,
Singer, and Corning (2000) to claim that “such a status is common in science when the
hypotheses may be true, but only for a limited set of circumstances” (p. 299). To counter the
prevalence of the abundance of atheoretical research in the area, they proposed the Leverage-
Salience Theory.
Leverage-Salience Theory (LST) is a decision-making theory that considers the
“subjective weight” of various factors to participate or not participate in relation to the salience
of the survey invitation to the individual (Groves, Singer, & Corning, 2000). The salience of the
survey topic and attributes of the survey request contribute to the individual’s decision to
respond and to the bias introduced by nonresponse. Thus, LST predicts that individuals
interested in the survey topic will be more likely to respond. For example, those that are more
involved in the community (volunteerism, politics, community groups, etc.) are significantly
more likely to complete a survey about their community (Groves, Singer, & Corning, 2000).
Leverage-Salience Theory (LST) is also particularly relevant for studies investigating the use of
survey incentives where the survey incentives are the “leverage.” The leverage varies depending
on the size of the incentive. A $5 pre-paid gift card provides some leverage, but a $20 pre-paid
gift card provides even stronger leverage. LST is an attempt to move beyond the atheoretical
research that is common in nonresponse studies and that have resulted in idiosyncratic, non-
generalizable results.
Page 5
5
Social Exchange Theory
Social Exchange Theory (SET) is another theory that explains why respondents choose to
participate in a survey (Dillman, 1978). The theory claims there are three important factors
individuals consider when presented with an opportunity to complete a survey. One factor is the
perceived reward of the individual. In other words, what does the respondent expect to gain by
participating in the survey? An individual also considers the “cost” of participation. How much
does it “cost” to obtain the reward. Costs can include time, effort, providing personal
information, or other things. The third factor is whether or not the individual “trusts” the reward
will outweigh the costs. If the costs are too great or the potential respondent does not believe he
or she will receive the reward, then their participation in the survey is not likely.
Both theories help explain the potential effectiveness of survey incentives and related
survey promotions. The leverage of LST and the reward of SET both help to understand the
impact of incentive types and value. The salience of LST explains why promotional efforts can
arouse interest in a survey. The cost of SET helps us to understand the effort and time
commitment that respondents perceive. The attributes (SET) of the promotional material and
survey help to explain the importance of survey design and effective promotion. Finally, the trust
from SET helps survey designers to consider the total value a respondent feels they are gaining
from their participation.
Both of these theories help to explain why incentives are effective at increasing response
rates. However, this increase in response rates may come at a cost. Some researchers have
expressed concern regarding the potential deleterious effects incentives may have on survey data
quality via the process of satisficing (Barge & Gehlbach, 2012).
Page 6
6
Satisficing
Schaeffer and Presser (2003) describe satisficing as the process of “conserving time and
energy and yet producing an answer that seems good enough for the purposes at hand” (p. 68).
Krosnick, Narayan, and Smith (1996) identify three regulators of satisficing: task difficulty,
performance ability, and motivation. Task difficulty has to do with how familiar the language is
to the respondent. Performance ability generally refers to the cognitive task required to recall the
information needed to provide an accurate or best-estimate answer. Motivation is how willing the
respondent is to provide an accurate or best-estimate answer. Depending on the weight of these
factors, some individuals use satisficing as a response strategy (Blair & Burton, 1987).
Indications of satisficing includes the clumping of numerical estimates around common
multiples, such as 5 or 10, straight-lining sets of items, item skipping, speeding through the
survey, early break-off, and other respondent behaviors (Huttenlocher, Hedges, & Bradburn,
1990; Kaminska, Goeminne, & Swyngedouw, 2006; Krosnick, Narayan, & Smith, 1996)
It is important to note that the mere presence of straight-lining on a given set of survey
items does not in itself signify either a data quality problem or an instance of satisficing. That is,
a respondent may have thoughtfully considered and responded to each item, but the result is a set
of identical responses. Without additional information, it is difficult to distinguish this form of
straight-lining from that of a satisficing respondent who strategically elects identical answers in
order to complete the survey more quickly.
Incentives and satisficing
As described above, research has demonstrated the efficacy of using incentives to
increase survey response. The concern though, is that with increased reliance on incentives, there
Page 7
7
will be increased satisficing behaviors and thus lower data quality. In a review of several studies,
Toepoel (2012) found no evidence that survey incentives effects data quality. In fact, Toepoel
concludes that, “there seems to be no relationship between incentives and data quality” (p. 216).
However, very few studies focused on the deleterious effect incentives may have on survey data
quality in higher education assessment and evaluation. A recent study by Barge and Gehlbach
(2012) did focus on higher education research and reported results contrary to the results
reported by Toepeol (2012). Barge & Gehlbach (2012) reported that respondents receiving a $15
incentive were much more likely to satisfice as indicated by increased item skipping, rushing
(shorter duration), and straight-lining compared to those that received no incentive. The authors
also reported that this increase in satisficing was also associated with a decrease in data quality
and, more specifically, scale reliability. The authors stated, “If it turns out that incentives can
degrade item-level data quality under certain situations, many institutions may need to rethink
their data collection plans (Barge & Gehlbach 2012, p 197). However, this study did not parse
out the effects due to incentives. Thus, the direct impact of incentives on scale properties and
parameter estimates is still not well understood. Though the research on surveys incentives and
measurement error is sparse, there is some indication that survey incentives do not contribute to
measurement invariance or increased measurement error (Medway & Fulton, 2012).
As prior research has shown, incentives can be effective at increasing survey response rates.
Though most research has shown that there is little evidence that incentives undermine data
quality, one of the few studies in the higher education research field did report deleterious
effects. This study investigates the use of incentives in higher education research and effects on
data quality.
Page 8
8
Specifically, this set out to investigate the following research questions:
1. Are survey respondents at incentive institutions more likely to use the same response
option for a set of questions (straight-lining), skip individual questions, have shorter
duration times (rushing), and leave the survey incomplete?
2. Is incentive usage by institutions associated with changes in NSSE scale scores (aka,
Engagement Indicators) and factor structure?
Method
Data Source
Data for this study comes from 152,818 first-year students and 203,071 seniors that
completed the 2014 National Survey of Student Engagement (NSSE). These students represented
622 US higher education institutions. Using information collected from institutions, it was
determined that 316 (51%) offered an incentive to complete NSSE, while 306 (49%) did not.
Private or Special Focus institutions were slightly more likely to offer incentives, whereas
differences for other institution types were small (Table 1). The most common type of incentive
institutions offered was a lottery (95%), followed by offering a guaranteed prize (2%), an
incentive to the first ‘x’ number of respondents (2%), and donations to causes or other intangible
incentives (1%).
As is typical for higher education surveys, females responded more often than males
(Table 2). Females appear to be slightly over-represented at incentive institutions compared to
their peers at non-incentive institutions. Likewise, White respondents were slightly over-
represented at incentive institutions, whereas Black respondents were more likely at institutions
Page 9
9
not offering an incentive. These gender and race/ethnicity differences provide a rationale for
using these characteristics as statistical controls for analyses.
Table 1. Institutional Characteristics.
Incentive
No
Incentive
Yes
Incentive Count
Control
Public 52% 48% 263
Private 47% 53% 359
Carnegie Level
Baccalaureate 50% 50% 217
Masters 49% 51% 280
Doctoral 50% 50% 96
Special Focus/Other 38% 62% 29
Total Count 622
Table 2. Respondent Characteristics.
FY students
SR student
No
Incentive
Yes
Incentive
No
Incentive
Yes
Incentive
Sex
Female 63% 66%
62% 65%
Male 37% 34%
38% 35%
Race/Ethnicity
Am Indian <1% <1%
<1% <1%
Asian 5% 5%
4% 5%
Black or Afr Am 12% 9%
11% 8%
Hispanic/Latino 13% 11%
11% 9%
Native HI or PI <1% <1%
<1% <1%
White 58% 61%
63% 66%
Other <1% <1%
<1% <1%
Foreign 4% 4%
3% 3%
Two or more races 3% 4%
2% 3%
Unknown 5% 5% 5% 5%
Page 10
10
Variables
Straight-lining is defined as selecting the same response option for a set of items using
the same scale. There were potentially six, five and three sets of items to be straight-lined on the
first three survey screens for a total of 14 items sets.
Skipped items are defined as items presented on a survey screen where the respondent did
not provide a response. Missing items are those items on survey screens that were never
presented to the respondent, typically because the respondent broke off prior to reaching that
screen. Total missing data is the sum of skipped and missed items.
A completed survey is defined as those respondents that completed 95% or more of the
total number of items on the survey (total missing data <5%). For this study, we used 103 items
for this calculation. We excluded some items from this total if they were conditioned on a
previous response or not included in the core survey for all students. The minimum number of
items needed to be considered a complete survey is 98.
Survey duration is defined as the length of time in minutes it took the respondent to
complete the core survey. Given the extreme upper ranges of duration (presumably due to the
respondent leaving their browser open on the final screen), 2.5% of the top duration times were
excluded resulting in a maximum duration time of 70 minutes.
NSSE Engagement Indicators represent the multi-dimensional nature of student
engagement. Each Engagement Indicator provides valuable information about a distinct aspect of
student engagement by summarizing students' responses to a set of related survey questions. In
all, there are ten Engagement Indicators that encompass 47 items. Detailed information about
each Engagement Indicator can be found here: nsse.indiana.edu/html/engagement_indicators.cfm
Page 11
11
Analysis
We calculated adjusted means for total number of straight-lined item sets, total items
missing, and duration for incentive and non-incentive groups using ANOVA. The means were
adjusted by including student level factors gender and race/ethnicity and institutional factors
Carnegie level reclassified as baccalaureate, masters, doctoral, or special focus, and control
(public or private).
A columns proportion z-test with a Bonferroni adjustment determined significant
differences between groups for those that submitted each screen with no skipped items. A chi-
square test was used to determine differences between the two groups and the proportion that
completed the survey.
Factor invariance analyses assessed the stability of scale structures across groups.
Specifically, we used a multi-group confirmatory factor analysis (MGCFA) for each NSSE scale
(aka, Engagement Indicators or EIs) to test measurement invariance across the two groups by
class level. Confirming measurement invariance ensures that “psychometric test scores can be
attributed to differences in the properties that such tests measure” and that a score relates “to the
same set of observations in the same way in each group” (Borsboom, 2006). The ten EIs
analyzed included: Higher-Order Learning (HO); Reflective & Integrative Learning (RI);
Quantitative Reasoning (QR); Learning Strategies (LS); Collaborative Learning (CL);
Discussions with Diverse Others (DD); Student-Faculty Interaction (SF); Effective Teaching
Practices (ET); Quality of Interactions (QI); and Supportive Environment (SE).
The MG-CFA for each EI followed several steps. First, a CFA was run separately for
each group until the same model fit all groups well. If no model fit groups, measurement
invariance was rejected and we pursued no additional testing. Second, assuming a model fit
Page 12
12
groups well, we then ran tests for configural, metric, and scalar invariance sequentially. Once a
lower level of invariance was tested and rejected, we did not proceed with running tests for
higher levels of invariance. Scalar invariance signifies the highest level of invariance, while
configural is the lowest. Criteria used for determining acceptable model fit was RMSEA <.06,
Chi-square p-value >.05, and CFI/TLI >.90. An even higher level of scalar invariance could be
achieved when the Chi-square difference test p-values were greater than .05 and ΔCFI was less
than .01.
To determine any effect incentives may have had on Engagement Indicator scores, we
calculated adjusted means for the incentive and non-incentive groups using MANOVA. The
means were adjusted by including student level factors gender and race/ethnicity and institutional
factors Carnegie level (reclassified as baccalaureate, masters, doctoral, or special focus) and
control (public or private).
Results
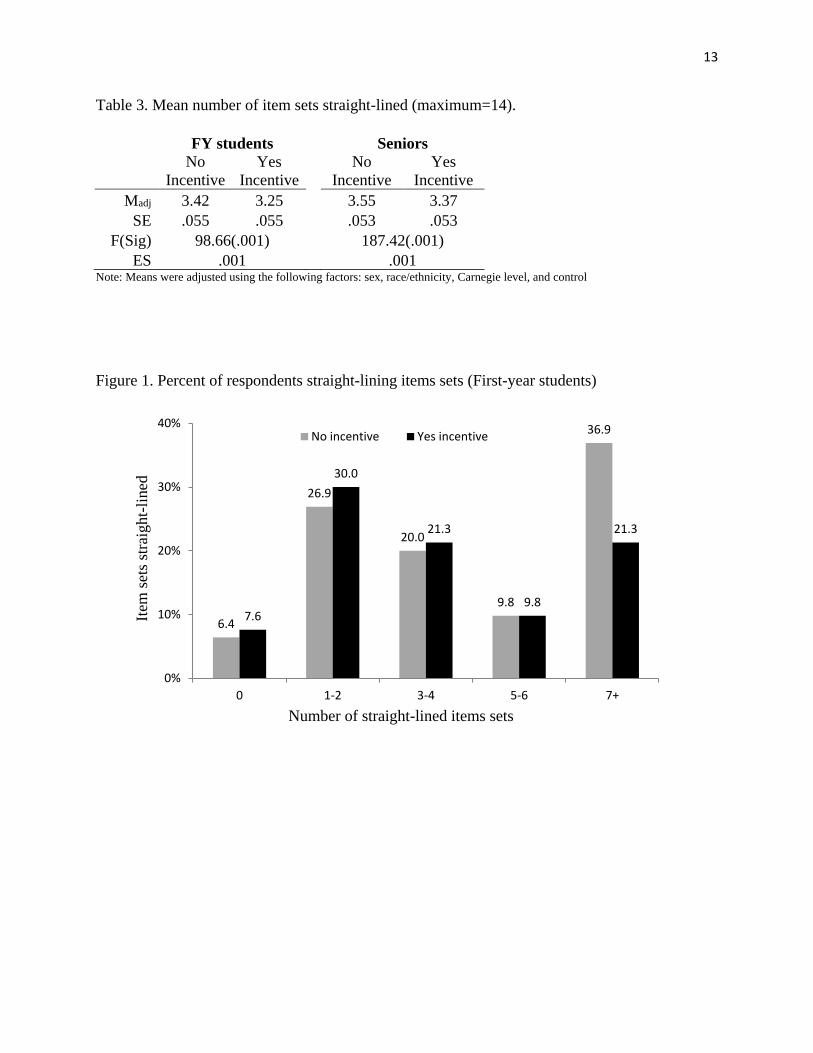
Out of the 14 item sets that were eligible for straight-lining, first-year and senior students,
regardless of incentive group, straight-lined just over 3 item sets. The presence of incentives did
not result in significantly higher occurrences of straight-lining (Table 3). In fact, for both first
year and senior students, those in the incentive group straight-lined significantly less than their
peers in the non-incentive group. It is important to note that even though both differences are
statistically significant, the effect size is near zero, indicating no meaningful effect.
Unsurprisingly, the percentage of students straight-lining more than half of the item sets (7+
category) was significantly higher for the no incentive group for both first year and senior
students (Figures 1 and 2).
Page 13
13
Table 3. Mean number of item sets straight-lined (maximum=14).
FY students
Seniors
No
Incentive
Yes
Incentive
No
Incentive
Yes
Incentive
Madj 3.42 3.25
3.55 3.37
SE .055 .055
.053 .053
F(Sig) 98.66(.001)
187.42(.001)
ES .001
.001 Note: Means were adjusted using the following factors: sex, race/ethnicity, Carnegie level, and control
Figure 1. Percent of respondents straight-lining items sets (First-year students)
6.4
26.9
20.0
9.8
36.9
7.6
30.0
21.3
9.8
21.3
0%
10%
20%
30%
40%
0 1-2 3-4 5-6 7+
No incentive Yes incentive
Number of straight-lined items sets
Item
set
s st
raig
ht-
lined
Page 14
14
Figure 2. Percent of respondents straight-lining items sets (Senior students)
For both first year and senior students, each screen submitted by respondents in the
incentives group was significantly more likely to have no skipped items (p<.05) (Figures 3 and
4). For example, first-year students offered an incentive were significantly more likely to submit
Screen 4 with no skipped items compared to their peers at institutions that did not offer an
incentive (73.6% vs 68.4%, p<.05).
5.6
26.8
23.6
12.0
32.0
6.5
29.9
24.9
12.2
26.5
0%
10%
20%
30%
40%
0 1-2 3-4 5-6 7+
No incentive Yes incentive
Number of straight-lined items sets
Item
set
s st
raig
ht-
lined
Page 15
15
Figure 3. Screen submits (first-year students)
Figure 4. Screen submits (senior students)
74.3
76.4
64.9
69.0
62.1
66.5
68.4
73.6
25
.3
23
.2
17
.7 17
.6
13
.6 14
.2
5.75.6
16
.9
13
.1
23
.5
18
.9
25
.4
20
.5
0%
10%
20%
30%
40%
50%
60%
70%
80%
90%
100%
NoIncentive
YesIncentive
NoIncentive
YesIncentive
NoIncentive
YesIncentive
NoIncentive
YesIncentive
Screen 1 Screen 2 Screen 3 Screen 4
Did not submit screen Submit w/all skipped Submit w/skip Submit w/no skip
76.4
78.4
68.1
71.9
66.7
70.6
73.2
77.8
23
.4
21
.3
18
.1 17
.7
14
.1 14
.4
6.06.0
13.2 10.118.6 14.6 20.3 16.0
0%
10%
20%
30%
40%
50%
60%
70%
80%
90%
100%
No Inc Yes Inc No Inc Yes Inc No Inc Yes Inc No Inc Yes Inc
Screen 1 Screen 2 Screen 3 Screen 4
Did not submit screen Submit w/all skipped Submit w/skip Submit w/no skip
Page 16
16
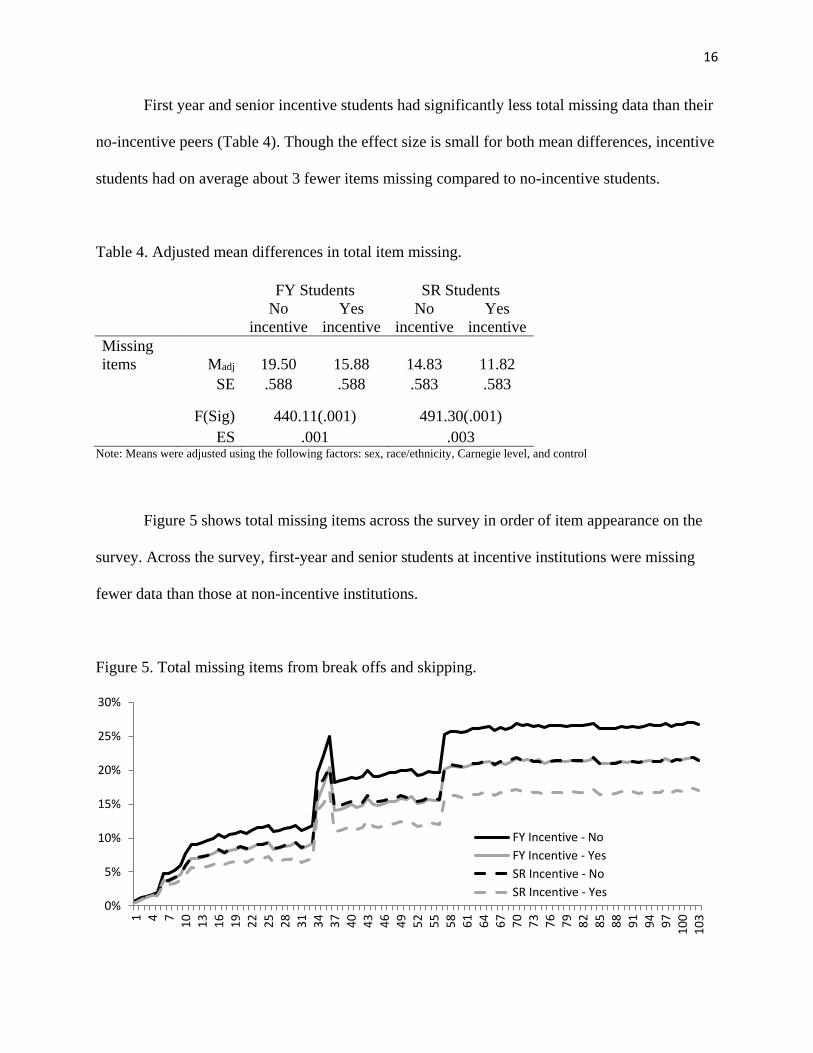
First year and senior incentive students had significantly less total missing data than their
no-incentive peers (Table 4). Though the effect size is small for both mean differences, incentive
students had on average about 3 fewer items missing compared to no-incentive students.
Table 4. Adjusted mean differences in total item missing.
FY Students SR Students
No
incentive
Yes
incentive
No
incentive
Yes
incentive
Missing
items Madj 19.50 15.88 14.83 11.82
SE .588 .588 .583 .583
F(Sig) 440.11(.001) 491.30(.001)
ES .001 .003 Note: Means were adjusted using the following factors: sex, race/ethnicity, Carnegie level, and control
Figure 5 shows total missing items across the survey in order of item appearance on the
survey. Across the survey, first-year and senior students at incentive institutions were missing
fewer data than those at non-incentive institutions.
Figure 5. Total missing items from break offs and skipping.
0%
5%
10%
15%
20%
25%
30%
1 4 71
01
31
61
92
22
52
83
13
43
74
04
34
64
95
25
55
86
16
46
77
07
37
67
98
28
58
89
19
49
71
00
10
3
FY Incentive - No
FY Incentive - Yes
SR Incentive - No
SR Incentive - Yes
Page 17
17
Not surprising given the results above, incentive students were more likely to complete at
least 95% of survey items (Figure 6). More than three-quarters (76%) of first year students and
almost 81% of seniors at incentive institutions completed the survey, about 5% higher than their
respective peers.
Figures 6. Percent completing NSSE.
Durations times for incentive students were significantly higher than for non-incentive
students. However, effect sizes were near zero indicating no meaningful difference for duration.
It is not surprising that duration time is slightly higher for students in the incentive group given
that, on average, they completed more items.
Table 5. Adjusted mean duration
FY Students SR Students
No
incentive
Yes
incentive
No
incentive
Yes
incentive
Duration Madj 13.02 13.13 13.12 13.32
SE .175 .175 .192 .190
F(Sig) 4.41 (.040) 18.79(.000)
ES .000 .000 Note: Means were adjusted using the following factors: sex, race/ethnicity, Carnegie level, and control
70.5 76.0 75.9 80.8
0%
20%
40%
60%
80%
100%
No Incentive Yes Incentive No Incentive Yes Incentive
FY students SR student
Did not complete
Completed
Page 18
18
Of particular import for this study was determining whether the NSSE Engagement
Indicators are invariant across the two groups (incentive and non-incentive). A multi-group
confirmatory factor analysis (MGCFA) was used to calculate fit indices and measurement
invariance. As indicated in Tables 3 and 4, the fit indices for 5 of the 10 engagement indicators
(other 5 are 3-item scales and thus not available for CFA), were generally all acceptable with the
one possible exception of QI for first year students. For that scale, CFI and TLA indices are
adequate, however the RMSEA and chi-square are not. Measurement invariance (scalar
invariance) was achieved for all EI’s with the exception of QI for first year students (Table 5).
Table 3. CFA results for FY students.
EI's CFI TLI RMSEA Chi-Square
p-value
(Chi-
Square) df
HO -- -- -- -- -- --
RI 0.999 0.996 0.039 48.624 .000 6
LS -- -- -- -- -- --
QR -- -- -- -- -- --
CL -- -- -- -- -- --
DD -- -- -- -- -- --
SF 1.000 1.000 0.009 1.336 .248 1
ET 1.000 1.000 0.013 5.398 .145 3
QI 0.988 0.970 0.076 100.629 .000 4
SE 0.996 0.993 0.053 180.197 .000 15
Cut-off criteria for acceptable fit: TLI/CFI > .90; RMSEA < .06; Chi-square p-value >.05
Page 19
19
Table 4. CFA results for senior students.
EI's CFI TLI RMSEA Chi-Square
p-value
(Chi-
Square) df
HO -- -- -- -- -- --
RI 0.999 0.997 0.034 32.143 .000 5
LS -- -- -- -- -- --
QR -- -- -- -- -- --
CL -- -- -- -- -- --
DD -- -- -- -- -- --
SF 1.000 0.999 0.026 4.097 .043 1
ET 1.000 0.999 0.031 10.938 .031 2
QI 0.997 0.989 0.039 22.628 .000 3
SE 0.997 0.993 0.054 170.714 .000 13
Cut-off criteria for acceptable fit: TLI/CFI > .90; RMSEA < .06; Chi-square p-value >.05
Table 5. Measurement invariance (scalar) results.
Invariance achieved?
EI's
First year
students
Senior
students
HO Yes Yes
RI Yes Yes
LS Yes Yes
QR Yes Yes
CL Yes Yes
DD Yes Yes
SF Yes Yes
ET Yes Yes
QI No Yes
SE Yes Yes
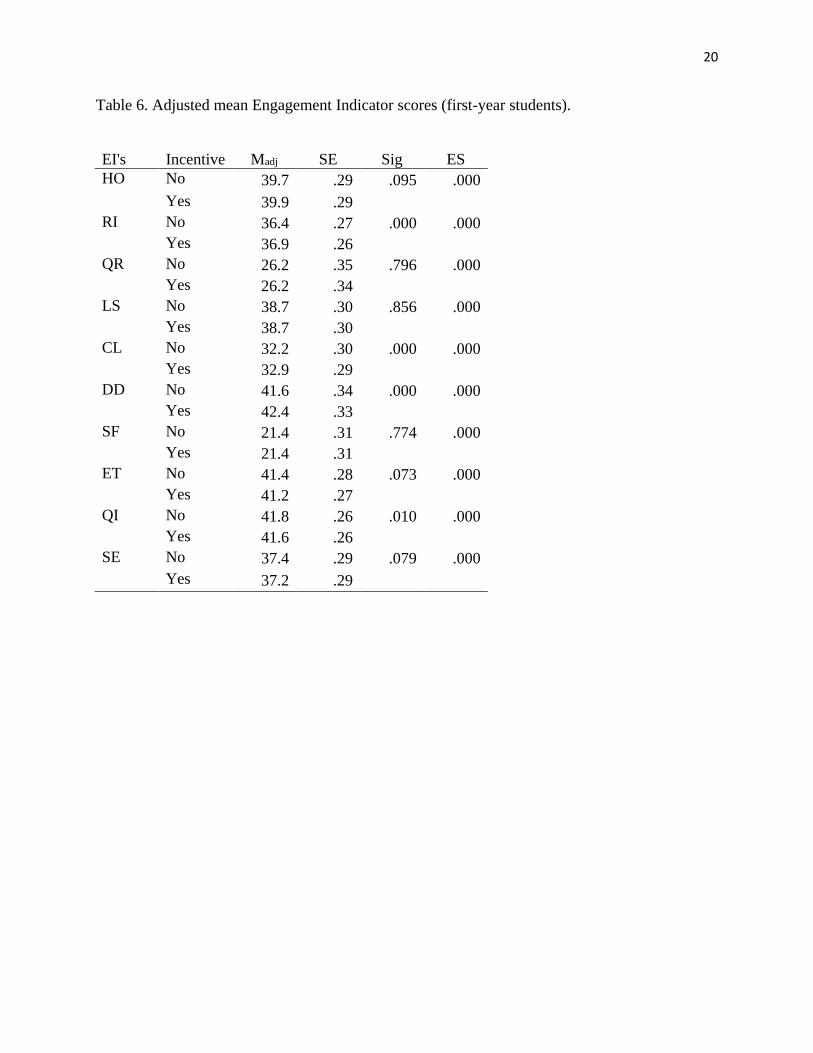
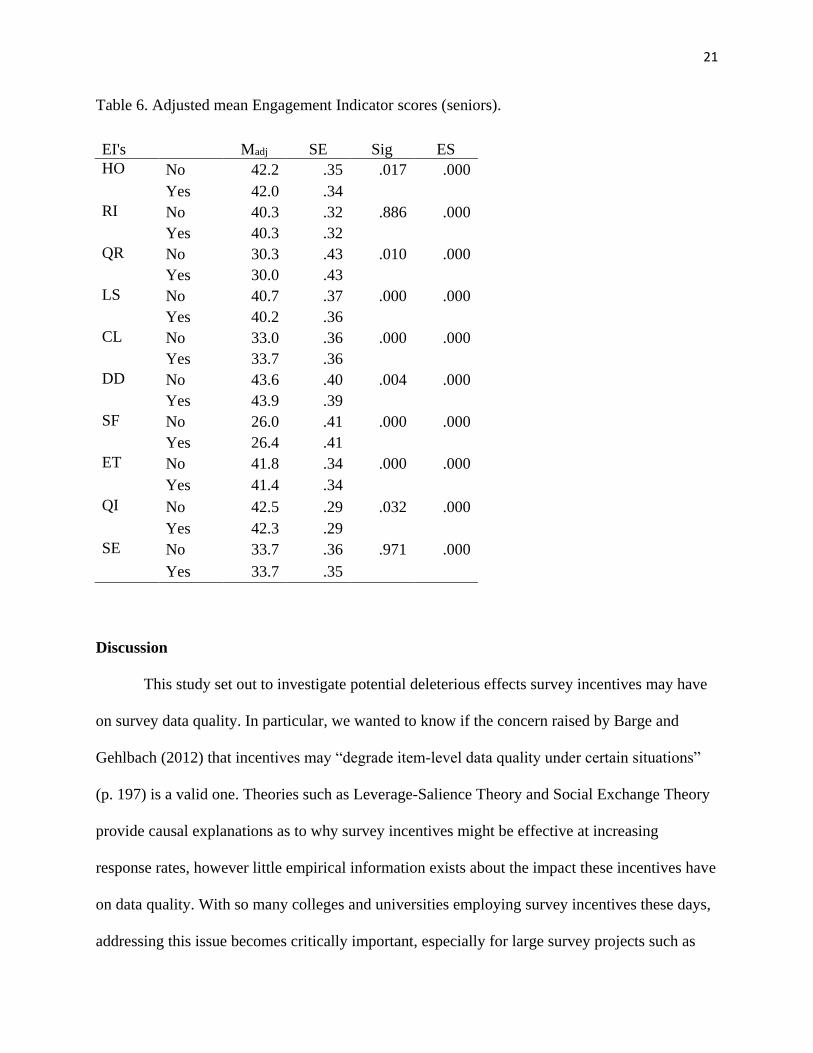
MANOVA results indicate very minimal differences in scale scores by incentive group
for both first year and senior students (Table 6 and 7). Though adjusted mean differences were
sometimes significant, the effect sizes (partial eta squared) were near zero indicating that even
the largest mean difference (first year DD scores of 41.6 compared to 42.4) were trivial.
Page 20
20
Table 6. Adjusted mean Engagement Indicator scores (first-year students).
EI's Incentive Madj SE Sig ES
HO No 39.7 .29 .095 .000
Yes 39.9 .29
RI No 36.4 .27 .000 .000
Yes 36.9 .26
QR No 26.2 .35 .796 .000
Yes 26.2 .34
LS No 38.7 .30 .856 .000
Yes 38.7 .30
CL No 32.2 .30 .000 .000
Yes 32.9 .29
DD No 41.6 .34 .000 .000
Yes 42.4 .33
SF No 21.4 .31 .774 .000
Yes 21.4 .31
ET No 41.4 .28 .073 .000
Yes 41.2 .27
QI No 41.8 .26 .010 .000
Yes 41.6 .26
SE No 37.4 .29 .079 .000
Yes 37.2 .29
Page 21
21
Table 6. Adjusted mean Engagement Indicator scores (seniors).
EI's
Madj SE Sig ES
HO No 42.2 .35 .017 .000
Yes 42.0 .34
RI No 40.3 .32 .886 .000
Yes 40.3 .32
QR No 30.3 .43 .010 .000
Yes 30.0 .43
LS No 40.7 .37 .000 .000
Yes 40.2 .36
CL No 33.0 .36 .000 .000
Yes 33.7 .36
DD No 43.6 .40 .004 .000
Yes 43.9 .39
SF No 26.0 .41 .000 .000
Yes 26.4 .41
ET No 41.8 .34 .000 .000
Yes 41.4 .34
QI No 42.5 .29 .032 .000
Yes 42.3 .29
SE No 33.7 .36 .971 .000
Yes 33.7 .35
Discussion
This study set out to investigate potential deleterious effects survey incentives may have
on survey data quality. In particular, we wanted to know if the concern raised by Barge and
Gehlbach (2012) that incentives may “degrade item-level data quality under certain situations”
(p. 197) is a valid one. Theories such as Leverage-Salience Theory and Social Exchange Theory
provide causal explanations as to why survey incentives might be effective at increasing
response rates, however little empirical information exists about the impact these incentives have
on data quality. With so many colleges and universities employing survey incentives these days,
addressing this issue becomes critically important, especially for large survey projects such as
Page 22
22
NSSE that encourage its participating institutions to use them (NSSE, 2015). Though response
rates are generally recognized as the data quality indicator, it may be imprudent to use incentives
for bolstering response at the expense of other data quality indicators. At the very least, incentive
users should be fully aware of any potential tradeoffs, if they do exist.
Overall, this study, using hundreds of thousands of student respondents from over 600
colleges and universities, found little evidence that survey incentives negatively affect data
quality. Our analyses showed minimal differences between incentive and non-incentive groups
with regard to straight-lining, item skipping, total missing items, and completion. Contradicting
Barge and Gehlbach’s finding, we found, in fact, that incentive respondents actually had better
data quality than non-incentive respondents. Though the effects were small, they consistently
favored the incentive student group. Not surprisingly, incentive students were significantly more
likely to complete the survey and take slightly more time doing so. The measurement invariance
analysis demonstrated that the presence of an incentive does not compromise the validity of
Engagement Indicator scores and the underlying factor structures. The one exception was QI for
first-year students where we detected variance between the two groups. However, for the 19
other Engagement Indicator comparisons (9 for first year students and 10 for seniors), all scales
proved invariant. In addition, we found all mean differences for Engagement Indicators between
groups to be trivial. These findings are especially good news for institutions tracking engagement
results overtime where they may use incentives inconsistently from one administration to the
next.
This study is not without its limitations. For example, incentive institutions and their
students may be different from others in ways that could influence the current results. Institutions
using incentives may be doing other things to increase participation (using promotional posters,
Page 23
23
coordinating recruitment efforts across campus, etc.) which could affect satisficing behavior.
These institutions may also be more committed to assessment and convince students in their
recruitment messages that they will use the information they provide, which then in turn leads
students to commit themselves more fully to the survey taking process. Though not explored in
this study, we also know that considerable variation exists between institutions’ average total
missing items, regardless of incentive usage. It would be prudent to investigate why some
institutions show more (sometimes much more) satisficing behaviors than others. For the
institutions that use incentives, could these differences be explained by the types of incentives
being offered? Different incentives appear to influence response rates in different ways (Sarraf &
Cole, 2014). Given LST and SET theories, we hypothesize that incentive type could also
influence satisficing behaviors in different ways as well. For this reason, we encourage others to
conduct experiments whereby students are randomly assigned to groups with and without
incentives, leaving all other administration aspects identical.
For now, the current study’s findings with such a robust sample should allay any serious
concerns NSSE users may have about incentives undermining data quality. Whether this finding
and others are generalizable to other higher education assessment instruments is unknown at this
time. These results suggest that the current literature generally indicating no effects when using
incentives may not apply to all surveys.
Page 24
24
References
Barge, S., & Gehlbach, H. (2012). Using the theory of satisficing to evaluate the quality of
survey data. Research in Higher Education, 53, 182-200.
Blair, E. and Burton, S. (1987), Cognitive processes used by survey respondents to answer
behavioral frequency questions, Journal of Consumer Research, 14, 280-288.
Cobanoglu, C., & Cobanoglu, N. (2003). The effect of incentives in web surveys: Application
and ethical considerations. International Journal of Market Research, 45, 475-488.
Deutskens, E., Ruyter, K. D., Wetzels, M., & Oosterveld, P. (2004). Response rate and response
quality of internet-based surveys: An experimental study. Marketing Letters, 15, 21-36.
Dey, E. (1997). Working with low survey response rates: The efficacy of weighting adjustments.
Research in Higher Education, 38, 215-227.
Dillman, D.A. (1978). Mail and telephone surveys: The total design method. New York: Wiley.
Fosnacht, K., Sarraf, S., Howe, E., & Peck, L. (2013). How important are high response rates for
college surveys? Paper presented at the Association for Institutional Research Annual
Forum, Long Beach, CA.
Groves, R. M., Singer, E., & Corning, A. (2000). Leverage-salience theory of survey
participation: Description and an illustration. Public Opinion Quarterly, 64, 299–308.
Heerwegh, D. (2006). An investigation of the effects of lotteries on web survey response rates.
Field Methods, 18, 205-220.
Hutchison, J., Tollefson, N., and Wigington, H. (1987). Response bias in college freshman’s
responses to mail surveys. Research in Higher Education, 26, 99–106.
Page 25
25
Kaminska, Olena, Bart Goeminne and Marc Swyngedouw. Satisficing in Early Versus Late
Responses to a Mail Survey. Midwest Association for Public Opinion Research
(MAPOR). Chicago, Illinois, November, 2006.
Keusch, F., Batinic, B. and Mayerhofer, W. (2014) Motives for joining nonprobability online
panels and their association with survey participation behavior, in Online Panel
Research: A Data Quality Perspective (eds M. Callegaro, R. Baker, J. Bethlehem, A. S.
Göritz, J. A. Krosnick and P. J. Lavrakas), John Wiley & Sons, Ltd, Chichester, UK.
Krosnick, J.A., Narayan, S. and Smith, W.R. (1996). Satisficing in surveys: initial evidence. New
Directions for Evaluation, Vol 70, Issue 70, 29-44.
Laguilles, J. S., Williams, E. A., & Saunders, D. B. (2011). Can lottery incentives boost web
survey response rates? Findings from four experiments. Research in Higher Education,
52, 537-553.
Medway, R. L., & Fulton, J. (2012). When More Gets You Less: A Meta-Analysis of the Effect
of Concurrent Web Options on Mail Survey Response Rates. Public Opinion Quarterly,
76, 733-746.
NSSE—National Survey of Student Engagement. (2015, May). Survey Incentive FAQ.
Retrieved from http://nsse.indiana.edu/html/survey_incentive_FAQ.cfm
Pike, G. (2008). Using weighting adjustments to compensate for survey nonresponse. Research
in Higher Education, 49, 153-171.
Sarraf, S, & Cole, J. S. (2014). Survey lottery incentives and institutional response rates: An
exploratory analysis. Paper presented at the annual conference of the Association for
Institutional Research, Orlando, FL.
Page 26
26
Schaeffer, N.C. and Presser, S. (2003). The science of asking questions. Annual Review of
Sociology, 29, 65-88.
Singer, E., & Ye, C. (2013). The use and effects of incentives in surveys. In D. S. Massey, & R.
Tourangeau (Eds.), The ANNALS of the American Academy of Political and Social
Science (pp. 112–141). London, England: Sage.
Toepoel, V. (2012). Effects of incentives in surveys. In L. Gideon (Ed.), Handbook of survey
methodology for the social sciences (pp. 209–223). New York, NY: Springer.