Special Issue Article Journal of Intelligent Material Systems and Structures 1–12 Ó The Author(s) 2018 Reprints and permissions: sagepub.co.uk/journalsPermissions.nav DOI: 10.1177/1045389X18758180 journals.sagepub.com/home/jim Core–skin debonding detection in honeycomb sandwich structures through guided wave wavefield analysis Lingyu Yu 1 , Zhenhua Tian 1 , Xiaopeng Li 2 , Rui Zhu 2 and Guoliang Huang 2 Abstract Ultrasonic guided waves have proven to be an effective and efficient method for damage detection and quantification in various plate-like structures. In honeycomb sandwich structures, wave propagation and interaction with typical defects such as hidden debonding damage are complicated; hence, the detection of defects using guided waves remains a challen- ging problem. The work presented in this article investigates the interaction of low-frequency guided waves with core– skin debonding damage in aluminum core honeycomb sandwich structures using finite element simulations. Due to debonding damage, the waves propagating in the debonded skin panel change to fundamental antisymmetric Lamb waves with different wavenumber values. Exploiting this mechanism, experimental inspection using a non-contact laser Doppler vibrometer was performed to acquire wavefield data from pristine and debonded structures. The data were then pro- cessed and analyzed with two wavefield data–based imaging approaches, the filter reconstruction imaging and the spatial wavenumber imaging. Both approaches can clearly indicate the presence, location, and size of the debonding in the struc- tures, thus proving to be effective methods for debonding detection and quantification for honeycomb sandwich structures. Keywords Honeycomb sandwich, debonding detection, guided waves, wavenumber analysis Introduction Honeycomb sandwich structures have been increasingly used in aerospace, marine, and automotive applications since they have attractive features such as high strength/stiffness-to-weight ratio, acoustic insulation, noise control, and vibration damping (Bitzer, 1997; Fatemi and Lemmen, 2009; Vinson, 1999). However, honeycomb sandwich structures are susceptible to debonding damage along the core–skin interface, espe- cially under intense dynamic or repetitive loading on the honeycomb core, due to weak shear strength of the bonding interface (Song et al., 2012). The debonding damage that occurs internally between the outer skin plate and the honeycomb core is not visible to the naked eye. However, the detection and quantification of such hidden damage are crucial, as the damage sig- nificantly impacts the integrity of the structure. Ultrasonic guided waves have proven to be an effec- tive and efficient method for damage detection and quantification due to their ability to propagate over long distances with less energy loss compared to bulk waves and their sensitivity to small structural defects (Giurgiutiu, 2008; Rose, 1999; Staszewski et al., 2004). They have been used extensively to detect defects such as cracks in metallic structures and delamination dam- age in laminated composites (Flynn et al., 2013; Hall 1 Department of Mechanical Engineering, University of South Carolina, Columbia, SC, USA 2 Department of Mechanical & Aerospace Engineering, University of Missouri, Columbia, MO, USA Corresponding author: Lingyu Yu, Department of Mechanical Engineering, University of South Carolina, Columbia, SC 29208, USA. Email: [email protected]Guoliang Huang, Department of Mechanical & Aerospace Engineering, University of Missouri, Columbia, MO 65211, USA. Email: [email protected]
Transcript
Special Issue Article
Journal of Intelligent Material Systemsand Structures1–12� The Author(s) 2018Reprints and permissions:sagepub.co.uk/journalsPermissions.navDOI: 10.1177/1045389X18758180journals.sagepub.com/home/jim
AbstractUltrasonic guided waves have proven to be an effective and efficient method for damage detection and quantification invarious plate-like structures. In honeycomb sandwich structures, wave propagation and interaction with typical defectssuch as hidden debonding damage are complicated; hence, the detection of defects using guided waves remains a challen-ging problem. The work presented in this article investigates the interaction of low-frequency guided waves with core–skin debonding damage in aluminum core honeycomb sandwich structures using finite element simulations. Due todebonding damage, the waves propagating in the debonded skin panel change to fundamental antisymmetric Lamb waveswith different wavenumber values. Exploiting this mechanism, experimental inspection using a non-contact laser Dopplervibrometer was performed to acquire wavefield data from pristine and debonded structures. The data were then pro-cessed and analyzed with two wavefield data–based imaging approaches, the filter reconstruction imaging and the spatialwavenumber imaging. Both approaches can clearly indicate the presence, location, and size of the debonding in the struc-tures, thus proving to be effective methods for debonding detection and quantification for honeycomb sandwichstructures.
Honeycomb sandwich structures have been increasinglyused in aerospace, marine, and automotive applicationssince they have attractive features such as highstrength/stiffness-to-weight ratio, acoustic insulation,noise control, and vibration damping (Bitzer, 1997;Fatemi and Lemmen, 2009; Vinson, 1999). However,honeycomb sandwich structures are susceptible todebonding damage along the core–skin interface, espe-cially under intense dynamic or repetitive loading onthe honeycomb core, due to weak shear strength of thebonding interface (Song et al., 2012). The debondingdamage that occurs internally between the outer skinplate and the honeycomb core is not visible to thenaked eye. However, the detection and quantificationof such hidden damage are crucial, as the damage sig-nificantly impacts the integrity of the structure.
Ultrasonic guided waves have proven to be an effec-tive and efficient method for damage detection and
quantification due to their ability to propagate overlong distances with less energy loss compared to bulkwaves and their sensitivity to small structural defects(Giurgiutiu, 2008; Rose, 1999; Staszewski et al., 2004).They have been used extensively to detect defects suchas cracks in metallic structures and delamination dam-age in laminated composites (Flynn et al., 2013; Hall
1Department of Mechanical Engineering, University of South Carolina,
Columbia, SC, USA2Department of Mechanical & Aerospace Engineering, University of
Missouri, Columbia, MO, USA
Corresponding author:
Lingyu Yu, Department of Mechanical Engineering, University of South
et al., 2011; He and Yuan, 2015; Jarmer et al., 2014;Kijanka et al., 2015; Moll et al., 2012; Tian et al.,2015b; Wang et al., 2004, 2015; Yu et al., 2013). Inrecent years, researchers have investigated the detectionof debonding damage in honeycomb sandwich struc-tures using guided waves (Baid et al., 2015;Chakraborty et al., 2012; Hosseini et al., 2014;Radzienski et al., 2016; Sikdar et al., 2015; Song et al.,2009, 2012; Tian et al., 2015a). Chakraborty et al.(2012) used guided waves to detect damage caused bylow-velocity impacts in honeycomb sandwich structureswhere a monotonic amplitude increase in the reflectionsignal was observed with the increase in the damagesize. Sikdar et al. (2015) studied guided wave propaga-tion in a honeycomb sandwich composite with debond-ing damage and found that the group velocity of the A0
mode increases with the increase in debonding size.Song et al. (2009) investigated guided wave propaga-tion in honeycomb sandwich structures and found glo-bal guided waves in the sandwich at low frequenciesand leaky guided waves from the skin plate to the hon-eycomb core. Recently, Radzienski et al. (2016) pre-sented assessment of disbonding and crushedhoneycomb core in composite sandwich panels basedon anomalies of propagating guided waves acquired bylaser vibrometry. They found that the excitation fre-quency significantly affects the imaging result andshould be taken into account (Radzienski et al., 2016).These studies show that compared to simple metallicplates, honeycomb sandwich structures have morecomplex geometries, and thus more complicated guidedwave characteristics. In addition, honeycomb sandwichstructures can have hidden debonding damage presentbetween the skin plate and the honeycomb core.Because of the complex wave propagation and interac-tion with damage in honeycomb sandwich structures,detecting and quantifying such hidden debonding dam-age using guided waves remain challenging tasks.
This article focuses on two aspects regarding (1)guided wave propagation in honeycomb sandwichstructures to identify the appropriate excitation fre-quency and wave mode for core–skin debonding detec-tion and (2) implementation of debonding detectionthrough wavefield analysis and imaging. To investigateguided wave interaction with debonding damage, bothfinite element (FE) simulations and experimentalinspection using laser vibrometry are performed.Wavefields acquired in the honeycomb structures withand without debonding damage (created by removingthe adhesive film) are compared. Furthermore, thewavefields are transformed to the frequency–wavenumber spectra, which reveal intrinsic informationfor further comparison. Two wavefield imaging meth-ods are implemented to discover the defects in thestructure, including a filter reconstruction imaging anda spatial wavenumber imaging. The detection and
quantification results clearly show the location, size,and shape of the debonding damage.
The remainder of this article is organized as follows:section ‘‘FE simulation’’ presents FE simulations ofguided wave interaction with debonding damage in thehoneycomb sandwich structure. Section ‘‘Experimentalinspection’’ validates the simulation through laser vibro-metry experiments. Section ‘‘Debonding detection andquantification’’ presents the frequency–wavenumberanalysis and two imaging methods for debonding detec-tion and quantification. Section ‘‘Conclusion’’ sum-marizes the findings and concludes the article.
FE simulation
Considering the complex geometries in honeycombsandwich structures, FE method provides a practicaland economical tool for predicting the guided wavepropagation characteristics. The simulations are per-formed using the commercial software ANSYS/Multiphysics 15.0. Guided waves in honeycomb sand-wich structures with and without debonding damageare simulated and compared. The effects of the debond-ing region size on the guided wave propagation are alsoinvestigated through FE simulations.
Simulation setup
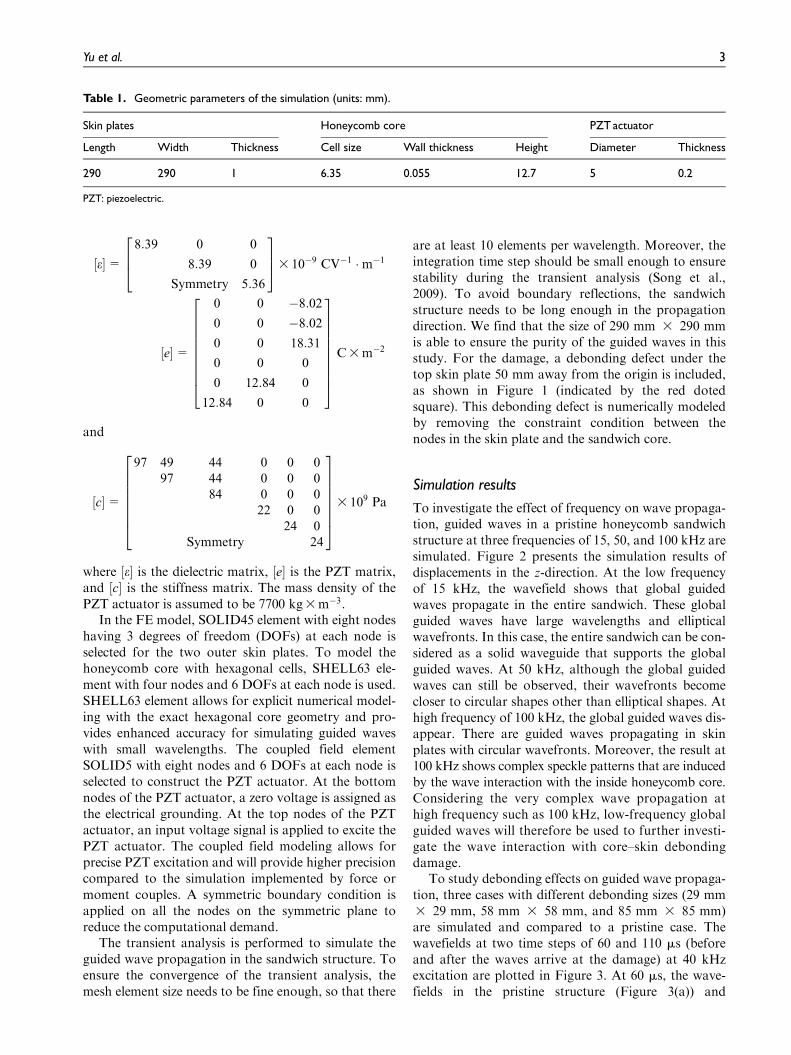
The three-dimensional (3D) FE models for the honey-comb sandwich structures with and without debondingdamage are established, as shown in Figure 1. Thestructure is composed of two outer skin plates and ahexagonal-celled core made of aluminum (elastic mod-ulus 78 GPa, Poisson’s ratio 0.33, and density 2730 kg/m3). A piezoelectric (PZT) wafer, which is commonlyused for guided wave generation nowadays, is bondedon the top surface of the structure. The geometric para-meters are listed in Table 1. The material properties ofthe PZT actuator are assumed as
Figure 1. The finite element model of a honeycomb sandwichstructure with a surface-bonded PZT actuator.
2 Journal of Intelligent Material Systems and Structures 00(0)
½e�=8:39 0 0
8:39 0
Symmetry 5:36
264
3753 10�9 CV�1 �m�1
½e�=
0 0 �8:02
0 0 �8:02
0 0 18:31
0 0 0
0 12:84 0
12:84 0 0
2666666664
3777777775C3m�2
and
½c�=
97 49 44 0 0 0
97 44 0 0 0
84 0 0 0
22 0 0
24 0
Symmetry 24
26666664
37777775
3 109 Pa
where ½e� is the dielectric matrix, ½e� is the PZT matrix,and ½c� is the stiffness matrix. The mass density of thePZT actuator is assumed to be 7700 kg3m�3.
In the FE model, SOLID45 element with eight nodeshaving 3 degrees of freedom (DOFs) at each node isselected for the two outer skin plates. To model thehoneycomb core with hexagonal cells, SHELL63 ele-ment with four nodes and 6 DOFs at each node is used.SHELL63 element allows for explicit numerical model-ing with the exact hexagonal core geometry and pro-vides enhanced accuracy for simulating guided waveswith small wavelengths. The coupled field elementSOLID5 with eight nodes and 6 DOFs at each node isselected to construct the PZT actuator. At the bottomnodes of the PZT actuator, a zero voltage is assigned asthe electrical grounding. At the top nodes of the PZTactuator, an input voltage signal is applied to excite thePZT actuator. The coupled field modeling allows forprecise PZT excitation and will provide higher precisioncompared to the simulation implemented by force ormoment couples. A symmetric boundary condition isapplied on all the nodes on the symmetric plane toreduce the computational demand.
The transient analysis is performed to simulate theguided wave propagation in the sandwich structure. Toensure the convergence of the transient analysis, themesh element size needs to be fine enough, so that there
are at least 10 elements per wavelength. Moreover, theintegration time step should be small enough to ensurestability during the transient analysis (Song et al.,2009). To avoid boundary reflections, the sandwichstructure needs to be long enough in the propagationdirection. We find that the size of 290 mm 3 290 mmis able to ensure the purity of the guided waves in thisstudy. For the damage, a debonding defect under thetop skin plate 50 mm away from the origin is included,as shown in Figure 1 (indicated by the red dotedsquare). This debonding defect is numerically modeledby removing the constraint condition between thenodes in the skin plate and the sandwich core.
Simulation results
To investigate the effect of frequency on wave propaga-tion, guided waves in a pristine honeycomb sandwichstructure at three frequencies of 15, 50, and 100 kHz aresimulated. Figure 2 presents the simulation results ofdisplacements in the z-direction. At the low frequencyof 15 kHz, the wavefield shows that global guidedwaves propagate in the entire sandwich. These globalguided waves have large wavelengths and ellipticalwavefronts. In this case, the entire sandwich can be con-sidered as a solid waveguide that supports the globalguided waves. At 50 kHz, although the global guidedwaves can still be observed, their wavefronts becomecloser to circular shapes other than elliptical shapes. Athigh frequency of 100 kHz, the global guided waves dis-appear. There are guided waves propagating in skinplates with circular wavefronts. Moreover, the result at100 kHz shows complex speckle patterns that are inducedby the wave interaction with the inside honeycomb core.Considering the very complex wave propagation athigh frequency such as 100 kHz, low-frequency globalguided waves will therefore be used to further investi-gate the wave interaction with core–skin debondingdamage.
To study debonding effects on guided wave propaga-tion, three cases with different debonding sizes (29 mm3 29 mm, 58 mm 3 58 mm, and 85 mm 3 85 mm)are simulated and compared to a pristine case. Thewavefields at two time steps of 60 and 110 ms (beforeand after the waves arrive at the damage) at 40 kHzexcitation are plotted in Figure 3. At 60 ms, the wave-fields in the pristine structure (Figure 3(a)) and
Table 1. Geometric parameters of the simulation (units: mm).
structures with different debonding defects (Figure 3(c),(e), and (g)) are nearly the same, and all show strongincident guided waves generated by PZT actuators.Since guided waves arrive at the left boundary ofdebonding at 60 ms, no wave reflections/interactionsare observed. In our previous study, we found thatguided waves excited in the frequency range of 15–50kHz are global guided waves (Tian et al., 2015a).Hence, the guided waves at 40 kHz in this study areglobal guided waves in the entire cross section of thesandwich and have a long wavelength of 19 mm, whichis about three times larger than a unit cell in the honey-comb core.
At 110 ms, the incident global guided waves arrive atthe debonding defects, and strong wave interactionswith the debonding defects are clearly demonstrated inthe simulation results (Figure 3(d), (f), and (h)). Withthe increase in the debonding area, the area of waveinteraction gradually increases. It is observed that wavereflections due to debonding defects are barely notice-able in the wavefield, and thus it is difficult to use thewave reflections for determining the debonding loca-tion and size. Nevertheless, waves propagating throughthe debonding area manifest very strong strengths com-pared to the waves in the pristine case. This implies thatthe transmitted waves can be used for the estimation ofdebonding location and size. This is expected becausewave energy leaking from the top skin plate to the hon-eycomb core becomes smaller due to the presence ofdebonding. Hence, most wave energy is in the top skinplate. Note that in the debonding area, waves are pro-pagating in the thin top skin plate as the A0 Lambmode. It is also noticed that the waves in the debondingarea propagate faster compared to those in the pristinesandwich structure. This indicates that the A0 modeLamb waves in the debonding area of the top skin platehave a larger group velocity than the global guidedwave in the sandwich.
Experimental inspection
Experimental studies of wave interaction with debond-ing damage in honeycomb sandwich structures havealso been conducted using a surface-bonded PZTpatch to generate guided waves and a non-contactscanning laser Doppler vibrometer (SLDV) to mea-sure the wavefields.
Experimental setup
Two honeycomb sandwich structures with the samedimensions (305 mm 3 305 mm 3 15 mm) and samecompositions (aluminum T3003 skin plates and ahexagonal-celled aluminum T3003 core) are used in theexperiments. One structure has no debonding damage,while the other contains debonding damage with dimen-sions of 58 mm 3 58 mm created by removing the adhe-sive film during the manufacturing process. The geometricparameters of the structures are listed in Table 2.
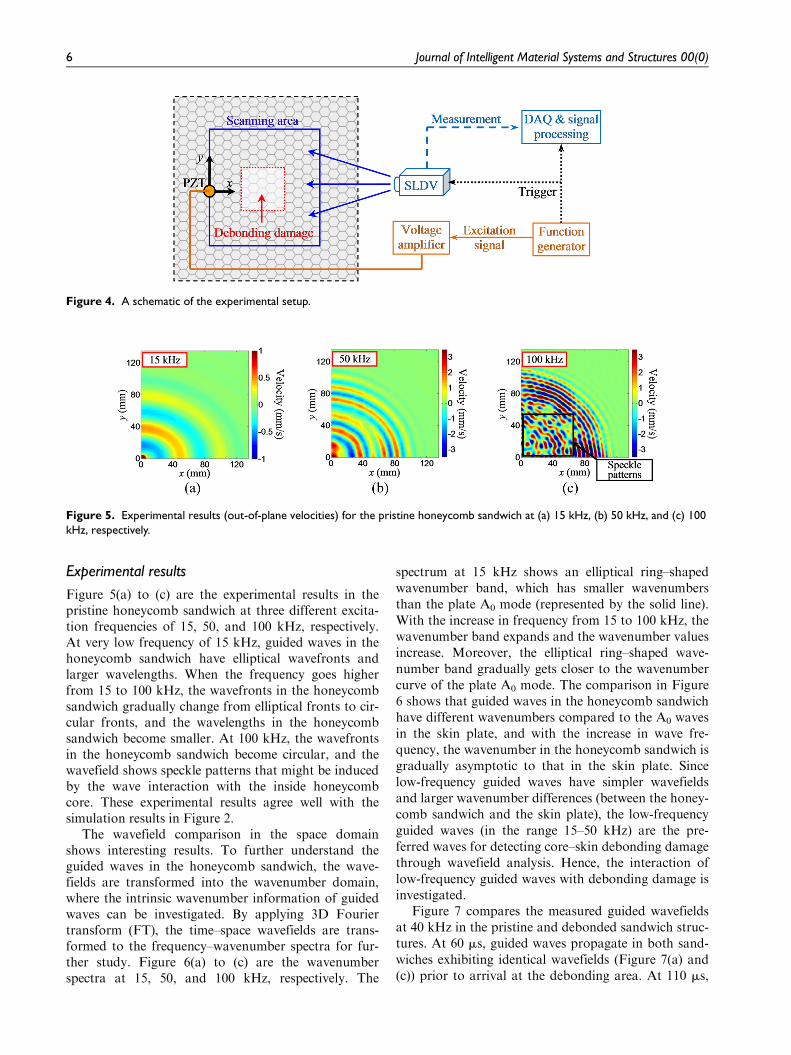
Figure 4 provides a schematic of the experimentalsetup, in which a PZT patch (APC 851: 7 mm diameter,0.2 mm thickness) is bonded on the top surface of thestructure to generate guided waves. The excitation sig-nal is generated by a function generator (HewlettPackard 33120A), amplified to 40 V by a voltageamplifier (Krohn-Hite 1506), and then applied to thePZT actuator. An SLDV (Polytec PSV-400-M2) is usedto acquire the wavefield of guided waves. The laserbeam is set normal to the specimen surface such thatonly the out-of-plane wave velocities are measured. TheSLDV takes measurements point-by-point with a spa-tial resolution of 0.2 mm in a scanning area of 150 mm3 150 mm. At each point, the measurement is aver-aged 30 times to improve the signal-to-noise ratio. Bymeasuring all the points in the scanning area, a wave-field in the form v(t, x) as a function of both time t andspace x is obtained (Yu and Tian, 2013).
Figure 2. Simulation results (displacements in the z-direction) in the pristine sandwich: (a) top and front views at 15 kHzexcitation, (b) top and front views at 50 kHz excitation, and (c) top and front views at 100 kHz excitation.
4 Journal of Intelligent Material Systems and Structures 00(0)
Figure 3. Simulation results (out-of-plane displacement wavefields) at 60 ms (left) and 110 ms (right) for 40 kHz excitation: (a) and(b) pristine sandwich structure, (c) and (d) 29 mm 3 29 mm debonding, (e) and (f) 58 mm 3 58 mm debonding, and (g) and (h)85 mm 3 85 mm debonding.
Table 2. Geometry parameters of honeycomb sandwiches (units: mm).
Figure 5(a) to (c) are the experimental results in thepristine honeycomb sandwich at three different excita-tion frequencies of 15, 50, and 100 kHz, respectively.At very low frequency of 15 kHz, guided waves in thehoneycomb sandwich have elliptical wavefronts andlarger wavelengths. When the frequency goes higherfrom 15 to 100 kHz, the wavefronts in the honeycombsandwich gradually change from elliptical fronts to cir-cular fronts, and the wavelengths in the honeycombsandwich become smaller. At 100 kHz, the wavefrontsin the honeycomb sandwich become circular, and thewavefield shows speckle patterns that might be inducedby the wave interaction with the inside honeycombcore. These experimental results agree well with thesimulation results in Figure 2.
The wavefield comparison in the space domainshows interesting results. To further understand theguided waves in the honeycomb sandwich, the wave-fields are transformed into the wavenumber domain,where the intrinsic wavenumber information of guidedwaves can be investigated. By applying 3D Fouriertransform (FT), the time–space wavefields are trans-formed to the frequency–wavenumber spectra for fur-ther study. Figure 6(a) to (c) are the wavenumberspectra at 15, 50, and 100 kHz, respectively. The
spectrum at 15 kHz shows an elliptical ring–shapedwavenumber band, which has smaller wavenumbersthan the plate A0 mode (represented by the solid line).With the increase in frequency from 15 to 100 kHz, thewavenumber band expands and the wavenumber valuesincrease. Moreover, the elliptical ring–shaped wave-number band gradually gets closer to the wavenumbercurve of the plate A0 mode. The comparison in Figure6 shows that guided waves in the honeycomb sandwichhave different wavenumbers compared to the A0 wavesin the skin plate, and with the increase in wave fre-quency, the wavenumber in the honeycomb sandwich isgradually asymptotic to that in the skin plate. Sincelow-frequency guided waves have simpler wavefieldsand larger wavenumber differences (between the honey-comb sandwich and the skin plate), the low-frequencyguided waves (in the range 15–50 kHz) are the pre-ferred waves for detecting core–skin debonding damagethrough wavefield analysis. Hence, the interaction oflow-frequency guided waves with debonding damage isinvestigated.
Figure 7 compares the measured guided wavefieldsat 40 kHz in the pristine and debonded sandwich struc-tures. At 60 ms, guided waves propagate in both sand-wiches exhibiting identical wavefields (Figure 7(a) and(c)) prior to arrival at the debonding area. At 110 ms,
Figure 4. A schematic of the experimental setup.
Figure 5. Experimental results (out-of-plane velocities) for the pristine honeycomb sandwich at (a) 15 kHz, (b) 50 kHz, and (c) 100kHz, respectively.
6 Journal of Intelligent Material Systems and Structures 00(0)
guided waves impinge the defect boundary and startinteracting with the debonding in the damaged sand-wich structures. Compared with the pristine structure(Figure 7(b)), the waves in the damaged structures(Figure 7(d)) show strong wave distortions due to thedebonding damage. Wavefields (Figure 7) measured inthe experiment agree well with the simulation results(Figure 3). In addition, both results show strong waveinteractions, higher wave strength, and faster propaga-tion speeds in the debonding area.
Debonding detection and quantification
Wavefields in Figure 7 show strong wave interactionsin the debonding area indicating the presence of dam-age. However, neither characterization nor quantifica-tion of the wave interactions is available from thewavefields immediately. Hence, the wavefields are con-verted into the frequency–wavenumber domain whereadditional information about wave modes and wave-number distributions can be obtained (Michaels et al.,2011; Ruzzene, 2007). The debonding effects on guidedwaves are analyzed by comparing the wavenumbers ofthe pristine and defect-present cases. Moreover, todetect and quantify debonding damage, two imagingmethods based on wavenumber information areapplied, including a filter reconstruction imaging and aspatial wavenumber imaging.
Frequency–wavenumber analysis
The time–space domain wavefield v(t, x) can be trans-formed to a representation in the frequency–wavenumberdomain using the multi-dimensional FT (Johnson andDudgeon, 1993; Tian and Yu, 2014), given as
V ( f , k)=
�
�
�
v(t, x)e�j(2pft�k�x)dtdx ð1Þ
where the space vector x and wavenumber vector k aredefined as (x, y) and (kx, ky), respectively. V(f, k) is the
resulting frequency–wavenumber representation or‘‘spectrum’’ in terms of frequency f and wavenumbervector k. As frequency is the counterpart of time, wave-number is the counterpart of spatial dimension. Fromspectrum V(f, k), a wavenumber spectrum V(f0, k) at aspecified frequency f0 can be readily obtained. Detailsof the frequency–wavenumber domain analysis can befound in our previous publication (Tian and Yu, 2014).
Figure 8(a) and (b) shows wavenumber spectra at40 kHz excitation frequency for the pristine and dam-aged honeycomb sandwich structures, respectively.Compared to the spectrum for the pristine sandwichin Figure 8(a), the spectrum for the damaged struc-ture in Figure 8(b) shows additional wavenumbercomponents, in addition to the changes in intensities.These additional wavenumber components have rela-tively larger values than those of the pristine sand-wich, which might be related to the waves induced bythe debonding damage.
Filter reconstruction imaging
The additional wavenumber components identified inthe debonded sandwich structure are speculated asbeing related to the new waves induced by the debond-ing damage. To investigate the relation between theadditional wavenumber components and the possiblephysical cause (debonding damage), a filtering tech-nique is applied to acquire and study the additionalwavenumber components shown in Figure 8(b).
Similar to digital filtering (Oppenheim et al., 1997),the filtering process of the wavenumber spectrum ismathematically expressed as a product between thefrequency–wavenumber spectrum V(f, k) and a band-pass filter function F(f, k) as
VF(f , k)=V (f , k)F(f , k) ð2Þ
where VF(f, k) is the resulting spectrum. Since only theadditional wavenumbers in Figure 8(b) are desired, awavenumber filter is designed to retain only the addi-tional wavenumber components and remove the rest.
Figure 6. Wavenumber spectra corresponding to the wavefields in the pristine sandwich at (a) 15 kHz, (b) 50 kHz, and (c) 100kHz. The solid line represents the theoretical wavenumber curves of the A0 mode in a single skin plate. The wavenumber spectraare generated from the experimental wavefields through frequency–wavenumber analysis and symmetric expansion.
Yu et al. 7
In this study, the filter design is based on the wavenum-ber spectrum VP(f, k) of the pristine sandwich as
F(f , k)=0 if VP(f , k).threshold1 otherwise
�ð3Þ
In equation (3), when the amplitude of the pristinespectrum VP(f, k) is larger than the threshold, the filtervalue is set to 0. Otherwise, the filter value is set to 1.Figure 9(a) shows a wavenumber filter generatedfrom the pristine spectrum (Figure 8(a)) with a thresh-old of 5%. By multiplying the filter with the spectrumof the damaged case (Figure 8(b)), a filtered spectrum(Figure 9(b)) is obtained, with only the additionalwavenumber components.
Then, the filtered wavenumber spectrum VF(f, k) isreversed back to the time–space wavefield by applyingthe inverse 3D FT, as
vF(t, x)=1
(2p)2
�
�
�
VF(f , k)ej(2pft�k�x)dfdk ð4Þ
Since the filtered spectrum VF(f, k) contains only theadditional wavenumber components, the resulting wave-field vF(t, x) is equivalent in the time–space domain.Figure 9(c) plots the filtered wavefield at 110 ms, mainlyin the area with debonding damage (dotted box). Itshows that the additional wavenumber components arerelated to waves confined in the debonding area.
Figure 7. Experimental results (out-of-plane velocities) at 60 and 110 ms with 40 kHz excitation: (a) and (b) are for the pristinehoneycomb sandwich structure; while (c) and (d) are for the structure with 58 mm 3 58 mm debonding damage.
Figure 8. Wavenumber analysis of experimental results: (a) wavenumber spectrum for the pristine sandwich and (b) wavenumberspectrum for the sandwich with debonding damage.
8 Journal of Intelligent Material Systems and Structures 00(0)
Using the filtered time–space wavefield vF(t, x), amap of the cumulative wave energy (An et al., 2013;Kudela et al., 2015; Ostachowicz et al., 2014; Sohnet al., 2011) of the debonding-induced waves can begenerated, as
EF(x, t)=
ðt0
1
2v2
F(t, x)dt ð5Þ
The resulting wave energy map is given in Figure 9(d),showing an area with high energy concentration, whichmatches well the actual debonding area (the dotted box).The energy map generated from the filtered wavefieldscan be used to locate and roughly quantify the size andshape of the debonding damage in the honeycomb sand-wich structure.
Spatial wavenumber imaging
The results in the previous section prove that the filterreconstruction imaging is an effective method for quan-tifying the debonding damage. However, the design ofthe wavenumber filter requires the pristine wavenum-ber spectrum be obtained first. Another method, spatialwavenumber imaging, is developed to quantify thedebonding damage for the case when the pristine spec-trum is not available. The wavenumber imaging
approach is based on short-space 3D FT and can gener-ate an image in the present state (damaged structure)without information from the prior state (pristine). Thespatial wavenumber imaging can always provide anadditional means to evaluate the debonding forenhanced reliability and robustness of the damagecharacterization.
Short-space 3D FT is a spatially windowed FT byapplying a sliding window along the spatial dimension(Rogge and Leckey, 2013; Tian et al., 2015b), andthe result can indicate how the frequency and/or wave-number components vary in space. Through the trans-formation, a coupled space-frequency–wavenumberrepresentation S(�x, f , k) can be obtained, as
S(�x, f , k)=
�
�
�
v(t, x)W (x� �x)e�j(2pft�k�x)dtdx
ð6Þ
where �x is the retained spatial vector (�x,�y), and W(x) isa spatial window function. In our application, aHanning function is selected to construct the windowfunction W(x), given as
W (x)=0:5 1+ cos 2p
xj jDx
� �h iif xj j �Dx=2
0 otherwise
(ð7Þ
Figure 9. Filter reconstruction imaging results: (a) wavenumber filter, (b) filtered wavenumber spectrum, (c) reconstructedwavefield at 110 ms that corresponds to the spectrum in (b), and (d) energy map of the reconstructed wavefield. The dotted boxesin (c) and (d) represent the area of actual debonding damage.
Yu et al. 9
where Dx is the window length in the space domain. Bysliding the window W(x) along the spatial dimension, aspace–frequency–wavenumber representation S(�x, f , k)can be obtained.
Using S(�x, f , k), we define a new spatial wavenumberfunction ksw(�x, f ), by finding the wavenumber, at whichthe representation S(�x, f , k) has the largest amplitude,as
ksw(�x, f )= ksw(�x, f )j j ð8Þ
where
ksw(�x, f )= argmaxk
S(�x, f , k)j j ð9Þ
It should be noted that no real signal has a singularfrequency component. Hence, equation (8) is furtheroptimized by taking the average spatial wavenumberksw(�x), over a selected frequency range, given as
ksw(�x)=1
N
XN
i= 1
ksw(�x, fi) ð10Þ
where fi (i = 1, 2, 3,., N) are the frequencies withinthe selected frequency bandwidth Df. The resulting spa-tial wavenumber ksw(�x) is then mapped as an intensityimage representing how the wavenumbers within theselected frequency band are distributed along spatialdimensions.
Using the wavenumber imaging defined by equations(8) to (10), Figure 10 presents the image generated overthe frequency band 35–45 kHz for the sandwich struc-ture with debonding damage. The intensity indicates anarea approximately 55 mm 3 60 mm in size. This areahas significantly larger wavenumbers than the rest area,for the reason that A0 mode in the debonding regionhas larger wavenumbers than global guided waves inthe rest area. The detected location and the quantifiedsize of the debonding damage agree well with the loca-tion and the size of the actual debonding damage(indicated by the dotted box) in the sandwich struc-ture. This provides strong evidence that our approachcan be used for not only detecting but also quantify-ing possible debonding damage in honeycomb sand-wich structures.
Conclusion
This article presents a fundamental study of guidedwave propagation in honeycomb sandwich structureswith core–skin debonding damage and the developmentof effective damage imaging approaches for thedebonding detection and characterization. Through FEsimulations, guided waves in sandwich structures withcore–skin debonding damage are compared to those ina pristine structure. The comparison shows that guidedwaves change to a fundamental A0 Lamb mode in the
debonding region at low frequencies. This mode con-version in the debonding area generates a larger wave-number compared to the wavenumber of originalwaves before mode conversion. Thus, the mode conver-sion offers useful information for detecting the debond-ing damage. Based on this mechanism, imagingmethods for the detection of debonding damage aredeveloped. The imaging methods use multi-dimensionalwavefield data acquired by a non-contact SLDV sys-tem. The non-contact nature of the sensing system isnon-invasion to the inspected structures and signifi-cantly reduces the labor of sensor installation andmaintenance. Moreover, the measured wavefield dataprovide immediate preliminary information regardingthe structural integrity. The intrinsic characterizationof waves in the honeycomb sandwich structures is fur-ther performed using the multi-dimensional FT toobtain the frequency–wavenumber information.
To detect and quantify the debonding damage, twoimaging methods are developed. The filter reconstruc-tion imaging makes use of the additional wavenumbersexhibited in the debonded plate and converts them backto the time–space domain to generate a map of waveenergy. It has the advantage of being a quick methodbut requires the knowledge of pristine plate condition.The spatial wavenumber imaging approach calculateswavenumbers at each spatial location over a certain fre-quency band to generate the image. Although calcula-tion-intensive, it does not require prior knowledge ofthe plate condition. Both approaches are applied toevaluate the core–skin debonding in this study andshow consistent results, agreeing well with the actualdefect. Our study not only shows that the wavefield-based imaging methods are promising for guided waveswith larger wavelengths at lower frequencies comparedto previous work at higher frequencies (Flynn et al.,2013; Yu et al., 2013) but also confirms their viabilityfor core–skin debonding evaluation in honeycombsandwich structures. Future work will include applying
Figure 10. Debonding detection and quantification usingspatial wavenumber imaging. The dotted box represents thearea of actual debonding damage.
10 Journal of Intelligent Material Systems and Structures 00(0)
this method for core–skin debonding defects with com-plex shapes and composite sandwich structures.
Declaration of conflicting interests
The author(s) declared no potential conflicts of interest withrespect to the research, authorship, and/or publication of this
article.
Funding
The authors would like to thank US Department of Energy(DOE) Office of Nuclear Energy under Grant No. DE-NE0000726 and DE-NE 0008400 and Air Force Office ofScientific Research under Grant No. AF 9550-15-1-0016 withProgram Manager Dr Byung-Lip (Les) Lee.
An YK, Park B and Sohn H (2013) Complete noncontact
laser ultrasonic imaging for automated crack visualization
in a plate. Smart Materials and Structures 22: 025022.Baid H, Schaal C, Samajder H, et al. (2015) Dispersion of
Lamb waves in a honeycomb composite sandwich panel.
Ultrasonics 56: 409–416.Bitzer T (1997) Honeycomb Technology: Materials, Design,
Manufacturing, Applications and Testing. Dordrecht:
Springer.Chakraborty N, Rathod VT, Mahapatra DR, et al. (2012)
Guided wave based detection of damage in honeycomb
core sandwich structures. NDT & E International 49:
27–33.Fatemi J and Lemmen M (2009) Effective thermal/mechani-
cal properties of honeycomb core panels for hot structure
applications. Journal of Spacecraft and Rockets 46:
514–525.Flynn EB, Chong SY, Jarmer GJ, et al. (2013) Structural
imaging through local wavenumber estimation of guided
waves. NDT & E International 59: 1–10.Giurgiutiu V (2008) Structural Health Monitoring with Piezo-
electric Wafer Active Sensors. Boston, MA: Academic
Press.Hall JS, McKeon P, Satyanarayan L, et al. (2011) Minimum
variance guided wave imaging in a quasi-isotropic compo-
site plate. Smart Materials and Structures 20: 025013.He JZ and Yuan FG (2015) Damage identification for com-
posite structures using a cross-correlation reverse-time
migration technique. Structural Health Monitoring 14:
558–570.Hosseini SM, Willberg C, Kharaghani A, et al. (2014) Char-
acterization of the guided wave propagation in simplified
foam, honeycomb and hollow sphere structures. Compo-
sites Part B: Engineering 56: 553–566.Jarmer GJS, Flynn EB and Todd MD (2014) Multi-wave-
mode, multi-frequency detectors for guided wave interro-
gation of plate structures. Structural Health Monitoring
13: 120–130.
Johnson DH and Dudgeon DE (1993) Array Signal Process-
ing: Concepts and Techniques. Upper Saddle River, NJ:
Prentice Hall.Kijanka P, Manohar A, di Scalea FL, et al. (2015) Damage
location by ultrasonic Lamb waves and piezoelectric
rosettes. Journal of Intelligent Material Systems and Struc-
tures 26: 1477–1490.Kudela P, Radzienski M and Ostachowicz W (2015) Identifi-
cation of cracks in thin-walled structures by means ofwavenumber filtering. Mechanical Systems and Signal Pro-
cessing 50–51: 456–466.Michaels TE, Michaels JE and Ruzzene M (2011) Frequency-
wavenumber domain analysis of guided wavefields. Ultra-
sonics 51: 452–466.Moll J, Torres-Arredondo MA and Fritzen CP (2012) Com-
putational aspects of guided wave based damage localiza-tion algorithms in flat anisotropic structures. Smart
Structures and Systems 10: 229–251.Oppenheim AV, Willsky AS and Hamid S (1997) Signals and
Systems. 2nd ed. Upper Saddle River, NJ: Prentice Hall.Ostachowicz W, Radzienski M and Kudela P (2014) 50th
anniversary article: comparison studies of full wavefieldsignal processing for crack detection. Strain 50: 275–291.
Radzienski M, Kudela P and Ostachowicz W (2016) Assess-ment of honeycomb core condition in composite sandwich
panels by means of guided waves. In: 8th European work-
shop on structural health monitoring (EWSHM), Bilbao,
5–8 July 2016.Rogge MD and Leckey CAC (2013) Characterization of
impact damage in composite laminates using guided wave-
field imaging and local wavenumber domain analysis.Ultrasonics 53: 1217–1226.
Rose JL (1999) Ultrasonic Waves in Solid Media. Cambridge:Cambridge University Press.
Ruzzene M (2007) Frequency-wavenumber domain filtering
for improved damage visualization. Smart Materials and
Structures 16: 2116–2129.Sikdar S, Banerjee S and Ashish G (2015) Ultrasonic guided
wave propagation and disbond identification in a honey-comb composite sandwich structure using bonded piezo-
electric wafer transducers. Journal of Intelligent Material
Systems and Structures 27: 1767–1779.Sohn H, Dutta D, Yang JY, et al. (2011) Automated detec-
tion of delamination and disbond from wavefield imagesobtained using a scanning laser vibrometer. Smart Materi-
als and Structures 20: 045017.Song F, Huang GL and Hu GK (2012) Online guided wave-
based debonding detection in honeycomb sandwich struc-tures. AIAA Journal 50: 284–293.
Song F, Huang GL and Hudson K (2009) Guided wave pro-
pagation in honeycomb sandwich structures using a piezo-electric actuator/sensor system. Smart Materials and
Structures 18: 125007.Staszewski WJ, Boller C and Tomlinson GR (2004) Health
Monitoring of Aerospace Structures. Chichester: JohnWiley & Sons.
Tian ZH and Yu LY (2014) Lamb wave frequency-
wavenumber analysis and decomposition. Journal of Intel-ligent Material Systems and Structures 25: 1107–1123.
Tian ZH, Yu LY, Huang GL, et al. (2015a) Wavenumber
study of guided waves in aluminum honeycomb sandwichstructures. In: Health monitoring of structural and
Yu et al. 11
biological systems 2015, San Diego, CA, 8–12 March2015,vol. 943807. San Diego, CA: SPIE Press.
Tian ZH, Yu LY, Leckey C, et al. (2015b) Guided wave imagingfor detection and evaluation of impact-induced delaminationin composites. Smart Materials and Structures 24: 105019.
Vinson JR (1999) The Behavior of Sandwich Structures of Iso-
tropic and Composite Materials. Lancaster: TechnomicPublishing Company.
Wang CH, Rose JT and Chang FK (2004) A synthetic time-reversal imaging method for structural health monitoring.Smart Materials and Structures 13: 415–423.
Wang Q, Hong M and Su ZQ (2015) An in-situ structuralhealth diagnosis technique and its realization via a modu-larized system. IEEE Transactions on Instrumentation and
Measurement 64: 873–887.Yu L and Tian Z (2013) Lamb wave structural health moni-
toring using a hybrid PZT-laser vibrometer approach.Structural Health Monitoring 12: 469–483.
Yu L, Leckey CAC and Tian Z (2013) Study on crack scatter-ing in aluminum plates with Lamb wave frequency-wavenumber analysis. Smart Materials and Structures 22:065019.
12 Journal of Intelligent Material Systems and Structures 00(0)