Viewing How STEM Project-Based Learning Influences Students’ Science Achievement Through the Implementation Lens: A Latent Growth Modeling Niyazi Erdogan Balikesir University, TURKEY
Bilgin Navruz Texas A&M University, USA
Rayya Younes Radford University, USA Robert M. Capraro Texas A&M University, USA Received 13 August 2015Revised 18 February 2016 Accepted 19 February 2016
Recent studies on professional development programs indicate these programs, when sustained, have a positive impact on student achievement; however, many of these studies have failed to use longitudinal data. The purpose of this study is to understand the how one particular instructional practice (STEM PBL) used consistently influence student achievement. Three urban high schools in the southwest U.S. were assigned to participate in a professional development program for STEM teachers. Data for 565 students from these schools were collected at grade 8, 10, and 11. According to instructional practice observation tool, School 1 had a high level of STEM PBL implementation, school 2 showed an average level of STEM PBL implementation, and school 3 had almost no STEM PBL implementation. Results indicated students’ success for school 1 was significantly different than students’ success for schools 2 and 3. Results also indicated no difference in student data for ethnicity in school 1.
Keywords: professional development, STEM project-based learning, persistence of pedagogy, growth model
There is a current need in the U.S. for future workers to pursue degrees in science, technology, engineering, and math (STEM; Joint Economic Committee Chairman’s Staff Senator Bob Casey, Chairman, 2012). In the past decade, the workforce growth rate in science and engineering fields has been 1.4% annually, while the overall workforce growth rate has been only 0.2%. Thus, the need for greater growth in the STEM workforce has dominated the concerns of many stakeholders (National Science Board, 2012). Results from national and international studies support stakeholders in their concerns. For example, Rampey, Dion, and Donahue (2009), using National Assessment of Educational Process (NAEP) data, revealed only 33% of students in grade 4 and only 26% of students in grade 8 are mathematically proficient in the U.S. Although these percentages were improved compared to results from 1996 (19% and 20% respectively; Rampey, Dion, & Donahue, 2009), the majority of students in the U.S. are still having problems demonstrating proficiency in mathematics (Schmidt, 2011). In addition, results from the Trends in International Mathematics and Science Study (TIMSS) 2011 revealed only 7% of 8th graders in the U.S. exhibited advanced mathematics knowledge and ability while approximately half of the 8th graders in Chinese Taipei and Singapore exhibited this advance knowledge (49% and 48%, respectively; Provasnik et al., 2012). Finally, the 2009 Programme for International Student Assessment (PISA) revealed 15-year-old students in the U.S. scored on average in mathematics and science among 65 countries while other economically advanced countries (i.e., China, Finland, South Korea) were ranked at the highest levels (Fleischman, Hopstock, Pelczar, & Shelley, 2010). Policymakers agree that the student performance has a direct influence the growth of STEM workforce (National Research Council, 2011). With the understanding that effective teachers are required to increase the student performance and eventually the growth of the STEM workforce, stakeholders have focused on specialized STEM schools (Erdogan & Stuessy, 2015a; Erdogan & Stuessy, 2015b) and providing professional development programs for science and mathematics teachers.
The authorization of the No Child Left Behind (NCLB) Act of 2001, which required states to provide more support to teachers through professional development programs, highlighted the importance of professional development programs in education (Paik et al., 2011). Professional development programs can be described as “systematic efforts to bring about change in the classroom practices of teachers, in their attitudes and beliefs, and in the learning outcomes of students” (Guskey, 2002,
State of the literature
With the understanding that effective teachers are required to increase the student performance and eventually the growth of the STEM workforce, stakeholders have focused on providing professional development programs for science and mathematics teachers. Professional development programs have to meet certain criteria so that innovative instructional practices can become sustainable and contribute to the students’ achievement.
Factors influencing teachers’ decision to continue implementing innovative instructional practices after professionals stop supporting the teachers have been studied for about four decades.
In this study, we assess the outcomes of insisting on implementing one particular instructional practice to understand the importance of the sustainability.
Contribution of this paper to the literature
Several studies on professional development programs have been conducted to explore various outcomes. This study differs from many of other studies with its longitudinal data. The prominent outcome of professional development programs is student achievement and we measured student achievement for four years.
In comparison of three schools that were provided professional development programs and observed, latent growth modeling was used which is a robust method for longitudinal analyses.
Outcomes of this study contribute to the literature in a great amount because the outcomes display how the change of teachers’ practices influence students’ success over a long period of time.
p. 381). Professional development programs address various content and instructional strategies for both teachers and students. However, research shows that participation in professional development programs does not necessarily cause effective changes in instructional practices (Johnson, Kahle, & Fargo, 2006). For change to occur, teachers need time and must continuously attend professional development programs for at least 80 hours (Supovitz & Turner, 2000). Even so, effective implementation of instructional practices is not guaranteed because several factors affect application of ideas learned during professional development. In this study, we explored how three different levels of teachers’ implementation of instructional practices learned during a sustained professional development program influenced students’ science achievement as measured by state mandated tests for three consecutive administrations.
Sustained instructional practices
At the very beginning of the 21st century, policymakers realized that the future of the U.S. lies on the shoulders of teachers and authorized the NCLB act with an emphasis on professional development programs (Feiman-Nemser, 2001). What was believed when the professional development programs came to prominence was that only teachers with required knowledge, skills, and commitments make a difference in student learning (Feiman-Nemser, 2001; The National Commission on Teaching and America’s Future, 1996). However, most professional development programs lack focus, connection to other professional development programs, classroom applications, or revisits. In order to spark abilities in teachers, professional development programs have to meet certain criteria so that innovative instructional practices can become sustainable and contribute to the students’ achievement (Erdogan, Corlu, & Capraro, 2013; Ball & Cohen, 1999). In addition to good quality professional development programs, stakeholders (i.e., teachers, administrators, and researchers) should account for factors influencing innovative instructional practices’ rate of adoption for the sake of sustainable use of instructional practices.
Factors influencing teachers’ decision to continue implementing innovative instructional practices after professionals stop supporting the teachers have been studied for about four decades (Gersten, Chard, & Baker, 2000). In the early studies, Berman and McLaughlin (1976, 1978) found availability of resources interestingly have little relation to the implementation level of instructional practices. Also, they found instructional practices that were successful with low-achieving students were likely to sustain. Another interesting finding of these studies was related to the scope of instructional practices provided in professional development programs. Both too broad and too narrow scopes were likely to cause the end of implementation. A balanced scope is preferable when introducing teachers to a new instructional practice. The final finding in these studies, as expected, was that support and commitment from administrators were crucial for sustainable implementation of innovative instructional practices.
Later in the 1980s, Huberman and Miles (1984) studied alternative ways to sustain implementation of instructional practices and found giving teachers enough time to master the skills learned during professional development programs would contribute to the sustainability. Additionally, Guskey (1986) and Smylie (1988) found the motivation and beliefs of teachers played an active role in sustained use of instructional practices. When teachers saw the successful outcomes of the new instructional practice, it was likely to sustain. Following these studies, McLaughlin (1990) reviewed the results of earlier study performed by Berman and McLaughlin (1976, 1978) and found professional development programs offered by local professionals were much more effective than the ones offered by strangers. Looking from teachers’ perspective, Kennedy (1991) brought a new vision to professional
development programs. She suggested taking teachers’ assumptions and understanding into account would cause sustained use of instructional practices. Accounting for teachers’ assumptions and understanding would help teachers to reason why this particular practice is better than the one they currently use. From the same perspective, Little (1993) and McLaughlin (1994) suggested teachers’ participation in professional learning communities would help them improve their skills and motivation, which would ultimately lead to sustained use of instructional practices.
In recent times, Birman, Desimone, Porter, and Garet (2000) found professional development programs offering in-depth content knowledge, active and collective participation, and longer duration would be more successful in helping teachers to adopt a new instructional practice. In such professional development programs, teachers would have the opportunity to establish empathy with students for an adequate period of time. Later, Fullan (2005) argued change in the environment is essential for sustainability of instructional practices. Classrooms, schools, and communities must be adjusted for compatibility with the new instructional practices. Although many studies have been conducted in this field of research, sustaining new instructional practices in the classrooms is still a complex challenge for stakeholders. However, having a knowledge base of factors influencing the sustained use of instructional practices definitely strengthen the hands of professionals.
In this study, we do not examine which factors influence the sustained use of instructional practices. Rather, we assess the outcomes of insisting on implementing one particular instructional practice to understand the importance of the sustainability. Considering very few studies have been conducted on this topic, we think our research fills a void in what we know about this subject.
STEM project-based learning
The innovative instructional practice in the present study is STEM Project-Based Learning (STEM PBL), which was explained and demonstrated to science and mathematics teachers in a series of professional development programs. In order to fully understand this particular instructional practice, we shall first introduce what the current perception of Project-Based Learning (PBL) is. PBL, in simple definition, is the innovative instructional practice that constructs learning based on challenging tasks or problems that lead students to investigate, make decisions, design, and finally conclude with a product (Erdogan & Bozeman, 2015; Jones, Rasmussen, & Moffitt, 1997; Thomas, Mergendoller, & Michaelson, 1999). Although educators have promoted PBL recently, this instructional practice has long been used by many educators (e.g., John Dewey) in the U.S. (Capraro & Slough, 2008). Two recent developments in education contributed to the recent popularity of PBL: (1) social learning theory and (2) the STEM education movement (Erdogan & Bozeman, 2015). First, currently social learning theory provides the framework widely accepted by educators to understand learning with its all dimensions (Erdogan & Bozeman, 2015; Bransford, Brown, & Cocking, 2000; Talbot-Smith, Abell, Appleton & Hanuscin, 2013) because social learning theory accounts for external stimuli affecting learners, learning environment, and cognitive processes of learners. As opposed to early learning theories such as behaviorism, social learning theory states internal cognition is a vital component to learn any content (Erdogan & Bozeman). Therefore, 21st century educators using this framework can create better instructional practices to teach STEM content knowledge. Second, STEM education movement has come to prominence among educators because of the improvements in technology and the global perspectives of 21st century (Augustine, 2005). 21st century market requires a workforce with a complete mastery in science, technology, engineering, and mathematics all at the same time. Hence, educators need to reshape their
instructional practices to meet the standards of today (Erdogan & Bozeman). Having these in mind, Capraro and Slough (2008) created STEM PBL, claiming it as the best instructional practice to meet the needs of students in 21st century.
STEM PBL can be defined as a well-defined outcome with an ill-defined task (Capraro & Slough, 2008) within an interdisciplinary framework using engineering design principles (Capraro, Capraro, & Morgan, 2013; Carini, Kuh, & Klein, 2006; Kuh, 2001; Linnenbrink, & Pintrich, 2003). What makes STEM PBL unique is the design process and interdisciplinarity of the instruction. For example, the design process of STEM PBL starts with a well-defined outcome (setting the objectives) and planning for summative assessment (Capraro & Slough, 2008). This first step informs rest of the instruction and prepares students for high-stakes testing, which is important whether or not high-stakes testing is viewed favorably. Also, as Capraro, Capraro, & Morgan (2013) noted, “this is NOT teaching to the test, it is designing to the objective” (p. xi). The next step in the design process of STEM PBL is the ill-defined task, which leads students to generate ideas for different solutions to a complex problem (Capraro & Slough, 2008). An ill-defined task improves students’ higher order thinking skills and content learning. Thus, STEM PBL aims to prepare students for high-stakes testing along with helping them gain 21st century skills, which cannot be measured by high-stake tests. In this study, we used students’ high-stakes test results on science measure to explore how three different levels of STEM PBL implementation influence students’ science achievement because the data were readily available.
Based on the literature reviewed, our primary research questions were: (a) Does teachers’ implementation level of STEM PBL influence students’ achievement, and (b) is this influence on students’ achievement mediated by gender and/or ethnicity?
METHODS
Participants
The sample for this study consisted of 565 students, 263 males and 302 females, attending three different high schools in the southwest of the U.S. These students represent a subset of schools participating in a much larger study. However, the three schools manifest three levels of teacher fidelity to STEM PBL instruction with similar student demographics. In terms of ethnicity, 177 (31%) students identified as African American, 316 (56%) students identified as Hispanic, and 72 (13%) students identified as White. Detailed demographic information in terms of gender and ethnicity across the three schools is given in Table 1.
Table 1. Student Gender by Student Ethnicity for Students in School 1, 2, and 3
School number Student gender
Student ethnicity
Total White African
American Hispanic 1 Male 8 12 23 43
Female 5 9 27 41 Total 13 21 50 84
2 Male 20 54 46 120 Female 32 66 67 165 Total 52 120 113 285
3 Male 2 20 78 100 Female 5 16 75 96 Total 7 36 153 196
Total Male 30 86 147 263 Female 42 91 169 302 Total 72 177 316 565
Results from high-stakes tests helped stakeholders to make critical decisions on education reforms for several decades (Heubert & Hauser, 1998). As a significant sign of student achievement, high-stakes test results also informed us in this study. In Texas, students took the Texas Assessment for Knowledge and Skills (TAKS) as a high-stakes test until 2012 when it was replaced with the State of Texas Assessments of Academic Readiness (STAAR; Texas Education Agency [TEA], 2014). Students used to take TAKS on four subjects including science, mathematics, reading, and history from grade 3 through graduation. The science TAKS test was used to measure students’ science achievement in grades 5, 8, and 10. Students also used to take an exit level test in science before graduation. In our study, all students took the exit level test in grade 11. Each science test included 55 multiple-choice items and was administered at the end of the spring semester (TEA, 2014). High-stakes TAKS scores of students were collected at the end of each year when the professional development program was offered, which is between fall of 2007 and spring of 2010. The dependent variable in this study, therefore, was students’ Texas Assessment of Knowledge and Skills (TAKS) science scores across three administrations (i.e., in grades 8, 10, and 11). The independent variables in this study included levels of STEM PBL implementation and students’ demographic data.
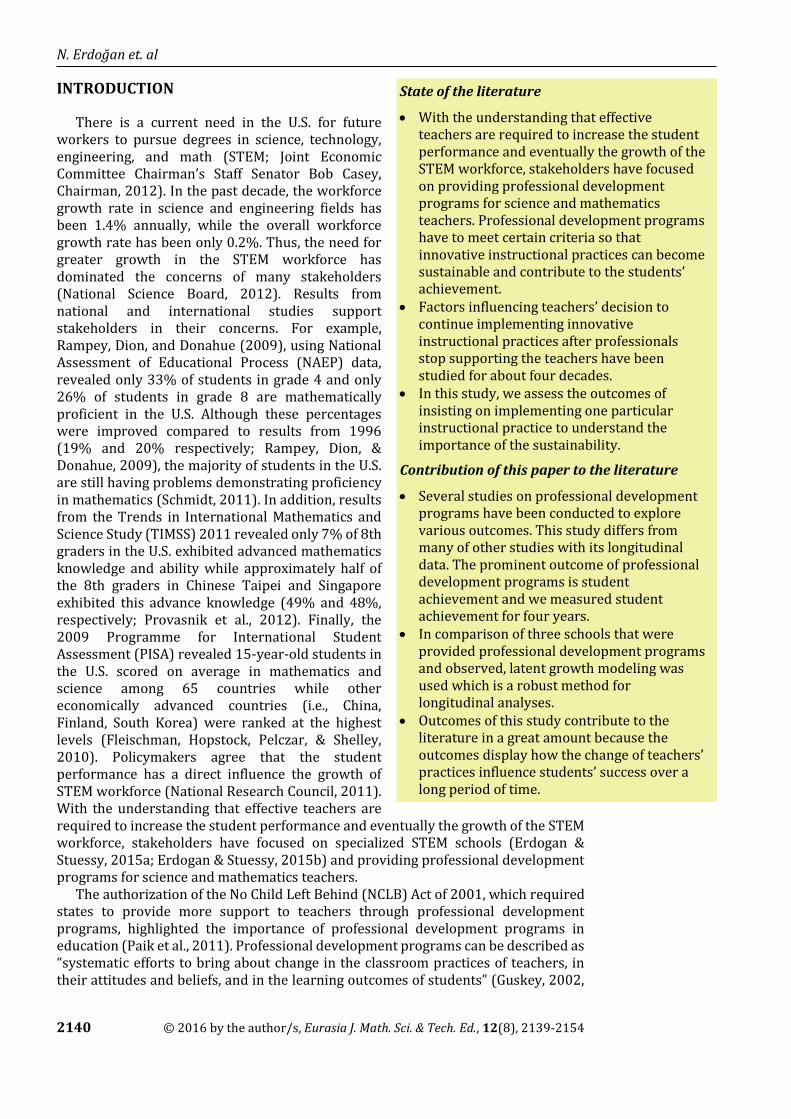
Professional development and STEM PBL implementation levels. Between fall of 2007 and spring of 2010, all teachers (N = 48) teaching science and mathematics in three high schools attended 30 or more professional development sessions over a three-year period and weeklong summer institutes in each year to learn how to implement STEM PBL in science and mathematics courses situated within secondary schools. By 2010, most teachers had attended more than 200 hours of STEM PBL professional development conducted by the same team of professionals from one of the top universities of US. Each year, this team of professionals conducted nine site visits in science classrooms at each of the three schools with a total of 27 observations. Teachers were evaluated based on their level of STEM PBL implementation using a standardized observation instrument that was divided into six categories, with three or four questions in each category for a total of 22 questions (see Stearns, Morgan, Capraro, & Capraro 2012 for the instrument). The degree of implementation was scored for each question on a scale from 1 to 5, with 1 indicating no evidence of implementation and 5 indicating exemplary implementation. A score of 3 was considered an average STEM PBL implementation. Then, each school’s score in each of the six categories was averaged and summed to represent the final school STEM PBL implementation average for each year. The instrument for measuring STEM PBL implementation identified a score from 20 to 24 as a high degree of implementation, 16 to 19.9 as average implementation, 12 to 15.9 as low implementation, and scores below 12 as almost no implementation (Stearns, Morgan, Capraro, & Capraro, 2012). Figure 1 shows the level of STEM PBL implementation by science and mathematics teachers in schools 1, 2, and 3 from 2008 to 2011. According to results from our observations, school 1 started fully implementing the STEM PBL instructional practice provided in our professional development program. School 2 failed to fully implement STEM PBL and blended this particular instruction with the instruction they used to use. Finally, school 3 did not implement STEM PBL at all. In the rest of the study we mention school 1 as the full implementation school, school 2 as the partial implementation school, and school 3 as the no implementation school.
A sample STEM PBL instruction. STEM PBL instruction starts with organization of the learning environment. A learning environment for STEM PBL must make content accessible, make thinking visible, encourage students learn from each other, and promote lifelong learning (Slough & Milam, 2008). Different than most traditional methods, STEM PBL continues with an ill-defined task that is presented as a complex
problem in a story. For any given ill-defined task, there is a well-defined outcome planned before the instruction begins. Students as a group do research to find a solution with given constraints. There are always multiple ways to solve the complex problem. Later students create a prototype of their product or system and test it. During the testing phase, students collect data and revise their product accordingly. At the end of STEM PBL, students present their product and findings and teacher extends the instruction by posing questions for a deeper understanding.
Data Analysis
All analyses were conducted using Mplus version 7 (Muthén & Muthén, 1998-2012). Multinormality, under standard conditions, was a requisite assumption that required testing prior to data analysis for all multivariate techniques (Thompson, 1984). Therefore, we used maximum likelihood with robust standard errors (MLR), a non-distribution dependent method, to estimate the parameters and, therefore, did not test for multinormality (Muthén & Muthén, 1998-2012).
We used latent growth modeling analyses within the framework of structural equation modeling to analyze students’ longitudinal data. Latent growth modeling is a popular method to analyze longitudinal data as it provides more flexibility than other methods, such as ANOVA or MANOVA, to test research hypotheses related to longitudinal measurements (Fan, 2001). For example, latent growth models have more statistical power than traditional repeated measures ANOVA methods in terms of detecting group differences (Fan, 2003). Before considering the predictor variables in our model, we wished to determine whether the linear growth model was a good fit for students’ data. Therefore, we first conducted an unconditional latent growth model without predictors.
Unconditional linear growth model
In this model, all intercept parameters were fixed to unity because of the growth model parameterization. Because measurements on students were conducted at the 8th, 10th and 11th grades, the time intervals between measurements were unequal. To model linear growth with unequal time intervals, time scores for slope growth factors were fixed to 0, 2, and 3 (see Figure 2; Muthén & Muthén, 1998-2012). The residual variances of observed variables were freely estimated and, therefore, were independent.
Conditional linear growth model
We evaluated group differences by schools’ STEM PBL implementation levels as well as students’ ethnicity and gender by conducting a total of five linear growth models. The same outcome variables were used in each of the models. In the first two models, we examined the influence of STEM PBL implementation on science achievement (see Figure 3). Since our initial expectations were in favor of full
Figure 1. Level of STEM PBL implementation in each school
implementation against partial and no implementation, we created two orthogonal contrasts. In the first model, we contrasted full implementation versus the combination of the other two implementation levels (i.e., partial and no, A1) and partial implementation versus no implementation (A2). For the second model, we contrasted partial implementation versus the combination of the other two (B1) and full implementation versus no implementation (B2).
Another model was used to determine if STEM PBL implementation was influenced differentially by gender and ethnicity on science performance for each level of STEM PBL implementation (see Figure 4). In the model, E1 compares the achievement of White students to the achievement of African American and Hispanic students combined, whereas E2 compares the achievement of Hispanic students to the achievement of African American students.
Contrasts isolated influence from variables having more than two levels. For this study, STEM PBL implementation and ethnicity had three levels. Table 2 contains the representations for all orthogonal contrasts in the conditional linear growth models. Note all columns sum to 0, and the sum of products for each pair of contrasts also sums to 0 (Thompson, 2006).
RESULTS
Prior to answering research questions, we used an unconditional model (see Figure 1) to determine if a linear growth model was appropriate for the data. When determining fit of a model, the χ2 value should not be statistically significant, the RMSEA should be less than .05, the CFI and TLI should be greater than .9, and SRMR should be less than .05 (Kline, 2011). In our latent linear growth model χ2 was not statistically significant (p = .216), the RMSEA was .02, the CFI and TLI were 1 and .99, and SRMR was .007. Considering these fit indices, using a latent linear growth model was appropriate. When testing model fit, the correlation between slope and intercept was calculated. The correlation value was not statistically significant (p = .964); therefore, students starting with higher scores did not necessarily differ in growth rates over the course of this study.
Different levels of STEM PBL implementation
To determine different levels of STEM PBL implementation influence on students’ achievement, we used linear growth model 1 (see Figure 3). Latent growth model 1 had two contrast variables, A1 and A2, related to STEM PBL implementation. The fit
Table 2. Orthogonal Contrasts for PBL Implementation and Student Ethnicity in the Conditional Growth Model
PBL implementation
A1 A2 B1 B2
Student ethnicity E1 E2
Full 2 0 -1 1 White 2 0
Partial
-1 1 2 0 African American
-1 1
No -1 -1 -1 -1 Hispanic -1 -1
Figure 4. Latent growth model for each level of STEM PBL implementation or school
indices for model 1 indicated χ2 was not statistically significant (p = .325), the RMSEA was .02, the CFI and TLI were .99 and .99, and SRMR was .007.
Latent linear growth model 1
For students situated in the school with full STEM PBL implementation, performance on achievement tests was statistically significantly different (p = .007) from students in schools with partial or no implementation. On average, students in the school with full implementation started 1 point higher in grade 8 than students in the other two schools. Moreover, the average score for students in grade 8 in the school with partial STEM PBL implementation was statistically significantly different (p = .002) from students who attended the school with no implementation. On average, students in the school with partial STEM PBL implementation scored about 1.2 points higher in grade 8 than students in school with no implementation. However, previous results that we had when we tested for model fit at the very beginning of data analysis indicate starting with higher or lower scores has no relationship to the growth rate (i.e., the correlation between slope and intercept was not statistically significant).
The growth rate among students in the school with full STEM PBL implementation was statistically significantly different (p = .001) from the growth rate of students in schools with partial or no STEM PBL implementation. On average, students in the school with full STEM PBL implementation had higher growth rates than all other students in all other schools. The average difference in growth rate was .27. The growth rate among students in the school with partial STEM PBL implementation was statistically different (p = .003) from students in the school with no implementation. However, the growth rate of students in the school with partial STEM PBL implementation was on average less (-.31) than the growth rate of the students in schools with no implementation.
Latent linear growth model 2
The growth rate of students in the school with full STEM PBL implementation was higher than the combination of students in schools with partial or no STEM PBL implementation. However, model 1 suggests students in the school with no STEM PBL implementation exhibited higher growth than students in the school with partial implementation; therefore, another question arose: Did students in the school with full STEM PBL implementation perform differently from students in the school with no implementation? To answer this question, we used the linear growth model 2. The growth rate of students in the school with full STEM PBL implementation was not statistically different than the rate for students in school with no implementation (p = .083).
Gender and ethnicity
To answer the second research question, we ran a separate model for each level of STEM PBL implementation (i.e., school 1, school 2, and school 3). Each model contained the contrast variables for ethnicity and the gender variables (see Figure 4). For students in the school with full STEM PBL implementation (i.e., school 1), the model exhibited a good fit (χ2 = 6.05, p = .195, RMSEA = .078, CFI = .987, SRMR = .020). Initially, at 8th grade there was no difference (p = .558) between the performance of White students compared to the performance of African American and Hispanic students and no difference (p = .831) between the performance of African American and Hispanic students. In addition, there was no difference (p = .45) between the performance of male and female students. The average yearly growth rate of White students for the three years was similar (p = .115) to the growth rate of African American and Hispanic students combined. The average yearly growth rate of African American students for the three years was similar (p = .469) to the average yearly
growth rate for the three years of Hispanic students. However, the average yearly growth rate across the three years for male students was .93 points higher than for female students (p = .036).
For students in the school with partial STEM PBL implementation (i.e., school 2), the model was a good fit (χ2 = .327, p = .988, RMSEA = 0, CFI = 1, SRMR = .004). Initially, White students performed better (p < .001) than African American and Hispanic students combined, and African American students performed lower than Hispanic students (p = .003). There was no difference in the initial performance between male and female students (p = .109). The average yearly growth rate across the three years for White students was better (p = .004) than the average yearly growth rate across the three years for both African American and Hispanic students. Our model suggests White students’ scores increased by .225 points more on an annual basis than did those of African American and Hispanic students. There was no difference in the average yearly growth rate for the three years between African American and Hispanic students (p = .923) or between genders (p = .356).
For students in the school with no STEM PBL implementation (i.e., school 3), the model exhibited a good fit (χ2 = 3.459, p = .484, RMSEA = 0, CFI = 1, SRMR = .019). Initially, White students performed better (p < .001) than African American and Hispanic students, and African American students performed lower (p = .001) than Hispanic students. However, there was no difference in the initial performance between male and female students (p = .599). There was no difference in the average yearly growth rate across the three years between White students and African American and Hispanic students (p = .875) or between African American and Hispanic students (p = .703) and no difference between the growth rates of female and male students (p = .112).
To further quantify the different levels of STEM PBL implementation influence on students’ science achievement, Cohen’s d effect size values were calculated using students’ 8th grade scores as the pretest and 11th grade scores as the posttest. In Table 3, the effect size values suggest the school with full STEM PBL implementation had a greater influence across all subcategories except for African American students. In addition, the school with partial implementation had lower effect size values across all subcategories.
DISCUSSION
Longitudinal work is difficult at best and the reason why so few published studies are longitudinal. Problems include site loss, participant attrition, and new foci imposed by schools and districts. The difference in sample size is an artifact of the longitudinal nature of the work. Urban schools experience many difficulties and one of those is a high mobility rate among students. While all the schools in the study are stable with regard to population size, they are not stable environments with regard
Table 3. Cohen’s d Effect Size Values for Student Ethnicity and Gender by School
to mobility. In some longitudinal studies they replace attrition by including students who have partial experiences so they include student scores who were there for two years and induct the third or the last two and use the first year’s scores from another school. While this method can be acceptable under certain circumstances, it was not appropriate in this study. The goal was to understand the contribution of implementation level of STEM PBL instruction to science achievement. Therefore, it is important to understand the influence on students who either experienced or did not experience it from 8th through 11th grades.
The partial implementation can be achieved in many ways and through various pedagogies. However, the use of the observation instrument qualified the level of implementation. A partial implementation indicated that teachers addressed some of the aspects well but could have completely ignored others. They also could have occasionally used STEM PBL lessons as designed at the school and used their read and complete worksheets for the remainder of the time. However, what is known is that they did not meet the bar for a full implementation.
Using the STEM PBL observation form ensures that practices aligned with STEM PBL are recorded. Other pedagogical practices related to STEM PBL like Inquiry, Problem Based Learning, and Embodied Cognition, share many aspects and those practices would have resulted in moving the no STEM PBL group into a partial implementation. So what we know about the no STEM PBL group is that their implementation was not related to STEM PBL, Inquiry, Problem Based Learning, or Embodied Cognition or any other pedagogical practices related to these. The most common practice used was ready and complete worksheets that students work on individually. In select situations the worksheets were discussed and students were given the opportunity to correct their answers. These teachers characterized their practices as aligned with preparing students for success on the high stakes tests.
The results provide three important insights into student science performance in the presence of STEM PBL. First, students who experienced the full STEM PBL implementation had the greatest effects across ethnicity and gender. From the finding that there was no difference in growth rates for these students across ethnicity and gender indicates that STEM PBL, at full implementation, provides important positive learning across all measured stakeholders in the school. These findings are aligned with several other studies that indicate that fully implementing an innovative instruction showed positive growth across student stakeholders (Han, Capraro, & Capraro, 2015; Navruz, Erdogan, Bicer, Capraro, & Capraro, 2015; Han, Yalvac, Capraro, & Capraro, 2015). White and male students experienced the greatest effects from STEM PBL. This adds to the literature where females were shown to have experienced greater increases in mathematics performance from STEM PBL (Capraro, Capraro, & Oner, 2011). Consistency and fidelity of implementation have been important factors in assessing the merits of any innovation (Dusenbury, Brannigan, Falco, & Hansen, 2003; Gearing, El-Bassel, Ghesquiere, Baldwin, Gillies, & Ngeow, 2011; Muller, Stage, & Kinzie, 2001; O’Donnell, 2008; Penuel, & Means, 2004). To understand the potential benefits of any innovation it is important to examine full implementations over other possible cases. Because any new innovation almost always requires teachers to do new things and to re-conceptualize teaching practices dissonance can creep into and mediate results. Therefore, understanding what a partial implementation and null implementation offer students are paramount. Because the STEM field is in a state of transition and transformation there is little literature to base important school and district decisions.
Partial implementations can result when teachers attempt to merge aspects of a new program or innovation with previous ones that they feel comfortable using or when they resist the new innovation. Regardless of how the partial implementation occurs, the dissonance and complexity of combining programs can create “noise” in the learning environment that impacts students subtly but measurable ways. For
example, the effects for students were respectable for White students but unremarkable for all other stakeholders and the most problematic was a slightly negative growth rate. The growth rate for students who experienced the full implementation was .27, but -.31 for students who experienced the partial implementation for a difference of .58 in average annual performance. Overtime, this difference will create disparities that might be evidenced in limited post secondary opportunities.
The no STEM PBL implementation was strong with positive and respectable effects. Growth rates were similar to the STEM PBL group. The overall, effects were less, except for African Americans. It is not clear why African American students might have experienced greater effect from the no STEM PBL school or what aspect of the STEM PBL implementation failed evoke better results. It is possible that initial differences in the groups could be responsible. However, the effects for both schools with African Americans indicate that they performed well and that there were measureable learning differences.
The implications for district and school administrators and teachers are straightforward. Partial implementations are not useful for improving student learning in meaningful ways. The partial implementation was not as good as the status quo. Therefore, picking the best or favored aspects of multiple programs do not yield important gains at least as measured by state high stakes tests. Doing whatever has been going on provided better results than a less than full implementation; however, student outcomes were clearly lower. Students in the full STEM PBL implementation school were better situated for college or university admittance.
The issue of gender differences in science continues to be a point of discussion (Bruschi & Anderson, 1994; Weinburgh, 1995). In this study, we found no gender gap for students in schools with partial or no STEM PBL implementation. In these schools, both female and male students were as likely to be successful. In school with full STEM PBL implementation, male students were more likely to perform better than their female counterparts. Given the disparity in males and females more should be done to improve female achievement in science. While they started lower, there was greater room for growth. However, an important mediator of learning is prior knowledge. It is possible that males simply had deeper or more robust prior knowledge on which to build and that head start afforded the huge gains (more than ¾ of a standard deviation) in the full STEM PBL implementation school. Females gained just over a ½ standard deviation that is large by educational research standards but still represents a gender gap. When you compare the performance gains for females who were in the no STEM PBL school to the full STEM PBL implementation school, they had greater gains.
REFERENCES
Augustine, N. R. (2005). Rising above the gathering storm: Energizing and employing America for a brighter economic future. Washington, DC: The National Academies Press.
Ball, D. L., & Cohen, D. K. (1999). Developing practice, developing practitioners: Toward a practice-based theory of professional education. In G. Sykes & L. Darling-Hammond (Eds.), Teaching as the learning profession: Handbook of policy and practice (pp. 3-32). San Francisco: Jossey-Bass.
Berman, P., & McLaughlin, M. W. (1976). Implementation of educational innovation. The Educational Forum, 40(3), 345-370.
Berman, P., & McLaughlin, M. W. (1978). Federal programs supporting educational change: Implementing and sustaining innovations (Vol. VIII). Santa Monica, CA: Rand Corp.
Birman, B. F., Desimone, L., Porter, A. C., & Garet, M. S. (2000). Designing professional development that works. Educational Leadership, 57(8), 28-33.
Bransford, J. D., Brown, A. L., & Cocking, R. R. (Eds.). (2000). How people learn: Brain, mind, experience, and school: Expanded edition. Washington, DC: The National Academies Press.
Brewer, M. B. (2000). Research design and issues of validity. In H. T. Reis & C. M. Judd (Eds.), Handbook of research methods in social and personality psychology (pp. 3-16). Cambridge, UK: Cambridge University Press.
Bruschi, B. A., & Anderson, B. T. (1994, February). Gender and ethnic differences in science achievement of nine-, thirteen-, and seventeen-year-old students. Paper presented at the annual meeting of the Eastern Educational Research Association, Sarasota, FL.
Campbell, D. T. (1957). Factors relevant to the validity of experiments in social settings. Psychological Bulletin, 54(4), 297.
Capraro, R. M., Capraro, M. M., & Morgan, J. (2013). Project based learning: An integrated science technology engineering and mathematics (STEM) approach (2nd edition). Rotterdam, The Netherlands: Sense Publishers.
Capraro, M. M., Capraro, R. M., & Oner, A. T. (2011, November). Observations of STEM PBL teachers and their student scores. Paper presented at the annual meeting of the School Science and Mathematics Association, Colorado Springs, CO.
Capraro, R. M., & Slough, S. W. (2008). Project based learning: An integrated science technology engineering and mathematics (STEM) approach. Rotterdam, The Netherlands: Sense Publishers.
Carini, R. M., Kuh, G. D., & Klein, S. P. (2006). Student engagement and student learning: Testing the linkages. Research in Higher Education, 47(1), 1-32.
Dusenbury, L., Brannigan, R., Falco, M., & Hansen, W. B. (2003). A review of research on fidelity of implementation: Implications for drug abuse prevention in school settings. Health Education Research, 18(2), 237-256.
Erdogan, N., & Bozeman, D. (2015). Models of project-based learning for the 21st century. In A. Sahin (Ed.), A practice-based model of STEM teaching: STEM students on the stage (S.0.S.) (p. 31-42). Netherlands: Sense Publishers.
Erdogan, N., Corlu, M. S., & Capraro, R. M. (2013). Defining innovation literacy: Do robotics programs help students develop innovation literacy skills? International Online Journal of Educational Sciences, 5(1), 1-9.
Erdogan, N., & Stuessy, C. L. (2015a). Modeling successful STEM high schools in the United States: An ecology framework. International Journal of Education in Mathematics, Science and Technology, 3(1), 77-92.
Erdogan, N., & Stuessy, C. L. (2015b). Examining inclusive STEM schools’ role in the college and career readiness of students in the United States: A multi-group analysis of students’ achievement outcomes. Educational Sciences: Theory & Practice, 15(6), 1517-1529. DOI: 10.12738/estp.2016.1.0072
Fan, X. (2001). Parental involvement and students’ academic achievement: A growth modeling analysis. The Journal of Experimental Education, 70, 27-61.
Fan, X. (2003). Power of latent growth modeling for detecting group differences in linear growth trajectory parameters. Structural Equation Modeling, 10, 380-400.
Feiman-Nemser, S. (2001). From preparation to practice: Designing a continuum to strengthen and sustain teaching. The Teachers College Record, 103(6), 1013-1055.
Fleischman, H. L., Hopstock, P. J., Pelczar, M. P., & Shelley, B. E. (2010). Highlights from PISA 2009: Performance of U.S. 15-year-old students in reading, mathematics, and science literacy in an international context (NCES 2011-004). U.S. Department of Education, National Center for Education Statistics. Washington, DC: U.S. Government Printing Office.
Fullan, M. (2005). Leadership & sustainability: System thinkers in action. Thousand Oaks, CA: Corwin Press.
Gearing, R. E., El-Bassel, N., Ghesquiere, A., Baldwin, S., Gillies, J., & Ngeow, E. (2011). Major ingredients of fidelity: A review and scientific guide to improving quality of intervention research implementation. Clinical Psychology Review, 31(1), 79-88.
Gersten, R., Chard, D., & Baker, S. (2000). Factors enhancing sustained use of research-based instructional practices. Journal of Learning Disabilities, 33(5), 445-457.
Guskey, T. R. (1986). Staff development and the process of teacher change. Educational Researcher, 15(5), 5-12.
Guskey, T. R. (2002). Professional development and teacher change. Teachers and Teaching: Theory and Practice, 8(3), 381-391.
Han, S., Capraro, R., & Capraro, M. M. (2015). How science, technology, engineering, and mathematics (STEM) project-based learning (PBL) affects high, middle, and low
achievers differently: The impact of student factors on achievement. International Journal of Science and Mathematics Education, 13(5), 1089-1113.
Han, S., Yalvac, B., Capraro, M. M., & Capraro, R. M. (2015). In-service teachers’ implementation and understanding of STEM project based learning. Eurasia Journal of Mathematics, Science & Technology Education, 11(1), 63-76.
Heubert, J. P., & Hauser, R. M. (Eds.). (1998). High stakes: Testing for tracking, promotion, and graduation. Washington, DC: National Academies Press.
Huberman, A. M., & Miles, M. B. (1984). Innovation up close: How school improvement works. New York: Plenum Press.
Johnson, C. C., Kahle, J. B., & Fargo, J. D. (2006). A study of the effect of sustained, whole-school professional development on student achievement in science. Journal of Research in Science Teaching, 44(6), 775-786.
Joint Economic Committee Chairman’s Staff Senator Bob Casey, Chairman. (2012). STEM Education: Preparing for the jobs of the future. U.S. Congress Joint Economic Committee, Washington, DC.
Jones, B. F., Rasmussen, C. M., & Moffitt, M. C. (1997). Real-life problem solving: A collaborative approach to interdisciplinary learning. Washington, DC: American Psychological Association.
Kennedy, M. M. (1991). Implications for teaching. In E. A. Ramp & C. S. Pederson (Eds.), Follow through: Program and policy issues (pp. 57-71). Washington, DC: U.S. Department of Education, Office of Education Research and Improvement.
Kline, R. B. (2011). Principles and practice of structural equation modeling. New York: The Guilford Press.
Kuh, G. D. (2001). Assessing what really matters to student learning inside the national survey of student engagement. Change: The Magazine of Higher Learning, 33(3), 10-17.
Linnenbrink, E. A., & Pintrich, P. R. (2003). The role of self-efficacy beliefs in student engagement and learning in the classroom. Reading & Writing Quarterly, 19(2), 119-137.
Little, J. W. (1993). Teachers’ professional development in a climate of educational reform. Educational Evaluation and Policy Analysis, 15(2), 129-151.
McLaughlin, M. W. (1990). The Rand change agent study revisited: Macro perspectives and micro realities. Educational Researcher, 19(9), 11-16.
McLaughlin, M. W. (1994). Strategic sites for teachers’ professional development. In P. P. Grimmett & J. Neufeld (Eds.), Teacher development and the struggle for authenticity: Professional growth and restructuring in the context of change (pp. 31-51). New York: Teachers College Press.
Muller, P. A., Stage, F. K., & Kinzie, J. (2001). Science achievement growth trajectories: Understanding factors related to gender and racial–ethnic differences in precollege science achievement. American Educational Research Journal, 38(4), 981-1012.
Muthén, L. K., & Muthén, B. O. (1998-2012). Mplus user’s guide (7th ed.). Los Angeles, CA: Muthén & Muthén.
National Commission on Teaching and America’s Future. (1996). What matters most: Teaching for America’s future. New York: Author.
National Science Board. (2012). Science and engineering indicators 2012 (NSB 12-01). Arlington, VA: National Center for Science and Engineering Statistics.
National Research Council. (2011). Successful K-12 STEM education: Identifying effective approaches in science, technology, engineering, and mathematics. Committee on Highly Successful Science Programs for K-12 Science Education. Board on Science Education and Board on Testing and Assessment, Division of Behavioral and Social Sciences and Education. Washington, DC: The National Academies Press.
Navruz, B., Erdogan, N., Bicer, A., Capraro, R. M., & Capraro, M. M. (2014). Would a STEM school ‘by any other name smell as sweet’?. International Journal of Contemporary Educational Research, 1(2), 67-75.
O’Donnell, C. L. (2008). Defining, conceptualizing, and measuring fidelity of implementation and its relationship to outcomes in K–12 curriculum intervention research. Review of Educational Research, 78(1), 33-84.
Paik, S., Zhang, M., Lundeberg, M. A., Eberhardt, J., Shin, T. S., & Zhang, T. (2011). Supporting science teachers in alignment with state curriculum standards through professional development: Teachers’ preparedness, expectations, and their fulfillment. Journal of Science Education and Technology, 20(4), 422-434.
Penuel, W. R., & Means, B. (2004). Implementation variation and fidelity in an inquiry science program: Analysis of GLOBE data reporting patterns. Journal of Research in Science Teaching, 41(3), 294-315.
Provasnik, S., Kastberg, D., Ferraro, D., Lemanski, N., Roey, S., & Jenkins, F. (2012). Highlights from TIMSS 2011: Mathematics and science achievement of U.S. fourth- and eighth-grade students in an international context (NCES 2013-009). Washington, DC: National Center for Education Statistics, Institute of Education Sciences, U.S. Department of Education.
Rampey, B. D., Dion, G. S., & Donahue, P. L. (2009). NAEP 2008: Trends in Academic Progress (NCES 2009-479). Washington, DC: National Center for Education Statistics, Institute of Education Sciences, and U.S. Department of Education.
Schmidt, W. H. (2011, May). STEM reform: Which way to go? Paper prepared for the National Academies Board on Science Education and Board on Testing and Assessment for “Highly Successful STEM Schools or Programs for K-12 STEM Education: A Workshop,” Washington, DC.
Slough, S. W., & Milam, J. O. (2008). Theoretical framework for STEM project-based learning. In R. M. Capraro & S. W. Slough (Eds.), Project based learning: An integrated science technology engineering and mathematics (STEM) approach, (pp. 19-37). Rotterdam, The Netherlands: Sense Publishers.
Smylie, M. A. (1988). The enhancement function of staff development: Organizational and psychological antecedents to individual teacher change. American Educational Research Journal, 25(1), 1-30.
Stearns, L. M., Morgan, J., Capraro, M. M., & Capraro, R. M. (2012). A teacher observation instrument for PBL classroom instruction. Journal of STEM Education: Innovations and Research, 13(3), 7-16.
Supovitz, J. A., & Turner, H. M. (2000). The effects of professional development on science teaching practices and classroom culture. Journal of Research in Science Teaching, 37(9), 963–980.
Talbot-Smith, M., Abell, S. K., Appleton, K., & Hanuscin, D. L. (Eds.). (2013). Handbook of research on science education. New York: Routledge.
Texas Education Agency. (2014). Texas assessment of knowledge and skills (TAKS) resources. Retrieved from http://www.tea.state.tx.us/student.assessment/taks/
Thomas, J. W., Mergendoller, J. R., & Michaelson, A. (1999). Project-based learning: A handbook for middle and high school teachers. Novato, CA: The Buck Institute for Education.
Thompson, B. (1984). Canonical correlation analysis: Uses and interpretation. Newbury Park, CA: Sage.
Thompson, B. (2006). Foundations of behavioral statistics: An insight based approach. New York, NY: The Guilford Press.
Weinburgh, M. (1995). Gender differences in student attitudes toward science: A meta-analysis of the literature from 1970 to 1991. Journal of Research in Science Teaching, 32(4), 387-398.