Contents Why Run a VoIP Readiness Assessment? ............................... 2 How the VoIP Quality Assessment Is Performed ........ 3 What You Need to Know about VoIP............................................. 5 Factors Included in Call Quality Estimation.................... 9 Design the VoIP Quality Assessment............................... 12 Schedule the VoIP Quality Assessment............................... 14 Verify and Run the VoIP Quality Assessment................ 15 Vivinet Assessor Reports....... 15 Analyzing Results................... 16 Summary................................... 17 Copyright Information........... 19
Doing a VoIP Assessment with VivinetTM Assessor by Susan Pearsall and John Q. Walker, NetIQ Corporation
Deploying Voice over IP (VoIP) successfully in an enterprise data network may have some unexpected pitfalls. In previous papers, we’ve examined key planning and design tips to help you avoid some of the frustrations associated with a failed or flawed VoIP implementation [1, 2]. This paper describes how to determine whether a data network is ready to run VoIP traffic well.
VivinetTM Assessor, by NetIQ Corporation, is part of a suite of products designed to test, evaluate, monitor, and manage multi-protocol and multi-platform data networks. Vivinet Assessor evaluates the network performance metrics that influence the quality of VoIP calls on a data network.
Even when they’re carried on the same net-work, voice traffic and data traffic can’t be handled the same way.
• They have different packet sizes. • They are sent at different rates. • They are buffered and delivered to the
application differently. • They must fulfill very different user
expectations. Although an e-mail message or a file transfer can be delayed by half an hour without excit-ing anyone’s notice, delays of a few hundred milliseconds can ruin a VoIP telephone call. Because everyone’s used to the near-perfect call quality delivered by the Public Switched Telephone Network (PSTN), VoIP phone users won’t tolerate even a modest amount of delay; once you roll out VoIP, they’ll complain that the quality of their phone calls is dismal even if network performance is pretty good.
When you start to run VoIP across any given enterprise network, delays caused by other applications, overloaded routers, or faulty switches may be inevitable. To help you avoid the headaches associated with poor VoIP performance, Vivinet Assessor is designed to:
• Assess VoIP readiness, determining whether an existing data network is ready to deliver quality VoIP calls in its current configuration.
• Evaluate VoIP call quality over the course of a few days, running hundreds or even thousands of simulated calls over the network and taking measurements.
Vivinet Assessor monitors the routers, switches, and WAN links on a given network to determine their present utilization rates. It assigns them a VoIP Readiness Rating indicating whether upgrades are needed before the additional VoIP packets are added to the mix. In addition, it sends simulated VoIP traffic between pre-selected points on a network for a period of time you select. While the simulated calls are running, Vivinet Assessor takes measurements and calculates call quality scores. Vivinet Assessor reports quantify the data collected over the course of the assessment to help determine a network’s readiness and capacity for handling real VoIP traffic.
Why Run a VoIP Readiness Assessment? If you’re thinking about implementing VoIP or expanding the use of VoIP applications, you’re probably uncertain whether an existing network is ready to carry high-quality voice transmissions.
Organizations often deploy VoIP to lower telecommunications costs, by switching voice traffic to underutilized WAN and LAN links. However, it’s unlikely that a typical data network is configured to handle VoIP traffic well. Gartner, Inc. recently observed that 85% of today’s router-based networks are not ready to support high-quality VoIP traffic [3]. Voice traffic is uniquely time-sensitive. It can’t be queued, and if datagrams are lost, the conversation will be choppy or even incom-prehensible. NAT-enabled firewalls, slow or congested links, or improperly implemented QoS schemes are just a few of the factors that could inhibit or even prevent VoIP traffic from crossing a data network in an acceptable form.
A Vivinet Assessor VoIP Readiness Assessment is designed to quantify current network load and assign a quality score to VoIP traffic traveling across the network. Such measurements provide information that can’t be gleaned from a pilot that simply uses an IP PBX and a few dozen IP phones [4]. Therefore, the assessment is conducted right on the network where VoIP will soon be deployed.
By the end of a VoIP Readiness Assessment, you know which technical factors are affecting call quality. Most important, you get these answers before you’ve spent a lot of money, time, and energy on a VoIP deployment. You can work through all the data network issues in advance so that by the time you actually start running the real VoIP piece of it, you have a data network that inspires confidence. You can also make cost-effective decisions about network infrastructure upgrades and application traffic once you know more about current utilization and can gauge how well voice over IP will perform.
What’s Involved in a VoIP Readiness Assessment? In compiling a VoIP Readiness Assessment, Vivinet Assessor performs four different assessment tasks:
• Network Inventory: Scans your network to discover routers, switches, and links. Devices are queried, and their configuration data is added to the database.
• Utilization Monitoring: Monitors discovered network devices and links to determine their current CPU, memory, and bandwidth utilization, plus other significant metrics.
• Bandwidth Modeling: Compares VoIP usage scenarios to estimate the call capacity of the network links you’ve been monitoring.
• VoIP Quality Assessment: Determines how well VoIP will perform on your network by measuring simulated VoIP traffic and calculating Call Quality based on a Mean Opinion Score (MOS).
With the Network Inventory, you can populate the assessment database with information about the devices already running on the network. Then you can assess their VoIP Readiness during the Utilization assessment, and analyze their bandwidth requirements by performing Bandwidth Modeling.
Each assessment type allows for customization to suit a particular network’s unique VoIP deployment. For example, the Network Inventory and Utilization assessment are conducted only within the IP subnets you select. Once a router, switch, or WAN link is discovered, you can edit the data used to identify it in the assessment database. And you determine the thresholds used to assign VoIP Readiness Ratings to network devices and WAN links. You can set a particular measurement threshold, such as router buffer utilization, a bit higher to create a more forgiving standard for VoIP Readiness.
When you’re setting up a VoIP Quality assessment, you can use pre-configured defaults for typical VoIP system parameters. For example, the defaults for VoIP packet sizes are derived from industry-standard equipment settings. Or you can tune these parameters to see how various technical choices affect call quality and bandwidth consumption. You can, for example, examine the effects of a half-dozen codecs representing various compression algorithms; you can also tinker with jitter buffer sizes, delay between datagrams, and silence suppression. Each configuration choice you make is reflected in the simulated traffic that Vivinet Assessor generates.
From the simulated VoIP flows, the assessment software measures delay, jitter, and lost data. Vivinet Assessor then calculates quality scores, assigns Readiness Ratings, and produces a comprehensive report of overall VoIP Readiness. The report shows network utilization and call quality by day of the week, hour of the day, location, codec, and so on.
How the VoIP Quality Assessment Is Performed During the assessment of VoIP Quality, Vivinet Assessor determines how well voice over IP will sound on a network by assessing the quality of simulated VoIP calls. To assess call quality, Vivinet Assessor sends realistic VoIP traffic across the network and measures the resulting flows.
Vivinet Assessor relies on NetIQ Performance Endpoints, agents that are installed on every computer you plan to include in assessments. You deploy a Performance Endpoint or two at every site where there would be VoIP traffic. A small location would get one agent to measure WAN links; a larger site might have two agents: one at the edge to measure the WAN link, and another across the campus or building, to measure traffic internal to the site. Although you can distribute endpoints anywhere on a network, including at remote sites, you don’t have to visit those sites to find out how well VoIP is performing there.
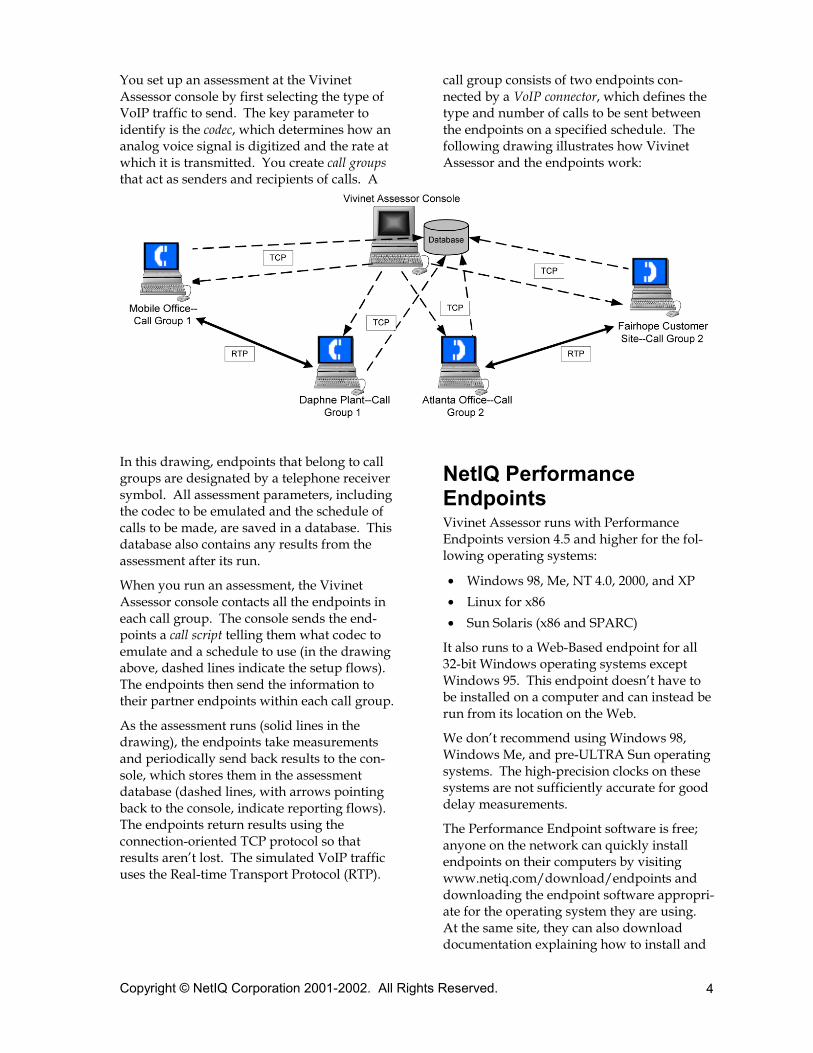
You set up an assessment at the Vivinet Assessor console by first selecting the type of VoIP traffic to send. The key parameter to identify is the codec, which determines how an analog voice signal is digitized and the rate at which it is transmitted. You create call groups that act as senders and recipients of calls. A
call group consists of two endpoints con-nected by a VoIP connector, which defines the type and number of calls to be sent between the endpoints on a specified schedule. The following drawing illustrates how Vivinet Assessor and the endpoints work:
In this drawing, endpoints that belong to call groups are designated by a telephone receiver symbol. All assessment parameters, including the codec to be emulated and the schedule of calls to be made, are saved in a database. This database also contains any results from the assessment after its run.
When you run an assessment, the Vivinet Assessor console contacts all the endpoints in each call group. The console sends the end-points a call script telling them what codec to emulate and a schedule to use (in the drawing above, dashed lines indicate the setup flows). The endpoints then send the information to their partner endpoints within each call group.
As the assessment runs (solid lines in the drawing), the endpoints take measurements and periodically send back results to the con-sole, which stores them in the assessment database (dashed lines, with arrows pointing back to the console, indicate reporting flows). The endpoints return results using the connection-oriented TCP protocol so that results aren’t lost. The simulated VoIP traffic uses the Real-time Transport Protocol (RTP).
NetIQ Performance Endpoints Vivinet Assessor runs with Performance Endpoints version 4.5 and higher for the fol-lowing operating systems:
• Windows 98, Me, NT 4.0, 2000, and XP • Linux for x86 • Sun Solaris (x86 and SPARC)
It also runs to a Web-Based endpoint for all 32-bit Windows operating systems except Windows 95. This endpoint doesn’t have to be installed on a computer and can instead be run from its location on the Web.
We don’t recommend using Windows 98, Windows Me, and pre-ULTRA Sun operating systems. The high-precision clocks on these systems are not sufficiently accurate for good delay measurements.
The Performance Endpoint software is free; anyone on the network can quickly install endpoints on their computers by visiting www.netiq.com/download/endpoints and downloading the endpoint software appropri-ate for the operating system they are using. At the same site, they can also download documentation explaining how to install and
deploy endpoints for all the operating systems supported.
You can also download the endpoints and make them available on a shared network drive. Or you can distribute them via SMS, Microsoft’s Systems Management Server.
A single endpoint can participate in about 100 simultaneous VoIP calls without sacrificing call quality. (We tested using an endpoint running with Windows 2000 SP1 on an 800 MHz Pentium III with 256 MB of RAM.)
Score Calculation Vivinet Assessor calculates call quality based on a set of factors known to affect the perceived quality of voice over IP transmissions. A subjective factor is necessarily part of evaluating VoIP because a listener must be able to understand the received transmission, and both talkers must be able to tolerate the amount of delay between speaking and being heard (called “the walkie-talkie effect”), lost or fractured syllables, and echo that often impede the conversation.
That’s why the chief unit of measurement for call quality in Vivinet Assessor results is an es-timated Mean Opinion Score, or MOS. The E-model, ITU Standard G.107 [5], quantifies what is essentially a subjective judgment: a user’s opinion of the perceived quality of a voice transmission. After much study, the ITU determined which impairment factors pro-duced the strongest user perceptions of lower quality. The E-model thus includes factors for equipment and impairments and takes into account typical users’ perceptions of voice transmissions.
Vivinet Assessor uses the components of the E-model along with the following factors to calculate the MOS:
Delay Delayed datagrams are perhaps the single greatest hindrance to VoIP call quality. This value includes all causes of delay between the endpoints.
Jitter Jitter, or variations in datagram inter-arrival times, affects call quality. Exces-sive jitter reduces call clarity and exacerbates datagram loss.
Lost Data When a datagram is lost, you can lose an entire syllable, and the more datagrams that are lost, the more the clarity suffers.
Vivinet Assessor reports also show how many calls could not be completed (“Unavailable” calls) and give you the objective measure-ments of delay, jitter, and lost data so you can independently judge quality for yourself.
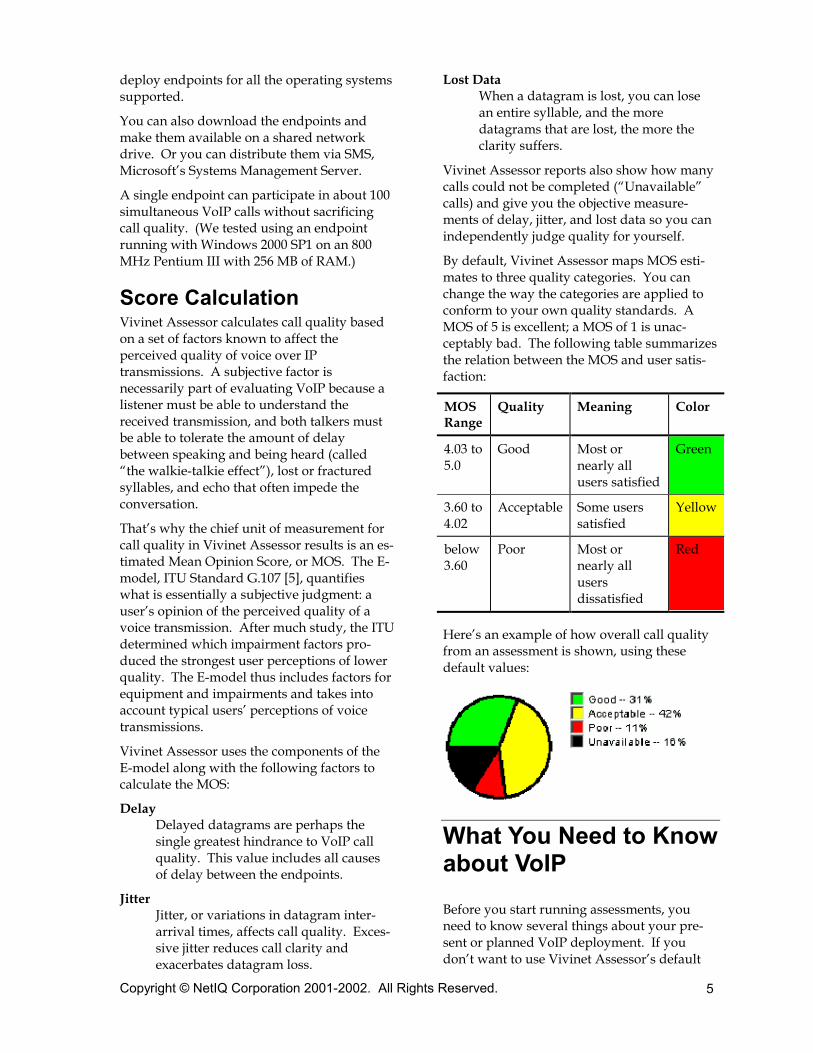
By default, Vivinet Assessor maps MOS esti-mates to three quality categories. You can change the way the categories are applied to conform to your own quality standards. A MOS of 5 is excellent; a MOS of 1 is unac-ceptably bad. The following table summarizes the relation between the MOS and user satis-faction:
MOS Range
Quality Meaning Color
4.03 to 5.0
Good Most or nearly all users satisfied
Green
3.60 to 4.02
Acceptable Some users satisfied
Yellow
below 3.60
Poor Most or nearly all users dissatisfied
Red
Here’s an example of how overall call quality from an assessment is shown, using these default values:
What You Need to Know about VoIP Before you start running assessments, you need to know several things about your pre-sent or planned VoIP deployment. If you don’t want to use Vivinet Assessor’s default
settings, you might want to set or select the following Vivinet Assessor parameters to run simulated voice traffic on an IP network that closely resembles the real VoIP traffic you’ll be running:
• Seven different codecs, with different compression algorithms, data rates, and datagram sizes.
• Whether packet loss concealment (PLC) is enabled for the G.711 codecs.
• Voice datagram sizes. • The ability to use silence suppression. • A jitter buffer and its size. • Any additional, fixed delay values that
apply. • Quality of Service (QoS).
Let’s look at each of these parameters in detail.
Codecs In audio processing, a codec (which stands for “compressor/decompressor”) is the hardware or software that samples the sound and de-termines the data rate. There are dozens of available codecs, each with different charac-teristics. Vivinet Assessor lets you perform voice over IP assessments using seven call scripts representing the six most common codecs.
Codecs have odd-looking names that correspond to the name of the ITU standard that describes their operation. The codecs named G.711u and G.711a convert from analog to digital and back with high quality. To do this, however, takes a fair amount of bandwidth.
The lower-speed codecs, G.726-32, G.729, G.729A, and those in the G.723.1 family, consume less network bandwidth. Low speed codecs impair the quality of the audio signal much more than high-speed codecs, however, because they compress the signal with lossy compression. Fewer bits are sent, so the
receiving side does its best to approximate what the original signal sounded like.
Packet loss concealment (PLC) is an addi-tional option if you’re using the G.711u or G.711a codecs. PLC techniques reduce or mask the effects of data loss during a VoIP conversation. When PLC is enabled, Vivinet Assessor assumes that the quality of the con-versation would be improved; this improve-ment is factored into the MOS estimate calculation if any data is lost. PLC makes the codec itself more expensive to manufacture, but does not otherwise add delay or have other bad side-effects. If the VoIP equipment you plan to purchase uses PLC, be sure to enable it in your assessment.
In the table of codecs on the next page, the “Packetization Delay” column refers to the delay a codec introduces as it converts a signal from analog to digital. Packetization delay is included in the MOS estimate, as is the “jitter buffer delay,” the delay introduced by the effects of buffering to reduce inter-arrival delay variations.
Real bandwidth consumption by VoIP calls is higher that it first appears. The G.729 codec, for example, has a data payload rate of 8 kbps. Its actual bandwidth usage is higher than this, though. When sent at 20 ms intervals, its pay-load size is 20 bytes per datagram. To this, add the 40 bytes of RTP header (yes, the header is bigger than the payload) and any additional layer 2 headers. For example, Ethernet adds 18 more bytes. Also, there are two concurrent G.729 RTP flows (one in each direction), so double the bandwidth con-sumption you’ve calculated so far. The “Combined Bandwidth” column in the table shows a truer picture of actual bandwidth usage for some common codecs.
It’s worth observing that both G.723.1 codecs in the table below make calls of only “Acceptable” quality, at best. Their theoretical maximum MOS is below the 4.03 value needed to be considered “Good” quality.
G.711u 64.0 kbps 20 ms 1.0 ms 174.40 kbps 2 datagrams (40 ms)
4.40
G.711a 64.0 kbps 20 ms 1.0 ms 174.40 kbps 2 datagrams (40 ms)
4.40
G.726 32.0 kbps 20 ms 1.0 ms 110.40 kbps 2 datagrams (40 ms)
4.22
G.729; G.729A
8.0 kbps 20 ms 25.0 ms 62.40 kbps 2 datagrams (40 ms)
4.07
G.723.1 MPMLQ
6.3 kbps 30 ms 67.5 ms 43.73 kbps 2 datagrams (60 ms)
3.87
G.723.1 ACELP
5.3 kbps 30 ms 67.5 ms 41.60 kbps 2 datagrams (60 ms)
3.69
Determining Payload Sizes Each call script lets you “Override delay between voice datagrams.” This option is recommended only for advanced users, and it’s not likely you’ll need to set it. However, here’s an explanation of what happens when you choose to override the delay associated with the codec you’re using:
The delay between datagrams determines the payload size to be used in the simulated VoIP calls. VoIP applications break voice data into chunks based on the amount of time between successive datagrams. Each call script uses a value appropriate to its codec: the faster codecs use 20 ms and the G.723.1 codecs use 30 ms. This means, for example, that every 20 milliseconds, the VoIP application adds a header to any voice data it has received and sends the datagram. Smaller times mean that the header-to-payload ratio is larger: more, smaller datagrams are sent, which increases processing overhead. Longer times mean that fewer, larger datagrams are sent.
Unless you’re an equipment manufacturer, you’re better off leaving the datagram sizes at their default values. These values were selected because they match those of the codec being emulated and allow for realistic simula-tion of VoIP datagrams.
Some VoIP equipment manufacturers refer to the delay between voice datagrams as the “speech packet length.” For example, at 64
kbps, a “20 millisecond speech packet” implies that the sending side creates a 160-byte data-gram payload every 20 ms. A simple equation relates the codec speed, the delay between voice packets, and the datagram payload size:
Datagram payload size (in bytes) =
Codec speed (bits/sec) x packet delay (ms)-------------------------------------------
8 (bits/byte) x 1000 (ms/sec)
In this case: 160 bytes = (64000 x 20)/8000
For a given data rate, increasing the delay in-creases the datagram size, since datagrams are sent less frequently. A packet delay of 30 ms at a data rate of 64000 bps would mean sending 240-byte datagrams.
Silence Suppression Call scripts have the option to include silence suppression. Performed by the codec, VoIP silence suppression means that no data is sent on the network during periods of call silence (that is, when no one is talking during the call). If you set were to set the silence suppression option to use a voice activity rate of 50%, it means that data is being sent during 50% of the simulated call’s duration.
When doing your initial assessments, we recommend turning silence suppression off, to provide a more intense assessment of the network. This lets you see behavior in the
worst case, where there’s a lot of concurrent back-and-forth talking. To do this, set the voice activity rate to 100%.
Jitter Buffers To minimize call disruptions from delay and jitter, VoIP phones and gateways typically use jitter buffers. A jitter buffer can be either frame-based or absolute: a frame-based jitter buffer will hold a given number of voice data-grams, while an absolute jitter buffer is based on time. For example, a frame-based jitter buffer might hold 2 datagrams, buffering them until a segment of the voice transmission can be reassembled to reduce inter-arrival time variability. An absolute jitter buffer, on the other hand, might be set to 43 ms, and given a typical 20 ms speech frame size, could hold 2 speech frames and allow for an extra 3 milliseconds of variability.
It’s in the nature of IP networks to exact a tradeoff. Buffering adds delay while smooth-ing out variability; therefore, adding delay can offset the positive effects of using jitter buffers. A goal of VoIP network tuning is to minimize jitter buffer sizes while maintaining call quality.
By default, all VoIP assessments emulate a frame-based jitter buffer of 2 datagrams. You can configure buffers based either on time (in milliseconds) or on number of datagrams. The supported range of values is 10-1600 ms for an absolute jitter buffer, and 1-8 for a buffer configured in number of voice data-grams.
Vivinet Assessor’s jitter buffer doesn’t smooth out jitter. Instead, it provides a more accurate MOS estimate by better accounting for data-grams that would have been lost due to underrun or overrun of the jitter buffer. In addition, the delay incurred by using a jitter buffer is factored into the MOS.
We suggest doing your initial VoIP assess-ments with jitter buffer sizes that match those being used in your planned VoIP equipment, if that information is known.
Additional Fixed Delay This parameter lets you add a delay value to each VoIP call. Any fixed delay that you add here should come from a known, constant source. For example, if you’re emulating equipment that adds 10 milliseconds of delay to each VoIP datagram sent, enter 10 ms. The range of accepted values is 0 to 300 ms.
Quality of Service Using a prioritization or QoS scheme can make a noticeable difference in call quality, particularly if you’re running VoIP on a crowded enterprise network. Vivinet Assessor’s optional QoS parameter applies the QoS used in typical VoIP implementations to the simulated VoIP traffic. Generally speaking, VoIP QoS means that each voice datagram
• is assigned a priority that makes it unlikely to be queued or dropped, or
• is flagged to receive the lowest possible delay.
When you select QoS, Vivinet Assessor lets you choose an IP TOS, a DiffServ, or an 802.1P prioritizing scheme. The DiffServ and TOS schemes set the IP Type of Service (TOS) precedence bits in the IP header, using the “CRITIC/ECP” setting. These same bits are known as the Expedited Flow (EF) setting in the Differentiated Services (DiffServ) standard [6,7]. When routers read the bit settings, they prioritize the packets accordingly. By contrast, 802.1P creates a set of priority levels that operate at Layer 2 of the OSI model. The NIC cards themselves must set the bits. Unfortunately, neither the NIC card support nor the setting of the DiffServ or TOS bits is available by default on many networks. Check documentation for the endpoint oper-ating systems, as well as for the NIC cards, routers, and switches in the network, to make sure the setting of these bits is supported and that the prioritization will be honored.
If you haven’t yet tried applying QoS to VoIP traffic, you might want to set up a few call groups that use QoS and a few that don’t. Depending on the routers’ ability to process requests for QoS, you should see a difference in the groups’ MOS values when you compare the results.
Factors Included in Call Quality Estimation Once a VoIP Quality assessment has run, you can generate two different reports of the results: an Executive Summary Report, and a Complete Report. Each report gives an overall assessment of call quality for the entire network; the Complete Report adds the individual results for each call group.
To determine the relative quality of each simulated VoIP call made during a VoIP Readiness Assessment, Vivinet Assessor measures delay, jitter, and lost data.
Delay End-to-end delay, the time it takes to get data across the network, is the primary indicator of the “walkie-talkie” effect in a VoIP call. Peo-ple are used to talking at the same time in their telephone conversations, or at least hearing the other person speak in real time. Most listeners notice when the delay pre-venting their words from reaching the other person is more than about 150 ms; when it exceeds 200 ms, they generally find it dis-turbing and describe the voice quality as poor.
The end-to-end delay is actually made up of five components:
• Propagation delay: the time to travel across the network from end to end. For example, the propagation delay between Singapore and Boston is much longer than the delay between New York and Boston.
• Transport delay: the time to get through the network devices along the path. Net-works with many firewalls, many routers, congestion, or slow WANs introduce more delay than an overprovisioned LAN on one floor of a building.
• Packetization delay: the time for the codec to digitize the analog signal and build frames – and undo it at the other end. The G.729 codec has a higher packetization delay than the G.711 codecs because it takes longer to compress the signal.
• Jitter buffer delay: the delay introduced by the receiver as it holds one or more datagrams to reduce variations in arrival times.
• Fixed delay: an additional user-configured delay that can be specified when setting up an assessment.
The combined value of propagation delay and transport delay is termed “network delay” in Vivinet Assessor. Packetization delay and the jitter buffer delay are constants for any given call group.
Measuring response time (that is, round-trip delay) and dividing the resulting time measurement by two isn’t always a good approximation of one-way network delay. Response time hides assumptions about the symmetry of the paths between two end-points. The two RTP streams in a VoIP call can take different paths through an IP net-work.
Endpoints therefore calculate network delay explicitly, rather than just taking the round-trip time and dividing it in half. The end-points start with flows similar to those used by the Network Time Protocol (NTP). NTP generally has an accuracy of around plus-or-minus 200 ms. Our design for giving good MOS feedback called for clock precision of about plus-or-minus 1 ms, which led us to de-sign more precise algorithms for software-based clocking. We’ve recently applied for patents on these new algorithms.
Endpoints maintain local copies of their clocks because each endpoint can be included in many simultaneous call groups. Also, the in-ternal clocks in every different operating sys-tem and computer platform seem to be a little different, and the clocks drift apart over time.
The endpoints maintain virtual (software) clocks for each partner involved in a VoIP test. These virtual clocks consist of the offset be-tween the microsecond clocks maintained by the two endpoints. A high-resolution clock, the microsecond clock is maintained inde-pendently of the operating system’s system clock.
The endpoints paired with each other in a call group compare their respective views of the clocks prior to the start of each test and periodically during a test run. They also measure clock synchronization and drift between test runs, to establish a track record for the expected delay.
Our one-way delay algorithms have proven robust, in measurements with thousands of endpoint pairs. We’ve also verified their effectiveness in testing with stratum 1 GPS timeservers.
Jitter and Jitter Buffer Loss As simulated calls run during an assessment, the endpoints calculate jitter, a factor known to adversely affect call quality. Jitter, also called delay variation, indicates the differ-ences in arrival times among all datagrams sent during a VoIP call.
When a datagram is sent, the sender (one of the endpoints) gives it a timestamp. When it’s received, the receiver adds another timestamp. These two timestamps are used to calculate the datagram’s transit time. If the transit times for datagrams within the same call are different, the call contains jitter. In a video application, jitter manifests itself as a flicker-ing image, while in a telephone call, its effect may be similar to the effect of lost data: some words may be missing or garbled.
The amount of jitter in a call depends on the degree of difference between the datagrams’ transit times. If the transit time for all data-grams is the same (no matter how long it took for the datagrams to arrive), the call contains no jitter. If the transit times differ slightly, the call contains some jitter. Jitter values in excess of 50 ms probably indicate poor call quality. They provide a short-term measurement of network congestion and can show the effects of queuing within the network.
When jitter is detected, Vivinet Assessor measures jitter buffer loss as well. While jitter buffers smooth out jitter by feeding datagrams to the application in a steady stream, they also exacerbate data loss: datagrams that are not contained by the jitter buffer are discarded.
Jitter buffer loss totals are factored into the Mean Opinion Score estimate and also reported separately. You can specify what levels of jitter are acceptable on a network by configuring result ranges at the Vivinet Assessor console.
Lost Data In VoIP Readiness Assessment reports, Vivinet Assessor includes statistics on lost datagrams, expressed as a percentage of all data sent in the relevant calls. For example, in charts indicating lost data by call group, lost data is expressed as a percentage of all data sent between the endpoints in the call group over the course of the entire assessment. Other charts might show data loss as a percentage of data sent at a certain time of day, averaged over the course of all days in the assessment.
VoIP packets are sent using RTP, the real-time transport protocol. Although every RTP data-gram contains a sequence number, there isn’t enough time to retransmit lost datagrams. Any lost datagram impairs the quality of the audio signal.
There are two primary reasons why RTP data-grams are lost in a data network:
• there’s too much traffic, so datagrams are discarded during congestion, or
• there’s too much delay variation, so data-grams are discarded because they arrive at the listener’s jitter buffer too late or too early.
Datagram loss occurs in a couple of different patterns. With one pattern, there’s a more-or-less random loss: due to general, consistent congestion in the network, one or two datagrams are lost occasionally. The other loss pattern is more damaging: packets are lost in bursts, say, five or more at a time. Humans perceive that bursts of loss impair audio quality much more than general, random loss.
When a datagram is lost during a VoIP trans-mission, you can lose an entire syllable or word in a conversation. Obviously, data loss can severely impair call quality. Vivinet Assessor therefore includes data loss as a call quality impairment factor in calculating the MOS of each simulated VoIP call.
To measure data loss, one computer in each call group keeps track of how many bytes of data it sent. The sending endpoint reports to the receiving endpoint how many bytes it sent, and the receiver compares that value to the amount received to determine lost data.
As mentioned in our discussion of codecs, above, having PLC enabled for the G.711 codecs improves call quality in the presence of lost data (compared to what the MOS would be if PLC were disabled). Always enable PLC in your assessments, if it’s supported by the VoIP equipment you plan to deploy.
Planning an Assessment Before you design your first VoIP Readiness Assessment, you need to do some research on the data network and on the planned VoIP implementation.
Understanding Call Volumes First, look at existing network documentation to find peak and average usage statistics. How many calls are likely at the same time? What is their duration?
Telephone records and the current PBX call volume reports are a good source of data about the likely call volume a network will have to handle. What percentage of the calls occur within each site? What percentage oc-cur within the organization, from site to site? How many calls go to and from the outside world?
Armed with information about likely call volumes, you’ll find that the Utilization assessment data is more valuable. Keep in mind that utilization levels are meant to indicate the amount of capacity you have to spare for the additional VoIP traffic you’ll soon add to the network. If utilization on a certain WAN link is pretty low at present, consider whether call volumes between the sites being linked will be similarly low. Use Bandwidth Modeling to determine how much bandwidth you’ll really need if you select one of the higher-bandwidth codecs.
You also need to know about call volumes when you’re ready to set up a VoIP Quality assessment. For example, we have eight major sites in NetIQ. From our development site in Raleigh, we rarely call our sales offices in Japan and Europe. It makes sense to set up just one call from Raleigh to Japan and from Raleigh to Europe. An assessment generates several calls an hour, although we probably make less than one call a day between these sites. An assessment seeks to ensure that you can get a connection and make a toll-quality
call any time you want one, so testing throughout the day is fine. We call more often from Raleigh to Portland, so we would define maybe two calls between those sites. Finally, we make many calls to Houston and San Jose, so we would define ten simultaneous calls.
A VoIP Quality assessment is not a stress test; remember, you’re running on a production network. Design VoIP Quality assessments that run an approximation of the average call volume during work hours, as opposed to the peak call volume. There’s a nice “failure mode” though, that’s easily observed. If the data network is already heavily loaded with existing application traffic, and then you add VoIP traffic, it’s the VoIP traffic that “breaks” first – it will show high delay, jitter, packet loss, or some combination. Check the report even before the assessment completes to see if this is occurring. Or else you can make the following assumption: when you verify the VoIP Quality assessment, if it’s showing “Poor” quality, you may or may not be dragging down the other traffic on the network. But you know for sure that network resources are being stretched too thin.
Understanding the VoIP Equipment Next, check the vendor data sheets for the VoIP equipment you’re considering, to answer the following questions:
• What type of codec will you be using? • Will this codec use silence suppression or
packet loss concealment? • Can the network currently support QoS
for VoIP? • What size jitter buffer will be used? • Are there any additional sources of delay
to be considered? • How many simultaneous calls can be
supported?
You’ll want to emulate these factors as closely as possible when you configure assessments.
Most IP phones support more than one codec. The codec to be used is negotiable, and is usually centrally managed. When an IP phone is first plugged in, it downloads a list of which codec to try first, which to try second, and so on.
Does bandwidth consumption force you to use a codec other than G.711? It may be that the lower call quality is good enough in your setup. Also, silence suppression and PLC make telephones more expensive and is rarely supported today. If your phones don’t support these, leave these choices unchecked when setting up the VoIP Quality assessment.
Installing Endpoint Software Before you set up a VoIP Quality assessment, you must install Performance Endpoint software on every computer you plan to include in assessments.
You want to put the endpoint software in the right locations, on the right computers, to get a representative assessment. But what are the right locations and what are the right computers? Let’s start with the location.
Look at the major offices in your organization -- where the majority of the calls are made today. For example, at NetIQ, we have four development sites and four key sales offices. We’d put at least two endpoints at each site. We’d design the assessment to go from each site to each of the others, and define a call group between the two endpoints in each office or site. In our case, with eight offices, we’d define 8+7+6+5+4+3+2+1 call groups in the VoIP Quality assessment, a total of 36 call groups.
When connecting within a site, look at the network topology of the site to see what will give the most telltale assessment. If you have multiple, interconnected switches, be sure to put the endpoints on different switches. If your sites have thousands of users and multi-ple buildings, consider an endpoint for each building or for each division.
Place endpoints in the spots where you suspect there will be problems. Do you have a mishmash of ISDN and T1 WAN connections that are stretched to their capacity? These links are better candidates for the assessment than a modern site where everyone has a 100-Mb LAN connection to their desktop.
Within a site, your endpoint placement should hinge on the VoIP topology in your plans. Where are the two ends of the IP connection? Do you plan to continue with analog tele-
phones on the desktops, then VoIP over the WAN? If so, install the endpoint software in a computer adjacent to the PBX or VoIP gate-way. Alternatively, do you plan VoIP from desks within a site or campus, connected to the external public switched telephone net-work (PSTN)? In this case, put endpoints on a few desks, connected to endpoints adjacent to the gateway.
Install a few endpoints on either side of a WAN link, which should be part of any assessment. Install endpoints on either side of a firewall and set up call groups to test how well the firewall will handle VoIP traffic.
Finding the right computer for endpoint soft-ware is easier. The endpoint need not be in-stalled on a dedicated computer. Do you have a computer available with some extra capacity, say a domain name server, a DHCP server, a print server, or a remote terminal server? These are good candidates for end-points, as long as they are used for less than 30 call groups. Otherwise, put the endpoint software on an extra computer for the dura-tion of the assessment. Almost any Pentium II or above is sufficient for a Windows or Linux endpoint; most SPARC or Ultra CPUs from the past few years will run a Solaris endpoint well.
Design the VoIP Quality Assessment In VoIP Quality assessments, endpoints are the basic units: they’re computers with NetIQ Performance Endpoint software installed. The Design view lets you choose which endpoint computers to include in an assessment, and which simulated calls they’ll receive.
To design an assessment, first create some endpoints. Drag the Endpoint tool to the diagram. The Create an Endpoint dialog lets you enter an IP network address to represent a VoIP-enabled computer on the network. Newly-created endpoints are added to the Endpoint List to the right of the diagram.
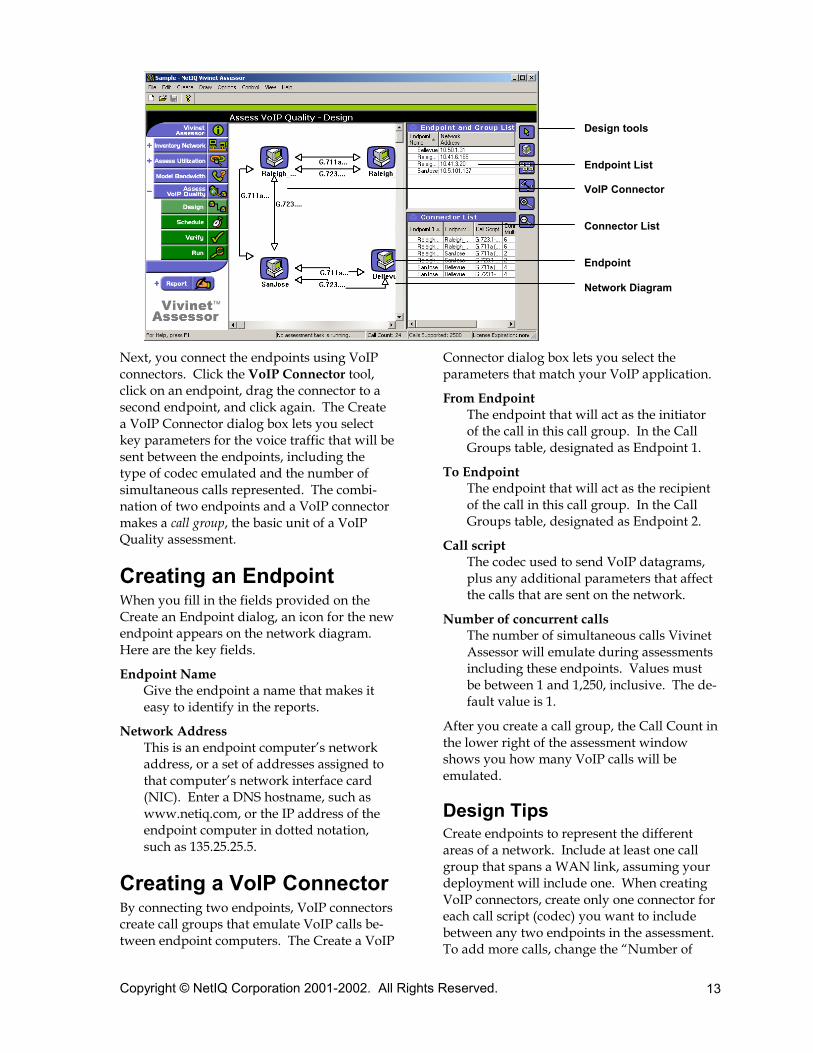
Next, you connect the endpoints using VoIP connectors. Click the VoIP Connector tool, click on an endpoint, drag the connector to a second endpoint, and click again. The Create a VoIP Connector dialog box lets you select key parameters for the voice traffic that will be sent between the endpoints, including the type of codec emulated and the number of simultaneous calls represented. The combi-nation of two endpoints and a VoIP connector makes a call group, the basic unit of a VoIP Quality assessment.
Creating an Endpoint When you fill in the fields provided on the Create an Endpoint dialog, an icon for the new endpoint appears on the network diagram. Here are the key fields.
Endpoint Name Give the endpoint a name that makes it easy to identify in the reports.
Network Address This is an endpoint computer’s network address, or a set of addresses assigned to that computer’s network interface card (NIC). Enter a DNS hostname, such as www.netiq.com, or the IP address of the endpoint computer in dotted notation, such as 135.25.25.5.
Creating a VoIP Connector By connecting two endpoints, VoIP connectors create call groups that emulate VoIP calls be-tween endpoint computers. The Create a VoIP
Connector dialog box lets you select the parameters that match your VoIP application.
From Endpoint The endpoint that will act as the initiator of the call in this call group. In the Call Groups table, designated as Endpoint 1.
To Endpoint The endpoint that will act as the recipient of the call in this call group. In the Call Groups table, designated as Endpoint 2.
Call script The codec used to send VoIP datagrams, plus any additional parameters that affect the calls that are sent on the network.
Number of concurrent calls The number of simultaneous calls Vivinet Assessor will emulate during assessments including these endpoints. Values must be between 1 and 1,250, inclusive. The de-fault value is 1.
After you create a call group, the Call Count in the lower right of the assessment window shows you how many VoIP calls will be emulated.
Design Tips Create endpoints to represent the different areas of a network. Include at least one call group that spans a WAN link, assuming your deployment will include one. When creating VoIP connectors, create only one connector for each call script (codec) you want to include between any two endpoints in the assessment. To add more calls, change the “Number of
Design tools Endpoint List VoIP Connector Connector List Endpoint Network Diagram
concurrent calls” in the Create a VoIP Connector dialog box.
If there’s a firewall between the endpoints in a call group, you need to do some extra configu-ration, both in Vivinet Assessor and at the fire-wall itself.
Firewall Settings If there’s a firewall on the network between the endpoint computers, you’ve probably al-ready configured it to accept RTP flows for VoIP traffic. You also need to open a port to allow endpoints in each call group to receive setup information and return results. The console communicates with the endpoints using bi-directional TCP over port 10115.
Enter a Reporting port for the endpoints to use when reporting results back to the Vivinet Assessor console, or leave the default at TCP port 10116. Choose AUTO to let the endpoints choose the port dynamically. Make sure the port you choose is open to bi-directional TCP traffic at the firewall.
Enter a Call Traffic port or range of ports to use if the firewall has been configured to pass VoIP calls through one particular port. The endpoints need to be able to send simulated VoIP traffic to each other through the firewall. Within any range of ports you set, the end-points will only use even-numbered ports (which is what real VoIP RTP streams use). The default, AUTO, lets the endpoints choose the port dynamically.
The port you use as a Call Traffic port must be opened at the firewall to bi-directional RTP traffic. All simulated VoIP traffic that Vivinet Assessor sends over the network is bi-directional, to emulate the bi-directional nature of voice over IP.
If the firewall does not allow RTP traffic, open the port to allow UDP traffic.
After you set or change the reporting port, you must stop and restart the Vivinet Assessor Scheduler service.
Schedule the VoIP Quality Assessment To determine when a VoIP Quality assessment will run, create a schedule. Scheduling options, which are also available for the Network Inventory and Utilization assessment, include:
• The length of time the assessment will run • The duration of each set of calls • The interval between each set of calls.
The minimum interval between calls is 15 minutes. Use the minimum interval to emu-late heavier VoIP traffic. Or increase the in-terval to measure the call quality when VoIP traffic is lighter.
The endpoints need some time to report the results of the simulated calls to the console. Therefore, the minimum length of time be-tween the duration and interval you set must be five minutes. For example, if you set a call duration of 20 minutes and a calling interval of 22 minutes, you’ll be prompted to increase the interval or decrease the duration of the calls. In this case, you could simply increase the interval to 25 minutes.
When you have made your selections, validate the schedule to apply your settings to the cur-rent assessment and commit them to the database.
Scheduling Tips A good length for an assessment is about seven days, enough to get plenty of data, from different days of the week when network traf-fic conditions are different. However, for your first assessment, we’d suggest that you run for a few hours and then scan your results. If it appears that the assessment is providing meaningful results and including enough representative endpoints to cover the network, reset the schedule for a longer time period. Likewise, start with fewer calls, and add more after a successful test assessment. You can easily edit VoIP connectors in the Design view to add more calls.
The schedule interval and the number of con-current calls determine how heavy the simu-lated VoIP traffic will be. To obtain more data
points, choose a shorter interval. This helps increase the chance that you identify a drop in quality due to regular spikes in data traffic. For instance, if the data traffic always spikes on the hour, but you never have VoIP test calls running at that moment, you may lose the fact that VoIP quality may drop then. You should have some idea of what peak and average utilization on the network will be; if not, do some traffic analysis to find out.
Verify and Run the VoIP Quality Assessment Verification is required before a VoIP assess-ment can begin. The console contacts each of the selected endpoint computers and sends them a brief schedule and one call script.
Verification is like a mini-assessment. You get some preliminary results after you verify your assessment, and you see right away whether you need to make any changes to the assessment design—any errors that occurred are indicated.
If errors occur during verification, you’ll know it by the warning icon that appears in the Call Groups table. Look in the error log to see what happened and which endpoints were affected.
• If Performance Endpoint software wasn’t detected by one of the computers in the assessment, install the software.
• Return to the Design view and make the necessary changes to the assessment con-figuration to avoid repeating the error.
In the Run view, you can start the assessment and determine how it’s proceeding. The status is continually updated, and if an error occurs, the error log shows what happened.
While the assessment is running, your presence is not required. However, you should plan to check back periodically to make sure no errors have occurred that might interfere with results.
Vivinet Assessor Reports As soon as any assessment runs long enough to show some results, you can generate a report of these results.
Vivinet Assessor offers two pre-configured report types:
• Executive Summary Report—provides a summary, with relevant charts and graphs, of the results that most directly indicated VoIP Readiness, or that affected the overall quality of VoIP calls on the network. This report is usually about ten pages long.
• Complete Report—provides information, charts, and graphs about every type of data collected during the assessment. Complete Reports take varying amounts of time to generate, depending on the number of devices and WAN links you discovered and monitored and the number of call groups in the VoIP Quality assessment.
For larger assessments, plan to let Vivinet Assessor generate the report while you’re away from the console.
Before you generate the report, you have the option to do a final calculation, Potential Lost Revenue, and include it in the report. Using the latest data from TeleChoice, Inc. [8], Vivinet Assessor can project revenue loss due to poor-quality VoIP calls or service outages. The VoIP Quality assessment derives an accurate estimation of the percentage of simulated VoIP calls that would be hard to comprehend (“Poor” quality calls in the report), or impossible to connect (“Unavailable” in the report). Based on this estimate, Vivinet Assessor uses information about the industry of the network being assessed and the number of telephone users to calculate the revenue loss that would occur if no network upgrades are made before VoIP rollout.
When you generate a report, Vivinet Assessor invokes Microsoft’s Word and Excel programs to interact with its database and produce charts, graphs, and detailed explanations of the data in a formatted report. Filtering
options let you remove the sections of data that don’t interest you, such as data collected on weekends, or details about router configuration. You can even create custom reports by gleaning data from the database using Microsoft Access, or edit reports by hand using Microsoft Word.
Look at the sample report that ships with Vivinet Assessor to get acquainted with the kind of data you can get from your VoIP Readiness Assessment.
Analyzing Results Vivinet Assessor reports aim to be self-explanatory. However, it’s helpful to under-stand how the various charts and tables break out and present the results.
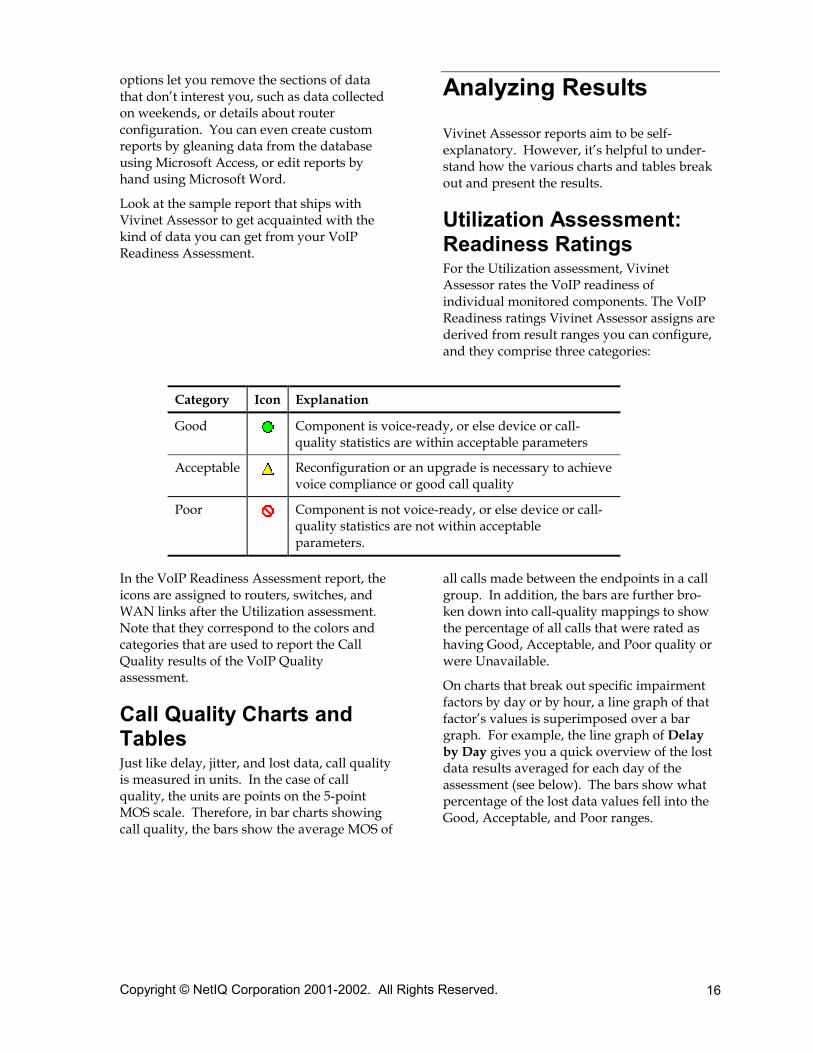
Utilization Assessment: Readiness Ratings For the Utilization assessment, Vivinet Assessor rates the VoIP readiness of individual monitored components. The VoIP Readiness ratings Vivinet Assessor assigns are derived from result ranges you can configure, and they comprise three categories:
Category Icon Explanation
Good Component is voice-ready, or else device or call-quality statistics are within acceptable parameters
Acceptable Reconfiguration or an upgrade is necessary to achieve voice compliance or good call quality
Poor Component is not voice-ready, or else device or call-quality statistics are not within acceptable parameters.
In the VoIP Readiness Assessment report, the icons are assigned to routers, switches, and WAN links after the Utilization assessment. Note that they correspond to the colors and categories that are used to report the Call Quality results of the VoIP Quality assessment.
Call Quality Charts and Tables Just like delay, jitter, and lost data, call quality is measured in units. In the case of call quality, the units are points on the 5-point MOS scale. Therefore, in bar charts showing call quality, the bars show the average MOS of
all calls made between the endpoints in a call group. In addition, the bars are further bro-ken down into call-quality mappings to show the percentage of all calls that were rated as having Good, Acceptable, and Poor quality or were Unavailable.
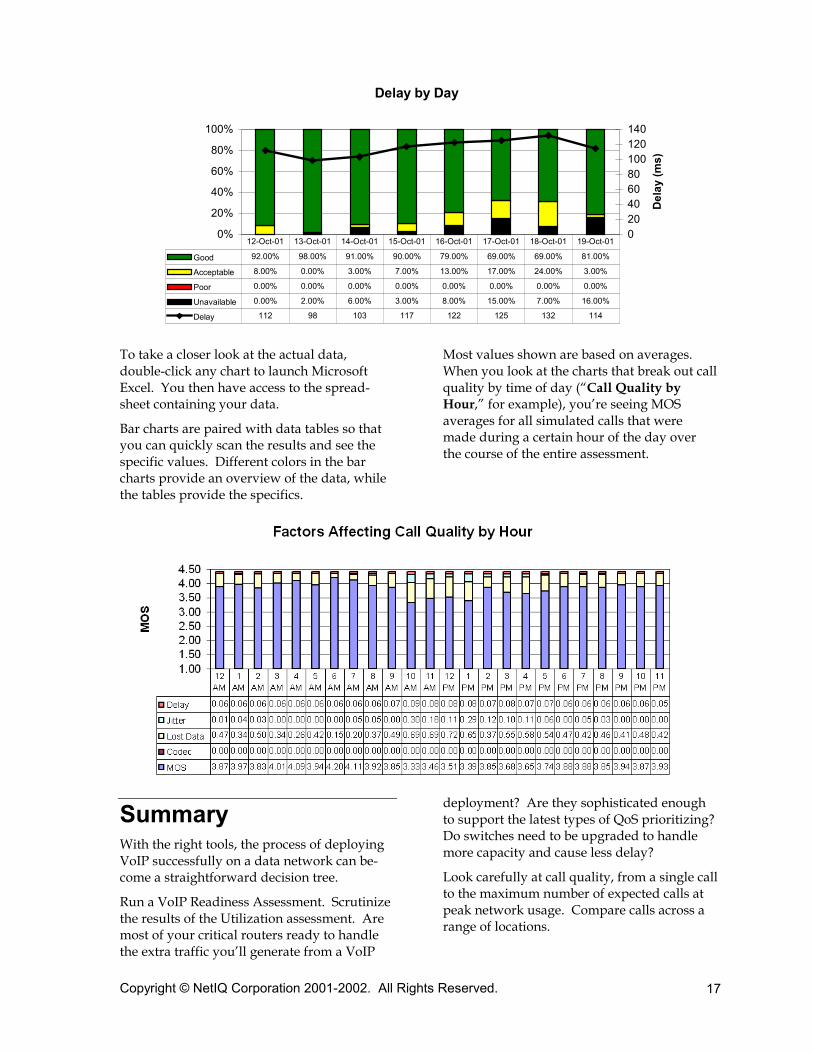
On charts that break out specific impairment factors by day or by hour, a line graph of that factor’s values is superimposed over a bar graph. For example, the line graph of Delay by Day gives you a quick overview of the lost data results averaged for each day of the assessment (see below). The bars show what percentage of the lost data values fell into the Good, Acceptable, and Poor ranges.
To take a closer look at the actual data, double-click any chart to launch Microsoft Excel. You then have access to the spread-sheet containing your data.
Bar charts are paired with data tables so that you can quickly scan the results and see the specific values. Different colors in the bar charts provide an overview of the data, while the tables provide the specifics.
Most values shown are based on averages. When you look at the charts that break out call quality by time of day (“Call Quality by Hour,” for example), you’re seeing MOS averages for all simulated calls that were made during a certain hour of the day over the course of the entire assessment.
Summary With the right tools, the process of deploying VoIP successfully on a data network can be-come a straightforward decision tree.
Run a VoIP Readiness Assessment. Scrutinize the results of the Utilization assessment. Are most of your critical routers ready to handle the extra traffic you’ll generate from a VoIP
deployment? Are they sophisticated enough to support the latest types of QoS prioritizing? Do switches need to be upgraded to handle more capacity and cause less delay?
Look carefully at call quality, from a single call to the maximum number of expected calls at peak network usage. Compare calls across a range of locations.
If the call quality is good and the other traffic is relatively unaffected, great – it avoids lots of complexity. Start the VoIP deployment.
If the call quality is not acceptable, determine what the problems are and where they’re located. What factor influenced the poor quality the most: one-way delay, jitter, lost data, or a combination of all three? Can a sim-ple change in the VoIP configuration options, such as the choice of codec, improve the call quality sufficiently? Where are the most likely bottlenecks?
Now, look at the costs of making the required network improvements. Choices include adding more bandwidth, upgrading or re-placing existing equipment, changing the network design for greater efficiency, recon-figuring or tuning the network for QoS, or a combination of these.
These choices are only the start of a decision tree for a network administrator, because the costs of these different choices are not equal. Adding more bandwidth may be a recurring expense if you lease lines; upgrading the hardware may be a capital expense; and QoS may appear to be free, but it usually has a high cost in personnel time.
Analyze the costs in as much depth as you can and decide whether you want to proceed with network changes. It’s an iterative process of making the most cost-effective improvements a step at a time, then repeating the VoIP Readiness Assessment to see if you’re reach-ing your call-quality goals.
If your cost estimates for preparing the data network for VoIP appear too high, this is a good time to take another look at your VoIP deployment plan. By this point, you’ll understand better what the deployment will require, so you’ll have some choices:
• you can decide how to budget costs intelligently at the right time in the future,
• you can increase your current budget and proceed – considering this a suitable long-term investment, or
• you can approach VoIP as a staged de-ployment, taking some steps now and saving some steps for later.
About the Authors Susan M. Pearsall, Ph.D., is a senior writer with NetIQ Corporation. She can be reached at [email protected].
John Q. Walker, Ph.D., is the director of network development and a co-founder of Ganymede Software, which joined NetIQ Corporation in 2000. He can be reached at [email protected].
Acknowledgments This paper was suggested and designed by Kim Shorb and Dave Zucker. Gracious thanks to the readers who helped improve this paper: Jeff Aldridge, Lynne Attix, Bruce Dean, Jeff Dozer, and Steve Joyce.
For More Information 1. Checklist of VoIP Network Design Tips, John Q. Walker, NetIQ Corporation, April 2001,
http://www.netiq.com/products/va/whitepapers.asp. 2. What You Need to Know before You Deploy VoIP, Scott Hamilton and Charles Bruno, Tolly Research,
April 2, 2001, http://www.netiq.com/products/va/whitepapers.asp. 3. Moving From a PBX to IP Telephony? Your Time Will Come!, B. Hafner, Gartner Group, Inc. March
27, 2001. 4. NetIQ’s VoIP Management, Eric Krapf, Business Communications Review, November 2001, page
62, www.bcr.com/bcrmag/2001/11/p62.asp. 5. ITU-T Recommendation G.107, “The E-model, a computational model for use in transmission
8. The figures for average revenue loss for each industry were calculated by TeleChoice, Inc., a leading telecom consulting and analyst firm. The figures were derived based on specific and factual industry information provided by select companies in each segment as well as from government compiled information. Information was collected and analyzed in 2002, although much of the underlying data was from 2000 and 2001.
U.S. Government Restricted Rights: Use, duplication, or disclosure by the Government is subject to the restrictions as set forth in subparagraph (c)(1)(ii) of the Rights in Technical Data and Computer Software clause of the DFARs 252.227-7013 and FAR 52.227-29(c) and any successor rules or regulations. AppManager, the AppManager logo, AppAnalyzer, Knowledge Scripts, Work Smarter, NetIQ Partner Network, the NetIQ Partner Network logo, Chariot, End2End, Pegasus, Qcheck, OnePoint, the OnePoint logo, OnePoint Directory Administrator, OnePoint Resource Administrator, OnePoint Exchange Administrator, OnePoint Domain Migration Administrator, OnePoint Operations Manager, OnePoint File Administrator, OnePoint Event Manager, Enterprise Administrator, Knowledge Pack, ActiveKnowledge, ActiveAgent, ActiveEngine, Mission Critical Software, the Mission Critical Software logo, Ganymede, Ganymede Software, the Ganymede logo, NetIQ, the NetIQ logo, and Vivinet are trademarks or registered trademarks of NetIQ Corporation or its sub-sidiaries in the United States and other jurisdictions. All other company and product names mentioned are used only for identification purposes and may be trademarks or registered trademarks of their respective companies.