19
Doing Business in South Africa Dr. Ernest Betts
| Date post: | 23-Dec-2015 |
| Category: |
Documents |
| Upload: | clifton-collins |
| View: | 220 times |
| Download: | 1 times |

Doing Business in South Africa
Dr. Ernest Betts

2
About South Africa
Capital: Administrative: Pretoria Legislative: Cape Town Judicial: Johannesburg
Government – Paliamentary Democracy
President – Jacob Zuma Population - 51,770,560
(2012 estimate) Official Languages -
Afrikaans, English, IsiZulu, IsiXhosa, SiSwati, Ndebele, Southern Sotho, Northern Sotho, Tsonga, SeTswana, Venda
Coat of Arms of South Africahttp://en.wikipedia.org/wiki/South_Africa

3
Geography
South Africa is located at the southern tip of Africa.
The area is 470,979 square miles.
It is the world's 25th-largest country (after Mali).
South Africa is comparable in size to Colombia, and is nearly twice the size of the US state of Texas.
It borders the countries of Namibia, Botswana, Zimbabwe, Mozambique, Swaziland, and Lesotho.
Its coastline stretches more than 1, 550 miles and across two oceans (the Atlantic and the Indian).
http://en.wikipedia.org/wiki/South_Africa

4
Natural Resources
Gold, chromium, antimony, coal, iron ore, manganese, nickel, phosphates, tin, uranium, gem diamonds, platinum, copper, vanadium, salt, natural gas
Source: www.cia.gov

5
Economy
South Africa is a middle-income, emerging market GDP - $578.6 Billion 25th GDP - per capita (PPP):$11,035 (2011 est.) 77th GDP - composition by sector:
Agriculture: 2.6% Industry: 30.3% Services: 67.1% (2011est.)
Labor force:16.09 million economically active (2011 est.) Labor force - by occupation:
Agriculture: 2.5% Industry: 31.6% Services: 65.9% (2011est.)
Unemployment rate:25.2% (2012 est.) Population below poverty line: 50% (2012 est.)
Source: www.cia.gov

6
Industries
The main industries are: mining (world's largest producer of platinum, gold,
chromium metalworking machinery textiles iron and steel chemicals fertilizer foodstuffs commercial ship repair
Industrial production growth rate:5.1% (2010 est.)
Source: www.cia.gov

7
Exports
Exports: $101.2 billion (2011 est.) Commodities exported: gold, diamonds,
platinum, other metals and minerals, machinery and equipment
Export partners: China 13.7%, Japan 8.7%, UK 7.1%, US 10.1%, Germany 7.3%, India 4.3% (2011)
Source: www.cia.gov
8
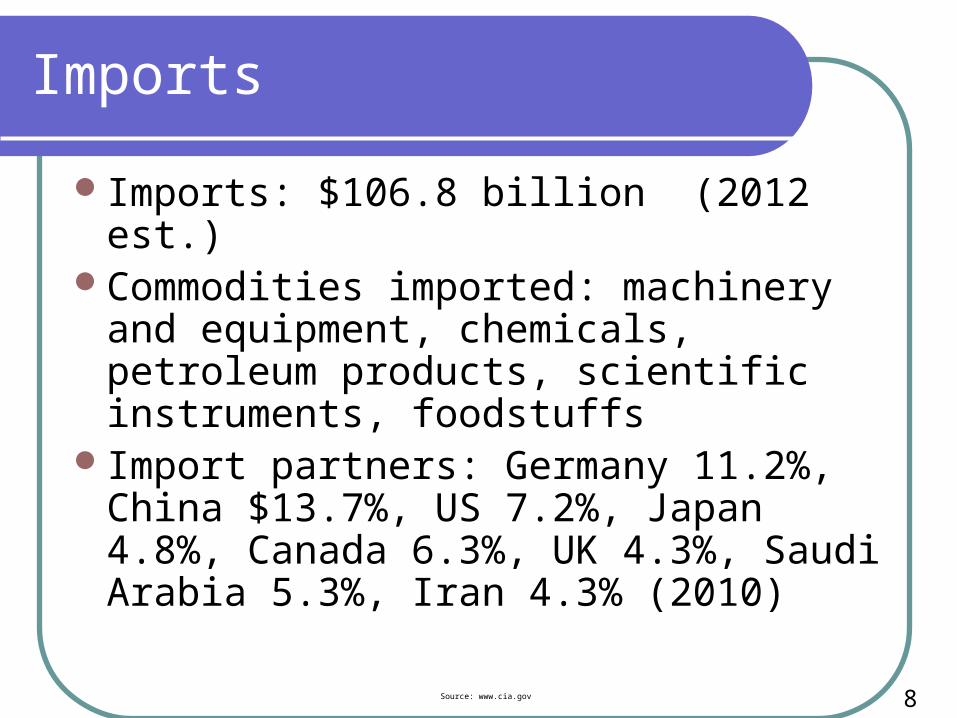
Imports
Imports: $106.8 billion (2012 est.)Commodities imported: machinery and
equipment, chemicals, petroleum products, scientific instruments, foodstuffs
Import partners: Germany 11.2%, China $13.7%, US 7.2%, Japan 4.8%, Canada 6.3%, UK 4.3%, Saudi Arabia 5.3%, Iran 4.3% (2010)
Source: www.cia.gov

9
Communications
Telephones - main lines in use: 4.729 million (2005)
Telephones - mobile cellular: 33.96 million (2005)
The telephone system is the best developed and most modern in Africa
Radios:17 million (2001) Television broadcast stations:556 (plus 144
network repeaters) (1997) Televisions: 6 million (2000) Internet Service Providers (ISPs):150 (2001) Internet users:5.1 million (2005)
Source: www.cia.gov

10
Ethnic Diversity
South Africa is a very ethnically diverse nation.
It has the largest population of people from a mixed ethnic background, whites, and Indian communities in Africa.
Black South Africans account for slightly more than 70% of the population.
http://en.wikipedia.org/wiki/South_Africa

11
Main Cultural Differences
Because of the legacy of Apartheid segregation, many cultural differences correspond closely to the racial groups defined by Apartheid:Blacks: 79.7%Whites: 8.7%Coloured: 8.9%Asians: 2.6%
Sources: wikipedia.org & cia.gov
12
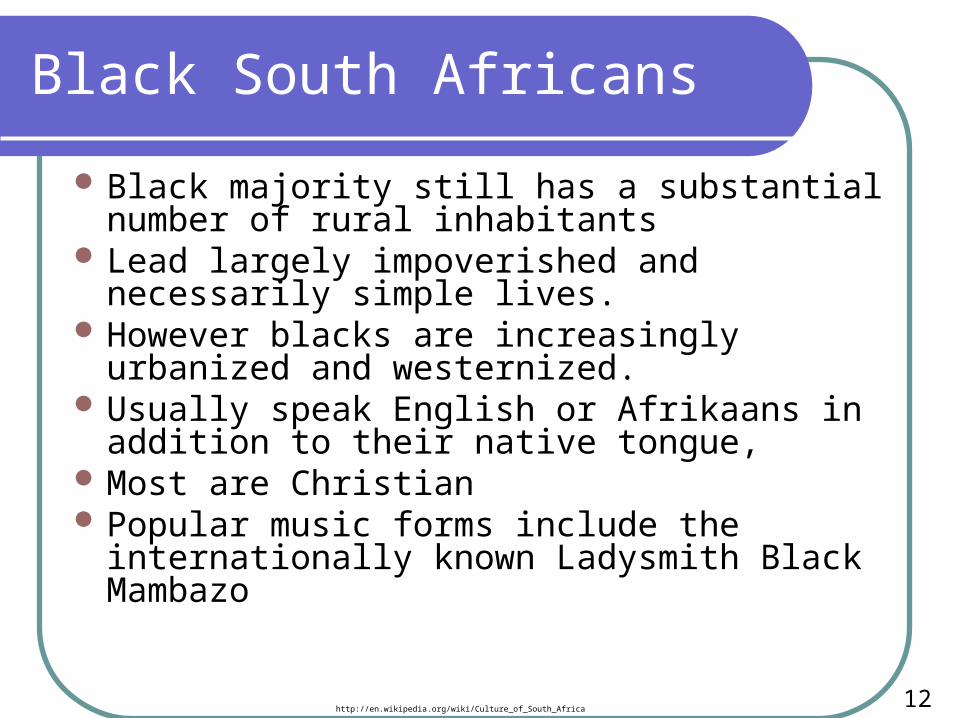
Black South Africans
Black majority still has a substantial number of rural inhabitants
Lead largely impoverished and necessarily simple lives.
However blacks are increasingly urbanized and westernized.
Usually speak English or Afrikaans in addition to their native tongue,
Most are Christian Popular music forms include the internationally
known Ladysmith Black Mambazo
http://en.wikipedia.org/wiki/Culture_of_South_Africa

13
White South Africans
Lead lifestyles similar in many respects to whites found in Western Europe and North America
Sports are immensely popular. Historical enmity between Afrikaans and
English-speaking whites has given way to more amiable banter or rivalry.
Religious beliefs are also strong Perhaps 90,000 whites are Jewish, with a
similar number being of Portuguese origin. There are some Greeks and Christian Lebanese.
http://en.wikipedia.org/wiki/Culture_of_South_Africa

14
Coloured South Africans
These are people of mixed-raceCulturally speaking they are much closer
to whitesThey share the language and religious
beliefs of whites.A small minority of Coloureds, known as
Cape Malays are Muslim.
http://en.wikipedia.org/wiki/Culture_of_South_Africa

15
Asian South Africans
Asians preserve their own cultural heritage, languages and religious beliefs
Mostly either Hindu or Muslim and speak English Although Indian languages are seldom spoken or
understood, English-subtitled Bollywood films and television programmes are popular among South African Indians.
There is a much smaller Chinese community in South Africa, although its numbers have been increased by immigration from Taiwan (although the Taiwanese were classified as "White", rather than Asian by the Apartheid regime.)
http://en.wikipedia.org/wiki/Culture_of_South_Africa

16
Did You Know?
More than 600 U.S. companies do business in South Africa.
South Africa has only 10 percent of the population of sub-Saharan Africa but generates more than 45 percent of the regions gross domestic product (according to South African Institute of Race Relations)
Source: DiversityInc- Jan/Feb 2006

17
Real Gross Domestic Product
Five-Year Averages
1.5%
0.2%
2.6%
3.4%
4.4%
0.0%
1.0%
2.0%
3.0%
4.0%
5.0%
1985-1989
1990-1994
1995-1999
2000-2005
2006-2009
Source: DiversityInc - South Africa: Facing the Future (p 37)
18
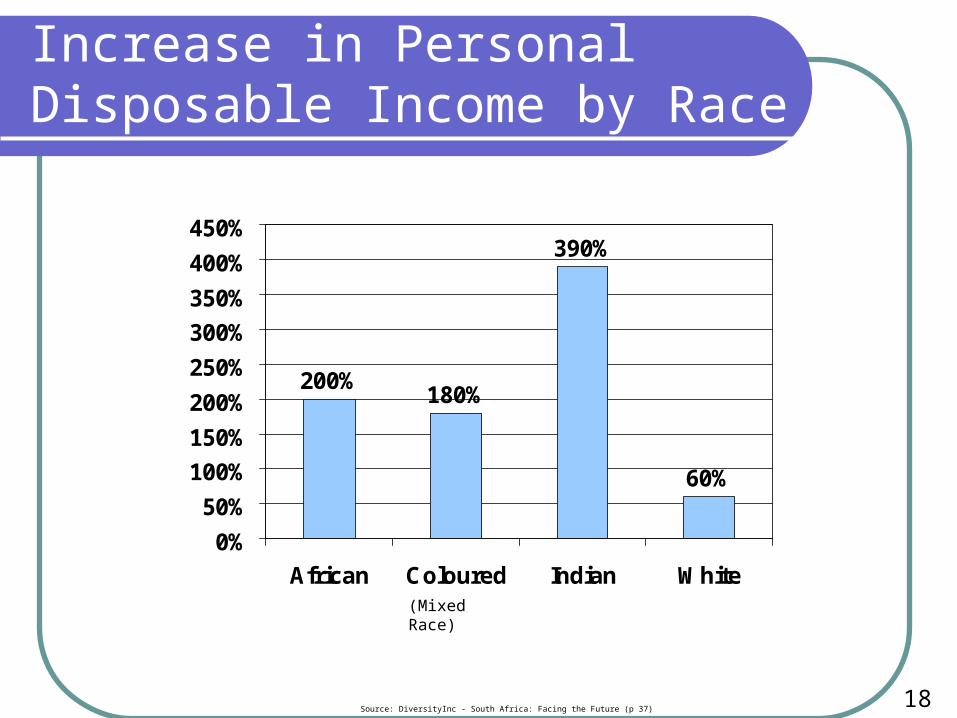
Increase in Personal Disposable Income by Race
200%180%
390%
60%
0%
50%
100%
150%
200%
250%
300%
350%
400%
450%
African Coloured Indian White(Mixed Race)
Source: DiversityInc - South Africa: Facing the Future (p 37)

19
Foreign Investment
$122.7
$14.9$13.5$6.6
$3.9
$30.8
$68.2
$0.0
$20.0
$40.0
$60.0
$80.0
$100.0
$120.0
$140.0
1978 1982 1986 1190 1994 1998 2000
Bil
lio
n
Source: DiversityInc - South Africa: Facing the Future (p 37)


