Doman "lass=
ED 324 872. EC 232 417
AUTHOR Schalock, Robert L.; And OthersTITLE An International Perspective on Quality of Life:
Measurement and Use.PUB DATE 29 Pay 90NOTE 46p.; Paper presented at the Annual Meeting of the
hmerican Association on Menial Retardation (Atlanta,GA, Nay 2711, 1990).
1-11B TYPE Speeches/Conference Papers (150) -- Reports -Research/Technical (143)
EDRS PRICE 1F01/PCO2 Plus Postage.DESCRIPTORS Adults; *Cross Cultural Studies; *Developmental
Disabilities; Foreign Countries; Life Satisfaction;Measurement Techniques; *Mental Retardation;*Normalization (Handicapped); Personal Autonomy;Productivity; *Quality of Life; *Rehabilitation;Social Integration; Social Services
IDENTIFIERS Australia; China; Germany; Israel
ABSTRACTThe study obtained cross-cultural measuizz of quality
of life (20L), based upon perceptions of individuals with mentalretardation/developmental disabilities (NR/DD) of their degree ofsatisfaction, productivity, independence, and community integration.The Quality of Life Questionnaire was administered to 92 persons inNR/DD programs in Australia, the Federal Republic of Germany, Israel,and the Republic of Chtna and 552 persons from NR/DD programs inNebraska and Colorado. A very consistent trend was found across the--Tie countries: quality of life scores increase as one lives andwords in more normalized environments. The paper also outlinescharacteristics of mental retardation/developmental disabilitiesservices in the four countries (excluding the United States),focusing on: public laws regarding services to persons with NR/DD,funding patterns, administrative structures for NR/DD services,current living options, and current employment options. The papernotes that the concept of quality of life in habilitation servicescan bo used cross-culturally to foster international QOL-orientedpublic policy, implement QOL-oriented program practices, and completeQOL-focused cross- cultural reseP:ch projects. Includes 16references. (JDD)
***********************************************************************
Reproductions supplied by EDRS are the best that can be madefrom the original document.
******* ***** ***** ***** ***** ***** ****************** ***** ****************
1AN INTERNATIONAL PERSPECTIVE ON QUALITY OF LIFE
MFASUREMENT ArD USE
Robert L. Schalock, Edward Bartnik, Fang Wu,
Andreas Konig, Chun-Shin Lee, Shunit Reitera
The 104th Annual Convention of
The Association on Mental Retardation
Atlanta, Georgia
May,29, 1990
The concept of quality of life (QOL) has recently become an
important national and international issue in the field of
mental retardation and developmental disabilities. There are a
number of reasons for this interest, including concern that many
feel about the quality of life of disabled persons, the
demonstration that social environments have considerable impact
on an individual's lifestyle, the fact that complex programs
require complex outcome measures, the reemergence of the
holistic health perspective, and the concern that many people
have about how others find satisfaction and life quality in a
rapidly changing world (Donegan & Potts, 1988; Goode, 1988;
Schalock, 1990).
Today's presentation reprasents a first generation attempt
within the mental retardation/developmental disabilities field
to obtain cross-cultural measures of QOL based upon persons'
perceptions of their degree of satisfaction, productivity,
DEPARTMENT OF EDUCATIO
CI)Otnce ci Eametionet Aumun end ImprummentEDUCATIONAL RESOURCES INFORMATION
Vt 0.4CENTER (ERIC)
document nee been nmsoduced umermr*d from Ms won of onundanonondindmod.
4k) 0 Minor changes neve bun made to improvefPrOdueffon 0111114Y
4.4 Points of %low or opmors stem, in Ous doormai do not neassedy teptuut Wu,MMMdMondWcY
1
2
"PERMISSION TO REPRODUCE THISMATERIAL HAS BEEN GRA TED SYLtTO THE EDUCATIONAL RESOURCES
020
independence and community integration. It is important to
place this effort within the larger concept of social ecology
and the impact that one's culture has on one's perceived quality
of life. Our premise is that ecological comparisons across
cultures to determine how characteristic of those cultures
impact one's quality of life is the heart of a researchstrategy
for studying the ecological asl.ects of a person's 'quality of life.
In addition to presenting cross-cultural OOL measures, the
presentatiun also summarizes five characteristics regarding
MR/DD services in Australia, The Federal Republic of Germany,
Israel and The Republic of China. These five characteristics
include: (1) public laws regarding services to persoris with
mental retardation/developmental disabilities; (2) funding
patterns for these persons; (3) administrative structures for
MR/DD services; (4) current living options; and (5) current
employment options.
Quality of Life Conceptual Model
The Q01, model we used in this cross-cultural study is based
on the seminal studies of the quality of American life by
Campbell, Converse and Rogers (1976) and Andrews and Whithey
(1976). The model views a person's perceived quality of life as
a resultant of three levels of life experiences including: (1)
personal characteristics and objective life conditions in
various life domains; (2) the perceptions or mind sets of
significant persons and services about persons with
disabilities; and (3) one's personal beliefs about what is
2 3
important and how the world works. Our working model is
presented in Figure 1. The following paragraphs explain each
Refer to Figure 1
component of the model in more detail.
1. Personal charactelistic and objective life conditions.
This part of the model is based on a number of studies
reporting that the experience of one's general well-being is
the product of personal characteristics, objective life
conditions in various life domains, and satirfaction with life
conditions in thesd various domains. For example, Campell et
al (1987) report that factors such as marriage, family life,
health, neighborhood, friendships, housework, jobs, housing,
standard of living, amount of education, savings and membership
in organi:ations are highly related to personal satisfaction
and a perceived quality of life. Similarly, our own work
(Keith, Schalock & Hoffman, 1986; Schalock, Keith, Hoffman
Karan, 1989) with persons with disabilities has found that
measured quality of life is positively related to cognitive
level, normalized living and work environments, family
involvement, income, and the number of disabilities.
2. Perceptions or mind sets about persons with
disabilities. One of the most significant changes of late has
been people's attitudes about the ability and potential of
persons with disabilities. This part of the model stresses
3
PERSONAL CHARACTERISTICS
(Physical, Material, Social
and Cognitive Attitudes)
,
OBJECTIVE LIFE CONDITiONS
(Community, Physical, Economic,
and Social Characteristics)
PERCEPTIONS ABOUT PERSONS WITH DISABILITIES
(Significant Others and Habilitation Services)
INDIVIDUAL BELIEFS ABOUT WHATIS IMPORTANT AND HOW
THE WORLD WORKS
PERCEIVED QUALITY OF LIFE
MEASURED QUALITY OF LIFE
FIGURE 1. QUALITY OF LIFE CONCEPTUAL MODEL
4
5
that the perceptions or mind sets about persons with
disabilities exhibited by parents, peers, and friends (that is,
significant others) as well as personhel within educational and
habilitation services have a profound influence on the person's
perceived quality of life. Specifically, we suggest that these
perceptions and expressed attitudes act as intervening
variables to effect the person's internal standard, which is
used to judge the quality of life experiences and to develop
personal beliefs about how the world works. Due to recent
changes in perceived value and opportunities for persons with
disabilities, we have all seen persons enter into the
mainstream of life and report an enhanced qua"-ity of life (see
for example, Schalock, 1990). Thus, it is evident that the
internal standard against which QOL judgments are made is
subject to modification related to life changes, and that any
QOL model needs to reflect this dynamic, interactive process.
3. Personal beliefs about the world. Everyone has beliefs
about how the world works in the physical, social, economic,
and political realms. Our conception is that these beliefs
stem from the two previously discussed levels of life
experiences and the resultant internal standard against which
persons make QOL judgments.
It is also apparent that each society has a structure of
dominant beliefs that shape the way people in that society
interpret the world with which they interact. Cross-cultural as
well as within-cultural examples are plentiful. In reference to
persons with disabilities, for example, some cultures are
accepting and supportive, while others are rejecting and
5
6
exclusionary. The point that we want to stress in reference to
this aspect of the QOL model is that society does change, and
societal relearning is always taking place. The best examples of
this relearning has been the evolving societal philosophies
regarding normalization, advocacy, public laws, and the emphasis
on the lea. restrictive environment (Schalock & Kiernan, 1990).
Thus, one's personal beliefs about how the world works -- and the
resultant quality of life judgments -- are influenced by the
opportunities we are afforded and the experiences that accrue to
these opportunities.
4. Pe-ceived quality of life. Quality of life is
necessarily subjective and cannot be- inferred strictly from
objective measures of conditions. In fact, there is general
agreement that subjective and objective measures of WI_ do not
correlate highly, and that a valid conceptualization of QOL
requires the thorough study of both objective and subjective
factors (Lehman, 1988; Milbrath, 1982).
The Measurement of Quality of Life
The recent attempts of social scientists' to measure QOL fall
within three large areas including psychological well-being,
personal satisfaction, and social indicators. These areas, as
related to the QOL model shown in Figure 1, are shown in Figure
2.
Refer to Figure 2
6
PERSONAL CHARACTERISTICS
-,,......
\
OBJECTIVE LIFE CONDITIONS
INDIVIDUAL BELIEFS ABOUT WHAT
IS IMPORTANT AND HOW
THE WORLD WOiKS
Psychological Well-Beiu
Physical and MaterialWell-Being
Relations WithOther People
Social, Community andCivic Activities
Personal Developmentand Fulfillment
Recreation
Personal Satisfaction
Marriage
Family Life
Health
, Neighborhood
Friendships
Job/Work
Housing
Usefulness ofEducation
Standard of Living_
Amount of Education
Savings
Social Indicators
Health
Social Welfare/Stability
Friendships
Standard of Living
Education
Public Safety
Housing
Neighborhood
Leisure
FIGURE 2: APPROACHES TO QUALITY OF LIFE MEASUREMENT
7
8
,
We have
for persons
measurement
encorporated
based much of our approach to the measurement of QOL
with disabilities on the three approaches to QOL
summarized in Figure 2. For example, we have
into the 1990 QOL Questionnaire many of the items
listed within the psychological well-being and personal
satisfaction boxes. We have also encorporated most of the social
indicators into the demographic profile of respondents so that
these indicators can be used statistically as explanatory
variables to help explain some of the external, environmentally
based factors related to one's assessed QOL.
The 1990 version of the Quality of Life Questionnaire
(Schalock, Keith & Hoffman, 1990) represents a significant
revision of the 1986 version. The 1990 version is based on the
results of considerable research with the 1986 version and a
significant shift in the conceptualization of QOL for persons
with disabilities as reflected in the following four principles:
QOL is essentially the same for persons with and without
disabilities. Persons with and without disabilities want
the same things in their lives and have the same .eds
for decision making and choices as other persons in
society.
QOL is basically a social phenomenon and a product
primarily of interactions with others.
QOL is the outcome of individuals meeting basic needs and
fulfilling basic responsibilities in community settings.
8
QOL is pritharily a. subjective phenomenon. Ultimately, it
is how the individual perceives and evaluates trks own
situation, rather than how others see him, that
determines the QOL he or she experiences.
The 1990 QOL Questionnaire, which is attached as Appendix A,
Refer to Appendix A
reflects two years of development work involving 870 adults with
disabilities in the United States and four other countries
(Australia, Federal Republic of Germany, Israel and The Republic
of China). During that time, both a field test and final version
of the Questionnaire were administered to these persons to
establish wording, format, item and factor analyses, reliability,
and validity. Factor analyses on the 1990 QOL Qustionnaire's
items indicate the following four factors:
1. Satisfaction, which is the fulfillment of a need or want,
and the happiness or contentment that ac,_7ompanies that
fulfillment. Specifically, satisfaction relates to life in
general, fun and enjoyment, personal experiences and feeling
about one's general living/social situations.
9 1 0
2. Competence/productivity, as reflected in income-
producing work or work that contributes to a household or
community.
3. Empowerment/Independence, as reflected in the
opportunity to exert ccntrol over one's environment, make
decisions, and pursue choices.
4. Social Belonging/Community Integration, as reflected
in participation in community activities, the usP of community
resources, and the development and exper.iencing of social
contacts and relations.
Cross-Cultural Sample
Data were collected on 92 persons in MR/DD programs
outside the United States, and 552 from MR/DD programs within
Nebraska and Colorado. Colleagues in Australia, Germany,
Israel, and The Republic of China were asked to select a
representative sample within their respective program.
Demoaraphic charact=istics on these service recipients ara
summarized in Table 1. This sample should not be considered
Refer to Table 1
10
Table 1
Description of Cross-Cultural Sample
Country and Sample Size
Variables Australia Federal Republic Irmael Republic of USAof Germany China
(N=18) (N=11) (N=10) (N=552)
Age 28.4 43.4 30.6
...(N=53)
23 37.8
Gender (%)
Female 50 40 50.9 46.8Male 50 100 60 49.1 53.2
Marital Status (5)
Never Married 88.8 100 100 100 95.4Married 5.6 4.2Di%orced 5.6 0.4
Average Total Income $5847. $1888. $2310. $1459. $4704.
Primary Health Impairment (5)
Cognitive 88.9 100 90 73.6 97.2Sensory/Neurological 10 11.3 1.1Physical 11.1 11.3 0.9Emotional 3.8 0.8
Current Living Environment (5)
Independent 61.1 19.2Semi-independent 27.8 90 13.2 38.0Supervised 11.1 10 75.5 42.8Specillized Facility 100 11.3
Current Work Status (5)
Regular Employment 11.1 11.6Employment With Ongoing
Support 5.6 50 20.8 17.9Sheltered 55.6 55 50 24.5 61.6Unemployed 22.2 18 54.7 7.9Retired 5.6 27 1.0
Educational Program (5)
Public Education 17.6 27.3 10 6.3MR/DD Services or
Special Schools 41.2 72.7 100 87.2No formal education
or Traininp 41.2 90 6.5
reflectivo of the country as a whole, but merely those programs
sampled. Generally speaking, across countries, the sampift is
evenly split between females and males in their 30s, never
married, low income (income shown in Table 1 is in U.S. dollar
equivalents), primarily cognitively impaired, living primarily
in semi-independent or supervised environments and working in
supported employment sites or sheltered workshops, and educated
primarily in MR/DD services or special schools.
Cross-Cultural QOL Measures
The 1990 QOL Questionnaire was translated into Chinese
(Mandarin), Hebrew and German (Australia used the U.S. version)
prior to its administration. Directions to the administrators
were that,
If the persol is verbal, have him/her answereach of the following questions acccording tohow he/she honestly feels. Help the person withany word(s) that is (are) not understood. Ifthe person is nonver , have two staffindeperdently evaluate the person on each itemand use the average score for each item.
The resulting QOL scores were analyzed in 1.1) ways. The
first was to merely summarize them for each count y per factor.
These average QOL scores are presented in Tablk: 2. We present
Refer to Table 2
these data only for discuss.ion and hypothesis-generating
purposes, and not for comparative purposes. Remember that the
current sample is both small and non-representative.
Factor
Table 2
Quality of Life Factor Scoresa
Australia Federal Republic Israelof Germany
Satisfaction 22.7(±4.1)a 22.2(±2.4) 23.2(±3.2) 18.3(±3.1) 21.8(±3.7)
Competence/Productivity 19.5(±6.4) 17.5(±4.7) 24.2(±3.1) 15.0(±5.7) 21.2(±4.1)
Empowerment/Independence 24.6(±4.1) 19.5(±1.6) 21.0(±2.7) 15.5(±3.7) 21.7(±3.6)
Social Belonging/Community
Integration 21.7(±3.9) 19.4(±2.0) 20:4(±2.9) 16.5(±3.2) 20.7(±2.9)
TOTAL 88.4(±12.4) 78.8(±6.4) 88.8(±6.9) 65.4(±13.1) 85.3(±12.9)
1-4
aThese scores should be read with the small sample size in mind and the living-work environ-ments of the sample (see Table 1).
1 41 5
The second way that the data were analyzed was to compare
regardless of the country QOL scores across different living and
work environments. These data, which are much more important
to our current level of sophistication in 1.1rosa-cvltural QOL
studies, are presentei in Table 3 and Figure 3. There i, a very
Refer to Table 3 and i-igure 3
consistent trend found across the five countries in these data:
QOL scores increase as one lives and works in more normalized
env:xonments. Additionally, the consistency among specific
factor scores among the countries was striking.
The Concept of QOL In Habilitation Services
As mentioned in the introductory section, this study
represents a first generation attempt to obtain cross-cultural
measures of QOL based upon persons' perceptions of tneir degree
of satisfaction, productivity, independence and community
integration. In this final section of this presentation, we
would like to share some thoughts about the concept of quality
of life in habilitation services. These thoughts reflect both
our work with the QOL concept, and the concern which many
consumers and practitioners alike have that conditions of
quality in the living, work and community integration lives of
persons with disabilities are not changing fast enough to keep
up with the rapid and wide-scale changes in people's attitudes,
aspirations and values. As W.R. Shea (1976) suggests in an
Environment
Livinga
Table- 3
Average QOL Factor Scores Across Environments
QOLàctorScorè reCompetence/ Eiveerr.ment/ SocialBelonging/-,
Satisfaction Productivity Independence Coimunity Integration
Indepem:snt 23.1 25.3 21.9
Semi-Independent 22.4 22.2 21.5
Supervised 20.3 17.7 18.8
Specialized 18.1 15.0 15.8
Employment
1--.
(.71
Regular 24.9 26.5 24.0
Employment with Supports 21.9 23.6 21.0
Sheltered 21.1 19.0 19.4
Unemployed 18.6 11.2 14.7
aIndependent (rents/owns home, apartment); semi-independent (in a home setting, but with some
supervision); supervised (eg., grout) home, 'ives with parents); specialized facIlity(hospital, nursing home, institution)
Conceptually, competence/productivity relates to employment only.
Conceptually, empowerment/independence relates primarily to the living environment.
17 1 8
Specialized
Supervised
Living Environment
a satisfaction
ta empowerment / independence
1111 social belonging /community integration
Semi-Independent
Unemployed
Sheltered
withSupports
Regular
1 1 1 I 1 1 1 I I 1 1 1 1 I 1
10 15 20 25
Quality of Life Factor Score
Employment Environment
PROMPIIMINTM
El satisfaction
El competence/productivity
111 social belonging /community integration
1 1 1 1 1 1 1 1 1 1 1 1 1 I 1 1 1 1 1
10 15 20 25 30
Quality of Life Factor Score
Figure 3. Average Quality of Life Factor Scores AcrossLiving-Work Environments
16
4 9
essay entitled, "The Quest For A High Quality Of Life:"
What lends a sense of urgency to the quest...is theperverse feeling that time is running out, not only forphilosophers, political scientists, and sociologists, butfor politicians (and practitioners] as well (p.1)...
How might the concept of qual:ty of life and measures
reflecting it be used cross-culturally in habilitation services?
We suggest three uses including: (1) fostering internationally
QOL-oriented public policy; (2) implementing QOL-oriented
program practices; and (3) completing QOL-focused cross-cultured
research projects.
1. QOL-oriented public policy. Ultimately, the concern for
an enhanced quality of life for persons with disabilities must
be supported by federal, state and local policies and entities.
We feel that the quality of life concelt can serve as the basis
for a more coherent and unified disability policy nationally and
internationally, since QOL captures a broad array of issues and
concerns that are important to persons with disabilities, their
families, professlonals, and governmental officials who
administer programs and set policy. Because QOL is a generic
concept, enhanced QOL outcomes for persons with and without
disabilities are the same. Thus a QOL-oriented disability
policy would be based on the same social expectations and goals
that society holds for non-disabled citizens. In that sense, it
is informative to compare those countries involved in the
current cross-cultural study on their current public laws and
policy, funding patterns, and administrative structure. These
comparisons are summarized in Table 4.
Refer to Table 4
2. Q0L-oriented program practices. Using the QOL concept
in planning habilitation services for persons with disabilities
cannot be separated from the three major trends that are
currently impacting service delivery systems throughout the
world. In their simplest form, the trends include living,
learning and working in integrated environments; empowering
persons with disabilities to choose and make.decisions regarding
their welfare and future; and holding service providers
acc-mntable for person-referenced outcomes that reflect enhanced
independence, productivity, community integration and quality of
life.
Our feeling is that an enhanced quality of life for persons
with disabilities is not likely to be achieved without a
significant reorientation of the cul.7ent service delivery
system. The reorientation should be built on a set of QOL-
oriented values, with specific QOL-oriented program practices
outlined in Table 5.
Refer to mable 5
3. Cross-cultural research. One of the major advantages
and potential uses of standardized QOL measures is the important
role they can play in research efforts. These efforts are just
18
21
Country
Australia
-
Cross-Cultural Comparisons of Public Laws/Policy; Funding Patterns and Administr=tive Structyr
Major Public Lawt/Poticy
Disability ServiCei,ACt of 1986- least restriCtive'alterhafive- principles that miximizi the
independence, rights & dignityof people with disabilities
Federal Republic Basic Law of the Federal Republicof Germany of Germany
- disabled people are entitled tothe same basic riyhts as others
Social Code, Book I- social rights to integration
assistance
Rehabilitation Adjustment Act- funds for rehabilita on andintegration
Severely Disabled Persons Act- integration of severely
disabled persons into employ-ment, working life, andsociety
Israel
22
National Insurance Law of 1954
- every person has the right tovocational rehabilitaticn
Social Welfare Act of 1958
- personal social servicesand rehabilitation services
FUnding Patterns
- targetiroupsintlUdebroad 41sabil1ty:4'5 .,
- eligiblorganizationsinclude incorporated notfor, profit organization,
tertiary institutions,local goVernmentl,incor-porated self interestgroups
AdlinistratiriStruct
- primarl 3 the' iiate
(regiOns-and'coUntry*Iii
- sonie:nntkovernmental4genOe
iparent/chUrchr- smaller,spetialist or localcommunity bated agehcieSstarting to appear ,
Residential Services
- community-based = local(private, not for profit/not for profit/state)
- institutions - state or churches
Vocational training-federal/local
Schools - local/state
Ministry of Labor and'SocialAffairs
- provides 75% of the hudgetfor all services deliveredby the municipalities
National Insurance Institute- benefit payments
Voluntary organizations(eg., Hameshakem Ltd.)
,
primarily throcigh.state andMeal vovernments
some church/private services,
Ministry of Labor and SocialAffairs
- deals with planning,funding,and management of facilities
Rehabilitation Services Admin:-
- supervises programs for per?'sons with severe disabilitieliving in the community'
iguIC %W.W11.011WWWI''
Country Major Public Laws/Policy Fundini:*Ptterns
Republic ofChina
Law of Special Education (1984)
- right to education (6-15)- established special educationprograms
Law for the Welfare of theHandicapped Persons (1989)
- assist to live independentlyand work
- stresses barrier free environ-ments
2 4
Central Government- funds schools and
institutions
Private Providers
- assess parents/clients- if program:is registeredwith the government, wentscan apply for governmentfunds
The Niindaffeh ofRehi '
tion. Enterprises
operates -vOcatiOnal: iineempl oYment rehabil tattOP
,services
Services for The Retarded"--, -
- determine polic,r.-
g:71 s:
"Id
f
:1TXIs
Ministry of Education- Social Education Dept.,- National Special EducatikinCommittee
Ministry of Interior- Social Affairs Dept.
Provipcial Levei- Commission of Education- Social Affairs Dept.
Country and City- Education Dept.- Social Welfare Dept.
PS
004
Table 5
Q01 Factors and (A-Oriented Program Practicesa
Factor Suggestions TO Maximize The QOL Factor
Satisfaction Encourage person, family, adiocate's input to IPP
Ask the person to evaluate personal satisfaction with-the services received
Build successes and positive feedback into habilitation environments
Maximize the amount of disposable income that is under the person's control
Safeguard and promote the physical quality of the home
Promote quantity and quality of person's possessions
Stress and allow for valued social roles and activities
Competence/Productivity
-Develop basic abilities in communication, mobility, self-help and social
leisure skills
Develop functional living and employment skills
Use prosthetics and environmental accomodation to reduce relevant mismatches
between persons and their living-work environment
Empowerment/Independence Allow choices over home, employment, activities, possessions and community
activities
Safeguard the person's health, nutrition and fitness
Ensure adequate medical, dental, optical, physical therapy and nutritional
services
Social Belonging/Community
Integration
Promote access to community such as shops, leisure facilities and places of
education
Encourage a range of friends, family members, colleagues and peers
aAdapted from Blunden (1988), O'Brien (1987) and Schalock and Kiernan (1990)
26
now appearing in the international disabilities field (Done-
gan & Potts, 1988; Dossa, 1989; Reiss, 1989). We feel that
there is a definite need to conduct research studies regarding
quality of life, focusing on at least the following four
important research questions:
Correlate objective and subjective QOL measures.
Evaluate interventions that improve both objective and
subjective QOL scores.
Determine whether improvements in one area effect
improvements in another. For example, is a person's QOL
improved through empowerment, employment, and/or least
restrictive alternatives?
Determine which models and factors of QOL for disabled
persons apply to other populations.
A set of principles to guide these research efforts is
presented in Table 6.
Refer to Table 6
In summary, there are many persons with disabilities
throughout the world who are expressing a new way of thinking
about people with disabilities. They are beginning to develop
personal futures plans that include personal relationships,
positive roles in the community, and increased control over
their lives. Never before has the concept of quality of life
been a more important issue in the field of disabilities than it
22
28
Table 6
QOL Principles To Guide Research Efforts
-A
1. The study of QOL requires an indepth knowledge of people
and their perspectives.
2. The study of oOL for people labeled mentally retarded or
disabled 17equires that the label be set aside.
3. The measurement of QOL should be tied to values and linked
to measures of QOL for all the nation's citizenry.
4. The measurement of OOL requires multiple methodologies.
5. Family assessments that are driven by family choices, and
that are flexible, non-judgmental, and emphasize the
development of family strengths need to be developed.
6. The application of OGL data is important in developing
resources and supports for persons with disabilities and
their families.
23 p,
is today. It is our strong belief that the work and framework
presented in this initial approach to QOL measurement will not
guarantee an increased quality of life for persons with
disabilities, but rather a method of asking questions to help
evaluate the quality of life experience. In that sense, we hope
that this and subsequent efforts will be viewed as a tool towork more creatively at public policy, service design, service
delivery and program evaluation.
24
References
Andrews, F.R. & Whithey, S.B. (1976). Social indicators of
well-being: Americans' perceptions of life quality. New
York: Plenum Press.
Blunden, R. (1988). Programmatic features of quality services.
In M.P. Janicki, M.W. Krauss & M.M. Seltzer (eds.),
Communit residences for ersons develo mental
disabilities: Here to stay (pp. 117-122). Baltimore: Paul
H. Brookes Publishing Company.
Campbell, A., Converse, P.E. & Rogers, W.L. (1976). The quality
of American life: Perceptions, evaluations and
satisfactions. New York: Russell Sage Foundation.
Donegan, C. & Potts, M. (1988). People with mental handicaps
living alone in the community. The British Journal of
Mental Subnormality, 34(66), 10-21.
Dossa, P.A. (1989). Quality of life: Individualism or holism?
A critical review of the literature. International Journal
of Rehabilitation Research, 12(2), 121-136.
Goode, D.A. (1988). Quality of life for persons with
disabilities: A look at the issues. Final report for a
conference held in Washington, DC. April 30-May 1, 1988.
Keith, K.D., Schalock, R.L., & Hoffman, K. Quality of life
questionnaire: 1986 version. Lincoln, NE: Region V Mental
Retardation Services.
2531
Lehman, A.F. (1988). A quality of life interview for the
chronically mentally ill. Evaluation and Program Planning,
11, 51-62.
Milbrath, L.W. (1982). A conceptualization and research
strategy for the study of ecological aspect'', of the quality
oflife. Social Indicators Research, 10, 133-157..
O'Brien, J. (1987). A guide to ]ife-style planning. Using the
activities catalog to integrate services and natural
support systems. In B. Wilcox and G.T. Bellamy (eds.) A
comprehensive guide to the activities. catalog (pp. 175-
189). Baltimore: Paul H. Brooks Publ. Co.
Reiss, S. (1989). Cross-cultural images of mental retardation.
AAMR News and Notes, 2(6), 6.
Schalock, R.L. (1990). Quality of life: Perspective and issues.
Washington, D.C.: American Association on Mental Retarda-
tion.
Schalock, R.L., Keith, K.D. & Hoffman, K. (1990). Quality of
life standardization manual. Hastings, NE: Mid-Nebraska
Mental Retardation Services, Inc.
Schalock, R.L., Keith, K.D., Hoffman, K. & Karan, O.C.
(1989). Quality of life: Its measurement and use in human
service programs. Mental Retardation, 27(1), 25-31.
Schalock, R.L. & Kiernan, W.E. (1990). Habilitation planning
for adults with disabilities. New York: Springer Verlag.
26
32
24-
Shea, W.R. (1976). The quest for a high quality of life. In J.
Farlow and W.R. Shea (eds.), Values and the quality of life
(pp. 1-5). New York: -cience History Publications.
27
33
Footnotes
aAuthors' affiliations nnd mailing addresses include:
Bartnik, Edward
"Konig, Andreas
Lee, Chun-Shin
Reiter, Shunit
Schalock, Robert L.
Wu, Fang
AUTHORITY FOR INTELLECTUALLY HANDICAPPEDPERSON-SOUTHWESTERN REGION22 Queen St. (2nd Floor), PO Bcx 912Fremantle, Western Australia.' 6160
Vocational Rehabilitation BranchTraining Dept., International Labour OfficeBureau International Du travailCH 1211 Geneve 22, Switzerland(Dr. Kgnig's work is, iqdependent from -- anddoes not necessarily reflect -- that of theIntertional Labor Office)
Director-Voc tional Training Center forthe Mentally Retarded77, Yu-Ying Rd., Chung-LiTaiwan, R.O.C.
School of EducationUniversity of HaifaMt. Carmel, Haifa 31 999, Israel
Hastings College andMid-Nebraska Mental Retardation ServicesBox 1146Hastings, NE 68901
SHUANG CHI FOUNDATION FORMENTALLY RETARDED CHILDRENNo. 2, Alley 81, Lane 113, Section 2Chih Shan Rd., ShinLin DistrictTaipei, Taiwan, 111, R.O.C.
3428
QUALITY OF LIFE QUESTIONNAIRE: RESPONDENT DEMOGRAPHIC PROF1L E(1990 VERSION)
Person's Name: Age: Gender: Male : Female:City/State/ Country:Marital Status: Single, Never Married : Married : Divotred: Widow/ Widower:Highest educational grade completed: Approximate total income (in thousands)
Current Health Condition (Check the category that best describes the person) :
Chronic health impairment (heart, diabetes, arthritis, emphysema)Intellectual impairment (mental retardation)sensory/Neurological impairment (epilepsy, traumatic brain injery)Physical impairment (cerebral pay)Emoional impairment (autism, mental illness)No major health impairment
Current Living/Work/Educational Status [check one in each (a, b, 0) sectic
a. Living(I) Independent (rents/owns home, apartment)
Iv (2) Semi-independent (in a home setting, but with some txpervision)ko
(3) Supervised (e.g., group home)..(4) Specialized facility (hospital, nursing home, institution)
For which ever one checked, for how long have you lived in this arrangement? (years)
b. Wiiik(1) Regular employment (self employed, part-time, full-time)(2) Employed, but received ongoing support(3) Sheltered/segregated work (e.g., sheltered workshop)(4) Unemployed (check one)
(a) not seeking employment (e.g. homemaker)(b) seeking or has sought employmenP,
(5) RetiredFor which ever one checked, fix how long have you been doing it? (years)
c. Educational Program(1) Public education (community college, GED, continuing =cation)(2) MR/DD related educational/training services(3) No formal educational/training services
1 5
QUALITY OF LIFE QUESTIONNAIRE(1990 Version)
NAME: DATE: EVALUATOR/RESPONDENT
Mild= If the person is verbal, have him/her answer each of the following questions according to how he/she honestly feels.Help the person with any word(s) that is (are) not understood. If the person is nonverbal, have gysk staff independentevaluate the person on each item And use the average score for each item. Each of the four quality of life factors(satisfaction, competence/productivity, empowermentfmdependence and social belongingkommunity integration) isscored separately. The range is 10-30 per factor. A total score is obtained by simply adling the four factor scores.
Ouality of Life Factor SomaSatisfaction:Competence/Pmductivi :
Empowerment/IndSocial Belonging/Community Integra ion:Total Score:
Question --kabigimiaggirc$SAILSEACILOE1. Overall, would you say that life:
3 2Brings out the hest in you Treats you like everybody
else
1
Doesn't give you a chancechance
2. How much fun and enjoymentdo you get out of life?
Lots Some Not much
3. Compared to others, are youbetter off, about the same,or less well off?
Better About the same Worse
4. Are most of the things that happento you:
Rewarding Acceptable Disappointing
5. How satisfied are you with yourcurrent home or living arrangement?
Very Satisfied Somewhat satisfied Unsatisfied or veryunsatisfiw
5. Do you have more or fewerproblems than other people?
Fewer problems The same number ofproblems as others
More problems than others
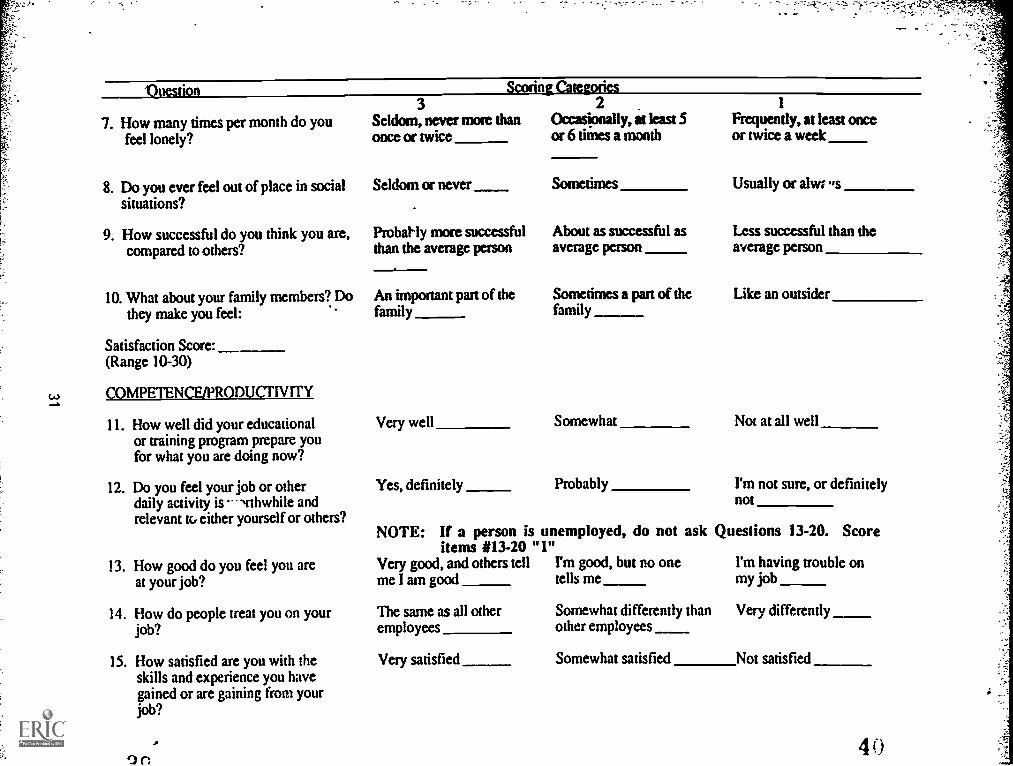
37
"Ouestion ScorinLcareganes
7. How many times per month do youfeel lonely?
3Seldom, never mote thanonce or twice
2Occasionally, it least 5or 6 times a month
Frequently, at least onceor twice a week
8. Do you ever feel out of place in socialsituations?
Seldom or never Usually or alwr ,sSometimes
9. How successful do you think you are,compared to others?
Probally more successfulthan the average person
About as successful asaverage person
Less successful than theaverage person
10. What about your family members? Do Sometimes a part of the Like an outsiderAn important part of thethey make you feel: family family
Satisfaction Score:(Range 10-30)
COMPETENCE/PRODUCI'IVITY
11. How well did your educational Very well Somewhat Not at all wellor training program prepare youfor what you are doing now?
12. Do you feel your job or otherdaily activity is --,rthwhile and
Yes, definitely Probably I'm not sure, or definitelynot
relevant to either yourself or others?NOTE: If a person is unemployed, do not ask Questions 13-20. Score
items #13-20 "1"13. How good do you feel you are Very good, and others tell I'm good, but no one I'm having trouble on
at your job? me I am good tells me my job
14. How do people treat you on your The same as all other Somewhat differently than Very differentlyjob? employees other employees
15. How satisfied are you with the Very satisfied Somewhat satisfied Not satisfiedskills and experience you havegained or are gaining from yourjob?
4 0
Onestion
16. Are you learning skilL that will helpyou get a different or better job?What are these skills?
17. Do you feel you receive fair pay foryour work?
18. Does your job provide you withenough money to buy the things youwant?
19. How satisfied are you with thebenefits you receive at the workplace?
20. How closely supervised are you onyour job?
3Scoring Categories
Yes, definitelyPne or moreskills actually mentioned)
Yes, definitely
Yes, I can generally buythose reasonable things Iwant
Very satisfied
2
Am not sure, maybe(vague, general skillsmentioned)
Sometimes
I have to wait to buy someitems or not buy themat all
Somewhat satisfied
1
No, job provides noopportunity for learningnew skills
No, I do not feel I am paidenough
No, I definitely do not earnenough to buy what I need
Not satisfied
Supervisor is present only Supervisor is frequently Supervisor is constantly onwhen I need him or her present whether or not the job and looking over my
I need him or her work
Competence/Productivity Score :(Range 10-30)
EMPOWERMENT/INDEPENDENCE
21. How did you decide to do the job or I chose it because of pay,other daily activities you do now? benefits, or interests
22. Who decides how you spend yourmoney?
23. How do you use health care facilities(doctor, dentist, etc.)?
24. How much control do you have overthingc you do every day, like goingto bed, eating, and what you do forfun?
I do
Almost always on my own
Complete
Only thing available orthat I could find
I do, with assistance fromothers
Usually accompanied bysomeone, or someone elsehas made the appointment
Some
Someone else decided for me
Someone else decides
Never on my own
Link
4 2
Onestion
25. When can friends visit your home?
26. Do you have a key to your home?
27. May you have a pet if you want to?
28. Do you have a guardian or conser-vator?
29. Are there people living with youwho sometimes hurt you, pesteryou, scare you, or make you angry?
30. Overall, would you say that yourlife is: ,
3
As often as I like orfairly often
Yes, I have a key anduse it as I wish
Yes, definitely
Scoring Categories
No, I am responsible formyself
No
Free
Empowerment/Independence Score:(Range 10-30)
SOcIAL BELONGING COMMUNITY INTEGRATION
31. How many civic or community clubs 2-3or organizations (including church orother religious activities) do you belongto?
32. How satisfied are you with the clubs ororganizations (including church orother religious activities) to whichyou belong?
4 3
Very satisfied
2
Any day, as long as someoneelse approves or is there
Yes, I have a key but it onlyunlocks certain areas
Probably yes, but would needto ask
Yes, limited guardian orconservator
Yes, and those problemsoccur once a month oronce a week
Somewhat planned foryou
I only
Somewhat satisfied
Only on certain days
No
No
Yes, I have a fullguardian
Yes, and thoseproblems occur everyday or more than oncea day,
Cannot usually dowhat you want
None
Unsatisfied or veryunsatisfied
4 4
A C'
33. Do you worry about what peopleexpect of you?
34. How many times per week do youtalk to (or associate with) yourneighbog, either in the yard or intheir home?
35. Do you have friends over to visityour home?
36. How often do you attend recreationalactivities (homes, panics, dances,concerts, plays) in your community?
37. Do you participate actively in thoserecreational activities?
38. What about opportunities for datingor marriage?
39. Hdw do your neighbors treat you?
40. Overall, would you say that yourlife is:
Social Belonging/ Community IntegrationScore:(Range 10-30)
3Sometimes, but notaP the time
3-4 times per week
3-4 per month
Usually, most of the time
I am married, or have theopportunity to date anyoneI choose
Seldom
1-2 times per week
Sometimes
1-2 per month
Frequently, about halfthe time
I have limited opportunitiesto date or mayry
Very good or good (invite Fair (Say hello, visit, tttc.)you to activities, coffee, etc.)
Very worthwhile Okay
Never or all the time
Seldom 1-2 times per monthor less
Rarely or never
Less than 1 per month
Seldom or never
I have no opportunity to dateor marry
Bad or very bad (avoid you,bother you, etc.)
Useless
Please consult the 1990 Quality of Life Questionnaire Standardization Manual (R.L. Schalock, K.D. Keith & K. Hoffman) forreliability, validity, normative data, and suggested uses of QOL Questionnaire data. The Manual is available from Mid-Neraska MentalRelardation Services, Inc. P.O. Box 1146, Hastings, Nebraska 68901 (402-462-5107)
46