1 Domestic Content in China's Exports and its Distribution by Firm Ownership* Discussion paper Hong Ma, Tsinghua University Zhi Wang, U.S. International Trade Commission Kunfu Zhu, Academy of Mathematics and System Sciences, CAS International Conference on the Measurement of International Trade and Economic Globalization Aguascalientes, Mexico, 29 Sep – 1 Oct 2014 United Nations Friends of the Chair Meeting on the Measurement of International Trade and Economic Globalization Aguascalientes, Mexico, 2 Oct 2014 Abstract Processing trade and foreign-invested enterprises (FIEs) account for a large share of total Chinese exports. In producing exports, they also use imported inputs disproportionately, which complicates the measurement of domestic content embedded in exports and the distribution of income generated from exports. In this paper, we extend the method developed by Koopman, Wang, and Wei (2012) to further distinguish between Chinese exports by FIEs and Chinese- owned enterprises (COEs), in addition to processing and normal exports. We propose an accounting framework and a detailed estimation procedure that separately account for the production and trade activities of FIEs and COEs. First, we decompose gross exports into domestic and foreign content by firm types. Then, we estimate factor ownership by firm types based on enterprise surveys. Finally, we compute the distribution of domestic content by factor ownership. Empirical estimation is based on China’s 2007 benchmark input -output tables, supplemented by detailed trade and production statistics. Firm heterogeneity within each industry is identified by linking the NBS enterprises survey and the Customs’ firm-level trade data. The empirical results from 2007 indicate the following: (1) domestic content accounted for around 59% of total exports; (2) FIEs operating in China created nearly 45% of the domestic content in Chinese exports, whereas processing COEs only contributed by less than 5%; (3) in terms of income distribution, about 52.6% of the value of Chinese exports was captured by foreign factor owners. * The views in the paper are solely the author’s own opinion. It is not meant to represent in anyway the views of the U.S. International Trade Commission or any of its individual Commissioners.
Transcript
1
Domestic Content in China's Exports and its Distribution
by Firm Ownership*
Discussion paper
Hong Ma, Tsinghua University
Zhi Wang, U.S. International Trade Commission
Kunfu Zhu, Academy of Mathematics and System Sciences, CAS
International Conference on the
Measurement of International Trade and Economic Globalization
Aguascalientes, Mexico, 29 Sep – 1 Oct 2014
United Nations Friends of the Chair Meeting on the
Measurement of International Trade and Economic Globalization
Aguascalientes, Mexico, 2 Oct 2014
Abstract
Processing trade and foreign-invested enterprises (FIEs) account for a large share of total
Chinese exports. In producing exports, they also use imported inputs disproportionately, which
complicates the measurement of domestic content embedded in exports and the distribution of
income generated from exports. In this paper, we extend the method developed by Koopman,
Wang, and Wei (2012) to further distinguish between Chinese exports by FIEs and Chinese-
owned enterprises (COEs), in addition to processing and normal exports. We propose an
accounting framework and a detailed estimation procedure that separately account for the
production and trade activities of FIEs and COEs. First, we decompose gross exports into
domestic and foreign content by firm types. Then, we estimate factor ownership by firm types
based on enterprise surveys. Finally, we compute the distribution of domestic content by factor
ownership. Empirical estimation is based on China’s 2007 benchmark input-output tables,
supplemented by detailed trade and production statistics. Firm heterogeneity within each industry
is identified by linking the NBS enterprises survey and the Customs’ firm-level trade data. The
empirical results from 2007 indicate the following: (1) domestic content accounted for around 59%
of total exports; (2) FIEs operating in China created nearly 45% of the domestic content in
Chinese exports, whereas processing COEs only contributed by less than 5%; (3) in terms of
income distribution, about 52.6% of the value of Chinese exports was captured by foreign factor
owners.
* The views in the paper are solely the author’s own opinion. It is not meant to represent in anyway the views of the
U.S. International Trade Commission or any of its individual Commissioners.
2
I Introduction
Globalization has made production increasingly fragmented across countries, with
roughly two-thirds of world trade accounted by trade in intermediate inputs (Johnson and
Noguera, 2012). In particular, outsourcing and foreign direct investment (FDI) to developing
countries accelerate the “slicing-up” of the global value chain across national borders, thus
widening the gap between the value of gross exports and the actual value added that is created in
the exporting country. 1
Hence, the policies that focus on aggregate trade flow may be very
misleading.
In this paper, we propose a new estimation strategy for the domestic content in China’s
exports by firm types. We focus on China because of its high export/GDP ratio compared to
other large economies, while foreign invested enterprises (FIEs) and processing trade has an
essential role in explaining the rapid growth in its exports. As shown in our estimation results, it
is important to take into account the differences in production technology among firms with
different ownership types and trade regimes.
Production for processing exports use imported intermediates more intensively than for
normal exports and domestic use. Similarly, FIEs (including both wholly foreign-owned firms
and joint ventures) have different patterns compared to Chinese-owned enterprises (COEs),
which include state-owned, collective, and private firms, in using imported inputs. Such
difference in using imported inputs exists within processing exporters as well.2 Processing FIEs
use imported intermediates more intensively than processing COEs.
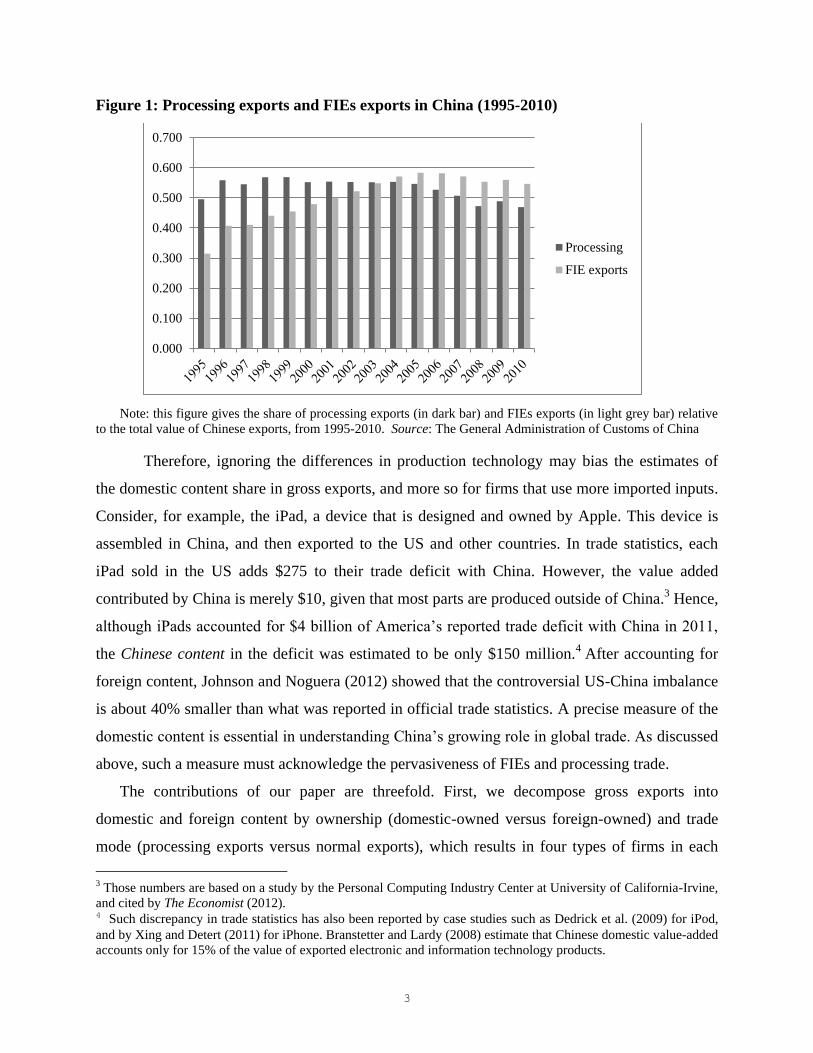
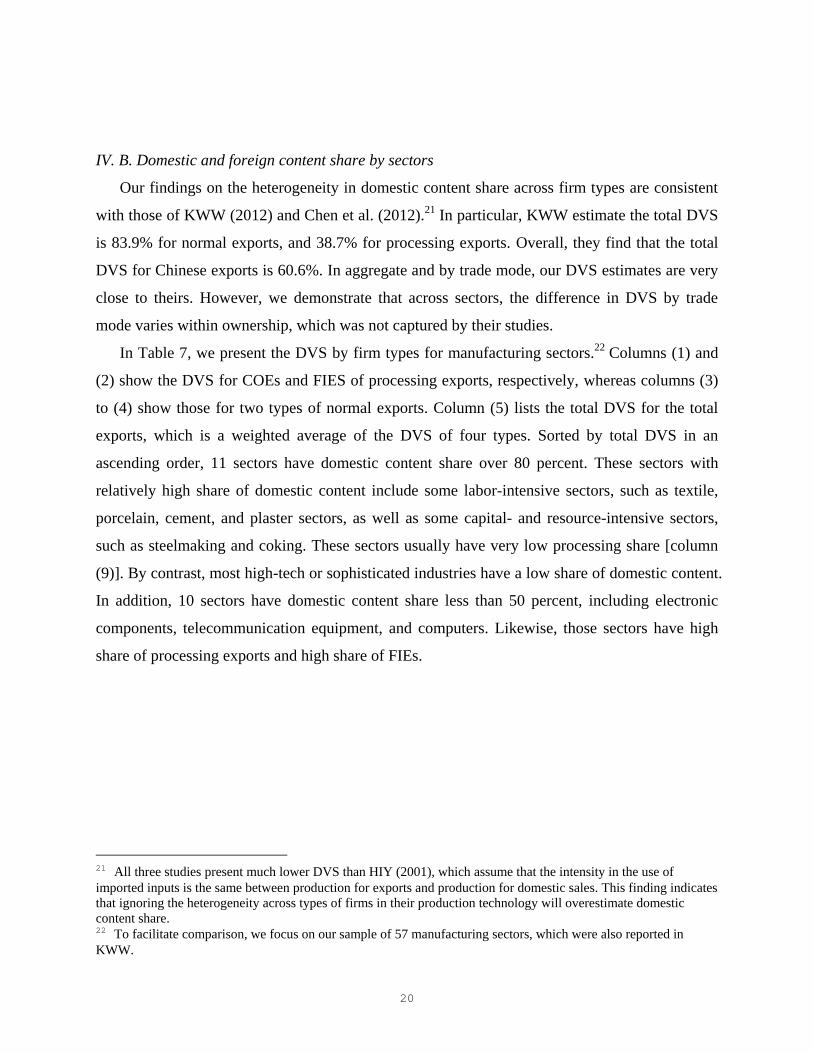
Figure 1 shows that since the early 1990s, the share of exports by the FIEs increased to
more than 50% and remained at that level, whereas the share of processing exports remained at
around 50% and has started to decline since 2004. In addition, although the majority of the
processing firms are foreign-owned, more than 15 percent of processing exports are conducted
by local producers.
1 Exports and GDP are measured by different accounting standards: GDP is measured in value added—a net
concept, whereas export is measured in gross term containing intermediate inputs, which may cross borders many
times before they become final products. 2 This may indicate that multinational firms have better access to foreign components, or are more committed to
import from their foreign parent firm or other affiliates within the same multinational group. We thank a referee for
pointing this out.
3
Figure 1: Processing exports and FIEs exports in China (1995-2010)
Note: this figure gives the share of processing exports (in dark bar) and FIEs exports (in light grey bar) relative
to the total value of Chinese exports, from 1995-2010. Source: The General Administration of Customs of China
Therefore, ignoring the differences in production technology may bias the estimates of
the domestic content share in gross exports, and more so for firms that use more imported inputs.
Consider, for example, the iPad, a device that is designed and owned by Apple. This device is
assembled in China, and then exported to the US and other countries. In trade statistics, each
iPad sold in the US adds $275 to their trade deficit with China. However, the value added
contributed by China is merely $10, given that most parts are produced outside of China.3 Hence,
although iPads accounted for $4 billion of America’s reported trade deficit with China in 2011,
the Chinese content in the deficit was estimated to be only $150 million.4 After accounting for
foreign content, Johnson and Noguera (2012) showed that the controversial US-China imbalance
is about 40% smaller than what was reported in official trade statistics. A precise measure of the
domestic content is essential in understanding China’s growing role in global trade. As discussed
above, such a measure must acknowledge the pervasiveness of FIEs and processing trade.
The contributions of our paper are threefold. First, we decompose gross exports into
domestic and foreign content by ownership (domestic-owned versus foreign-owned) and trade
mode (processing exports versus normal exports), which results in four types of firms in each
3 Those numbers are based on a study by the Personal Computing Industry Center at University of California-Irvine,
and cited by The Economist (2012). 4 Such discrepancy in trade statistics has also been reported by case studies such as Dedrick et al. (2009) for iPod,
and by Xing and Detert (2011) for iPhone. Branstetter and Lardy (2008) estimate that Chinese domestic value-added
accounts only for 15% of the value of exported electronic and information technology products.
0.000
0.100
0.200
0.300
0.400
0.500
0.600
0.700
Processing
FIE exports
4
sector. Separating processing firms from normal exporters to estimate the value added of Chinese
exports has been investigated in literature. However, little attention has been given to the
potential difference in the contribution to value added between multinational firms and local
producers within processing and normal exporters. Based on the decomposition, we extend the
official I/O table to incorporate the input usage difference across trade mode and ownership. 5
Second, we developed a constrained optimization strategy to estimate these I/O coefficients
as they are not readily available. Departing from existing literature which uses industry-level
input-output (I/O) table, we rely on firm-level data from both industrial surveys and trade
statistics to account for the heterogeneity in imported input intensity across different firm types.
Thus, domestic content share in Chinese export by firm types, at both aggregate- and sector-level,
are estimated. Based on the data from 2007, our results indicate that the domestic content
accounted for approximately 59% of gross exports, and the rest is foreign-imported content.
Furthermore, normal exports by COEs account for approximately 50% of domestic content in
Chinese exports, whereas processing COEs only contributed 4.8%. Normal exports by FIEs
account for approximately 17.8%, whereas processing FIEs contribute nearly 27.5%. We further
break down the domestic content of exports at the industry level. We find that industries that are
more sophisticated and have more foreign stakes or larger share of processing exports have lower
domestic content share. Furthermore, at the sector level, the domestic content share of COEs and
FIEs often diverge, even within the same trade mode. Therefore, splitting the I/O table by
ownership is a necessary improvement on existing studies.
Finally, we calculate the share of domestic value-added that goes to foreign factor owners
using information on the ownership structure, and further measure the distribution of income
from export between foreign and domestic factor owners. Domestic value added is defined as
value added that is generated within China, including value added generated by various types of
enterprises operating in China. Thus, it is consistent with the GDP but is different from how the
value added is distributed to different type of factor owners, which includes labor compensation
and profits. The value added generated from production is converted into the income of various
factor owners, which contributes to the gross national income (GNI). Based on the extended I/O
structure with firm heterogeneity in each industry, we estimate that approximately 52.6% of the
5 We group normal exporter and non-exporter together because of their similarity in using imported inputs.
5
value of Chinese exports was captured by foreign factor owners (including factors owned by
Taiwan, Hong Kong, and Macau).
Our study is built on a growing literature that emphasizes the vertical structure of a global
value chain. Notably, Koopman, Wang, and Wei (2012, henceforth KWW) propose a formula to
compute domestic and foreign contents which takes the differences in using imported inputs by
processing exporters versus normal exporters into consideration. Their results are in sharp
contrast to those of Hummels et al. (2001, henceforth HIY), for the latter does not recognize the
role of processing trade. KWW show that the share of domestic content in Chinese
manufacturing exports was about 50% before China’s accession to the WTO, and has risen to
more than 60% since then.
KWW’s approach still depends on industry-level statistics and may have measurement bias
as long as different firms within an industry have different imported input intensities. Recent
studies attempt to obtain direct measures of the I/O coefficients for processing exports. For
example, De La Cruz et al. (2012) show that domestic value added accounts for only 34% of
Mexico’s manufacturing exports on average.
Alternatively, we may rely on firm-level information to mitigate the measurement bias. This
method was first attempted by Feenstra and Jensen (2012) for the US, followed by Ahmad et al.
(2012) for Turkey, and Kee and Tang (2012) for Chinese processing exporters. Using a carefully
cleaned sample of processing firms that merges firms’ export, import, and production
information from 2000 to 2006, Kee and Tang (2012) study the input choices of processing firms
without resorting to the standard input–output data. They find that the average share of domestic
value added in China’s processing exports has risen from 35% in 2000 to 49% in 2006. This
trend is very similar to that reported by KWW, which use industry level data. Similarly, Upward
et al. (2012) obtain consistent results with a more general sample of Chinese firms with trade and
production information from 2003 to 2006.
However, although firm-level data provide rich information, it may not be applicable to cases
with less suitable data. Furthermore, relying solely on firm-level information may result in the
loss of generality and prevent us from understanding the economy as a whole. Thus, our paper
chooses to group firms based on their characteristics and integrate the information of firm
heterogeneity with industry-level data (I/O tables) to minimize the aggregation bias in official
I/O statistics. We draw information from firm-level data to make the grouping appropriate.
6
To sum, we developed a framework and an estimation procedure that separately accounts for
the production and trade activities of FIEs and COEs. Although our empirical investigation is
based on Chinese data, our method is also applicable to other emerging economies that engage in
massive processing trade or have significant FDI inflows, such as Mexico and Vietnam. In a
general sense, correctly accounting for domestic contents in trade is essential for a precise
understanding of world trade and global imbalance, as well as the distribution of gains across
nations, considering that two-thirds of world trade is trade in intermediate inputs.
The rest of the paper is organized as follows: Section II provides a conceptual framework to
estimate the shares of domestic value added in a country’s exports. Section III presents the data
and our estimation strategy. Section IV provides the results of the estimation. Section V
concludes.
II. Theoretical Framework
A non-competitive I/O table as shown in Table 1 for an n-sector economy, is needed to
estimate the domestic and foreign content of a country’s exports.6 Z
D and Z
M are nхn input
matrices, where superscripts denote the sources of inputs, namely, D for domestic and M for
imported. Clearly imported and domestic intermediate inputs are accounted separately, capturing
the poor substitutability between domestic and foreign inputs (therefore called “non-
competitive”).7 Similarly, Y
D and Y
M are nх1 vectors for final use. X, E, and M denote output,
export, and import vectors (nх1), respectively. Finally, V is a 1хn vector for direct domestic
value added (i.e., primary inputs including labor and capital).
6 “Domestic value added exports” is often used interchangeably in literature with “domestic content” in exports.
However, the two measures are not always equal except for some special cases. As emphasized in Koopman et al.
(2014), domestic content includes value added exports, as well as domestic value-added that was first exported in
intermediate goods and then embodied in imports and returned home. Likewise, domestic content includes pure
double counting terms, considering that intermediate goods cross borders multiple times. This is a shortcoming for
all single-country I/O models, given that in such a framework, imports are assumed to be completely sourced from
foreign countries. This problem may be very important for a country that exports a large amount of inputs for
offshoring production, such as the US. However, this is much less of a concern for China, given that only a tiny
share of China’s value-added embodied in its exports returns home after further processing abroad.. 7 Chen et al. (2004) first develop a “non-competitive” type I/O model for China. However, this model does not
provide a systematic method to estimate separate input–output coefficients for producing processing exports versus
those for other final demands.
7
Table 1: the Non-Competitive I/O table
Output
Input
Intermediate Uses
Final Use Exports
Total Output
or Imports (C+I+G)
DIM 1, 2, …., n 1 1 1
Intermediate
Inputs
Domestic
1
.
.
n
DZ DY E X
Imports
1
.
.
n
MZ
MY 0 M
Value Added 1 V
Total Inputs 1 TX
Note: Table 1 gives a typical non-competitive I/O table which distinguishes domestic inputs and imported inputs.
The superscripts D and M denote domestic and imported source, respectively. ZD and ZM denote domestic and
imported intermediate inputs, respectively; YD and YM denotes final demand vectors for domestic products and
imported ones, respectively; X, E, M, and V denote outputs, exports, imports and primary inputs vector, respectively.
zijD (zij
M), an element in Z
D (Z
M), denotes the domestic (imported) inputs of sector i used by
production in sector j. Similarly, xj denotes the output of sector j. Furthermore, denote
]/[][ j
D
ij
D
ij
D xzaA and ]/[][ j
M
ij
M
ij
M xzaA . By the market clearing condition, we obtain
)( EYXAX DD (1)
MM YXAM (2)
We can express the output vector X, the total domestic content share (DVS) in final demand,
and the total foreign content share (FVS) in final demand as follows.
Rearranging Equation (1), the output can be written as
)()()( 1 EYBEYAIX DDDD , (3)
where 1)( DD AIB is the “Leontief inverse”, which reflects both the direct and indirect usage
of output in producing the final goods.
Denote ]/[][ jjvjv xvaA as the 1 x n vector of direct domestic value added to output ratio.
Similarly, denote uAM
as the 1 x n vector of imported inputs to output ratio, where u is a 1 x n
unit vector. In matrix notation, the DVS and FVS in the final demand including exports can be
expressed as,
D
v
D
v BAAIADVS 1)(
(4)
DMDM BuAAIuAFVS 1)( (5)
8
Thus, we can show that DVS + FVS = u because output equals total domestic content plus
total foreign content for each sector.8 Moreover, FVS is conceptually similar to the vertical
specialization share defined in HIY (2001).9
In a standard model, export production uses the same technology as that for domestic sales.
Thus, DVS also provides the share of domestic content in exports. However, as noted by KWW
(2012) and Chen et al. (2012), processing exports utilize imported inputs more intensively than
do domestic sales and normal exports. Thus, relying on the standard I/O table may be biased,
since it implicit assumes proportionality in using imported input. Furthermore, FIEs have played
a significant role in China’s economic growth, accounting for about 20% of the total output and
around 50% of total export.10
Based on the observations about FIEs versus COEs as described above, we have to account for
the heterogeneity of firms with different trade mode and ownership to correctly estimate
domestic content. Specifically, we split firms into four groups, namely, processing exports by
COEs (CP), processing exports by FIEs (FP), normal exports and domestic sales by COEs (CN),
and normal exports and domestic sales by FIEs (FN).11
In Section 3, we describe the comparison
of import pattern across these four groups and rationalize our current way of splitting firms.
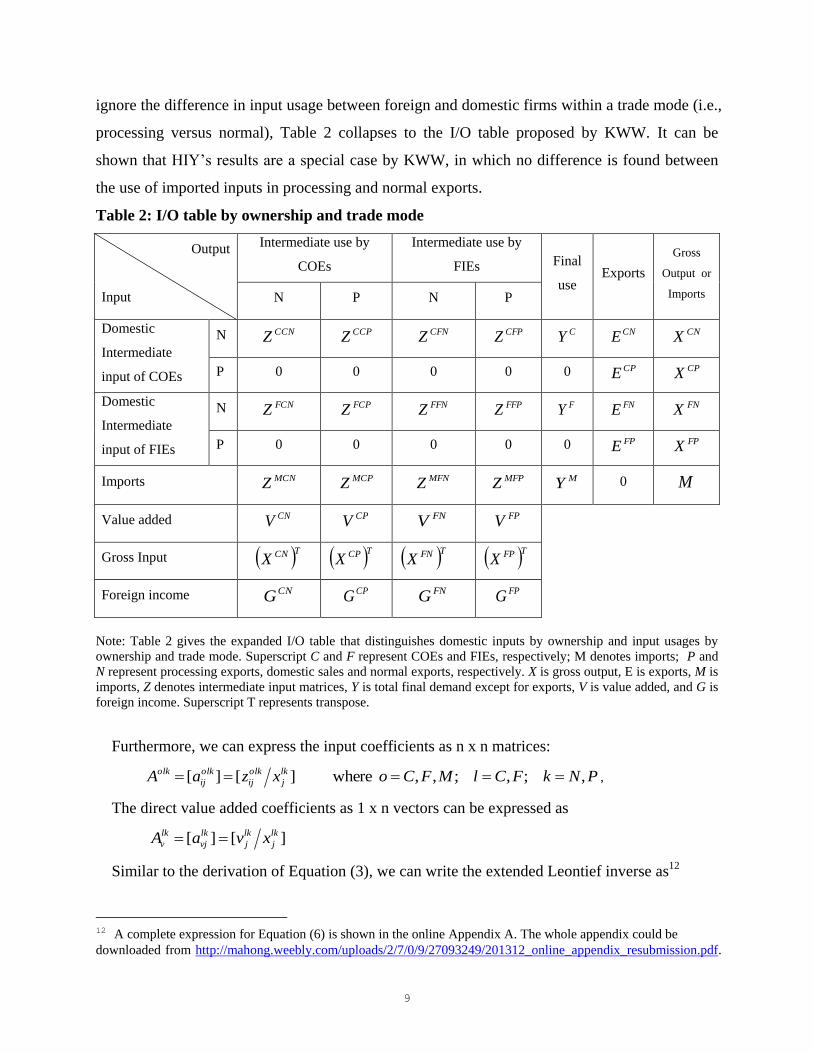
We extend the standard I/O table to incorporate such splits, as shown in Table 2.
For input-output matrices Z, the first letter in the superscript denotes the ownership of the
input supplier; the second letter denotes the ownership of the user; and the last letter denotes the
export mode. C denotes COEs, F denotes FIEs, M denotes imports, P denotes processing, and N
denotes normal exports and domestic sales. For example, an element in ZCFP
, namely zijCFP
,
denotes the intermediate inputs produced by COEs in sector i and used by FIEs in sector j for
processing exports. For the other vectors, the first letter in the superscript denotes ownership and
the second denotes export mode. For example, EFN
denotes the normal exports of FIEs. If we
8 uAIuAuAIuAAFVSDVS DDDM
v 11 ))(())(( .
9 HIY (2001) define the measure of vertical specialization as the imported goods that are used as inputs to produce
a country’s export goods, assuming the use intensity of imported inputs in the same between production for exports
and production for domestic sales. 10 A large proportion of processing trade is conducted by FIEs. However, although the share of processing exports
remained steady at more than 50% during the last decade, FIE’s share in China’s total exports increases steadily
from 31% in 1995 to 58% in 2006, and slightly decreases afterwards (see Figure 1). 11 We assume that normal exports employ inputs in the same proportion as production for domestic sales, following
KWW (2012). We have conducted further statistical tests based on detailed firm-level data to determine the best
split of firm types at sector level to minimize aggregation errors caused by firm heterogeneity. A detailed discussion
of the split and the comparison of key variables between groups are provided in the succeeding section.
9
ignore the difference in input usage between foreign and domestic firms within a trade mode (i.e.,
processing versus normal), Table 2 collapses to the I/O table proposed by KWW. It can be
shown that HIY’s results are a special case by KWW, in which no difference is found between
the use of imported inputs in processing and normal exports.
Table 2: I/O table by ownership and trade mode
Output
Input
Intermediate use by
COEs
Intermediate use by
FIEs Final
use Exports
Gross
Output or
Imports N P N P
Domestic
Intermediate
input of COEs
N CCNZ
CCPZ CFNZ
CFPZ CY
CNE CNX
P 0 0 0 0 0 CPE CPX
Domestic
Intermediate
input of FIEs
N FCNZ
FCPZ FFNZ
FFPZ FY
FNE FNX
P 0 0 0 0 0 FPE FPX
Imports MCNZ
MCPZ MFNZ
MFPZ MY 0 M
Value added CNV CPV
FNV FPV
Gross Input TCNX TCPX TFNX TFPX
Foreign income CNG CPG
FNG FPG
Note: Table 2 gives the expanded I/O table that distinguishes domestic inputs by ownership and input usages by
ownership and trade mode. Superscript C and F represent COEs and FIEs, respectively; M denotes imports; P and
N represent processing exports, domestic sales and normal exports, respectively. X is gross output, E is exports, M is
imports, Z denotes intermediate input matrices, Y is total final demand except for exports, V is value added, and G is
foreign income. Superscript T represents transpose.
Furthermore, we can express the input coefficients as n x n matrices:
PNkFClMFCoxzaA lk
j
olk
ij
olk
ij
olk ,;,;,, where][][ ,
The direct value added coefficients as 1 x n vectors can be expressed as
][][ lk
j
lk
j
lk
vj
lk
v xvaA
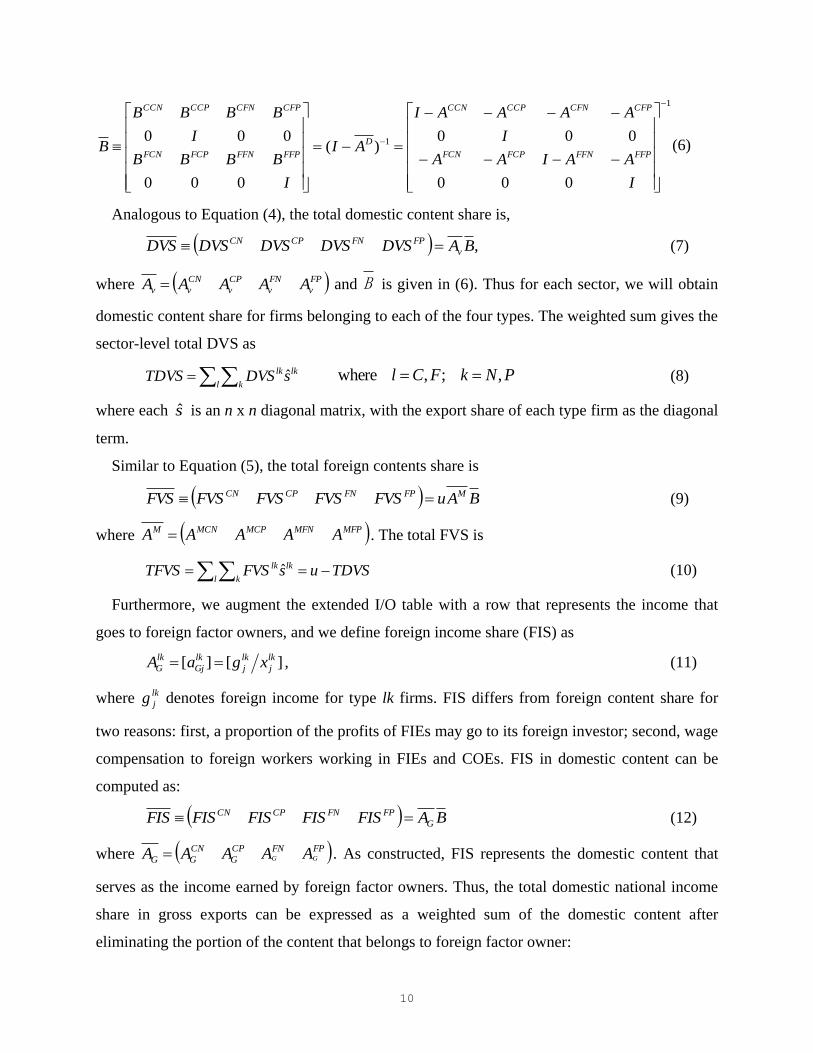
Similar to the derivation of Equation (3), we can write the extended Leontief inverse as12
12 A complete expression for Equation (6) is shown in the online Appendix A. The whole appendix could be
downloaded from http://mahong.weebly.com/uploads/2/7/0/9/27093249/201312_online_appendix_resubmission.pdf.
Note: Table 3 presents the mean and percentile comparisons in input intensity among groups by ownership and trade
mode. The top panel provides summary statistics for the share of imported inputs over total inputs. The bottom panel
provides summary statistics for the share of imported input over total output. Source: the merged sample of customs
data and ASIP
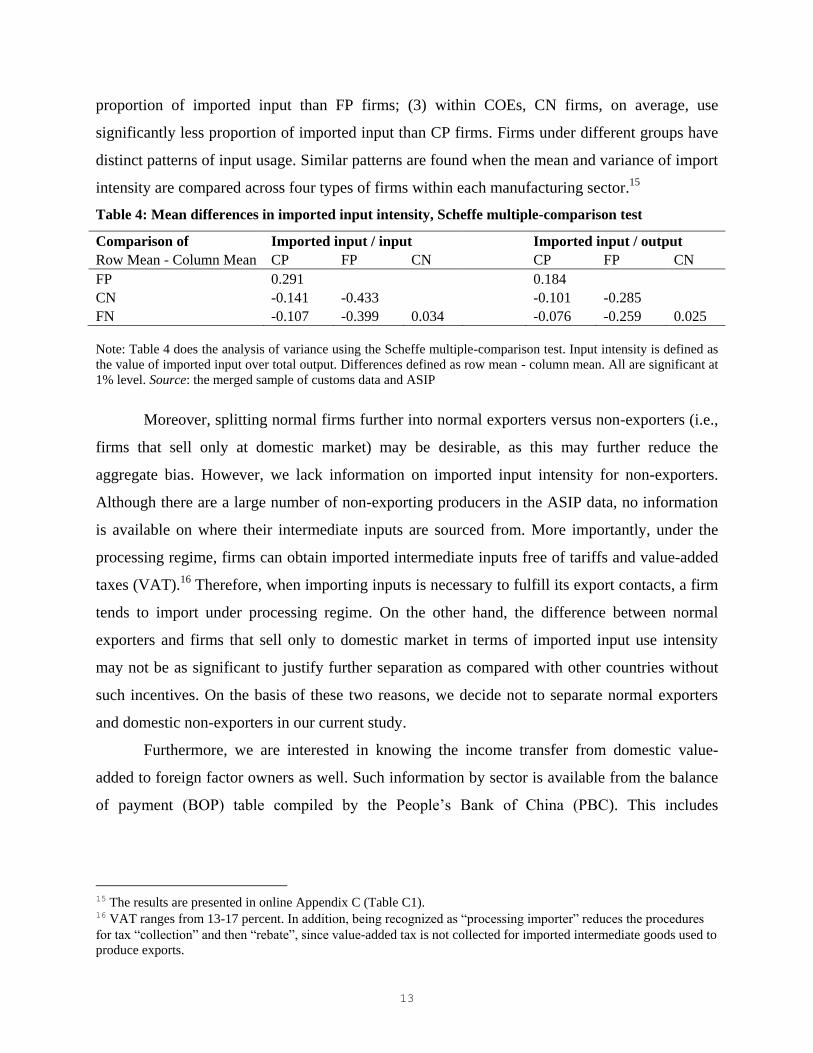
Using the Scheffe multiple-comparison tests, Table 4 provides simple cross-table mean
comparison for the imported input intensity across different groups. All group means are
significantly different from each other. In particular, we stress that (1) within processing exports,
FP firms, on average, use significantly more imported input over total input or output as
compared with CP firms; (2) within FIEs, FN firms, on average, use a significantly less
14 We lack information on imported input intensity for non-exporters. Non-exporters, as well as normal exporters,
however, may use imported inputs indirectly by sourcing the inputs from direct importers or intermediaries.
Therefore, our estimates of import intensity for normal exporters may be understated.
13
proportion of imported input than FP firms; (3) within COEs, CN firms, on average, use
significantly less proportion of imported input than CP firms. Firms under different groups have
distinct patterns of input usage. Similar patterns are found when the mean and variance of import
intensity are compared across four types of firms within each manufacturing sector.15
Table 4: Mean differences in imported input intensity, Scheffe multiple-comparison test
Comparison of Imported input / input Imported input / output
Row Mean - Column Mean CP FP CN CP FP CN
FP 0.291
0.184
CN -0.141 -0.433
-0.101 -0.285
FN -0.107 -0.399 0.034 -0.076 -0.259 0.025
Note: Table 4 does the analysis of variance using the Scheffe multiple-comparison test. Input intensity is defined as
the value of imported input over total output. Differences defined as row mean - column mean. All are significant at
1% level. Source: the merged sample of customs data and ASIP
Moreover, splitting normal firms further into normal exporters versus non-exporters (i.e.,
firms that sell only at domestic market) may be desirable, as this may further reduce the
aggregate bias. However, we lack information on imported input intensity for non-exporters.
Although there are a large number of non-exporting producers in the ASIP data, no information
is available on where their intermediate inputs are sourced from. More importantly, under the
processing regime, firms can obtain imported intermediate inputs free of tariffs and value-added
taxes (VAT).16
Therefore, when importing inputs is necessary to fulfill its export contacts, a firm
tends to import under processing regime. On the other hand, the difference between normal
exporters and firms that sell only to domestic market in terms of imported input use intensity
may not be as significant to justify further separation as compared with other countries without
such incentives. On the basis of these two reasons, we decide not to separate normal exporters
and domestic non-exporters in our current study.
Furthermore, we are interested in knowing the income transfer from domestic value-
added to foreign factor owners as well. Such information by sector is available from the balance
of payment (BOP) table compiled by the People’s Bank of China (PBC). This includes
15 The results are presented in online Appendix C (Table C1). 16 VAT ranges from 13-17 percent. In addition, being recognized as “processing importer” reduces the procedures
for tax “collection” and then “rebate”, since value-added tax is not collected for imported intermediate goods used to
produce exports.
14
investment income and employee compensation at the sector level.17
To split factor income for
each type of firms within a sector, we use the combined dataset described above, which also
provides information for all four types of industrial firms on foreign share in total paid-in capital,
and detail income decomposition in value added, including labor compensation and capital
income (i.e., operation surplus plus depreciation). Thus, we can pin down the foreign share in
domestic value-added for industrial sectors. We use foreign share in registered capital as reported
in the 2008 China Statistical Yearbook for primary and tertiary sectors to obtain the initial value
of the foreign capital income share for FP and FN firms. Assuming that a foreign employee only
works for foreign firms, we split compensation to foreign employees in the sector level income
into the FP and FN’s foreign employee compensation based on the proportion of total employee
compensation for FP and FN.
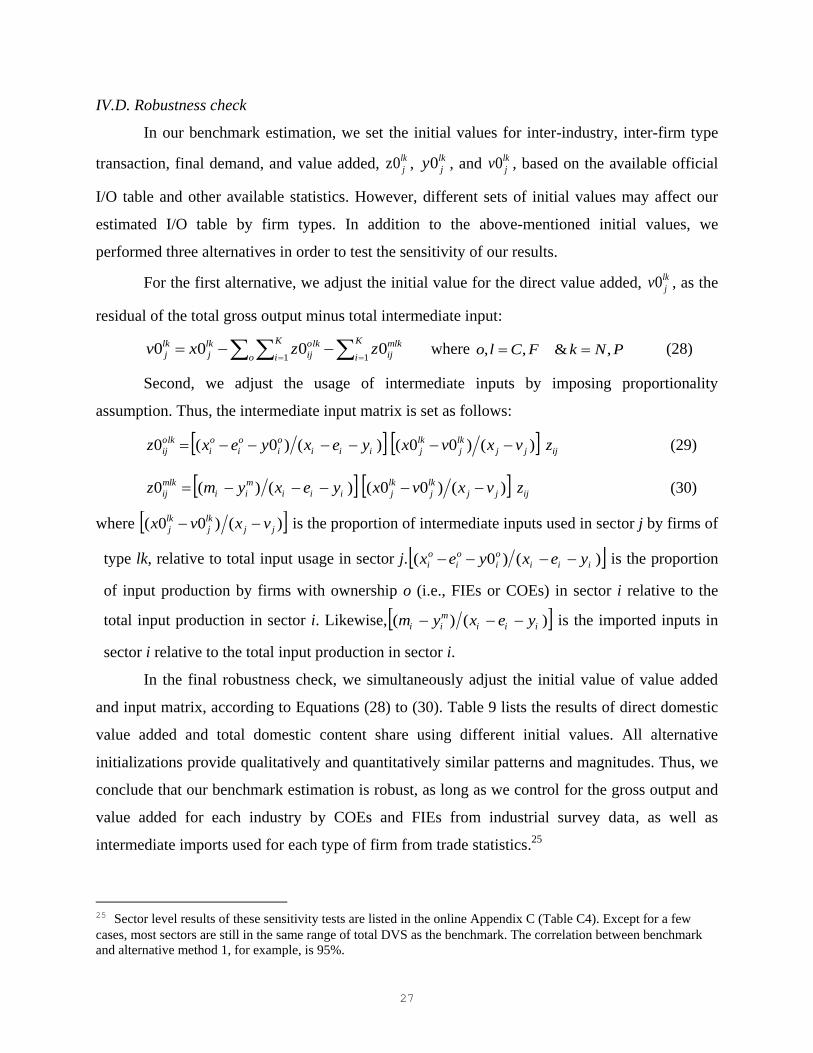
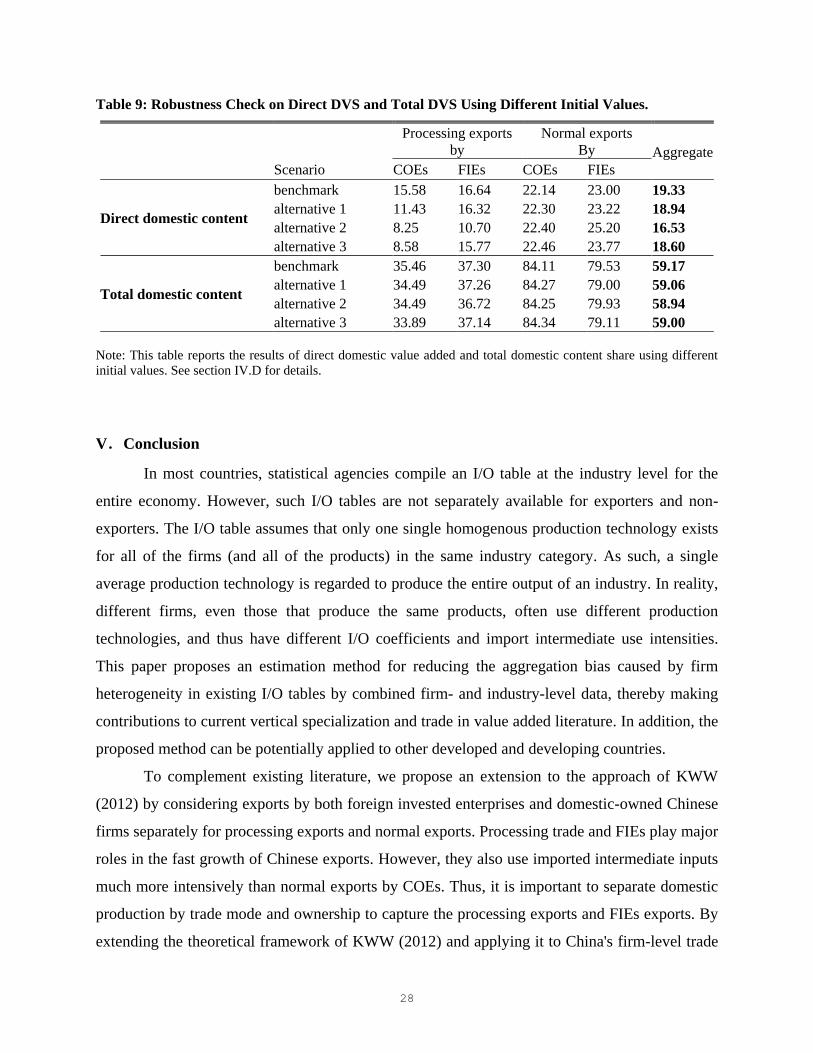
III.B. Estimation Strategy
To extend the official I/O table to account for different input usage across ownership and
trade mode, we augmented the official I/O table with information from other available data
sources presented above. Likewise, we split the official I/O table from NBSC into blocks by
ownership and trade mode. This process ensures that all the aggregate numbers and the balance
conditions in the official I/O table are met by the estimated new I/O table with firm heterogeneity.
The key variables in our estimation model are listed as follows, including both variables
to be estimated and those that we have obtained from the data through construction.
Variables
(o, l=C,F, k =N,P)
Definition # unknowns
variables to be estimated olk
ijz Intermediate good i produced by type o firms and used by type l firms and trade
mode k in sector j 8n2
mlk
ijz Intermediate good i imported to be used by firms of type l in sector j for trade
mode k 4n2
lk
jv Value added by l type firms in sector j for trade mode k 4n
l
jy Final goods used domestically produced by l type firms in sector j 2n
variables with available data
jx , jv , jy , je , jm Output, value added, final demand, and export and imported intermediates by
sector, from the official I/O table
17
More specifically, we use the sector-level income table (expenditure side) in BOP. Foreign investment income
accounts for nearly 95% of the total foreign factor income.
15
ijz Goods i used as intermediate inputs in sector j, without distinguishing
ownership and trade mode, from the official I/O table
l
jx , l
jv Output and value added by type l firms in sector j, known from the ASIP data
the official I/O table, and China Statistical Yearbook.
m
jy Imported final goods of sector j, known from trade statistics and the official I/O
table.
lk
jm Normal and processing imported intermediate inputs of sector j by FIEs and
COEs respectively, known from the combined dataset and the official I/O table
lk
je Normal and processing exports of sector j by FIEs and COEs respectively,
known from the combined dataset and the official I/O table
We now obtain the data for output, export, value added, imports for final demand, and
imported intermediate inputs, by type and sector. These data will be used as controls for our
estimations. To be more specific, sector-level gross output and direct value added by each firm
type are obtained from the ASIP data and the China Statistical Yearbook.18
For example, jx can
be divided into total output of COEs ( c
jx ) and FIEs ( f
jx ). cp
j
cp
j ex denotes the processing exports
of COEs. fp
j
fp
j ex denotes processing exports of FIEs. The output of COEs for normal exports
and domestic use, cn
jx , denotes the difference between output and processing exports ( cp
j
c
j ex ).
Similarly, the output of FIEs for normal exports and domestic use fn
jx is fp
j
f
j ex . Using the
same approach, we can also separate value added jv into c
jv , f
jv .
Our estimation procedure is performed using a quadratic programming model. As
domestic input transaction matrixolkZ , four inter-industry-between-firm-type imported input
transaction matrix mlkZ , four sector-level value added vectors
lkV , and two domestic final
demand vectors oY . Assuming there are n sectors, our estimation will involve 12n
2 unknowns for
intermediate inputs, 4n unknowns for value added, and 2n unknowns for the final demand. First,
we make conjectures about their values based on the trade statistics, the ASIP, and the official
benchmark I/O table. These conjectured values are then used in our estimation as initial values.
For domestic final demand, we set the initial value o
iy0 as residual:
)()()(0 m
iiii
o
i
o
i
o
i yyexexy ,
(15)
18 ASIP dataset only includes industrial firms. For other industries, such as construction and transportation, we can
obtain the sector-level value-added data from the Statistical Yearbooks. The shares of FIEs are estimated based on
total sales of FIEs or total registered capital by FIEs.
16
where )()( ii
o
i
o
i exex indicates the fraction of domestic use (exclusive of export) by o type
firms out of total domestic use in sector i.
The initial values of value added, lk
jv0 , are from decomposing c
jv , f
jv based on the
combined data from the ASIP and the Customs statistics.
The initial values of intermediate imports use coefficients that are generated by allocating
sector i’s imported intermediates lk
im in proportion to input i’s usage in sector j
lk
i
n
j ijij
mlk
ij mzzz
10 , (16)
where lk
im can be estimated from detailed trade statistics, whereas zij are from the official I/O
table. The fraction in brackets denotes the proportion of input in sector i that are used in sector j.
The initial values for domestically produced intermediates are generated through two
steps. First, we compute for the total domestic product i used as intermediate inputs in sector j as
a residual of the total intermediate inputs and imported intermediate inputs:
l k
mlk
ijij
d
ij zzz 0 (17)
Second, we assume a proportional usage of d
ijz :
d
ijj
lk
jii
o
i
o
i
olk
ij zxxexexz )()(0 (18)
where j
lk
j xx denotes the fraction of output of type lk firms in sector j, with o,l=C,F, k=N,P.
Nevertheless, these initial conjectures are not guaranteed to satisfy various economic and
statistical restrictions. Therefore, we cast the estimation problem as a constrained optimization
procedure. In particular, the optimization program is specified to minimize the following
objective function:
n
i o
o
i
o
i
o
i
n
j l k
lk
j
lk
j
lk
j
n
i
n
j l k
mlk
ij
mlk
ij
mlk
ij
n
i
n
j o l k
olk
ij
olk
ij
olk
ij
yyy
vvv
zzz
zzz = S
1
2
1
2
1 1
2
1 1
2
0)0(
0)0(
0)0(
0)0(Min
(19)
17
where z’s, v’s and y’s are the variables to be estimated, whereas z0’s, v0’s and y0’s are the initial
values that have been specified above. Equation (19) minimizes the sum of the differences of the
estimated values from their initial values. Furthermore, the results of this minimization problem
should satisfy the balance conditions of both the official I/O table and the extended table, in
addition to other regularities that we specify below.
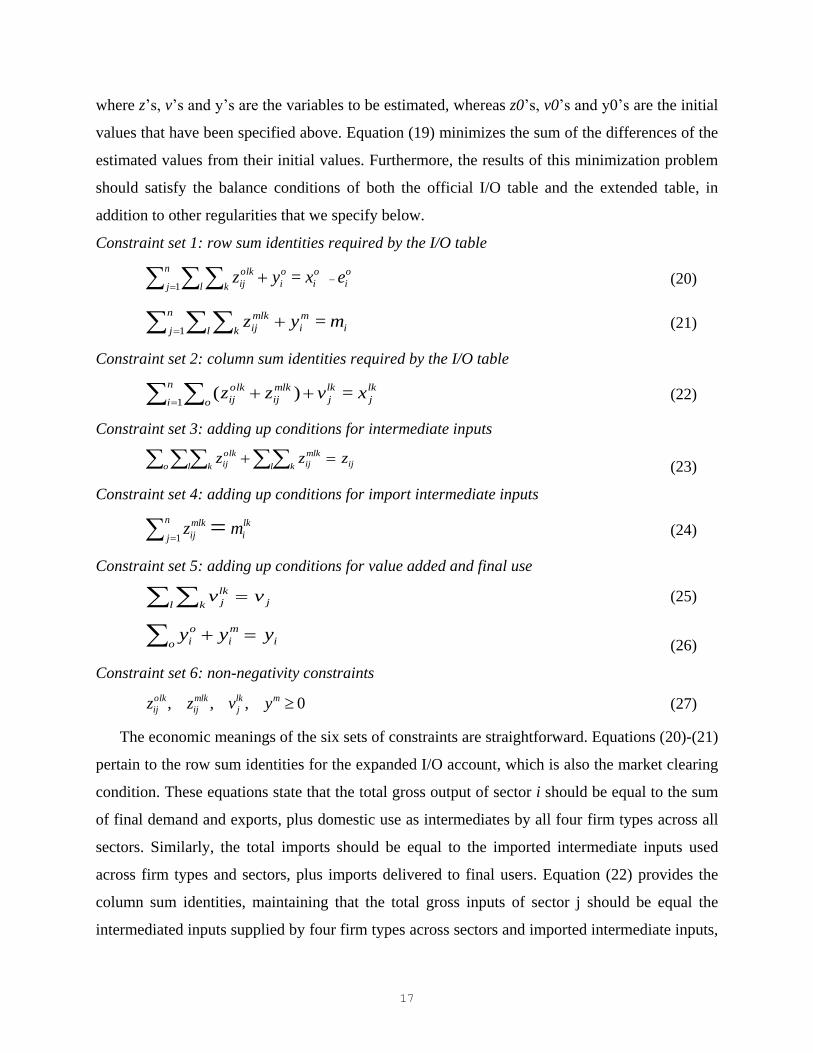
Constraint set 1: row sum identities required by the I/O table
e x =yz o
i o
i
o
i
n
j l k
olk
ij
1 (20)
m =yz i
m
i
n
j l k
mlk
ij 1 (21)
Constraint set 2: column sum identities required by the I/O table
lk
j
lk
j
mlk
ij
n
i o
olk
ij x =vzz )(
1 (22)
Constraint set 3: adding up conditions for intermediate inputs
zzz ijl k
mlk
ijo l k
olk
ij (23)
Constraint set 4: adding up conditions for import intermediate inputs
lk
i
n
j
mlk
ij mz 1 (24)
Constraint set 5: adding up conditions for value added and final use
jl k
lk
j vv (25)
y yy i
m
io
o
i (26)
Constraint set 6: non-negativity constraints
0,,, mlk
j
mlk
ij
olk
ij yvzz
(27)
The economic meanings of the six sets of constraints are straightforward. Equations (20)-(21)
pertain to the row sum identities for the expanded I/O account, which is also the market clearing
condition. These equations state that the total gross output of sector i should be equal to the sum
of final demand and exports, plus domestic use as intermediates by all four firm types across all
sectors. Similarly, the total imports should be equal to the imported intermediate inputs used
across firm types and sectors, plus imports delivered to final users. Equation (22) provides the
column sum identities, maintaining that the total gross inputs of sector j should be equal the
intermediated inputs supplied by four firm types across sectors and imported intermediate inputs,
18
plus primary inputs. Equations (23) to (26) are a set of adding-up constraints that ensure the
consistency of the solution from the model with official statistics on sector-level trade and
transactions within the industry. Finally, Equation (27) indicates the non-negativity condition.19
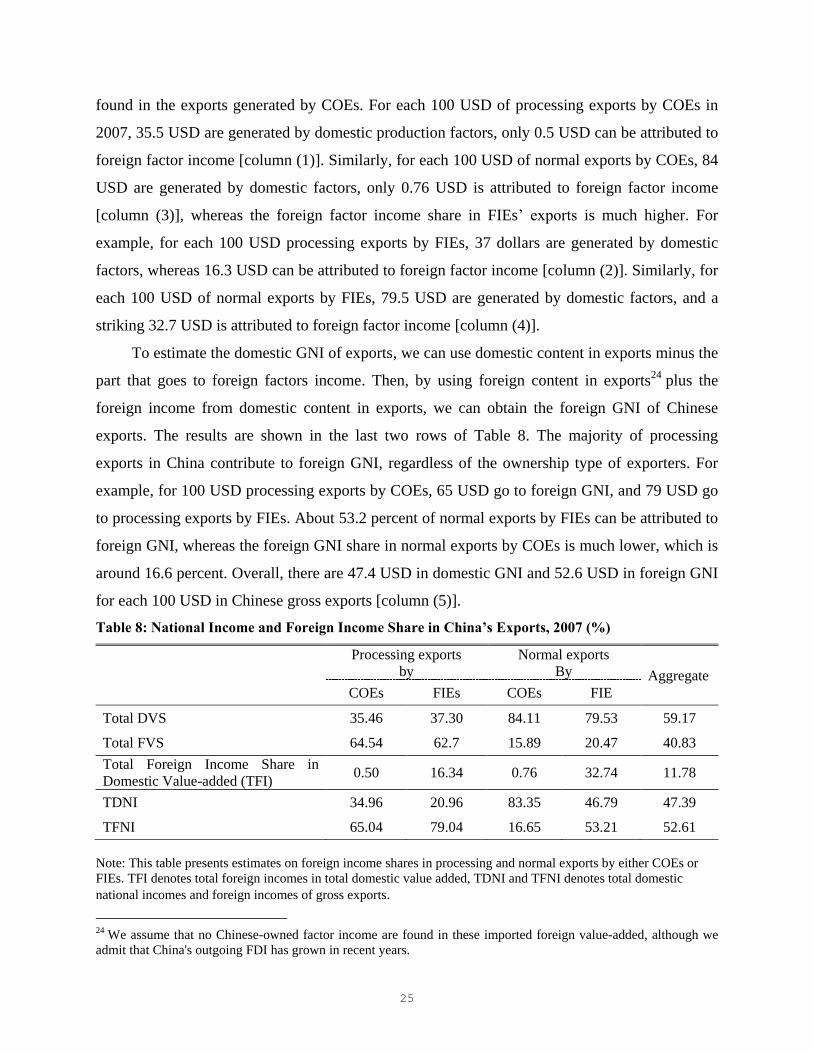
IV. Results
Using the estimation method described in the previous section, we estimated an extended
non-competitive I/O table with separate production accounts by firm ownership and trade
mode.20
The results of domestic and foreign content share of exports by the four type firms in
each industry are estimated based on this estimated I/O table.
IV. A. Share of domestic and foreign content
Table 5 presents our estimation results for the DVS and FVS shares in China’s processing
and normal exports by COEs and FIEs from 2007. These data were calculated using Equations (7)
to (10). Columns (1) to (4) report the direct DVS, total DVS, direct FVS, and total FVS,
respectively. The direct DVS and FVS are the direct value added incurred in each sector as
income to primary inputs, whereas the total DVS and FVS account for the iterated usage of
inputs from other sectors. Several observations have to be stressed, particularly regarding the
DVS in columns (1) and (2). First, comparing rows (1) and (4), although the direct DVS for
COEs is very close to that for FIEs (20.92 versus 18.12), the COEs’ total DVS is larger (75.07
versus 47.13). Second, within each ownership type, the difference between normal and
processing exports in total DVS is larger than the difference in direct DVS. As expected, normal
exports have a higher domestic content share as compared with processing exports, regardless of
the ownership type. Furthermore, COEs have slightly higher total DVS than FIEs for normal
exports, whereas they have slightly lower total DVS than FIEs for processing exports. Third, the
total DVS of COEs within the same trade mode is very close to that of FIEs. For example, if we
compare rows (2) and (5) with processing exporters, the total DVS for COEs is 35.46, whereas
that for FIEs is 37.3. Thus, one may conclude that the difference of total DVS between COEs
19 The partition among the five parts of imports (
cp
im , cn
im ,fp
im ,fn
im andm
iy ) based on Custom import statistics
and UN BEC classification allows for the slight adjustment only to the extent that a feasible solution from model
could be obtained. This reconciliation procedure is implemented in GAMS (Brooke et al, 2005). Related computer
programs and data files will be available at the USITC website for download. 20 In the online Appendix C, we provide all trade share parameters that we use in estimation (Table C2).
19
and FIEs is mainly driven by the ratio of processing to non-processing exports. However, DVS
differs substantially across ownership in certain sectors, as shown in Table 6.
Table 5: The domestic and foreign content share of China’s exports (%), 2007
Total Merchandise Direct DVS
[1]
Total DVS
[2]
Total FVS
[3]
[1] Total exports by COEs 20.92 75.07 24.92
[2] Processing exports by COEs 15.58 35.46 64.52
[3] Normal exports by COEs 22.14 84.11 15.89
[4] Total exports by FIEs 18.12 47.13 52.86
[5] Processing exports by FIEs 16.64 37.3 62.7
[6] Normal exports by FIEs 23 79.53 20.46
[7] Total gross exports 19.33 59.17 40.82
Note: Table 5 presents our estimation results for the share of domestic (DVS) and foreign (FVS) content in China’s
processing and normal exports by COEs and FIEs in 2007.
Overall, about 59.2% of Chinese exports are domestic content, whereas 40.8% are foreign
content, as shown in row (7) of Table 5. In 2007, the gross value of Chinese exports is 1.22
trillion US dollars (USD), and thus the gross domestic content in export is 720 billion USD.
Table 6 shows the composition of the gross exports and gross domestic content in exports by
firm type. Almost half of the domestic content is attributed to COEs’ normal exports, and 4.8%
of domestic content is attributed to the processing exports of COEs, and thus COEs contribute
nearly 55% of gross domestic content in exports. The rest of the content can be attributed to the
FIEs; in particular normal FIEs exports account for about 17.8%, whereas processing FIEs
contribute nearly 27.5%.
Table 6: Distribution of Domestic Content by Firm Type (%), 2007