Domestic Financial Development and International Domestic Financial Development and International Financial Integration Financial Integration Philip R. Lane, IIIS-TCD WBI Paris Seminar Capital Flows, Monetary Policy and Current Issues in International Finance April 2007
Transcript
Domestic Financial Development and International Domestic Financial Development and International Financial IntegrationFinancial Integration
Philip R. Lane, IIIS-TCDWBI Paris Seminar
Capital Flows, Monetary Policy and Current Issues in International Finance
April 2007
2
Introduction
• Two-way interaction between domestic financial development (DFD) and international financial integration (IFI)
• DFD and IFI: complementary versus substitution effects• Policies in relation to domestic financial sector influential in
determining scale and composition of international capital flows• In other direction, foreign investors are pivotal in shaping
evolution of domestic financial sector• Review key conceptual issues• Case studies: (a) China/India; (b) Central and Eastern Europe
3
DFD and IFI: Connections
• DFD: pooling of domestic savings• DFD: creation of domestic financial assets (bank loans; stock
market; bond market; derivatives), to enable activation of investment projects
• Domestic financial intermediaries play central role in IFI (banks, institutional investors, mutual funds)
• Domestic securities markets a key attractor for global investors• In turn, IFI alters scale and nature of domestic financial system
and domestic financial markets
4
Domestic Financial Policies
• Banking system• Stock market• Bond market• FDI• Capital account restrictions on outflows and inflows• Exchange rate regime• Restrictions on domestic institutional investors• Level playing field between domestic and foreign investors?• Regulation/Stability issues
5
The Policy Trilemma
• Pick 2 of 3: monetary independence; fixed exchange rate; international capital mobility
• Trilemma a key constraint in determining domestic financial policies and the level of IFI
• Other major factor: financial stability
6
DFD and IFI: Complements
• In general, natural symbiosis between DFD and IFI• DFD key in maximising gains from IFI• Example: Productivity impact of FDI (Alfaro et al, JIE)• Domestic financial sector the natural ‘gatekeeper’ to channel
external funds to best domestic uses• Foreign expertise helpful in raising efficiency of domestic
financial institutions and markets
7
DFD and IFI: Risks
• Poor domestic regulation and incentive structure can mean that IFI serves to magnify existing distortions, leading to excessivecredit creation and a financial crisis
• Key role of domestic regulatory policies
8
Financial Globalization
More efficient international allocation of capital
Capital deepening
International risk-sharing
The Traditional View
GDP growth
Consumption volatility
Potential Collateral Benefits: Financial market
developmentInstitutional development
Better governanceMacroeconomic discipline
A Different Perspective
The traditional view focuses on the importance of channels through which capital flows could directly increase GDP growth and reduce consumption volatility.
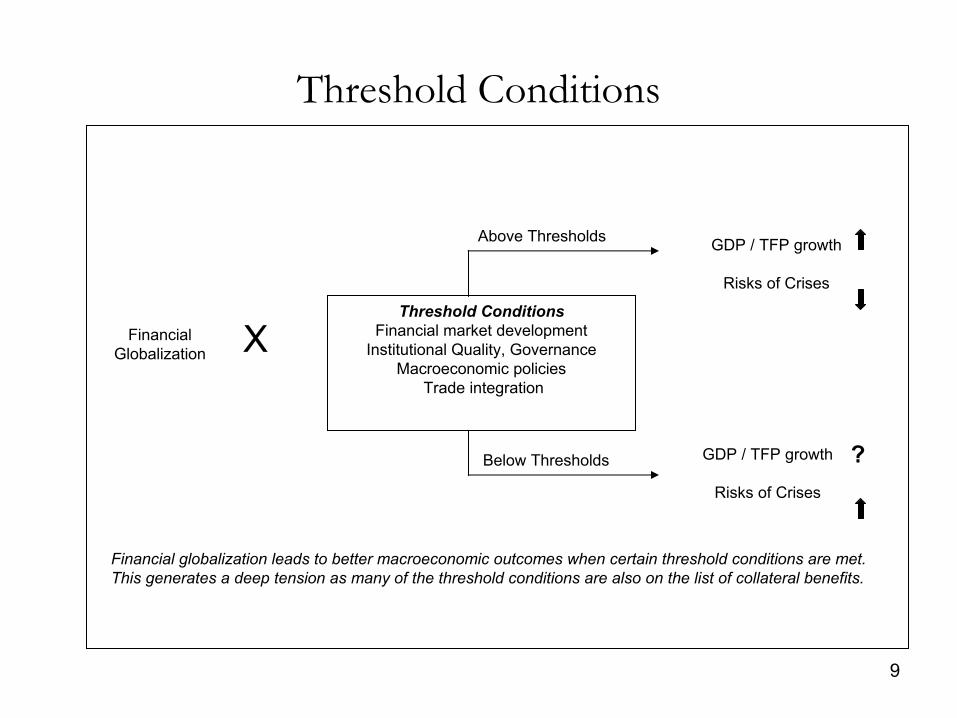
Financial globalization leads to better macroeconomic outcomes when certain threshold conditions are met. This generates a deep tension as many of the threshold conditions are also on the list of collateral benefits.
The International Financial IntegrationThe International Financial Integrationof China and Indiaof China and India
Philip R. Lane, IIIS-TCD and CEPRSergio Schmukler, World Bank
11
IntroductionIntroduction
• Motivation a. China and India have increasing share of world GDP and
world trade.b. China and India have also become important players in the
international financial system.
• Goal of the paper Assess how the increasing economic prominence of China and India is reshaping the international financial system.
12
• Analysis – Basic stylized facts on level and composition of international
financial integration (IFI) of China and India– Relate IFI to policies and developments in domestic
financial sectors– Implications
• Impact on the international financial system• Medium-term evolution of the IFI of China/India
13
• Variables of interest: IFI– Gross holdings of foreign assets and foreign liabilities– The equity-debt mix in international balance sheets– Net foreign asset positions
• Variables of interest: Domestic factors– Financial liberalization and exchange rate/monetary policies– Evolution of the financial sector– Impact of financial reform on savings and investment
14
-0.6
-0.5
-0.4
-0.3
-0.2
-0.1
0
0.1
1985 1987 1989 1991 1993 1995 1997 1999 2001 2003
-0.6
-0.5
-0.4
-0.3
-0.2
-0.1
0
0.1
1985 1987 1989 1991 1993 1995 1997 1999 2001 2003
-0.6
-0.5
-0.4
-0.3
-0.2
-0.1
0
0.1
1985 1987 1989 1991 1993 1995 1997 1999 2001 2003
IFI: Net Foreign AssetsIFI: Net Foreign Assets
G7
East Asia
Eastern Europe
Latin America
China
India
15
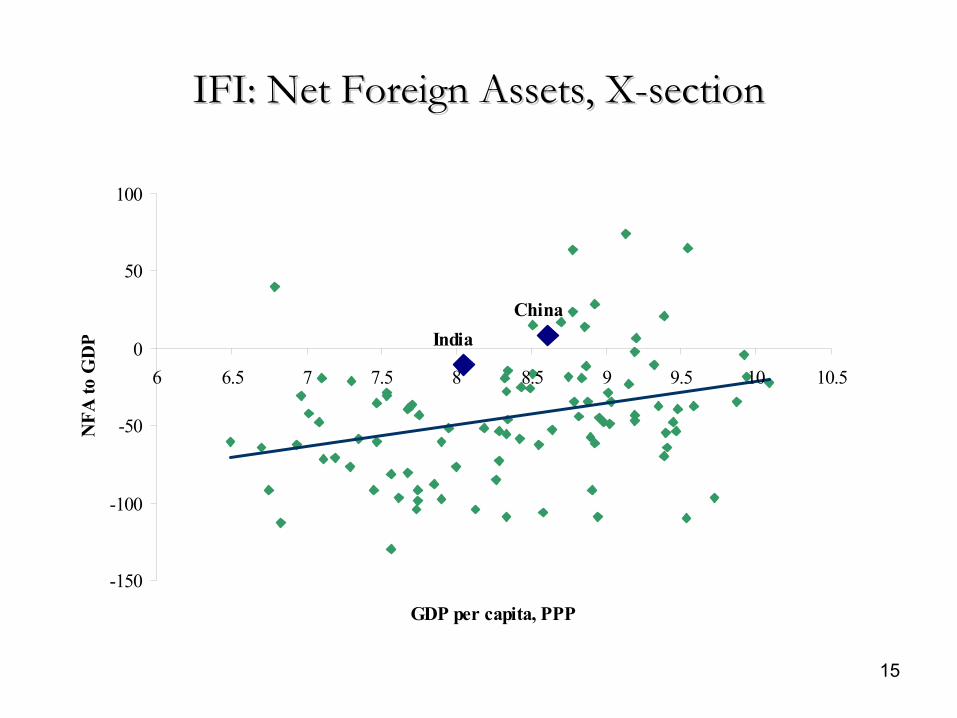
IFI: Net Foreign Assets, XIFI: Net Foreign Assets, X--sectionsection
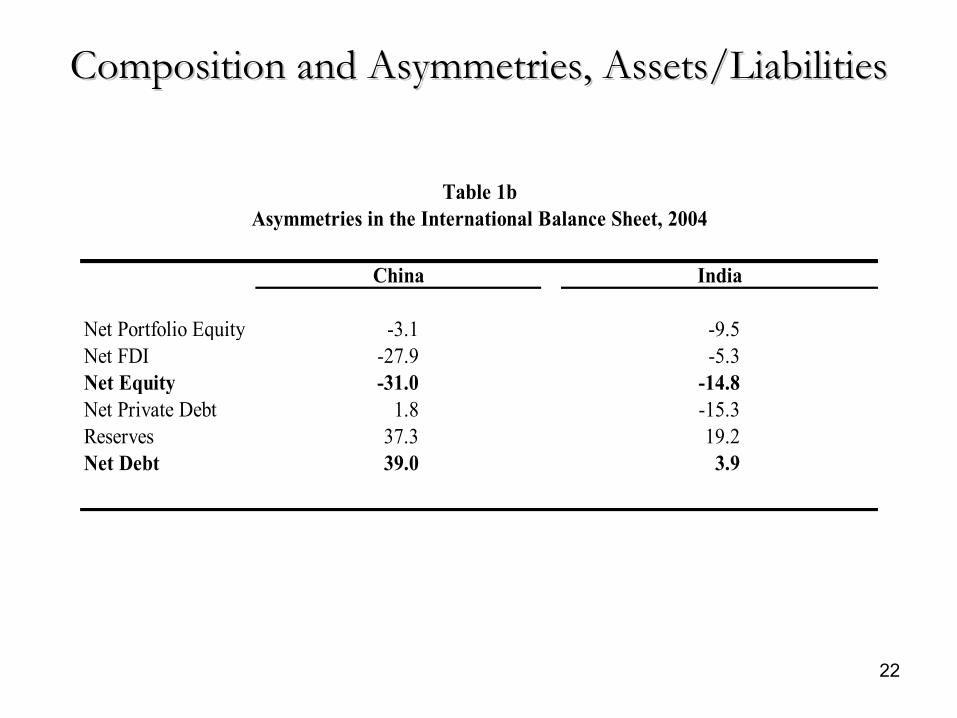
Table 1bAsymmetries in the International Balance Sheet, 2004
China India
23
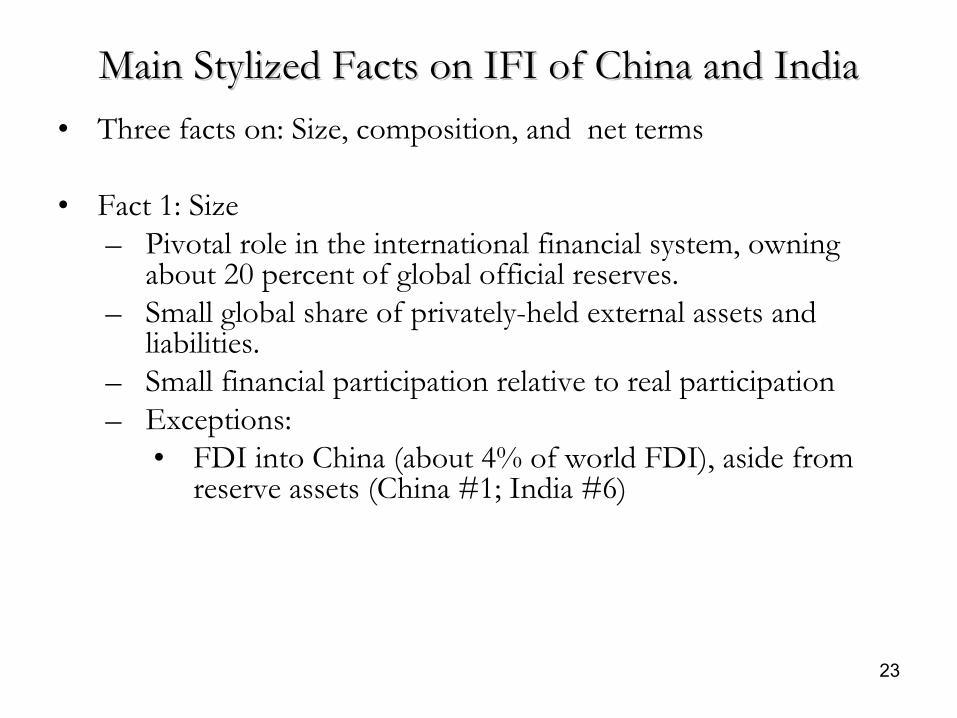
Main Stylized Facts on IFI of China and IndiaMain Stylized Facts on IFI of China and India• Three facts on: Size, composition, and net terms
• Fact 1: Size – Pivotal role in the international financial system, owning
about 20 percent of global official reserves.– Small global share of privately-held external assets and
liabilities.– Small financial participation relative to real participation– Exceptions:
• FDI into China (about 4% of world FDI), aside from reserve assets (China #1; India #6)
24
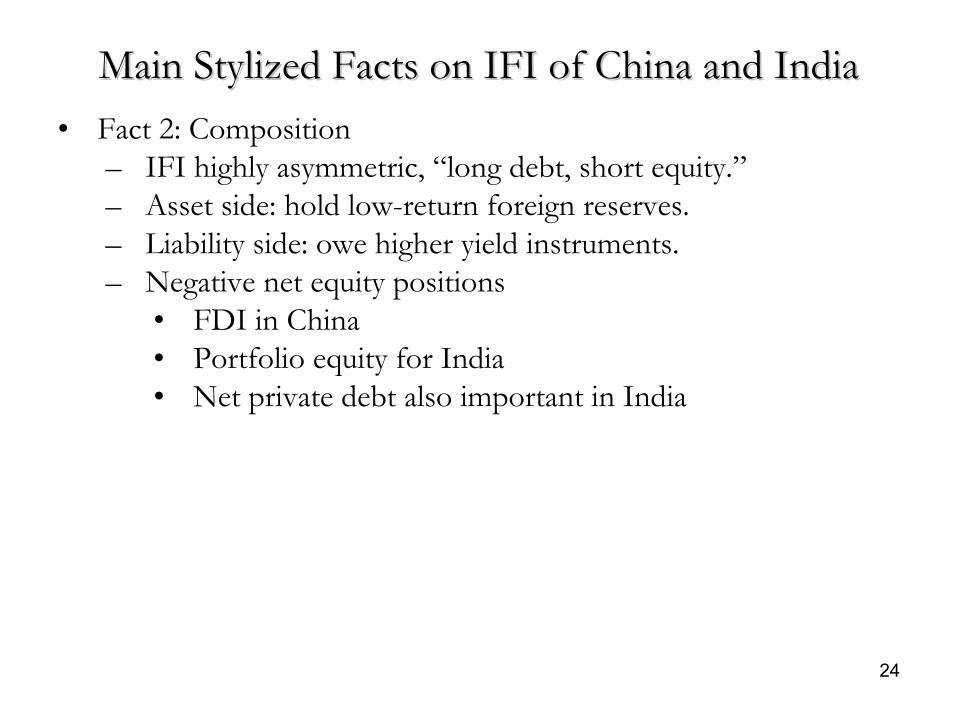
Main Stylized Facts on IFI of China and IndiaMain Stylized Facts on IFI of China and India• Fact 2: Composition
– IFI highly asymmetric, “long debt, short equity.”– Asset side: hold low-return foreign reserves. – Liability side: owe higher yield instruments. – Negative net equity positions
• FDI in China• Portfolio equity for India• Net private debt also important in India
25
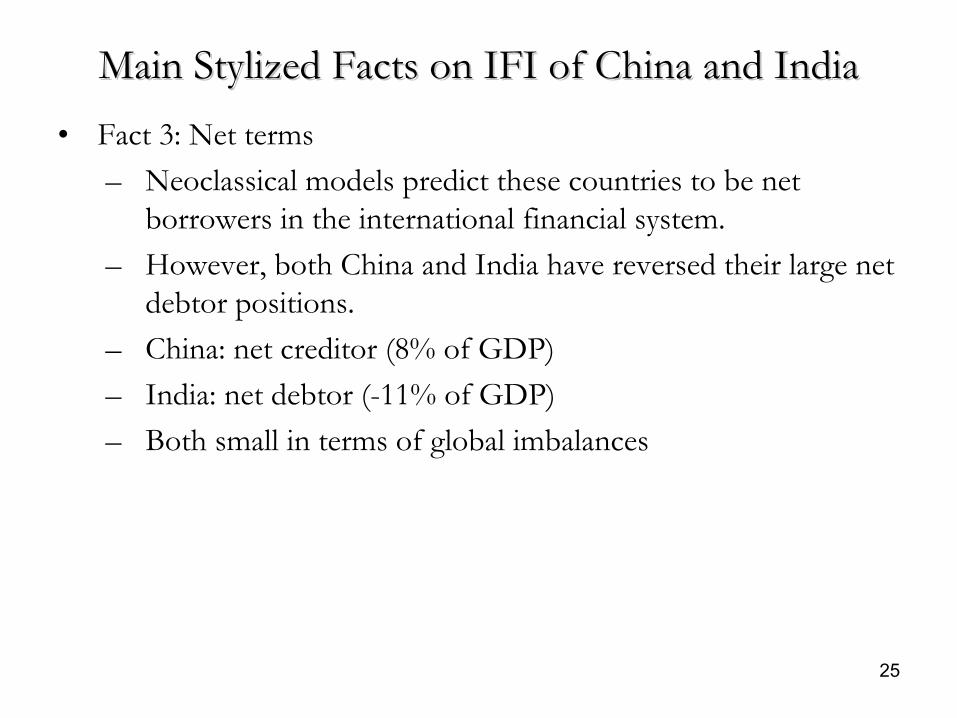
Main Stylized Facts on IFI of China and IndiaMain Stylized Facts on IFI of China and India• Fact 3: Net terms
– Neoclassical models predict these countries to be net borrowers in the international financial system.
– However, both China and India have reversed their large net debtor positions.
– China: net creditor (8% of GDP) – India: net debtor (-11% of GDP) – Both small in terms of global imbalances
26
Main Stylized Facts on IFI of China and IndiaMain Stylized Facts on IFI of China and India• Financial policies essential
– to explain these patterns of IFI; – will likely keep shaping them over the following years.
27
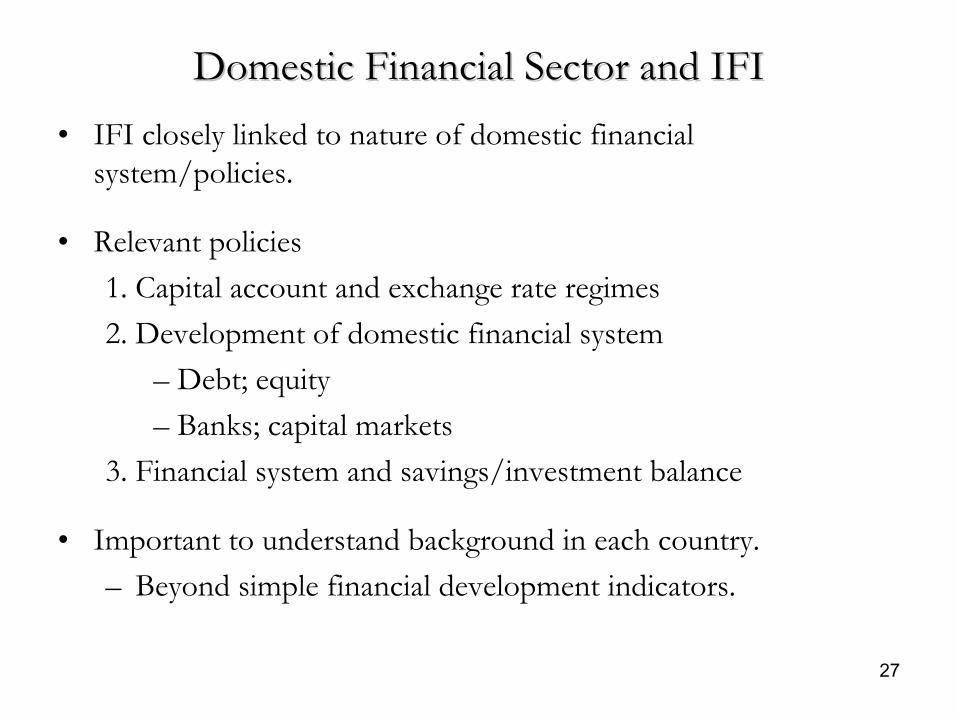
Domestic Financial Sector and IFIDomestic Financial Sector and IFI• IFI closely linked to nature of domestic financial
system/policies.
• Relevant policies1. Capital account and exchange rate regimes2. Development of domestic financial system
– Debt; equity– Banks; capital markets
3. Financial system and savings/investment balance
• Important to understand background in each country.– Beyond simple financial development indicators.
28
Capital Account and Exchange Rate RegimeCapital Account and Exchange Rate Regime• Capital controls as development policy (exports), to control
domestic monetary/financial variables, and to avoid crises.• Controls to the KA shape type of financial integration
– Types of flows; – Volume (less, more via round-tripping).
• Exchange rate target leads to reserve accumulation.
29
Capital Account and Exchange Rate RegimeCapital Account and Exchange Rate Regime• Policy trilemma
– Exchange rate target creates trade-off between monetary policy flexibility and capital account openness.
– Greater exchange rate flexibility • Would allow China and India to combine monetary policy
autonomy with capital account openness.• Would also change composition of flows – less reserve
accumulation, less speculative inflows.• Capital account restrictions increasingly porous – by-product of
increased trade and financial volumes.
30
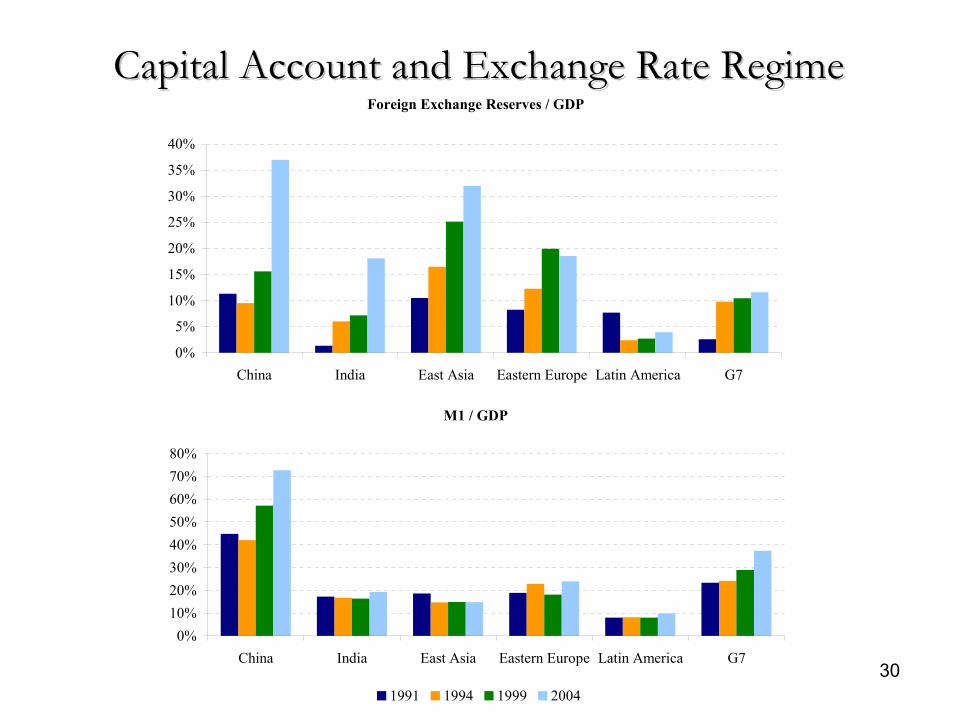
Capital Account and Exchange Rate RegimeCapital Account and Exchange Rate RegimeForeign Exchange Reserves / GDP
M1 / GDP
0%
5%
10%
15%
20%
25%
30%
35%
40%
China India East Asia Eastern Europe Latin America G7
0%10%20%30%40%50%60%70%80%
China India East Asia Eastern Europe Latin America G7
1991 1994 1999 2004
31
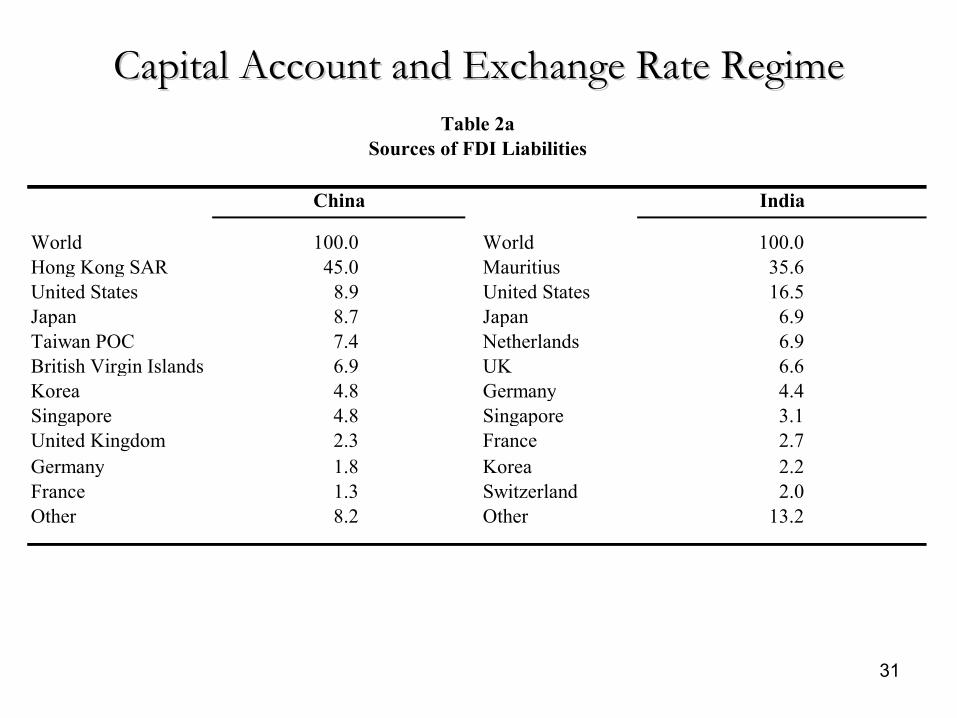
Capital Account and Exchange Rate RegimeCapital Account and Exchange Rate Regime
World 100.0 World 100.0Hong Kong SAR 45.0 Mauritius 35.6United States 8.9 United States 16.5Japan 8.7 Japan 6.9Taiwan POC 7.4 Netherlands 6.9British Virgin Islands 6.9 UK 6.6Korea 4.8 Germany 4.4Singapore 4.8 Singapore 3.1United Kingdom 2.3 France 2.7Germany 1.8 Korea 2.2France 1.3 Switzerland 2.0Other 8.2 Other 13.2
Table 2aSources of FDI Liabilities
China India
32
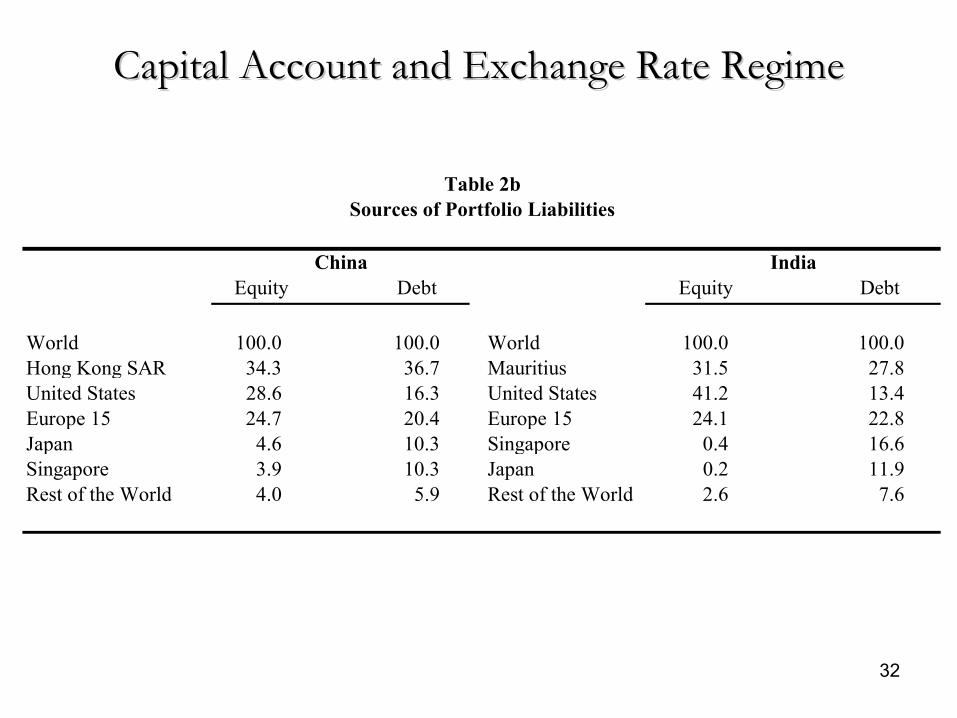
Capital Account and Exchange Rate RegimeCapital Account and Exchange Rate Regime
World 100.0 100.0 World 100.0 100.0Hong Kong SAR 34.3 36.7 Mauritius 31.5 27.8United States 28.6 16.3 United States 41.2 13.4Europe 15 24.7 20.4 Europe 15 24.1 22.8Japan 4.6 10.3 Singapore 0.4 16.6Singapore 3.9 10.3 Japan 0.2 11.9Rest of the World 4.0 5.9 Rest of the World 2.6 7.6
Table 2bSources of Portfolio Liabilities
China IndiaEquity Debt Equity Debt
33
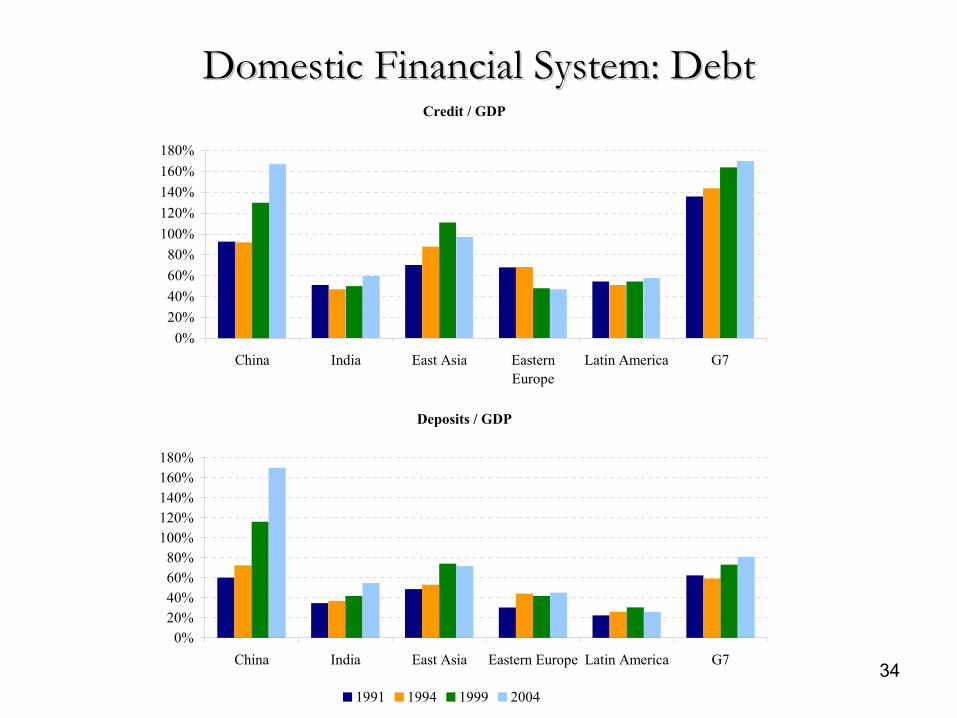
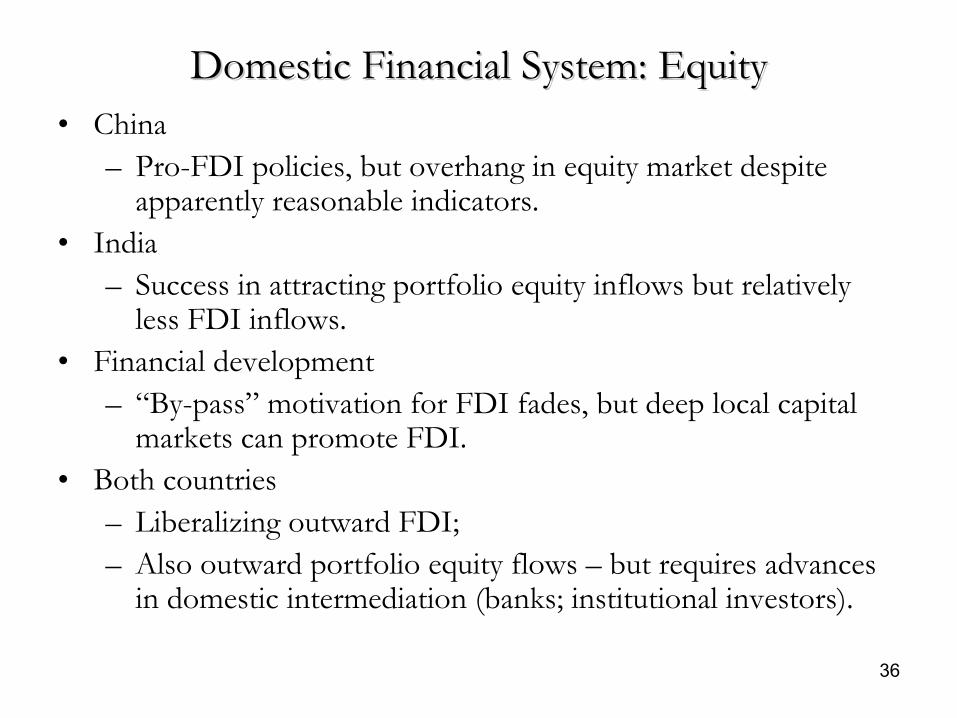
Domestic Financial System: DebtDomestic Financial System: Debt• Aversion to liberal regime vis-à-vis debt borrowing, especially in
foreign currency (typically from abroad ).– East Asia crisis; Indian crisis of 1991.
• Chinese banking sector– NPL overhang; focus of major banks on lending to SOEs;
high (inefficient) lending.– Party explains high reliance on firm internal financing.
• India– Large public deficits financed by domestic banks holding
government bonds – interest rate exposure.• Both countries: corporate bond markets under-developed.
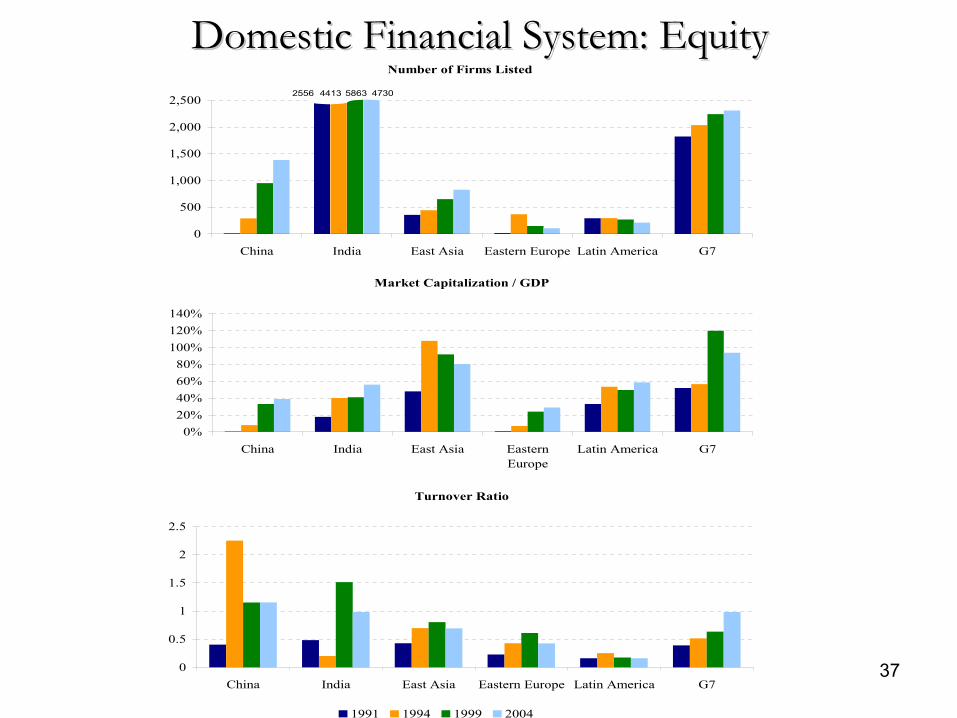
China India East Asia Eastern Europe Latin America G7
4413 5863 47302556
0%20%40%60%80%
100%120%140%
China India East Asia EasternEurope
Latin America G7
0
0.5
1
1.5
2
2.5
China India East Asia Eastern Europe Latin America G7
1991 1994 1999 2004
38
Financial Reform and Savings/Investment BalanceFinancial Reform and Savings/Investment Balance• Financial under-development leads to high savings relative to
investment.• Industrial structure (heavy industry vs. services) also related to
savings. • Corporate governance also related to savings.
– China’s high savings driven by corporate sector (Kuijs)
39
Financial Reform and Savings/Investment BalanceFinancial Reform and Savings/Investment Balance• Financial and other reforms might reduce savings.
– Development of consumer credit would allow households to finance purchase of durables.
– Other reforms (improved social insurance, provision of health, and education services) would also affect savings.
– Improved corporate governance and private participation might lead to reduction in corporate savings.
– Decline in corporate saving also facilitated by development of domestic bond markets and increased focus by banks on private sector firms.
40
Financial Reform and Savings/Investment BalanceFinancial Reform and Savings/Investment Balance• Financial reform might also switch level and composition of
investment.– Level: Less by SOEs, more by private sector.– Composition: Better investments.
• On net, possible negative effect on savings/investment balance.
41
China and India as a Destination for External CapitalChina and India as a Destination for External Capital• China and India not that large destinations, except FDI to China.• Do not appear to have crowded out investment elsewhere.
– Diversion? Direct and indirect channels• To expect: More balanced structure of capital flows.
– Relative rise in • debt and portfolio equity (China), as opposed to FDI; • debt and FDI (India), as opposed to portfolio equity.
• Role of “proxy” markets• Bilateral composition
– Depends on currency policies; regional integration.
42
China and India as International InvestorsChina and India as International Investors• Important only as holders of international reserves.
– Part of development strategy (undervalue exchange rate) with global consequences.
– Lower interest rates, deficit financing, lower inflation.• Costly to accumulate reserves and perpetuate strategy.• Greater balance in outflows.
– Reduction in reserves; – Pick up in outward debt, FDI, and portfolio equity flows.
• Reallocation of external portfolios– Might be good for other emerging markets.
• Regional focus? Depends on integration and currency policies.• Transition: Redeployment of reserves
43
Global Imbalances: Net Foreign Asset PositionsGlobal Imbalances: Net Foreign Asset Positions• Is current configuration stable or just a temporary phenomenon?• Historical examples
– CA deficits of Korea and Singapore averaged 5.0 percent and 14.4 percent respectively during 1970-1982.
– Feasible after crises of the 1990s?– Not great example to the contrary.
• Scenario – Reforms and capital account openness: lower savings rates,
investment inflow – CA deficits (2-5%/year – Dollar-Kraay).– China and India substantial net debtors in the medium-term
(or higher world interest rates). – Transition of deficits to a possible long-run creditor position
44
Global RisksGlobal Risks• Transition to financially liberalized regime
– Evidence on financial integration and (short-run) volatility/ crises/bumpiness
– Crises and political stability– “Learning to be open” - but many lessons learnt?– Robustness of banking sector key– China: efficiency of banking sector– India: fiscal policy– Rest of world: transition from current low interest rate
environment
45
ConclusionsConclusions
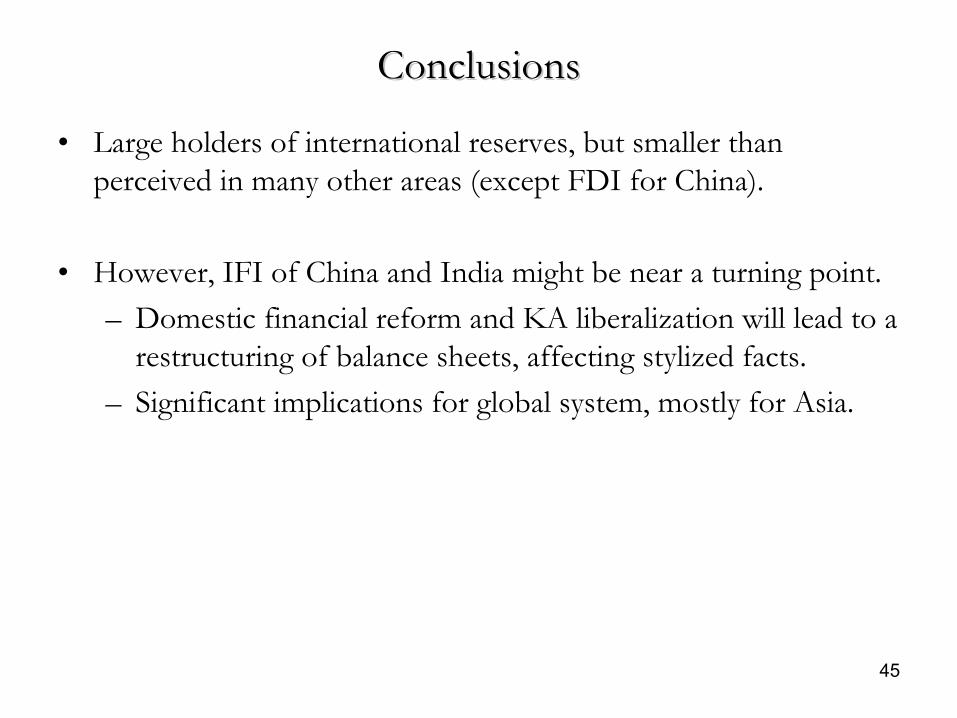
• Large holders of international reserves, but smaller than perceived in many other areas (except FDI for China).
• However, IFI of China and India might be near a turning point.– Domestic financial reform and KA liberalization will lead to a
restructuring of balance sheets, affecting stylized facts. – Significant implications for global system, mostly for Asia.
46
ConclusionsConclusions• Future gross positions
– More investment opportunities to domestic and foreign residents.
– Accumulation of external assets and liabilities by the private sectors in these countries expected to grow.
– Restructuring of inward and outward portfolios.– Diminution in the asymmetries in external liabilities, with a
greater dispersion of holding/inflows (FDI, equity, and debt).
– On the assets side, acquisition of non-reserve foreign assets should see a marked increase.
– Together with the projected increase in their shares in world GDP, China and India are set to become major international investing nations.
47
ConclusionsConclusions• Future net balances
– Much uncertainty and debate. – Emergence of significant medium-term current account
deficits in both countries with financial development (other things equal).• Part of the development process.
• CA deficits and a deceleration in reserve accumulation: – Substantial shift in the roles of China and India in the global
distribution of external imbalances.
48
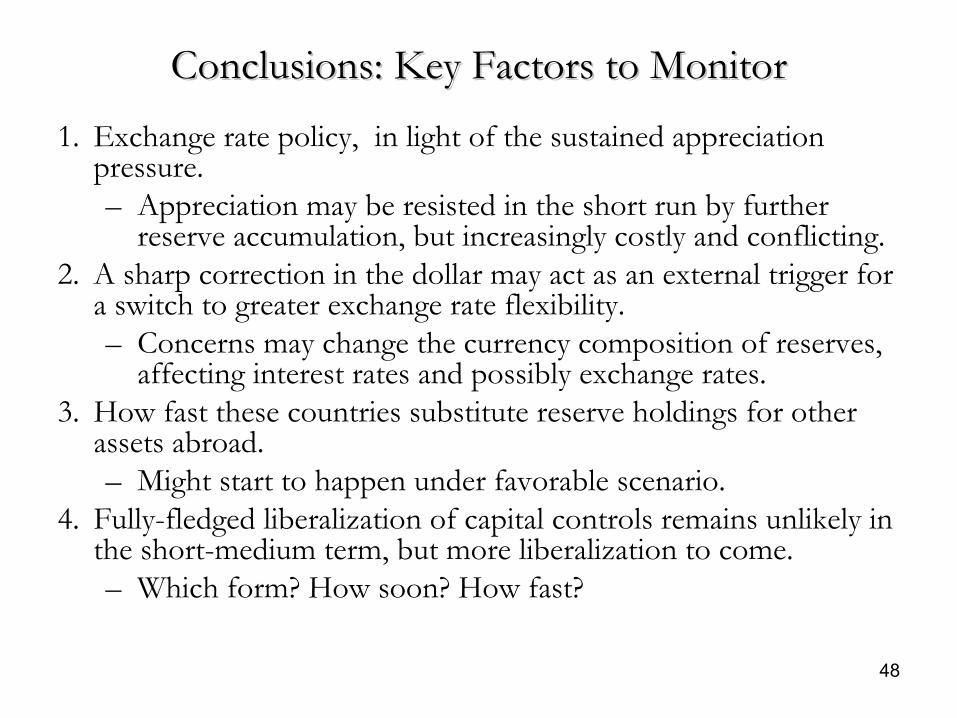
Conclusions: Key Factors to MonitorConclusions: Key Factors to Monitor1. Exchange rate policy, in light of the sustained appreciation
pressure.– Appreciation may be resisted in the short run by further
reserve accumulation, but increasingly costly and conflicting. 2. A sharp correction in the dollar may act as an external trigger for
a switch to greater exchange rate flexibility. – Concerns may change the currency composition of reserves,
affecting interest rates and possibly exchange rates. 3. How fast these countries substitute reserve holdings for other
assets abroad. – Might start to happen under favorable scenario.
4. Fully-fledged liberalization of capital controls remains unlikely in the short-medium term, but more liberalization to come.– Which form? How soon? How fast?
Capital flows to Emerging Europe
Philip R. LaneIIIS, Trinity College Dublin
Gian Maria Milesi-FerrettiInternational Monetary Fund
50
Objective of paper
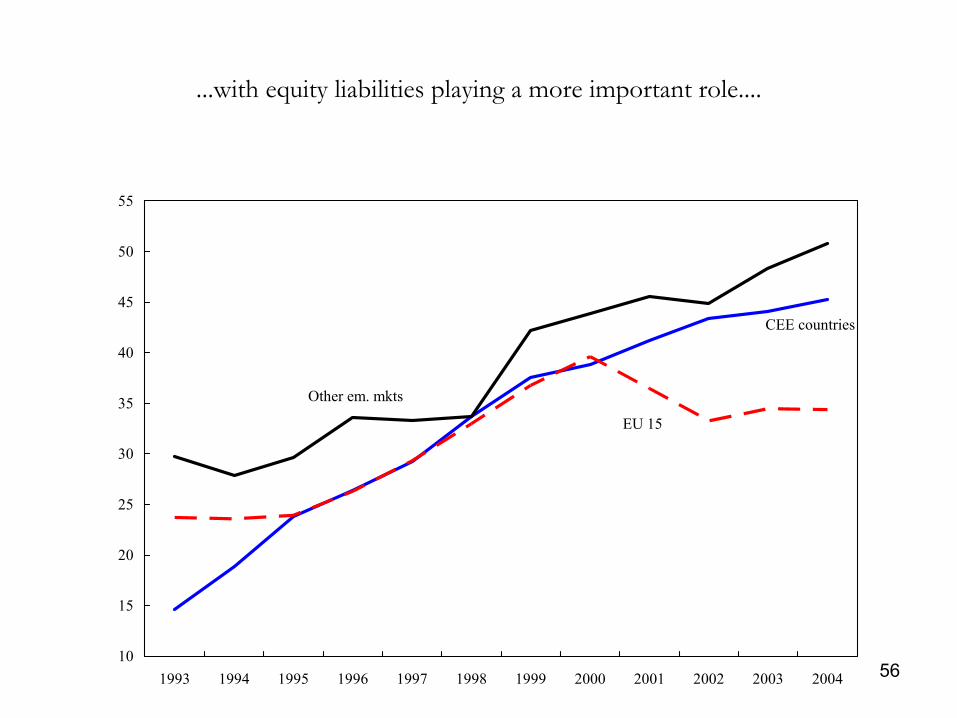
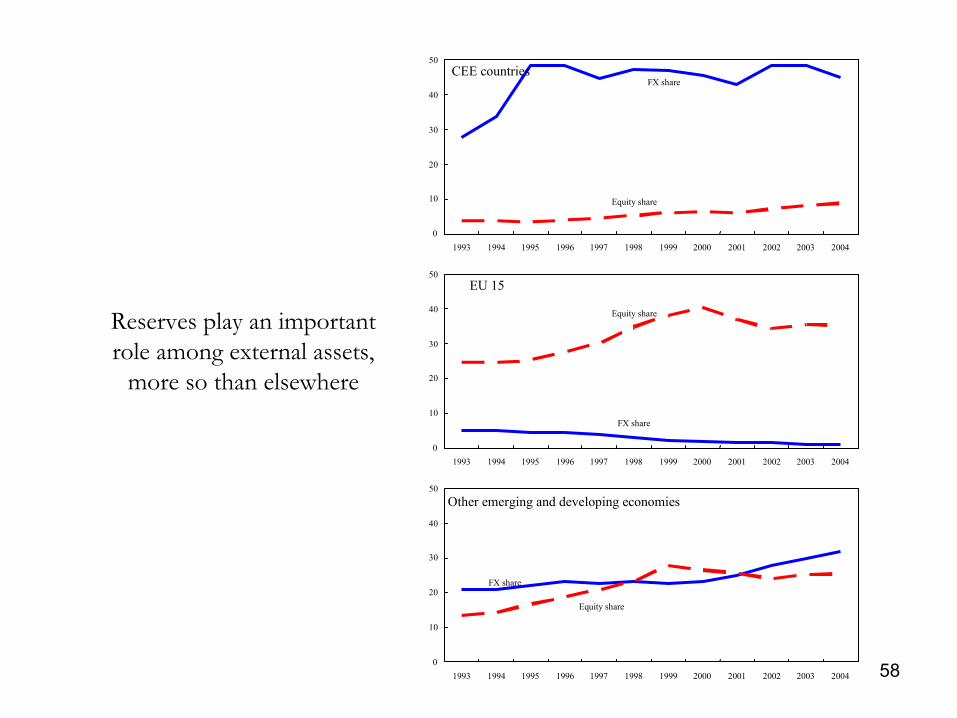
• Put trends in external capital flows and their composition in perspective (compare CEE with EU15, other emerging mkts)
• Provide simple calculations on ‘sustainable’ future capital flows• Draw implications for future trade surpluses
51
Road map
• Capital flows and external position: stylized facts (1995-2004)• Bilateral exposure• Implications for medium-term factor flows
52
Capital flows 1995-2004
• Large! – Initial liabilities very small (except Bul, Hun, Pol)– Strong growth prospects– Obsolete capital