Domestic Hot W Analysi Natio U Water System Piping In is of Benefits and Cost Prepared for: onal Association of Home Builders Prepared by: NAHB Research Center 400 Prince Georges Boulevard Upper Marlboro, MD 20774-8731 www.nahbrc.com December 2010 Report #: 5928-3_12292010 nsulation: t
Transcript
Domestic Hot Water System Piping
Analysis of Benefits and Cost
National Association of Home Builders
Upper Marlboro, MD 20774
Domestic Hot Water System Piping Insulation:
Analysis of Benefits and Cost
Prepared for:
National Association of Home Builders
Prepared by:
NAHB Research Center
400 Prince Georges Boulevard
Upper Marlboro, MD 20774-8731
www.nahbrc.com
December 2010
Report #: 5928-3_12292010
Insulation:
Analysis of Benefits and Cost
Disclaimer
Neither the NAHB Research Center, Inc., nor any person acting on its behalf, makes any warranty,
express or implied, with respect to the use of any information, apparatus, method, or process disclosed
in this publication or that such use may not infringe privately owned rights, or assumes any liabilities
with respect to the use of, or for damages resulting from the use of, any information, apparatus,
method or process disclosed in this publication, or is responsible for statements made or opinions
expressed by individual authors.
NAHB Research Center Report December 2010 Page i
Table of Contents
List of Figures ...................................................................................................................................ii
List of Tables ....................................................................................................................................ii
NAHB Research Center Report December 2010 Page 1 of 24
Domestic Hot Water System Piping Insulation:
Analysis of Benefits and Cost
Background
Increasing the efficiency of water heating equipment is one means to achieve energy savings in the hot
water system; however, the piping distribution system itself is now being scrutinized to determine
opportunities for further hot water system savings. Often accepted approaches to energy savings in the
hot water piping system are to reduce the length of piping to the outlets and to insulate the hot water
pipes. Less regarded as an energy savings feature is the reduction in size of the hot water lines to
outlets, which can reduce pipe losses, as other plumbing system performance issues such a pressure
drop and fluid velocity must be considered. All of these approaches will result in lower piping system
losses. The purpose of this study is to outline the mechanisms of energy savings in the piping
distribution system and to estimate the range of energy savings resulting from pipe insulation based on
simulated hot water use profiles.
This study was commissioned by the National Association of Home Builders (NAHB) with the purpose of
understanding the energy savings available by insulating hot water piping in homes relative to the cost
of the insulation, both in materials and installation. The study includes references to the existing body
of research as well as results of new analyses of hot water distribution systems with various options for
insulating hot water piping.
Background: Hot Water Piping Energy, Water Use, and Loss Mechanisms
Domestic hot water piping systems are designed to deliver hot water from a source (the water heater)
to the outlet. The piping design must account for the source pressure and the design flow rate to
ensure an adequate supply of hot water volume to the outlet. These design constraints directly
influence the energy loss of the piping system. For example, in long plumbing runs, the pipe size may be
increased to reduce flow losses leading to larger volumes of hot water in the piping and increased
energy losses, both during the draw and after the draw as the volume of hot water cools. In addition to
these energy losses during a water use event, occupant control characteristics will affect the total
energy loss from the hot water system such as wasted warm/hot water while waiting for hot water to
arrive at the outlet and the desired water temperature at the outlet (that affects the amount of cold
water mixing) to reach the desired level.
Given these hot water use characteristics that directly affect the total energy use of the hot water
system, an outline of the specific mechanisms contributing to energy (and water) losses is shown in
Table 1.
NAHB Research Center Report December 2010 Page 2 of 24
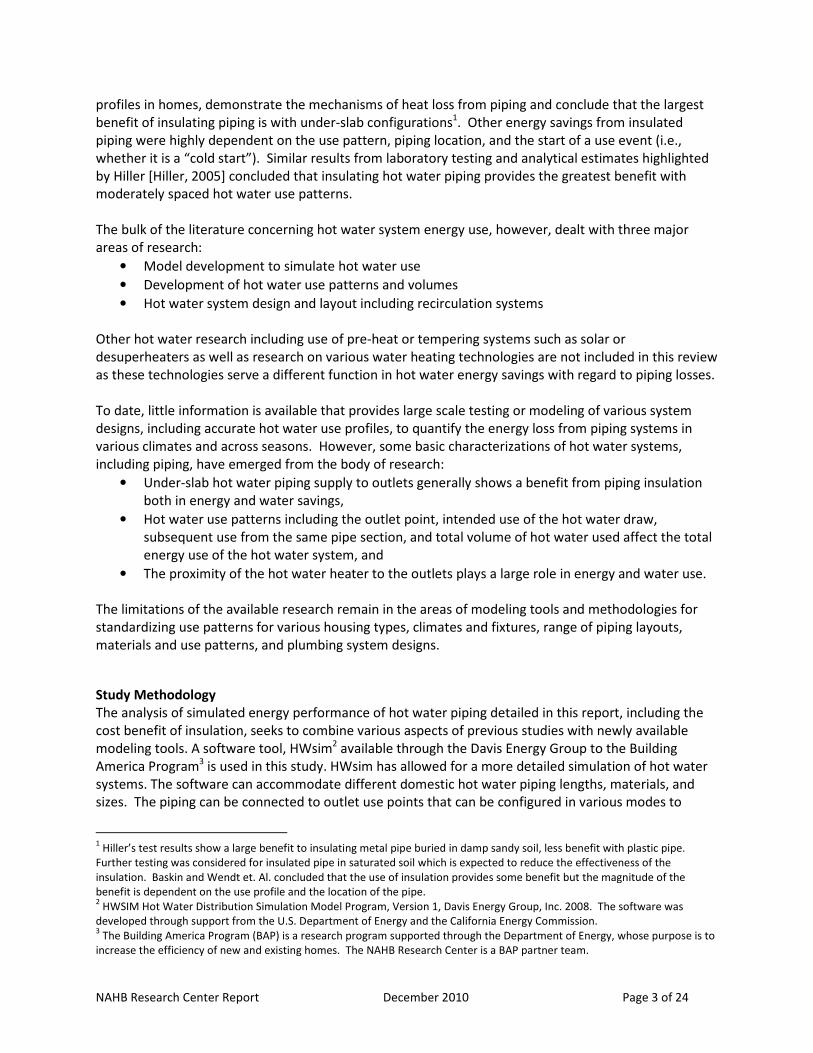
Table 1 - Factors Affecting Hot Water System Energy Use
Property Energy Use Mechanism Loss Consequence
Pipe material, length
and location
Heat transfer through the pipe to the
surrounding based on conductivity
and the environmental temperature
around the pipe
• Energy loss during flow
• Energy loss at the end of the flow event
(cool down)
• Water loss waiting for hot water at the
outlet
Intention of use Volume of hot water in the piping
based on a desired temperature (i.e.
shower) or fixed volume (i.e.
dishwasher)
• Water waste waiting for hot water at the
outlet
• Increase in water heating energy based
on the need for hotter water at the
outlet
Flow rate Heat transfer through the pipe to the
surrounding during use
Magnitude of loss relative to total volume of
use increases with a decrease in flow rates
Interval between use Heat loss during pipe cool down after
a use event
Energy and water loss dependent on the time
to the subsequent use
Cold water
temperature at the
outlet
Volume of hot water used dependent
on the desired temperature at the
outlet, if set
Larger volume of hot water is used with
colder incoming water temperature
As outlined, the confluence of parameters involved in the determination of hot water system losses
increases the complexity of determining the affect of any one aspect leading to higher energy losses
relative to the total energy use in the hot water system. This affect is clearly seen in the energy factor
(EF) rating for water heaters which is highly dependent on the time frame and use pattern of the test
procedure. For any actual home, the EF may be significantly different from the equipment rating, for
example, in homes where there is large hot water use throughout the day, the actual EF may be much
higher, where the opposite would be true for homes that use much less hot water than the test
procedure.
Furthermore, the losses from the hot water system are all relative to the total energy supplied to the
hot water system such that homes with low hot water use due to consumer behavior (including the
choice of low-flow faucets) may reduce the total energy used in the hot water system, the ultimate
benefit desired. However, in all homes, the performance of the hot water system may be improved (e.g.
faster hot water delivery, lower piping losses, etc.) through the system design.
This study focuses on one aspect of the system design – insulating hot water piping as a means to
reduce energy (and corresponding water) losses. It must be noted that this study did not evaluate
recirculation systems which presents a different set of analysis complexities including the type of
recirculation system, the actual layout of the system, the pumping energy, and the control mechanisms
based on occupant behavior at a particular use point.
Published Hot Water Energy Use Research
A literature search was performed to review the current information available relating to hot water
energy use in homes and specifically concerning the application of insulation for the piping. The
relevant literature is annotated in Appendix A. Few studies specifically focused on pipe losses from
domestic hot water systems. The most significant studies were published in 2004 [Baskin et. El. 2004]
through 2006 [Hiller] that used analytical and some laboratory test methods to demonstrate the scope
of losses from domestic hot water piping. These studies, while not applied to realistic hot water use
NAHB Research Center Report December 2010 Page 3 of 24
profiles in homes, demonstrate the mechanisms of heat loss from piping and conclude that the largest
benefit of insulating piping is with under-slab configurations1. Other energy savings from insulated
piping were highly dependent on the use pattern, piping location, and the start of a use event (i.e.,
whether it is a “cold start”). Similar results from laboratory testing and analytical estimates highlighted
by Hiller [Hiller, 2005] concluded that insulating hot water piping provides the greatest benefit with
moderately spaced hot water use patterns.
The bulk of the literature concerning hot water system energy use, however, dealt with three major
areas of research:
• Model development to simulate hot water use
• Development of hot water use patterns and volumes
• Hot water system design and layout including recirculation systems
Other hot water research including use of pre-heat or tempering systems such as solar or
desuperheaters as well as research on various water heating technologies are not included in this review
as these technologies serve a different function in hot water energy savings with regard to piping losses.
To date, little information is available that provides large scale testing or modeling of various system
designs, including accurate hot water use profiles, to quantify the energy loss from piping systems in
various climates and across seasons. However, some basic characterizations of hot water systems,
including piping, have emerged from the body of research:
• Under-slab hot water piping supply to outlets generally shows a benefit from piping insulation
both in energy and water savings,
• Hot water use patterns including the outlet point, intended use of the hot water draw,
subsequent use from the same pipe section, and total volume of hot water used affect the total
energy use of the hot water system, and
• The proximity of the hot water heater to the outlets plays a large role in energy and water use.
The limitations of the available research remain in the areas of modeling tools and methodologies for
standardizing use patterns for various housing types, climates and fixtures, range of piping layouts,
materials and use patterns, and plumbing system designs.
Study Methodology
The analysis of simulated energy performance of hot water piping detailed in this report, including the
cost benefit of insulation, seeks to combine various aspects of previous studies with newly available
modeling tools. A software tool, HWsim2 available through the Davis Energy Group to the Building
America Program3 is used in this study. HWsim has allowed for a more detailed simulation of hot water
systems. The software can accommodate different domestic hot water piping lengths, materials, and
sizes. The piping can be connected to outlet use points that can be configured in various modes to
1 Hiller’s test results show a large benefit to insulating metal pipe buried in damp sandy soil, less benefit with plastic pipe.
Further testing was considered for insulated pipe in saturated soil which is expected to reduce the effectiveness of the
insulation. Baskin and Wendt et. Al. concluded that the use of insulation provides some benefit but the magnitude of the
benefit is dependent on the use profile and the location of the pipe. 2 HWSIM Hot Water Distribution Simulation Model Program, Version 1, Davis Energy Group, Inc. 2008. The software was
developed through support from the U.S. Department of Energy and the California Energy Commission. 3 The Building America Program (BAP) is a research program supported through the Department of Energy, whose purpose is to
increase the efficiency of new and existing homes. The NAHB Research Center is a BAP partner team.
NAHB Research Center Report December 2010 Page 4 of 24
simulate, for example, a shower that uses hot water at a limited temperature versus a laundry that uses
a set volume of hot water at any temperature. A significant feature of the software is the use of a “draw
editor” in which flow rates and total volume can be assigned to a specific use point. The environmental
temperature surrounding the pipe can also be defined for each month (or even hourly, if desired) and
the cold water inlet temperature can be defined on a monthly basis.
A broad characterization study of the affect of installing pipe insulation on all domestic hot water pipes
is performed through various approaches using the capabilities of the software coupled with use
patterns defined specifically for homes. The approaches detailed in this report include:
Analysis 1: Characterization of individual energy use and loss mechanisms of the piping system as
outlined in Table 1 above,
Analysis 2: Parametric study highlighting the interactions of various piping system loss mechanisms,
Analysis 3: Whole house hot water system analysis based on a standard hot water system design,
environmental conditions and use pattern, and
Analysis 4: Cost-Benefit analysis.
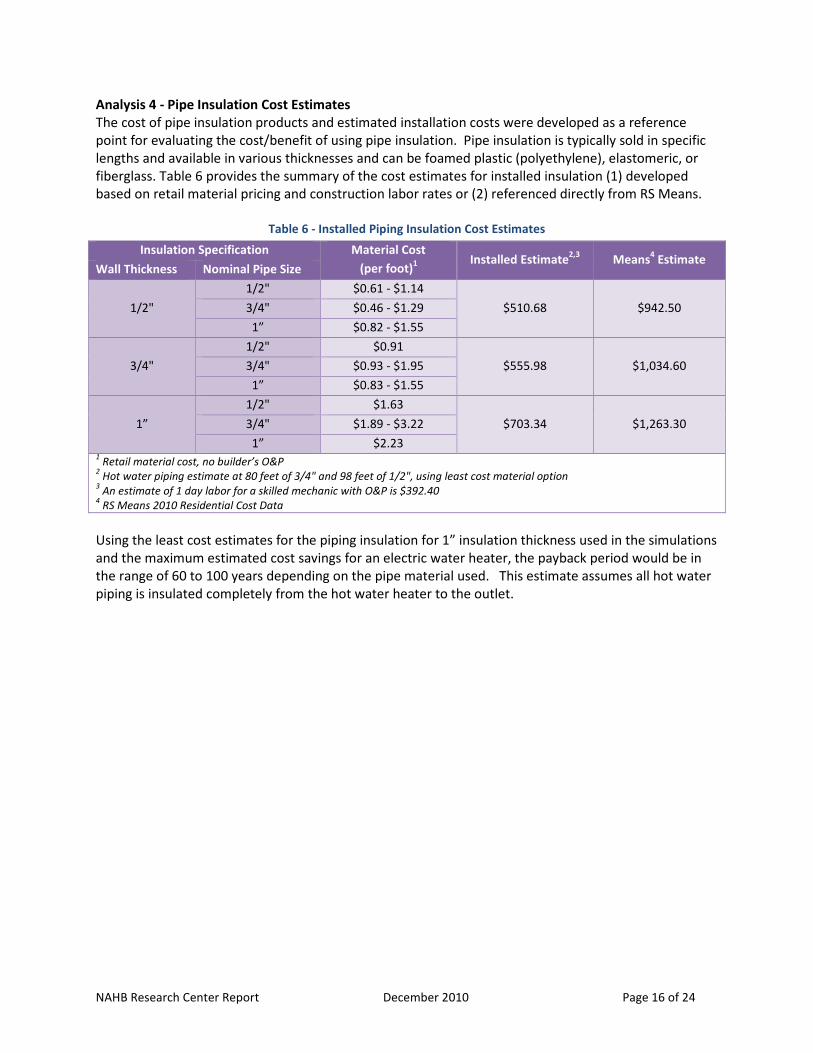
The cost-benefit analysis (Item 4) is performed based on estimated installed cost of pipe insulation and
current average utility rates for natural gas and electricity, to estimate the net energy cost savings from
insulating the hot water piping. This analysis provides a cost and benefit comparison based on the
simulation results.
This study is designed to analyze the current system designs and does not attempt to develop optimized
piping layouts to specifically reduce the volume of hot water in the piping.
Analysis 1 - Characterization of the Domestic Hot Water Distribution System
The complexity of factors involved in the hot water distribution system design and use range from the
layout of the system and number of outlets, which can be unique in even similar house models, to the
daily variation in occupant use of the system. The use of hot water outlets, whether a sink faucet or
washing machine, can change on a daily, weekly, and even seasonal basis throughout the year. These
factors coupled with changing conditions of the house and cold water temperatures as well as the
interval between hot water uses will change the system losses, including losses from the piping system.
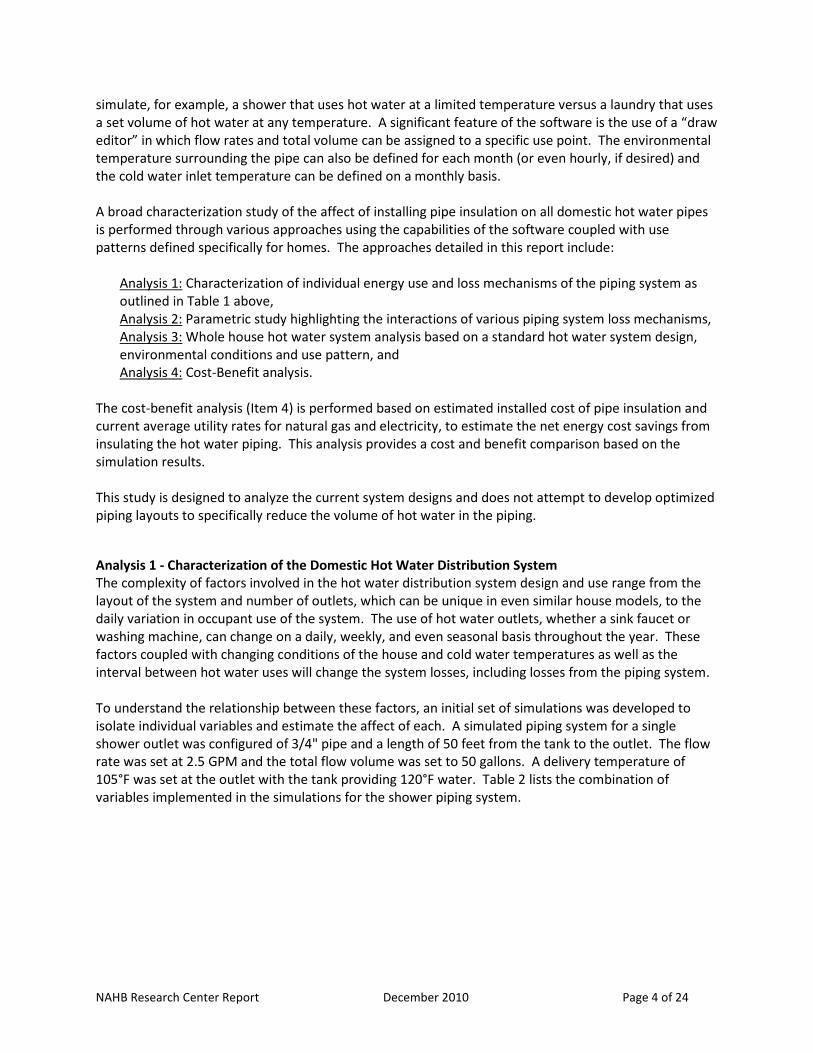
To understand the relationship between these factors, an initial set of simulations was developed to
isolate individual variables and estimate the affect of each. A simulated piping system for a single
shower outlet was configured of 3/4" pipe and a length of 50 feet from the tank to the outlet. The flow
rate was set at 2.5 GPM and the total flow volume was set to 50 gallons. A delivery temperature of
105°F was set at the outlet with the tank providing 120°F water. Table 2 lists the combination of
variables implemented in the simulations for the shower piping system.
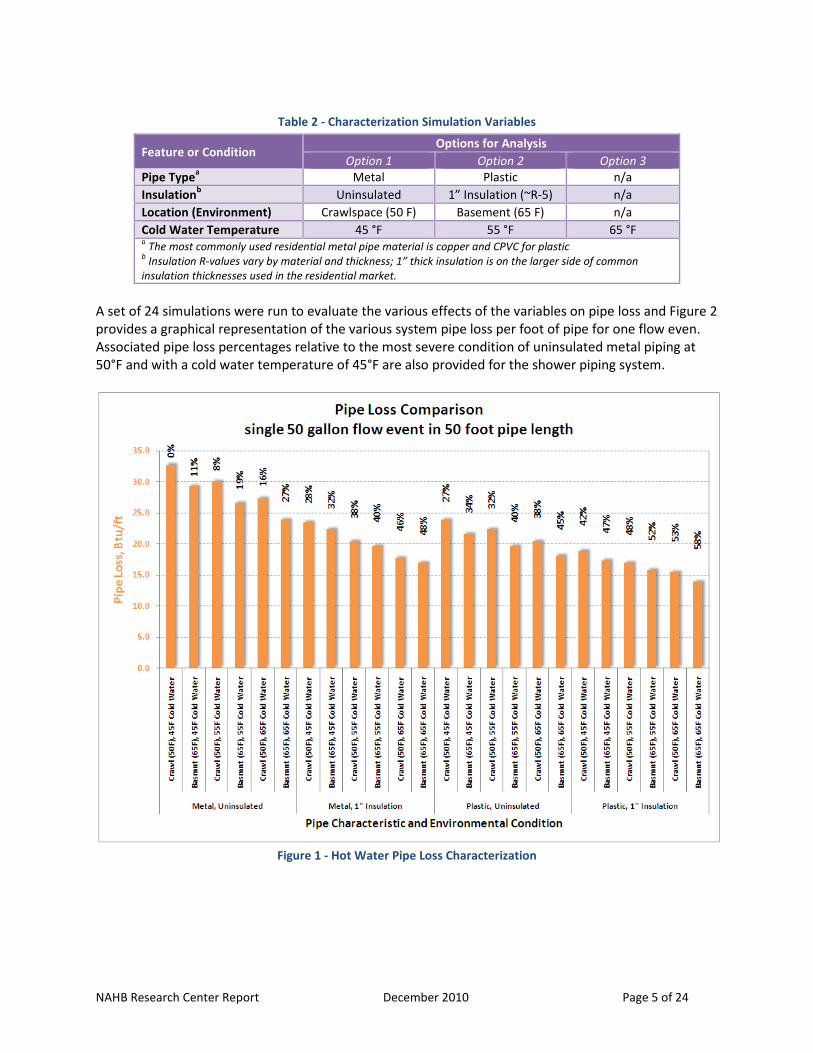
NAHB Research Center Report December 2010 Page 5 of 24
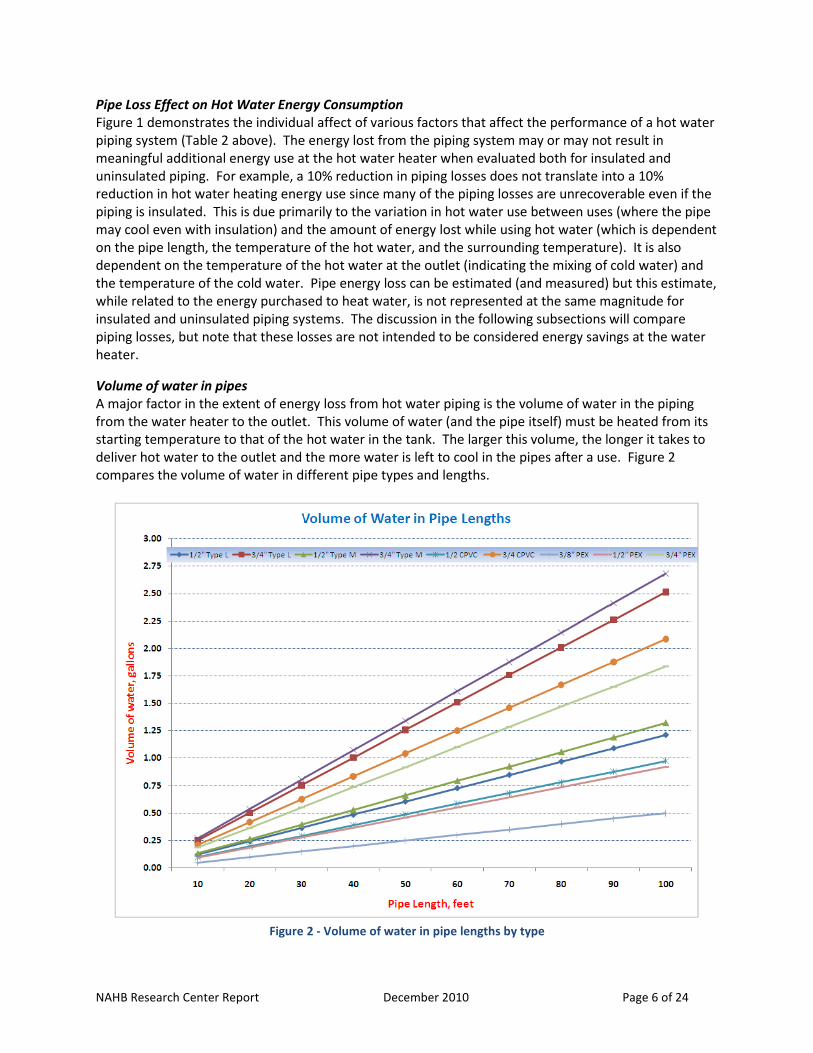
The size of the pipe is a secondary factor as is the flow rate and duration of the use (which are
dependent on the occupant use). The parametric study is focused primarily on the length of pipe and
the time between hot water events. The other factors are set (e.g., the piping system design and layout)
and a flow regime is specified for each outlet. The flow rate and total volume is set for the outlet
providing a range of draws, albeit limited, to represent what might be expected in a typical household.
The artificial specification of the time between draws does not represent a typical household but does
highlight the differences between the different draw profiles.
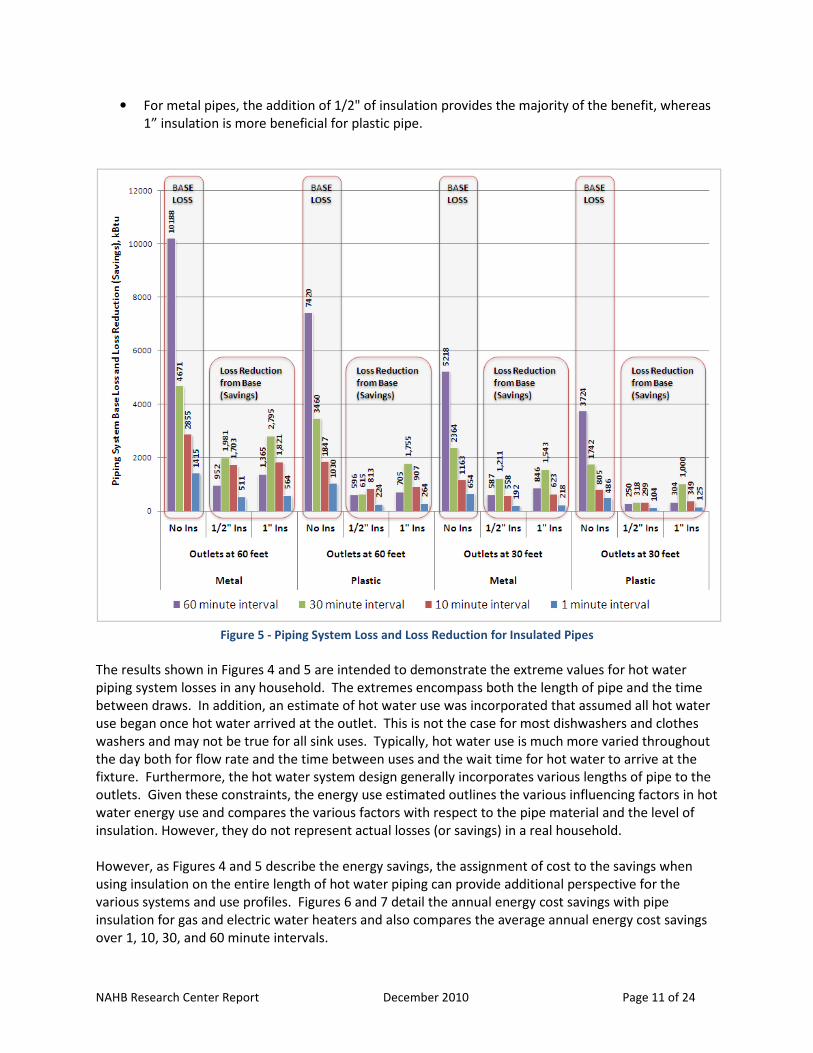
Figures 4 and 5 graphically represent the interaction between pipe material (metal or plastic), pipe
length to the outlets (30 or 60 feet), the interval between draws (1, 10, 30, or 60 minutes), and the
amount of insulation on the pipe (none, ½”, or 1”). Insulation is assumed to fully cover all hot water
pipes in the system from the hot water tank to the outlets. The results are based on an annual
simulation with the same daily draw profile and volume use for each day of the year.
NAHB Research Center Report December 2010 Page 10 of 24
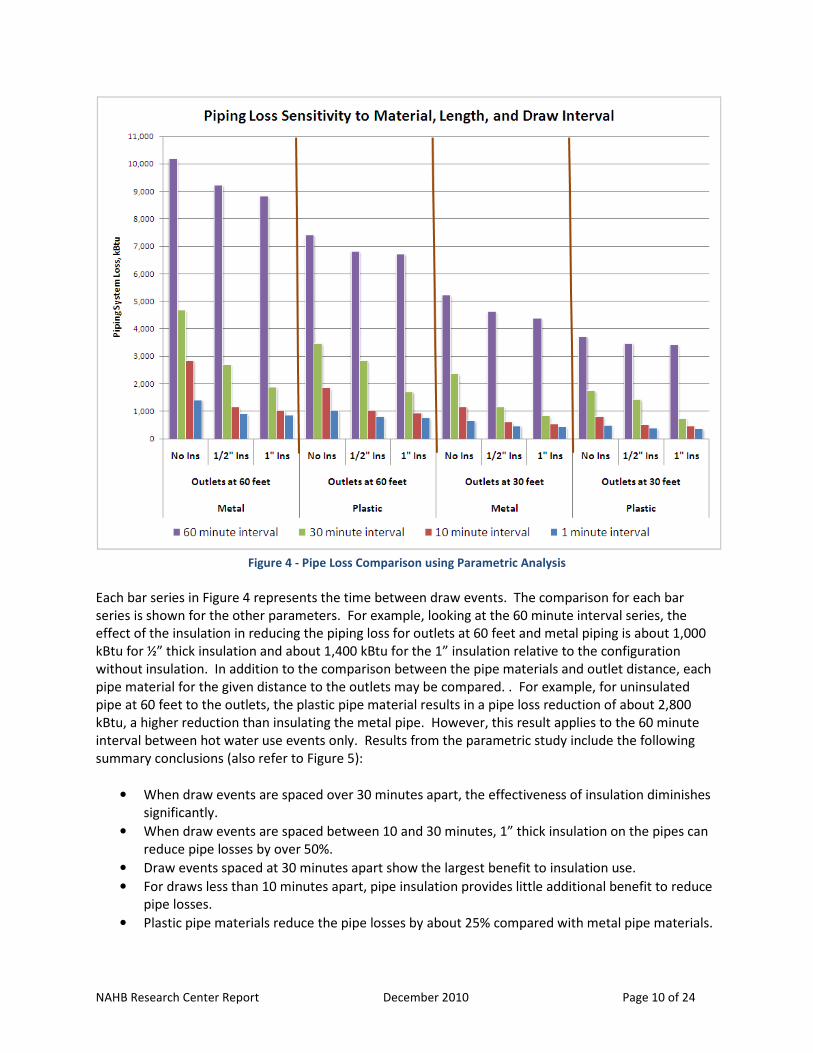
Figure 4 - Pipe Loss Comparison using Parametric Analysis
Each bar series in Figure 4 represents the time between draw events. The comparison for each bar
series is shown for the other parameters. For example, looking at the 60 minute interval series, the
effect of the insulation in reducing the piping loss for outlets at 60 feet and metal piping is about 1,000
kBtu for ½” thick insulation and about 1,400 kBtu for the 1” insulation relative to the configuration
without insulation. In addition to the comparison between the pipe materials and outlet distance, each
pipe material for the given distance to the outlets may be compared. . For example, for uninsulated
pipe at 60 feet to the outlets, the plastic pipe material results in a pipe loss reduction of about 2,800
kBtu, a higher reduction than insulating the metal pipe. However, this result applies to the 60 minute
interval between hot water use events only. Results from the parametric study include the following
summary conclusions (also refer to Figure 5):
• When draw events are spaced over 30 minutes apart, the effectiveness of insulation diminishes
significantly.
• When draw events are spaced between 10 and 30 minutes, 1” thick insulation on the pipes can
reduce pipe losses by over 50%.
• Draw events spaced at 30 minutes apart show the largest benefit to insulation use.
• For draws less than 10 minutes apart, pipe insulation provides little additional benefit to reduce
pipe losses.
• Plastic pipe materials reduce the pipe losses by about 25% compared with metal pipe materials.
NAHB Research Center Report December 2010 Page 11 of 24
• For metal pipes, the addition of 1/2" of insulation provides the majority of the benefit, whereas
1” insulation is more beneficial for plastic pipe.
Figure 5 - Piping System Loss and Loss Reduction for Insulated Pipes
The results shown in Figures 4 and 5 are intended to demonstrate the extreme values for hot water
piping system losses in any household. The extremes encompass both the length of pipe and the time
between draws. In addition, an estimate of hot water use was incorporated that assumed all hot water
use began once hot water arrived at the outlet. This is not the case for most dishwashers and clothes
washers and may not be true for all sink uses. Typically, hot water use is much more varied throughout
the day both for flow rate and the time between uses and the wait time for hot water to arrive at the
fixture. Furthermore, the hot water system design generally incorporates various lengths of pipe to the
outlets. Given these constraints, the energy use estimated outlines the various influencing factors in hot
water energy use and compares the various factors with respect to the pipe material and the level of
insulation. However, they do not represent actual losses (or savings) in a real household.
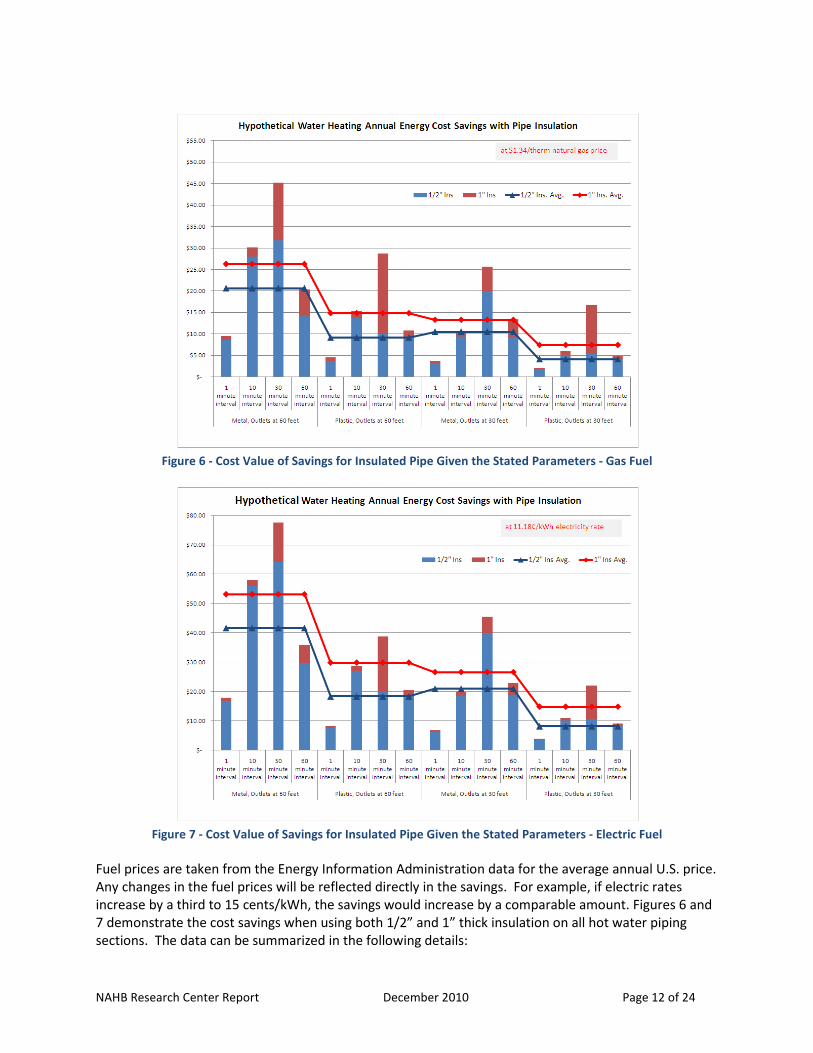
However, as Figures 4 and 5 describe the energy savings, the assignment of cost to the savings when
using insulation on the entire length of hot water piping can provide additional perspective for the
various systems and use profiles. Figures 6 and 7 detail the annual energy cost savings with pipe
insulation for gas and electric water heaters and also compares the average annual energy cost savings
over 1, 10, 30, and 60 minute intervals.
NAHB Research Center Report December 2010 Page 12 of 24
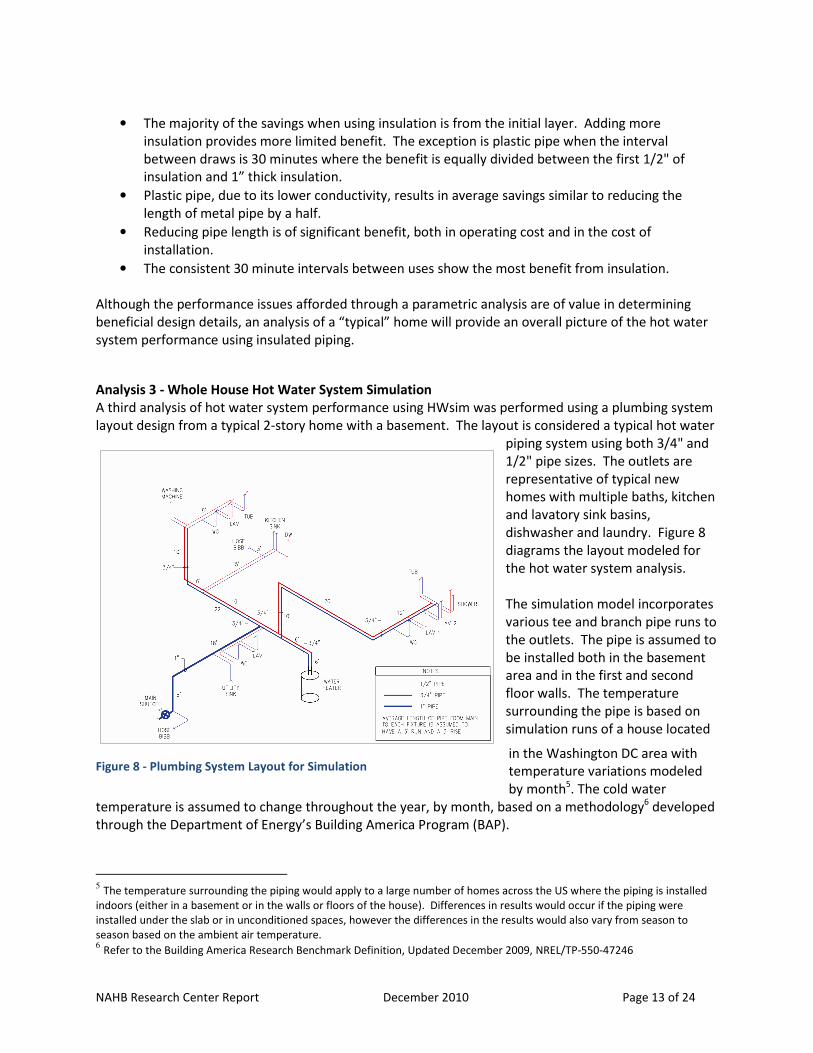
Figure 6 - Cost Value of Savings for Insulated Pipe Given the Stated Parameters - Gas Fuel
Figure 7 - Cost Value of Savings for Insulated Pipe Given the Stated Parameters - Electric Fuel
Fuel prices are taken from the Energy Information Administration data for the average annual U.S. price.
Any changes in the fuel prices will be reflected directly in the savings. For example, if electric rates
increase by a third to 15 cents/kWh, the savings would increase by a comparable amount. Figures 6 and
7 demonstrate the cost savings when using both 1/2” and 1” thick insulation on all hot water piping
sections. The data can be summarized in the following details:
NAHB Research Center Report December 2010 Page 13 of 24
• The majority of the savings when using insulation is from the initial layer. Adding more
insulation provides more limited benefit. The exception is plastic pipe when the interval
between draws is 30 minutes where the benefit is equally divided between the first 1/2" of
insulation and 1” thick insulation.
• Plastic pipe, due to its lower conductivity, results in average savings similar to reducing the
length of metal pipe by a half.
• Reducing pipe length is of significant benefit, both in operating cost and in the cost of
installation.
• The consistent 30 minute intervals between uses show the most benefit from insulation.
Although the performance issues afforded through a parametric analysis are of value in determining
beneficial design details, an analysis of a “typical” home will provide an overall picture of the hot water
system performance using insulated piping.
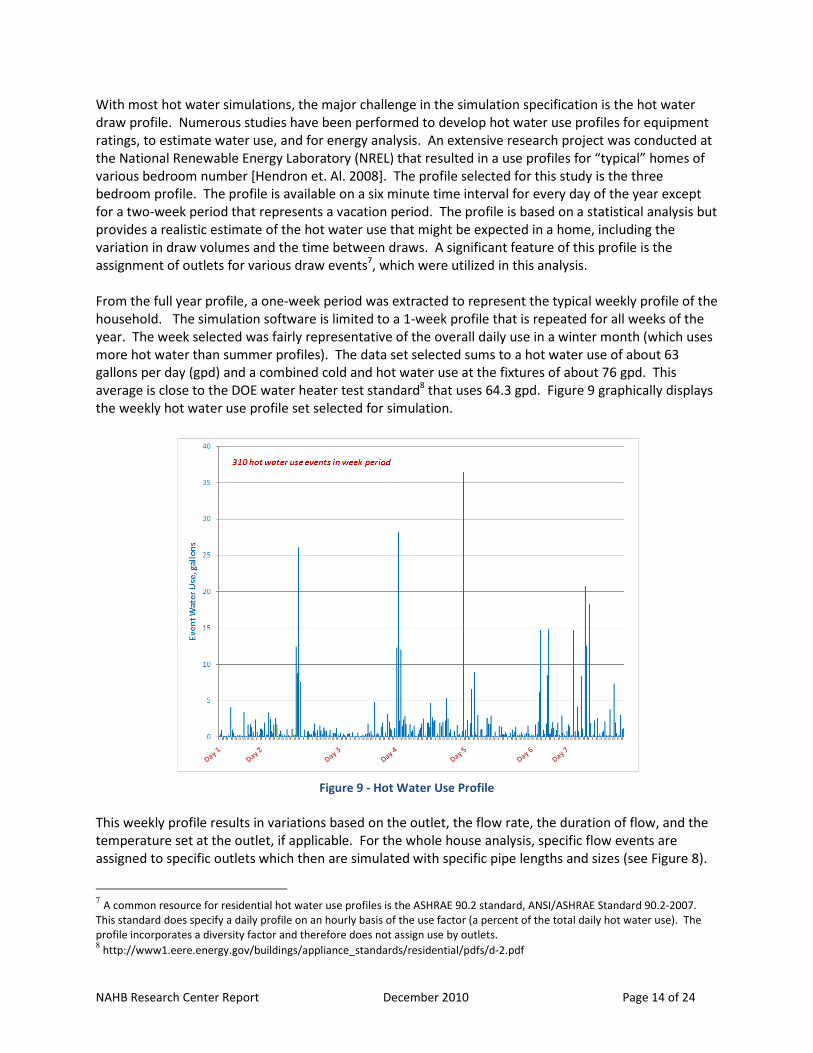
Analysis 3 - Whole House Hot Water System Simulation
A third analysis of hot water system performance using HWsim was performed using a plumbing system
layout design from a typical 2-story home with a basement. The layout is considered a typical hot water
piping system using both 3/4" and
1/2" pipe sizes. The outlets are
representative of typical new
homes with multiple baths, kitchen
and lavatory sink basins,
dishwasher and laundry. Figure 8
diagrams the layout modeled for
the hot water system analysis.
The simulation model incorporates
various tee and branch pipe runs to
the outlets. The pipe is assumed to
be installed both in the basement
area and in the first and second
floor walls. The temperature
surrounding the pipe is based on
simulation runs of a house located
in the Washington DC area with
temperature variations modeled
by month5. The cold water
temperature is assumed to change throughout the year, by month, based on a methodology6 developed
through the Department of Energy’s Building America Program (BAP).
5 The temperature surrounding the piping would apply to a large number of homes across the US where the piping is installed
indoors (either in a basement or in the walls or floors of the house). Differences in results would occur if the piping were
installed under the slab or in unconditioned spaces, however the differences in the results would also vary from season to
season based on the ambient air temperature. 6 Refer to the Building America Research Benchmark Definition, Updated December 2009, NREL/TP-550-47246
Figure 8 - Plumbing System Layout for Simulation
NAHB Research Center Report December 2010 Page 14 of 24
With most hot water simulations, the major challenge in the simulation specification is the hot water
draw profile. Numerous studies have been performed to develop hot water use profiles for equipment
ratings, to estimate water use, and for energy analysis. An extensive research project was conducted at
the National Renewable Energy Laboratory (NREL) that resulted in a use profiles for “typical” homes of
various bedroom number [Hendron et. Al. 2008]. The profile selected for this study is the three
bedroom profile. The profile is available on a six minute time interval for every day of the year except
for a two-week period that represents a vacation period. The profile is based on a statistical analysis but
provides a realistic estimate of the hot water use that might be expected in a home, including the
variation in draw volumes and the time between draws. A significant feature of this profile is the
assignment of outlets for various draw events7, which were utilized in this analysis.
From the full year profile, a one-week period was extracted to represent the typical weekly profile of the
household. The simulation software is limited to a 1-week profile that is repeated for all weeks of the
year. The week selected was fairly representative of the overall daily use in a winter month (which uses
more hot water than summer profiles). The data set selected sums to a hot water use of about 63
gallons per day (gpd) and a combined cold and hot water use at the fixtures of about 76 gpd. This
average is close to the DOE water heater test standard8 that uses 64.3 gpd. Figure 9 graphically displays
the weekly hot water use profile set selected for simulation.
Figure 9 - Hot Water Use Profile
This weekly profile results in variations based on the outlet, the flow rate, the duration of flow, and the
temperature set at the outlet, if applicable. For the whole house analysis, specific flow events are
assigned to specific outlets which then are simulated with specific pipe lengths and sizes (see Figure 8).
7 A common resource for residential hot water use profiles is the ASHRAE 90.2 standard, ANSI/ASHRAE Standard 90.2-2007.
This standard does specify a daily profile on an hourly basis of the use factor (a percent of the total daily hot water use). The
profile incorporates a diversity factor and therefore does not assign use by outlets. 8 http://www1.eere.energy.gov/buildings/appliance_standards/residential/pdfs/d-2.pdf
NAHB Research Center Report December 2010 Page 15 of 24
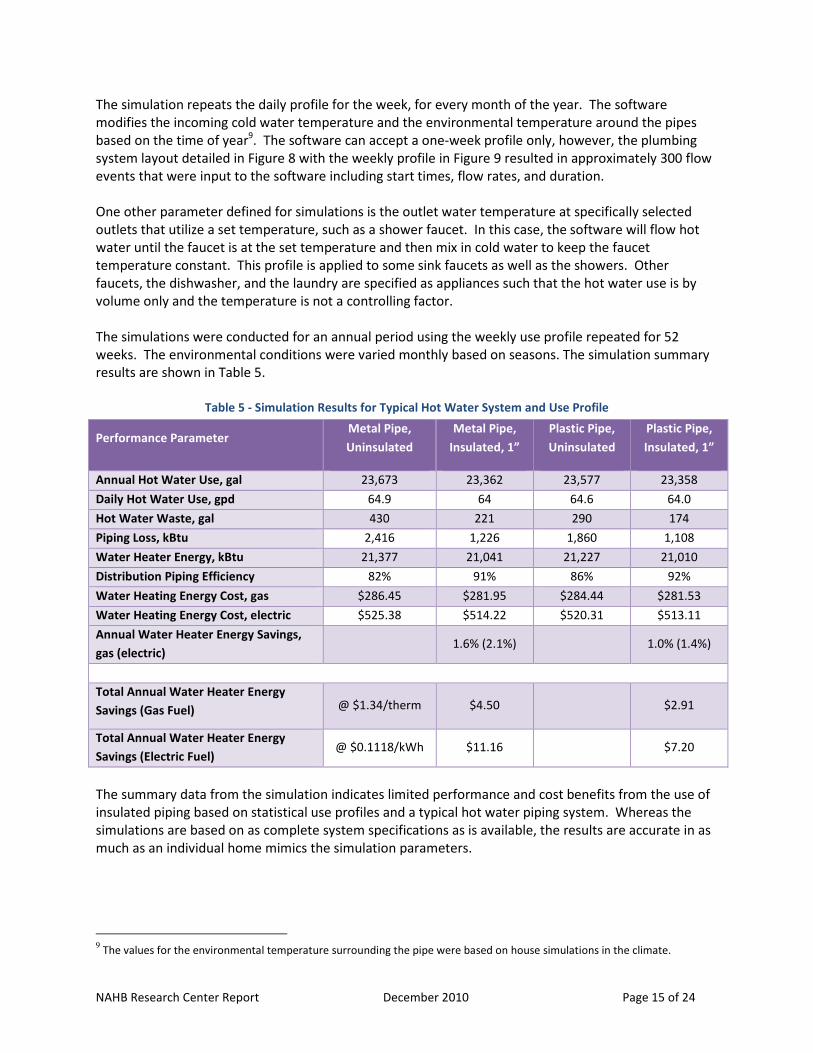
The simulation repeats the daily profile for the week, for every month of the year. The software
modifies the incoming cold water temperature and the environmental temperature around the pipes
based on the time of year9. The software can accept a one-week profile only, however, the plumbing
system layout detailed in Figure 8 with the weekly profile in Figure 9 resulted in approximately 300 flow
events that were input to the software including start times, flow rates, and duration.
One other parameter defined for simulations is the outlet water temperature at specifically selected
outlets that utilize a set temperature, such as a shower faucet. In this case, the software will flow hot
water until the faucet is at the set temperature and then mix in cold water to keep the faucet
temperature constant. This profile is applied to some sink faucets as well as the showers. Other
faucets, the dishwasher, and the laundry are specified as appliances such that the hot water use is by
volume only and the temperature is not a controlling factor.
The simulations were conducted for an annual period using the weekly use profile repeated for 52
weeks. The environmental conditions were varied monthly based on seasons. The simulation summary
results are shown in Table 5.
Table 5 - Simulation Results for Typical Hot Water System and Use Profile
Performance Parameter Metal Pipe,
Uninsulated
Metal Pipe,
Insulated, 1”
Plastic Pipe,
Uninsulated
Plastic Pipe,
Insulated, 1”
Annual Hot Water Use, gal 23,673 23,362 23,577 23,358
Daily Hot Water Use, gpd 64.9 64 64.6 64.0
Hot Water Waste, gal 430 221 290 174
Piping Loss, kBtu 2,416 1,226 1,860 1,108
Water Heater Energy, kBtu 21,377 21,041 21,227 21,010
Distribution Piping Efficiency 82% 91% 86% 92%
Water Heating Energy Cost, gas $286.45 $281.95 $284.44 $281.53
Water Heating Energy Cost, electric $525.38 $514.22 $520.31 $513.11