Statistical release P0352.1 Domestic Tourism Survey 2012 Reference period: January to December 2011 Embargoed until: 30 January 2013 09:00 Enquiries: Forthcoming issue: Expected release date User Information Services DTS 2013 March 2014 Tel.: (012) 310 8600 / 4892 / 8390
Transcript
Statistical release P0352.1
Domestic Tourism Survey 2012
Reference period: January to December 2011
Embargoed until:30 January 2013
09:00 Enquiries: Forthcoming issue: Expected release date
User Information Services DTS 2013 March 2014 Tel.: (012) 310 8600 / 4892 / 8390
Contents 1. Introduction and methodology ........................................................................................................................ 1 1.1 Background ......................................................................................................................................................... 1 1.2 Target population ................................................................................................................................................ 1 2. Summary of key findings of the Domestic Tourism Survey 2010-2011 ...................................................... 2 3. Characteristics of the most recent domestic day and overnight trips undertaken ................................... 3 3.1 Number and type of trips ..................................................................................................................................... 4 3.1.1 Number of day and overnight trips inside South Africa ....................................................................................... 4 3.1.2 Number of persons who undertook overnight trips ............................................................................................. 5 3.2 Trip purpose ........................................................................................................................................................ 7 3.3 Mode of transport ................................................................................................................................................ 9 3.4 Main purpose of trip and mode of transport ...................................................................................................... 11 3.5 Activities undertaken during trips ...................................................................................................................... 14 3.5.1 Day trips ............................................................................................................................................................ 14 3.5.2 Overnight trips ................................................................................................................................................... 16 3.6 Demographic characteristics of day travellers and tourists .............................................................................. 18 3.7 Main destination and main purpose of trip for domestic overnight trips ........................................................... 23 3.8 Main destination and mode of transport for domestic overnight trips ............................................................... 24 3.9 Main destination and length of stay for domestic overnight trips ...................................................................... 25 3.10 Main destination and type of accommodation for domestic overnight trips ...................................................... 26 3.11 Main purpose of trip and length of stay ............................................................................................................. 28 3.12 Main purpose of trip and accommodation ......................................................................................................... 28 3.13 Booking patterns ............................................................................................................................................... 30 3.14 Expenditure by main destination and type of spending .................................................................................... 32 4. Barriers to taking trips ................................................................................................................................... 36 5. Living Standards Measure (LSM) .................................................................................................................. 39 6. Summary .......................................................................................................................................................... 42 7. Technical notes ............................................................................................................................................... 43 7.1 Response details ............................................................................................................................................... 43 7.2 Sample design .................................................................................................................................................. 43 7.3 Allocating sample sizes to strata ....................................................................................................................... 44 7.4 Weighting .......................................................................................................................................................... 46 7.5 Limitations to the study ..................................................................................................................................... 46 7.6 Non-response adjustment ................................................................................................................................. 46 7.7 Benchmarking ................................................................................................................................................... 46 7.8 Estimation ......................................................................................................................................................... 46 7.9 Editing and imputation ...................................................................................................................................... 46 7.10 Definitions of terms ........................................................................................................................................... 47
Statistics South Africa P0352.1
Domestic Tourism Survey, January to December 2011
iii
Tables
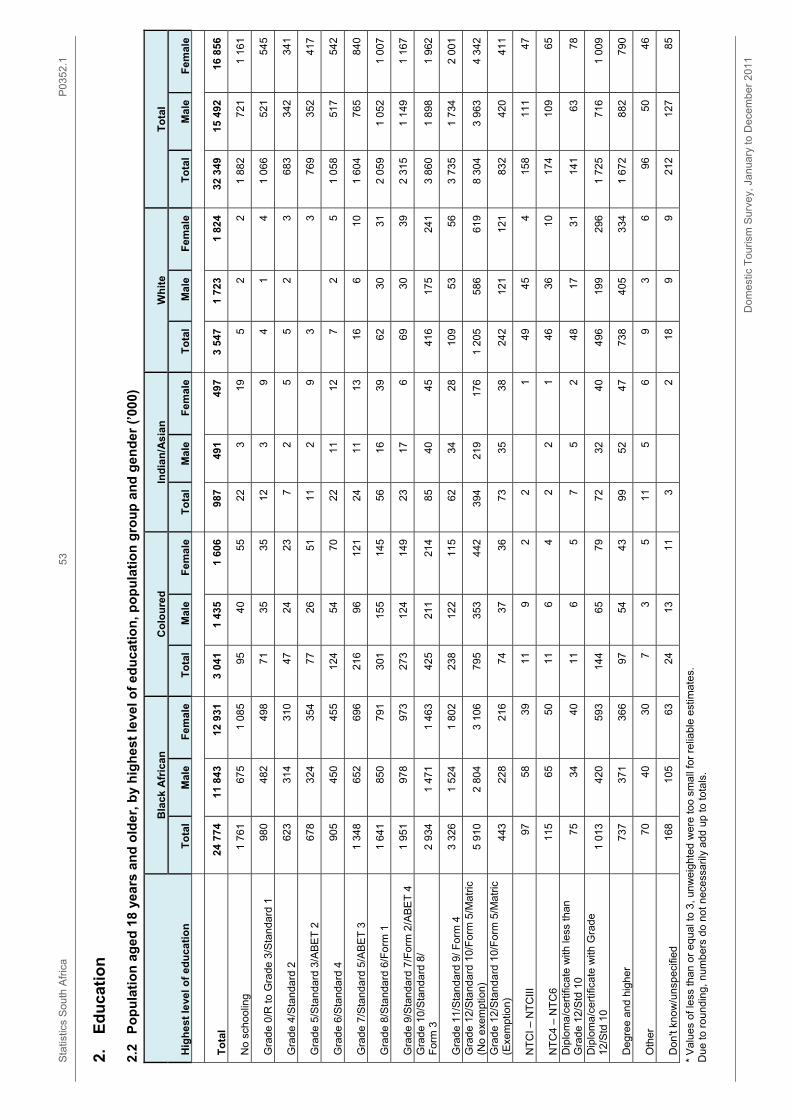
1. Population ........................................................................................................................................................ 50 1.1 By province, population group and gender (’000) ............................................................................................. 50 1.2 By age group, population group and gender (’000) .......................................................................................... 51 2. Education ......................................................................................................................................................... 52 2.1 Population aged 18 years and older, by highest level of education and province (’000) ................................. 52 2.2 Population aged 18 years and older, by highest level of education, population group and gender (’000) ....... 53 3. Day or overnight trips ..................................................................................................................................... 54 3.1 Number of most recent person trips taken in South Africa during the twelve-month reference period by
type of trip and province of origin (’000) ........................................................................................................... 54 3.2 Number of most recent person trips in South Africa during the twelve-month reference period by number
of day trips and province of origin (’000) .......................................................................................................... 55 3.3 Number of most recent person trips in South Africa during the twelve month reference period by number
of overnight trips and province of origin (’000) ................................................................................................. 56 3.4 Number of most recent person trips in South Africa during the twelve month reference period by
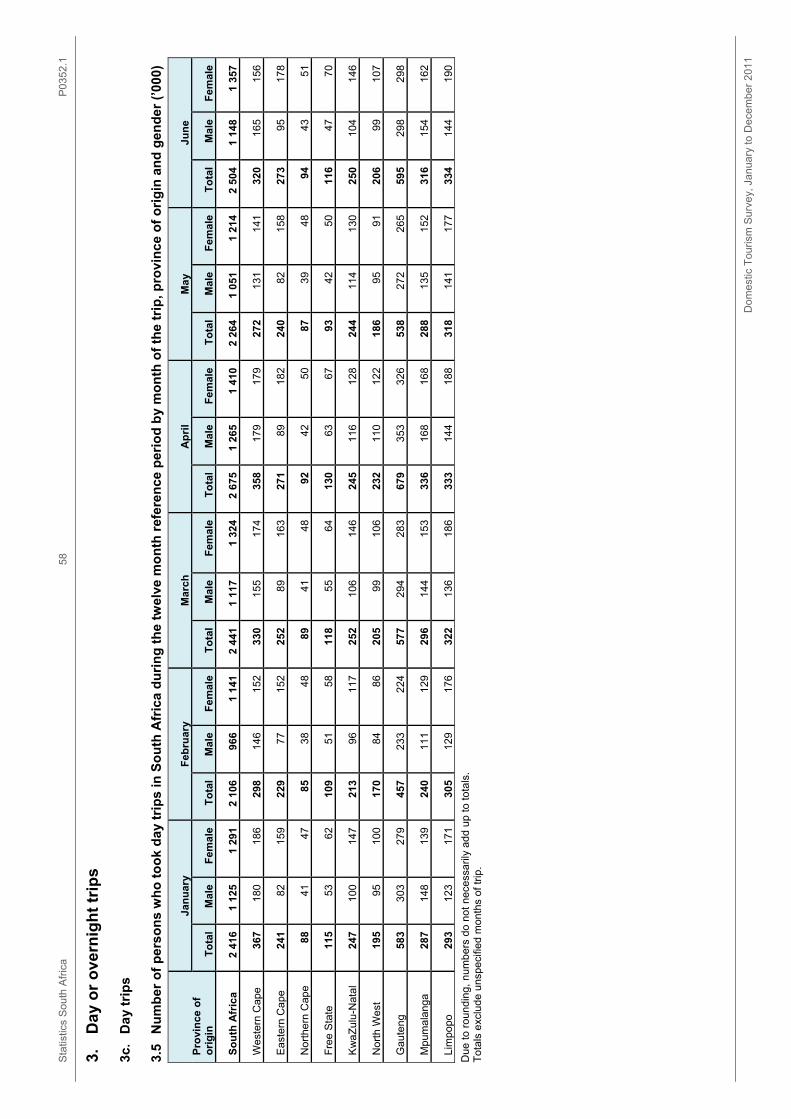
province of origin and sex (’000) ...................................................................................................................... 57 3.5 Number of persons who took day trips in South Africa during the twelve month reference period by
month of the trip, province of origin and gender (’000) .................................................................................... 58 3.6 Number of persons who took overnight trips in South Africa during the twelve-month reference period by
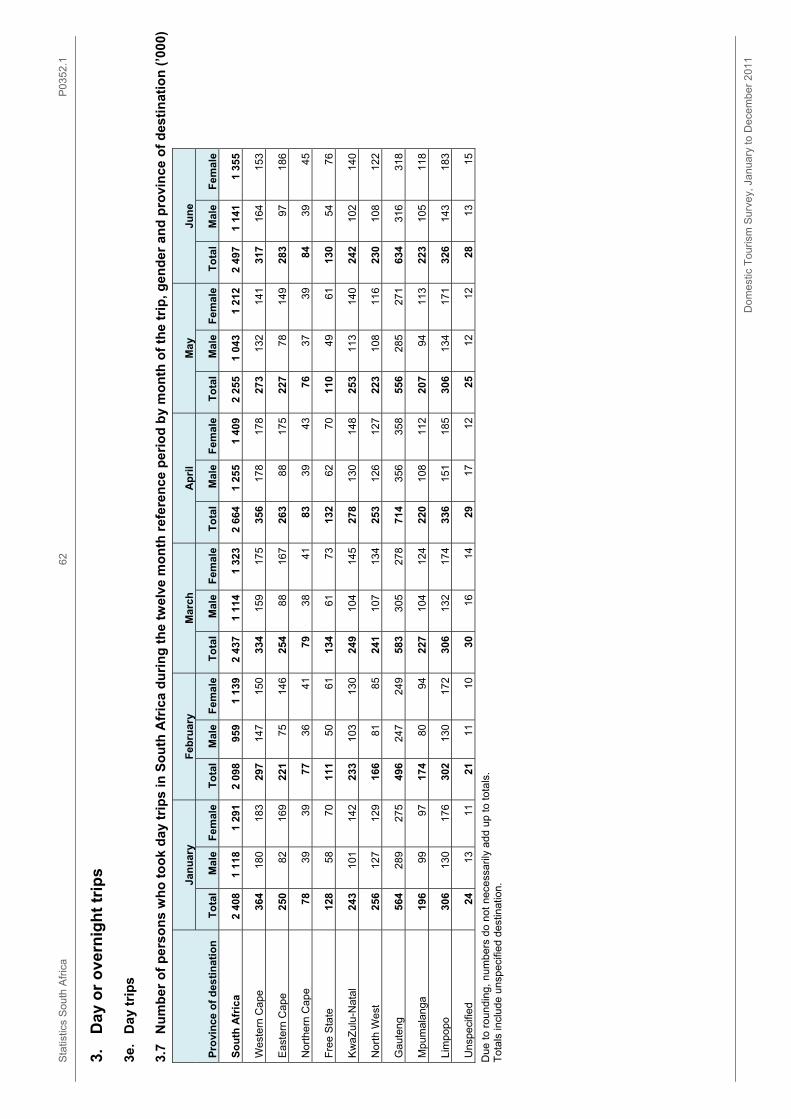
month of the trip, province of origin and gender (’000) .................................................................................... 60 3.7 Number of persons who took day trips in South Africa during the twelve month reference period by
month of the trip, gender and province of destination (’000) ............................................................................ 62 3.8 Number of persons who took overnight trips in South Africa during the twelve month reference period by
month of the trip, gender and province of destination (’000) ............................................................................ 64 3.9 Number of persons who took day trips in South Africa during the twelve-month reference period by
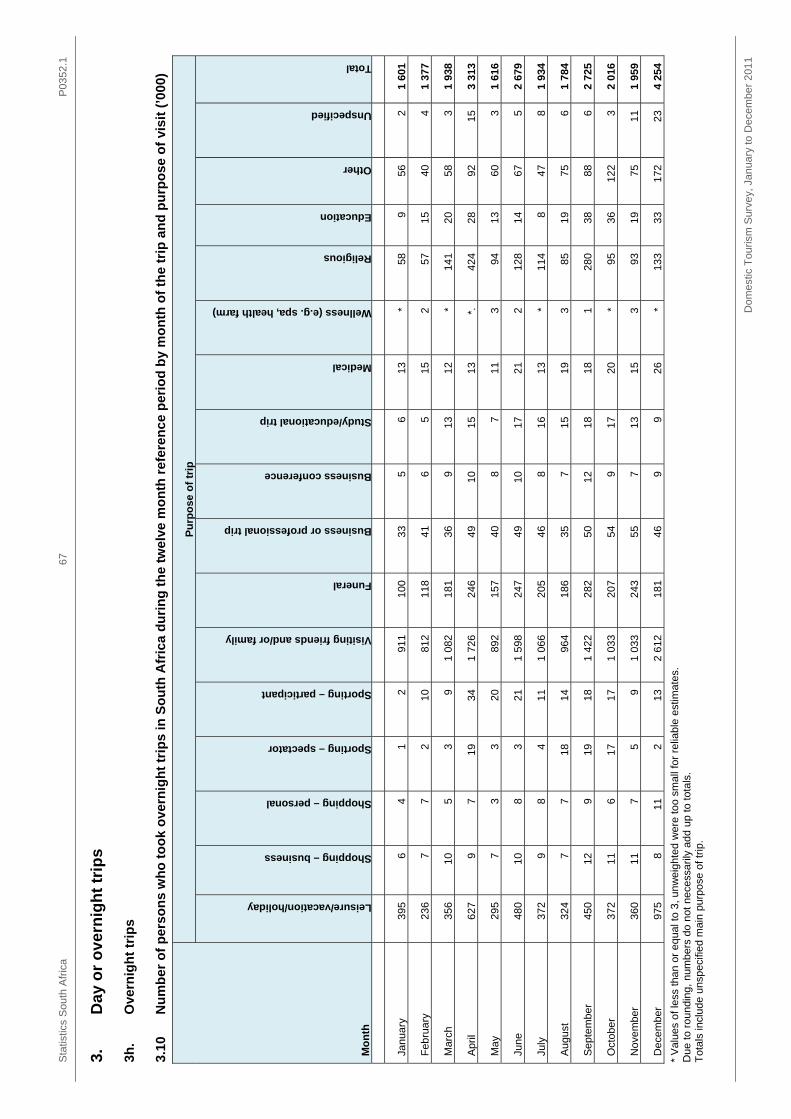
month of the trip and purpose of trip (’000) ...................................................................................................... 66 3.10 Number of persons who took overnight trips in South Africa during the twelve month reference period by
month of the trip and purpose of visit (’000) ..................................................................................................... 67 4. Origin and main destination of trips ............................................................................................................. 68 4.1 Number of most recent person day trips in South Africa during the twelve month reference period by
province of destination and origin (’000) .......................................................................................................... 68 4.2 Number of most recent person overnight trips in South Africa during the twelve month reference period
by province of destination and origin (’000) ...................................................................................................... 69 5. Main purpose of trip and destination ............................................................................................................ 70 5.1 Number of most recent person day trips in South Africa during the twelve month reference period by
main purpose of trip and province of destination (’000) ................................................................................... 70 5.2 Number of most recent person overnight trips in South Africa during the twelve month reference period
by main purpose of trip and province of destination (’000) .............................................................................. 71 6. Mode of transport ............................................................................................................................................ 72 6.1 Number of most recent person day trips in South Africa during the twelve month reference period by
mode of transport and province of destination (’000) ....................................................................................... 72 6.2 Number of most recent person overnight trips in South Africa during the twelve month reference period
by mode of transport and province of destination (’000) .................................................................................. 73
Statistics South Africa P0352.1
Domestic Tourism Survey, January to December 2011
iv
List of tables in the key findings
Table 3a: Number of trips taken during the period January to December 2010–2011 (’000) ...................................... 4
Table 3b: Number of most recent person day and overnight trips, 2010–2011 (’000) ................................................. 4
Table 4: Length of stay for the most recent person overnight trip, 2010–2011 ............................................................ 5
Table 5a: Most recent person day trips by province of main destination, 2010–2011 ................................................. 5
Table 5b: Most recent person overnight trips by province of main destination, 2010–2011 ........................................ 6
Table 6a: Main purpose of trip by most recent person day trips, 2010–2011 .............................................................. 7
Table 6b: Main purpose of trip by most recent person overnight trips, 2010 – 2011 ................................................... 8
Table 7a: Main mode of transport used on most recent person day trips, 2010–2011 ................................................ 9
Table 7b: Main mode of transport used on most recent person overnight trips, 2010–2011 ..................................... 10
Table 8: Main purpose of trip by mode of transport used on most recent person day trips (per cent), 2010–2011 ............................................................................................................................................................................ 11
Table 9: Main purpose of trip by mode of transport for domestic overnight trips (per cent), 2010–2011 ................... 13
Table 10a: Activities, other than the main purpose of the trip, undertaken on domestic day trips (incidence of activities undertaken, more than one activity per trip is possible), 2010–2011 .......................................................... 15
Table 10b: Activities, other than the main purpose of the trip, undertaken on domestic overnight trips (incidence of activities undertaken, more than one activity per trip is possible), 2010–2011 .................................... 17
Table 11a: Demographic analysis by most recent person day trips, 2010–2011 ....................................................... 18
Table 11b: Demographic analysis of most recent person overnight trips, 2010–2011 .............................................. 19
Table 12: Broad age group distribution of people who took at least one domestic day trip and at least one overnight trip, 2011 ..................................................................................................................................................... 21
Table 13: Main destination by main purpose of trip for domestic overnight trips (per cent), 2011 ............................. 23
Table 14: Main destination by mode of transport for domestic overnight trips (per cent), 2010–2011 ...................... 24
Table 15: Main destination by length of stay for domestic overnight trips (per cent), 2011 ....................................... 25
Table 16a: Main destination by principal type of accommodation for domestic overnight trips (per cent), 2011 ....... 26
Table 16b: Principal type of accommodation by main destination for domestic overnight trips (per cent), 2011 ...... 27
Table 17: Main purpose of trip by length of stay for domestic overnight trips (per cent), 2011 ................................. 28
Table 18a: Main purpose of trip by principal type of accommodation for domestic overnight trips (per cent), 2011 ............................................................................................................................................................................ 29
Table 18b: Principal type of accommodation by main purpose of trip for domestic overnight trips (per cent), 2011 ............................................................................................................................................................................ 29
Table 19: Booking patterns by main purpose of trip for domestic overnight trips (per cent), 2011 ............................ 30
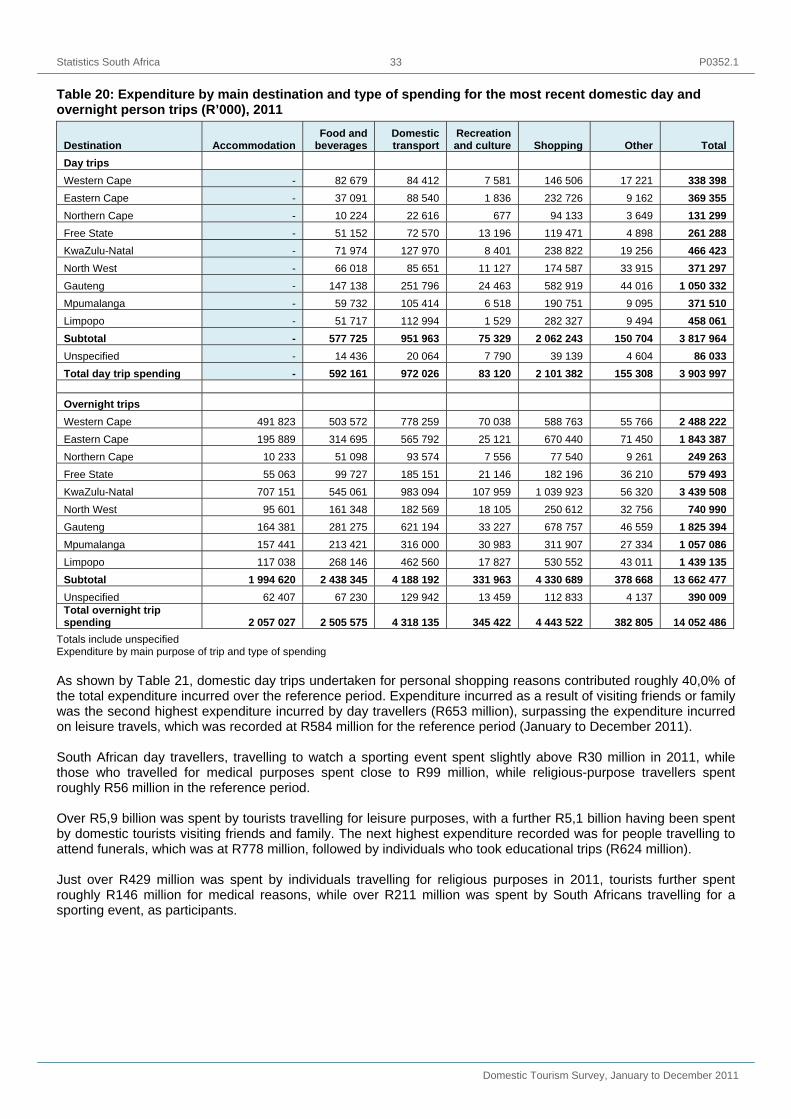
Table 20: Expenditure by main destination and type of spending for the most recent domestic day and overnight person trips (R’000), 2011 .......................................................................................................................... 33
Table 21: Expenditure by main purpose of trip and type of spending for the most recent domestic day and overnight person trips (R ’000), 2011 ......................................................................................................................... 34
Table 22: Expenditure by main purpose of trip and type of spending for the most recent domestic day and overnight person trips (R ’000) by population group of travellers, 2011 ..................................................................... 35
Table 23: Reasons for respondents not taking day trips in the past twelve months, 2010–2011 .............................. 36
Table 24: Reasons for respondents not taking overnight trips in the past twelve months, 2010–2011 ..................... 37
Table 25: Response rates by province, DTS 2012 ..................................................................................................... 43
Statistics South Africa P0352.1
Domestic Tourism Survey, January to December 2011
v
List of figures in the key findings
Figure 1a: Most recent person day trips by province of destination (per cent), 2010–2011 ........................................ 6
Figure 1b: Most recent person overnight trips by province of destination (per cent), 2010–2011 ............................... 7
Figure 2a: Main purpose of trip by most recent person day trips (per cent), 2010–2011 ............................................. 8
Figure 2b: Main purpose of trip by most recent person overnight trips (per cent), 2010–2011 ................................... 9
Figure 3a: Mode of transport used to undertake day trips (per cent), 2010–2011 ..................................................... 10
Figure 3b: Mode of transport used to undertake overnight trips (per cent), 2010–2011 ............................................ 11
Figure 4: Main purpose of trip by mode of transport for domestic day trips (per cent), 2011..................................... 12
Figure 5: Main purpose of trip by mode of transport on domestic overnight trips (per cent), 2011 ............................ 13
Figure 6a: Activities other than the main purpose of the trip undertaken on most recent person day trips (per cent), 2010–2011 ........................................................................................................................................................ 14
Figure 6b: Activities other than the main purpose of the trip undertaken on most recent person overnight trips (per cent), 2010–2011 ................................................................................................................................................ 16
Figure 7: Age distribution of persons by most recent person day and overnight trips (per cent), 2011 ..................... 20
Figure 8: Broad age group distribution of people who took domestic day trips and overnight trips (per cent), 2011 ............................................................................................................................................................................ 21
Figure 9: Most recent person day and overnight trips by sex (per cent), 2011 .......................................................... 22
Figure 10: Most recent person day and overnight trips by population group (per cent), 2011 ................................... 22
Figure 11: Main destination by main purpose of trip for domestic overnight trips (per cent), 2011 ........................... 23
Figure 12: Main destination by mode of transport for domestic overnight trips (per cent), 2011 ............................... 25
Figure 13: Booking patterns by main purpose of trip for domestic overnight trips (how the trip was booked) (per cent), 2011 ........................................................................................................................................................... 30
Figure 14: Booking patterns by main purpose of trip for domestic overnight trips (method used to book) ................ 31
Figure 17: Most recent person day trips by province of destination and living standard measure (SAARF LSM) .... 39
Figure 18: Most recent person overnight trips by province of destination and living standard measure (SAARF LSM) ........................................................................................................................................................................... 39
Figure 19: Most recent person day trips by main purpose and living standard measure (SAARF LSM) ................... 40
Figure 20: Most recent person overnight trips by main purpose and living standard measure (SAARF LSM) .......... 40
Figure 21: Mode of transport used to undertake day trips and living standard measure (SAARF LSM) ................... 41
Figure 22: Mode of transport used to undertake overnight trips and living standard measure (SAARF LSM) .......... 41
Statistics South Africa P0352.1
Domestic Tourism Survey, January to December 2011
1 1. Introduction and methodology
1.1 Background This statistical release presents a selection of key findings from the Domestic Tourism Survey (DTS), which was conducted by Statistics South Africa (Stats SA) in 2012. Data collection took place from April to June 2012, focusing on the trips that were taken from January to December 2011. For a considerable time, Stats SA has provided substantial data on international tourism based on secondary data obtained from the Department of Home Affairs. The information from this data continues to be used by a wide variety of stakeholders to measure and understand international tourism in South Africa. Nevertheless, detailed information about national domestic tourism is limited, despite its potential role in economic and social development. As a result, there was a need to collect more detailed information on domestic tourism in order to better understand and measure the contribution of the tourism industry towards the national economy. The DTS is therefore aimed at addressing this need by collecting accurate statistics on the travel behaviour and expenditure of South African households travelling within the country. Such information is crucial in determining the contribution of tourism to the South African economy as well as helping with planning, marketing, policy formulation and regulation of tourism-related activities. In addition to the basic demographic information collected in the majority of household surveys conducted by Stats SA, the DTS covers areas specifically related to travel and expenditure patterns, namely: domestic day trips by the respondent and/or other household members, domestic day trips by other household members only (without the respondent), domestic overnight trips by the respondent and/or other household members, and domestic overnight trips by other household members only (without the respondent). The main objective of this report is to present the key findings for domestic tourism activity during the period January–December 2011. In some instance comparison has been done between the results of the DTS 2010 and 2011 because both surveys have the same reference period which was January-December. It contains information on the characteristics of travellers, the nature of domestic trips undertaken and expenditure generated by these trips. Information presented on trips and expenditure is a combination of information based on trips taken by the respondent and/or other household members and those by other household members only (without the respondent).
1.2 Target population The target population of the survey consists of all private households and residents in workers’ hostels in the nine provinces of South Africa. The survey does not cover other collective living quarters such as students’ hostels, old-age homes, hospitals, prisons and military barracks and is therefore only representative of non-institutionalised and non-military persons in South Africa. More details about the methodology, response rates and limitations to the study can be found in Section 7.
Statistics South Africa P0352.1
Domestic Tourism Survey, January to December 2011
2 2. Summary of key findings of the Domestic Tourism Survey 2010-2011 The number of most recent person day trips decreased from 7,6 million in 2010 to 6,7 million in 2011. There was also a decline in the number of most recent person overnight trips from 12,4 million in 2010 to 11,2 million in 2011. There was an increase in overnight trips that lasted two to four nights from 48% in 2010 to 50% in 2011. A higher percentage (41,3%) of overnight trips taken in 2010 lasted 5 or more nights when compared to 38,9% in 2011. KwaZulu-Natal was the most popular destination when it came to overnight trips – with nearly 20,8% in 2010 and 20,3% in 2011 of total overnight trips. Gauteng was the most visited province for day trips (23,9% in 2010 and 24,9% in 2011). The main reason why South Africans undertook day trips within South Africa during the reference period (January to December 2010 and January to December 2011) was to visit friends and family/relatives (28,5% in 2010 and 29,9% in 2011).Personal shopping was the second most popular reason for taking day trips, with 24,0% in 2010 and 25,1% in 2011 of the total reported day trips, while trips taken for leisure/vacation/holiday purposes constituted 16,4% in 2010 and 19,0% in 2011. Tourists were more likely to take overnight trips to visit friends and family/relatives. The percentages increased from 48,2% in 2010 to 52,7% in 2011. Leisure/vacation/holiday was the second most popular reason for taking overnight trips, with 22,2% in 2010 and 20,8% in 2011 of the total overnight trips Day travelling in the country was done mostly by cars with 56,0% in 2010 and 56,7% in 2011 of the trips. Taxis were the second most used mode of transport with 34,0% in 2010 and 32,6% 2011. About 7,0% in 2010 and 7,4% in 2011 of day travellers used buses. Tourists were also more likely to use cars, the percentages increased from 44,1% in 2010 to 45,2% in 2011. A slight decrease was observed on the overnight trips made by taxis from 38,9% in 2010 to 38,1% in 2011. Tourists that used buses to reach their destinations remained almost the same with 10,9% in 2010 and 10,7% in 2011. Most of the day travellers who used cars used this mode to visit friends and relatives though there was a slight decrease of about 1,3% on the use of this mode between 2010 and 2011. The proportion of day travellers that used this mode for leisure or holidays, increased from 24,2% to 24,9%. The results further indicate that car users who used their cars for trips to go shopping for personal use decreased from 17,1% in 2010 to 15,4% in 2011. About thirty-nine percent (38,8%) of overnight trips car users in 2010 used their cars when visiting friends and relatives. This increased to 43,4% in 2011. The percentages of car users who took trips for leisure or vacation decreased from 39,2% in 2010 to 34,2% in 2011. Those using taxis for overnight trips used them mainly to visit friends and relatives. These trips increased from 61,2% to 62,8% from 2010 to 2011 respectively. Eating out at restaurants and cafes was a very popular activity on both day and overnight trips. In 2010 and 2011, an estimated 36,0% of people ate at restaurants and cafes while they were on day trips and overnight trips. Above 17,0% of day travellers and 20,0% of overnight tourists also engaged in shopping at malls/flea markets. In 2010 and 2011, about 70,0% of overnight trips destined to the Western Cape were taken by cars. Trips made by aircraft increased from 8,0% in 2010 to 11,8% in 2011. Over a period of two years i.e. 2010 and 2011, there was an upward trend of tourists that used cars in the Eastern Cape (from 37,1% to 39,7%), Northern Cape (from 52,8% to 60,5%), Free State (from 45,1% to 48,3%), KwaZulu-Natal (from 42,9% to 45,3%) and Gauteng (from 33,8% to 38,7%). The use of taxis when travelling to the Free State increased from 41,0% in 2010 to 42,0% in 2011, followed by North West increasing from 37,3% in 2010 to 39,2% in 2011 and Mpumalanga increased from 43,8% in 2010 to 47,7% in 2011. The use of taxis for trips to Limpopo remained stable at 46,0%. Day travellers who have never been married were more likely to travel than individuals in other marital status groups (47,4% in 2010 and 49,0% in 2011). Individuals aged between 25 and 44 years took almost the same number of overnight trips in 2010 (37,1%) and 2011 (36,7%). Individuals who have never been married were most likely to travel when compared to tourists in other marital status groups (52,1% in 2010 and 51,3% in 2011). The results show that females undertook day and overnight trips more than males in 2010 and 2011. The most frequent reason given by those persons who did not travel (36,8%) in 2010 and (33,1%) in 2011 was that their friends and relatives stayed within 40 kilometres from them; therefore their visits did not fall in the category of trips. Slightly above 30,0% mentioned financial reasons as a deterrent from undertaking overnight trips.
Statistics South Africa P0352.1
Domestic Tourism Survey, January to December 2011
3 3. Characteristics of the most recent domestic day and overnight trips undertaken Information was collected from households on the kind of trips they took during the 12-month period, i.e. from January to December 2011. These trips were categorised as day trips inside South Africa’s borders (domestic day trip), and overnight trip inside South Africa (domestic overnight trip). Further details pertaining to these were obtained from respondents, namely the most recent trip/s they took, e.g. the main destination, the purpose of the trip, and main mode of transport used to reach the main destination. In this section, information will be discussed on the most recent domestic day and overnight trips. The following analysis summarises the main statistics for domestic tourism activity in 2011. It contains information on the characteristics of those who travelled, the trips they undertook, and the expenditure generated by these trips. The key findings reported in this section are summary measures for the general purpose of measuring domestic tourism and its contribution to the national economy in South Africa. Due to rounding, numbers may not necessarily add up to totals. Where applicable, the findings should be interpreted alongside the notes appearing at the bottom of the tables or figures. Definitions Domestic trip A trip within the boundaries of South Africa, but outside the respondent’s usual environment, that is, within a 40km radius or more. The following categories are excluded from the definition of 'domestic visitor': Persons travelling to another place within the country with the intention of setting up their usual residence in that place, persons who travel to another place within the country and are remunerated from within the place visited, and persons who travel regularly or frequently between neighbouring localities as defined by the ‘usual environment’ rule. Day trip A trip outside the respondent’s usual environment, where they leave and return on the same day (i.e. do not stay overnight). Overnight trip A trip outside the respondent’s usual environment where one night or more is spent away from the household. The information is based on person trips taken. This means that if four people went on a trip, a trip was recorded for each person.
Statistics South Africa P0352.1
Domestic Tourism Survey, January to December 2011
4 3.1 Number and type of trips 3.1.1 Number of day and overnight trips inside South Africa
Table 3a: Number of trips taken during the period January to December, 2010–2011 (’000)
Month trip Number of day trips Number of overnight trips
The results of Table 3a show that in both 2010 and 2011 most day and overnight trips were taken in December. Generally there has been a decrease in the number of day and overnight trips between the two years being reported on. The decline has been witnessed for all months except for overnight trips taken in April. The number of overnight trips increased from 3,2 million in April 2010 to 3,3 million in April 2011. About 4 million day trips were taken in December 2010 compared to almost 3,5 million day trips taken in December 2011. Other months that showed a relatively high frequency of day trips taken were January, March, June and September. Day trips that were taken in January decreased from 2,7 million in 2010 to 2,4 million in 2011. In March there was a decrease of about four-hundred thousand day trips from 2010 to 2011. During the month of June 2011 fewer day trips were taken (2,5 million) as compared to June 2010 (3 million). September also had a declining trend, about 3,2 million day trips were taken in 2010 which decreased to 2,7 million in 2011. On the other hand, most overnight trips were taken in December, September, June and April. Overnight trips that were taken in December decreased from 4,7 million in 2010 to 4,3 million in 2011. In September there was a decrease of almost a hundred thousand overnight trips from 2010 to 2011. There was a significant decrease of overnight trips taken in June 2010 and June 2011.
Table 3b: Number of most recent person day and overnight trips, 2010–2011 (’000)
Type of trip
Number of most recent person trips (’ 000)
2010 2011Day trip in South Africa 7 636 6 730
Overnight trip in South Africa 12 371 11 205 Table 3b indicates the total number of recent person trips taken during the 12-month period (January-December 2010 and January–December 2011). This table contains information on two kinds of trips that people undertook, i.e. day trips and overnight trips inside South Africa. The number of most recent person day trips decreased from 7,6 million in 2010 to 6,7 million in 2011. There was also a decline in the number of most recent person overnight trips from 12,4 million in 2010 to 11,2 million in 2011.
Statistics South Africa P0352.1
Domestic Tourism Survey, January to December 2011
5 3.1.2 Number of persons who undertook overnight trips
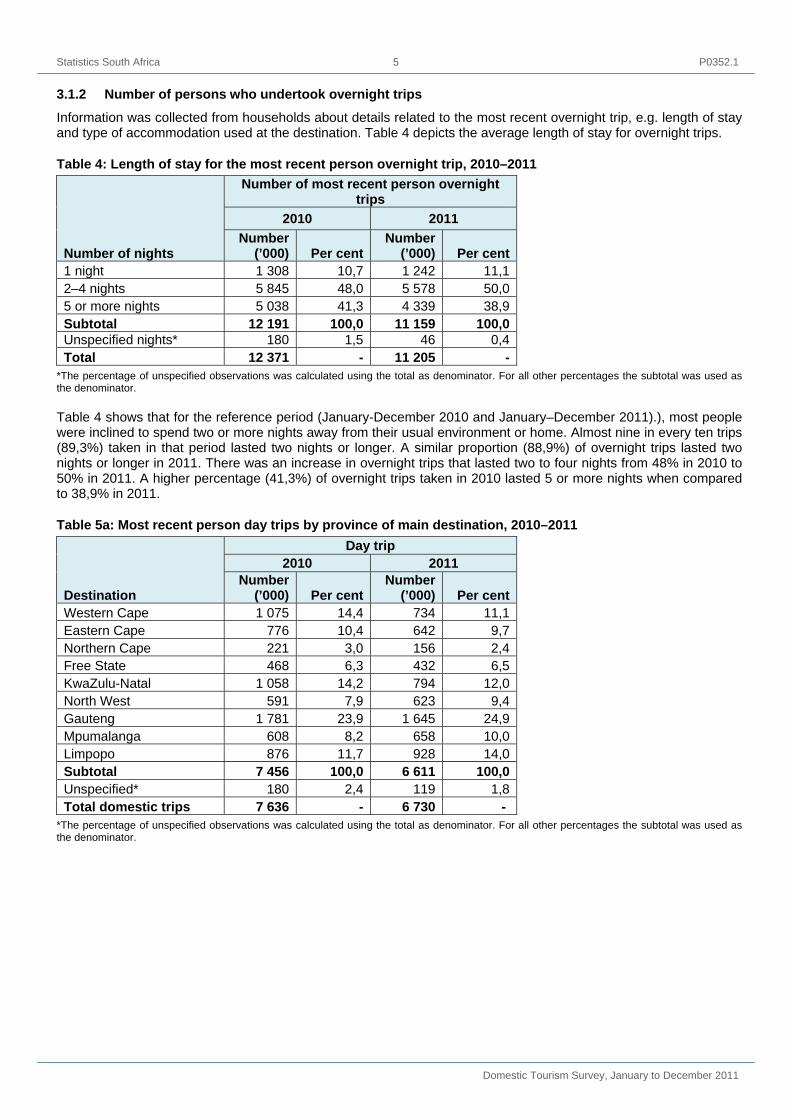
Information was collected from households about details related to the most recent overnight trip, e.g. length of stay and type of accommodation used at the destination. Table 4 depicts the average length of stay for overnight trips.
Table 4: Length of stay for the most recent person overnight trip, 2010–2011
*The percentage of unspecified observations was calculated using the total as denominator. For all other percentages the subtotal was used as the denominator. Table 4 shows that for the reference period (January-December 2010 and January–December 2011).), most people were inclined to spend two or more nights away from their usual environment or home. Almost nine in every ten trips (89,3%) taken in that period lasted two nights or longer. A similar proportion (88,9%) of overnight trips lasted two nights or longer in 2011. There was an increase in overnight trips that lasted two to four nights from 48% in 2010 to 50% in 2011. A higher percentage (41,3%) of overnight trips taken in 2010 lasted 5 or more nights when compared to 38,9% in 2011.
Table 5a: Most recent person day trips by province of main destination, 2010–2011
*The percentage of unspecified observations was calculated using the total as denominator. For all other percentages the subtotal was used as the denominator.
Statistics South Africa P0352.1
Domestic Tourism Survey, January to December 2011
6 Figure 1a: Most recent person day trips by province of destination (per cent), 2010–2011
Note: WC = Western Cape; EC = Eastern Cape; NC = Northern Cape; FS = Free State; KZN = KwaZulu-Natal; NW = North West; GP = Gauteng; MP = Mpumalanga; LP = Limpopo Table 5a presents the results of travel patterns with a focus on the number of domestic trips taken by day visitors and tourists during the 12-month reference period (January to December 2010 and January to December 2011). The focus is on information regarding the last trip of its kind, i.e. day trip, and the main destination visited on that trip. The main destination for day trips in 2010 was Gauteng at 23,9% followed by Western Cape (14,4%), KwaZulu-Natal (14,2%) and Limpopo (11,7%). The results further indicate that in 2011 the same provinces were also the main destinations visited, Gauteng (24,9%), Limpopo (14,0%), KwaZulu-Natal (12,0%) and Western Cape (11,1%). Northern Cape was the least visited province, with 3,0% of day trip travellers in 2010 and 2,4% in 2011.
Table 5b: Most recent person overnight trips by province of main destination, 2010–2011
Table 5b and Figure 1b above show that in 2010 and 2011, KwaZulu-Natal and Gauteng were the most visited destinations for overnight trips. The results indicate a slight decrease. In 2010, 21% of tourists visited KwaZulu-Natal as compared 20% in 2011. Fifteen percent (15,4%) of overnight trips were made to Gauteng in 2010 and these grew to 16,1% in 2011. Eastern Cape experienced more overnight trips (13,2%) in 2010 than in 2011 (11,7%). The percentage of overnight trips to Limpopo increased from 13% in 2010 to 15% in 2011. Northern Cape was the least visited destination for overnight trips during the reference period. Only 2,6% of tourists visited that destination in 2010 and 2,3% in 2011. The percentage of unspecified destinations for overnight trips was 1,4% in 2010 and 2,1% in 2011. The proportion of overnight trips was effectively the same for Western Cape during both years at 11,4%.
3.2 Trip purpose
Table 6a: Main purpose of trip by most recent person day trips, 2010–2011
*The percentage of unspecified observations was calculated using the total as denominator. For all other percentages the subtotal was used as the denominator.
Statistics South Africa P0352.1
Domestic Tourism Survey, January to December 2011
8 Figure 2a: Main purpose of trip by most recent person day trips (per cent), 2010–2011
Table 6a and Figure 2a show the number of trips taken by day travellers categorised by main purpose of trip. The main reason why South African households undertook day trips within South Africa during the reference period (January to December 2010-2011) was to visit friends and family/relatives (28,5% in 2010 and 29,9% in 2011). Personal shopping was the second most popular reason for taking day trips, with 24,0% in 2010 and 25,1% in 2011 of the total day trips, while trips taken for leisure/vacation/holiday purposes constituted 16,4% in 2010 and 19,0% in 2011 and was the third highest reason why respondents took day trips. The proportion of day trips for sporting participants was 1,0% in 2010 and 1,7% in 2011. The percentage of persons who took day trips to attend business conferences (0,4%) was the same for both 2010 and 2011.
Table 6b: Main purpose of trip by most recent person overnight trips, 2010 – 2011
*The percentage of unspecified observations was calculated using the total as denominator. For all other percentages the subtotal was used as the denominator.
Statistics South Africa P0352.1
Domestic Tourism Survey, January to December 2011
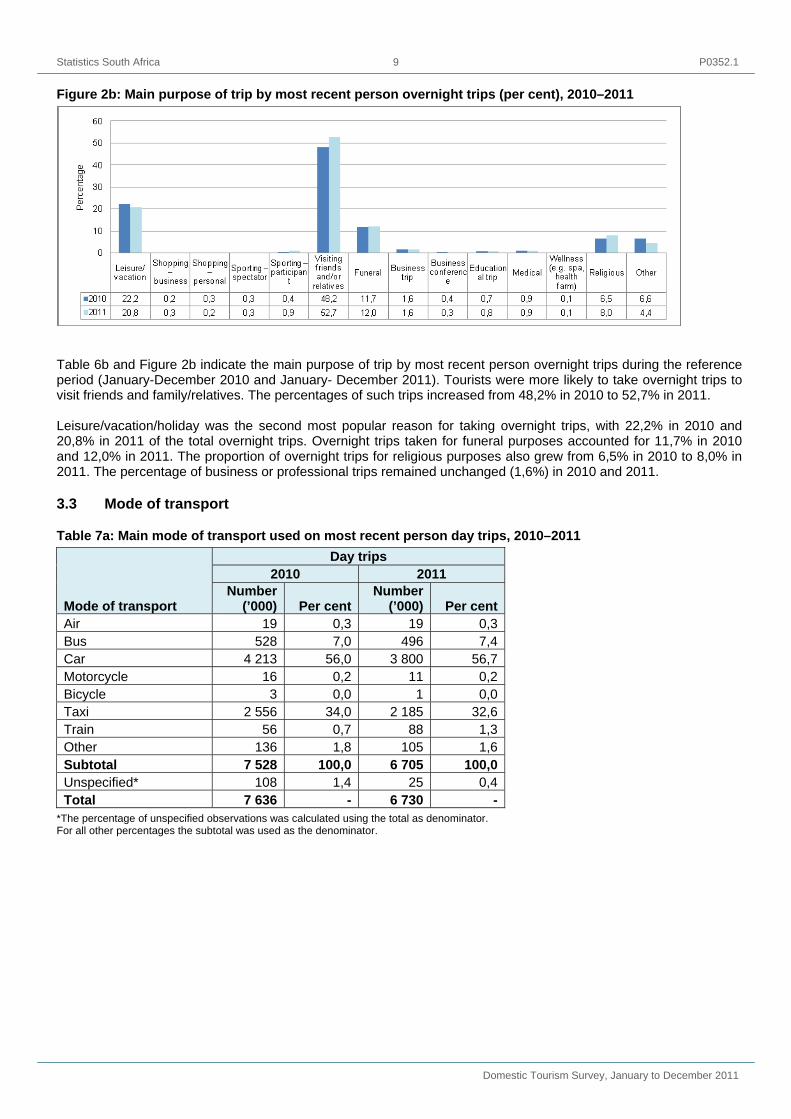
9 Figure 2b: Main purpose of trip by most recent person overnight trips (per cent), 2010–2011
Table 6b and Figure 2b indicate the main purpose of trip by most recent person overnight trips during the reference period (January-December 2010 and January- December 2011). Tourists were more likely to take overnight trips to visit friends and family/relatives. The percentages of such trips increased from 48,2% in 2010 to 52,7% in 2011. Leisure/vacation/holiday was the second most popular reason for taking overnight trips, with 22,2% in 2010 and 20,8% in 2011 of the total overnight trips. Overnight trips taken for funeral purposes accounted for 11,7% in 2010 and 12,0% in 2011. The proportion of overnight trips for religious purposes also grew from 6,5% in 2010 to 8,0% in 2011. The percentage of business or professional trips remained unchanged (1,6%) in 2010 and 2011.
3.3 Mode of transport
Table 7a: Main mode of transport used on most recent person day trips, 2010–2011
*The percentage of unspecified observations was calculated using the total as denominator. For all other percentages the subtotal was used as the denominator.
Statistics South Africa P0352.1
Domestic Tourism Survey, January to December 2011
10 Figure 3a: Mode of transport used to undertake day trips (per cent), 2010–2011
Table 7a and Figure 3a show the number of person trips taken by day travellers, grouped by the mode of transport used. Day travelling in the country was done mostly by cars with 56,0% in 2010 and 56,7% in 2011. Taxis were the second most used mode of transport with 34,0% in 2010 and 32,6% 2011. About 7,0% in 2010 and 7,4% in 2011 of day travellers used buses, while less than one per cent (0,7%) used trains in 2010 and 1,3% used trains in 2011. Day travellers were the least likely to use aircraft (0,3%) and motorcycles (0,2%) in both years.
Table 7b: Main mode of transport used on most recent person overnight trips, 2010 - 2011
*The percentage of unspecified observations was calculated using the total as denominator. For all other percentages the subtotal was used as the denominator.
Statistics South Africa P0352.1
Domestic Tourism Survey, January to December 2011
11 Figure 3b: Mode of transport used to undertake overnight trips (per cent), 2010–2011
Table 7b and Figure 3b are about the number of trips taken by overnight tourists grouped by the mode of transport used. Tourists were also more likely to use cars, the percentages increased from 44,1% in 2010 to 45,2% in 2011. A slight decrease was observed on the overnight trips made by taxis from 38,9% in 2010 to 38,1% in 2011. Tourists that used buses to reach their destinations remained almost the same with 10,9% in 2010 and 10,7% in 2011. Unlike with day trips, at least 3% of overnights trips were taken by aircraft both in 2010 and 2011. Less than 2% of trips were taken by trains in the above mentioned period.
3.4 Main purpose of trip and mode of transport Table 8 presents the main purpose of trip for domestic day visitors by mode of transport used to reach the main destination.
Table 8: Main purpose of trip by mode of transport used on most recent person day trips (per cent), 2010–2011
Main purpose of trip
Bus Car Taxi Train 2010 2011 2010 2011 2010 2011 2010 2011
Unspecified was excluded from the denominator when calculating percentages.
Statistics South Africa P0352.1
Domestic Tourism Survey, January to December 2011
12 The results of the Table 8 show that most day travellers who used buses used them to do shopping for their personal use. Travelling by bus of such use increased from 22,5% in 2010 to 29,4% in 2011. The use of buses during day trips for study purposes also increased by 3,7% points between the two years. A decreasing pattern was experienced from 10,4% to 7,4% of day travellers who used buses to visit their friends and relatives. The same percentage (12,0%) of those who used buses for leisure remained unchanged from 2010 to 2011. Most of the day travellers who used cars used this mode to visit friends and relatives though there was a slight decrease of about 1,0% between 2010 and 2011. The percentage that used it for leisure or holidays, increased from 24,2% to 24,9%. The results further indicate that individuals that used cars to shop for personal use decreased from 17,1% in 2010 to 15,4% in 2011. On the other hand it is seen that day trips using taxis were most likely used to visit friends and relatives and for shopping for personal use. The day trips by taxis to shop for personal use decreased from 35,6% in 2010 to 33,3% in 2011. It is interesting to note that day trips using trains for visiting friends and relatives as well as shopping for personal use have increased noticeably. About twenty-nine per cent (29,3%) of day travelers who used trains in 2010 and almost 39,0% in 2011 responded that the main purpose of their trip was to shop for personal use.
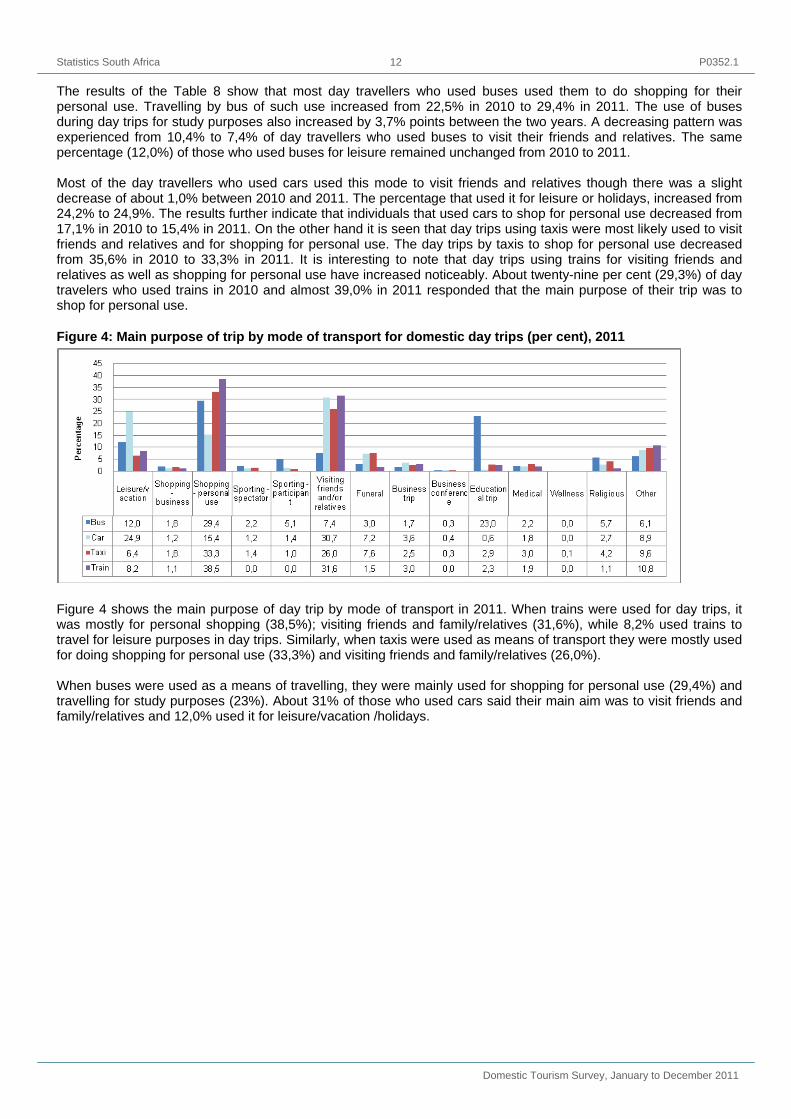
Figure 4: Main purpose of trip by mode of transport for domestic day trips (per cent), 2011
Figure 4 shows the main purpose of day trip by mode of transport in 2011. When trains were used for day trips, it was mostly for personal shopping (38,5%); visiting friends and family/relatives (31,6%), while 8,2% used trains to travel for leisure purposes in day trips. Similarly, when taxis were used as means of transport they were mostly used for doing shopping for personal use (33,3%) and visiting friends and family/relatives (26,0%). When buses were used as a means of travelling, they were mainly used for shopping for personal use (29,4%) and travelling for study purposes (23%). About 31% of those who used cars said their main aim was to visit friends and family/relatives and 12,0% used it for leisure/vacation /holidays.
Statistics South Africa P0352.1
Domestic Tourism Survey, January to December 2011
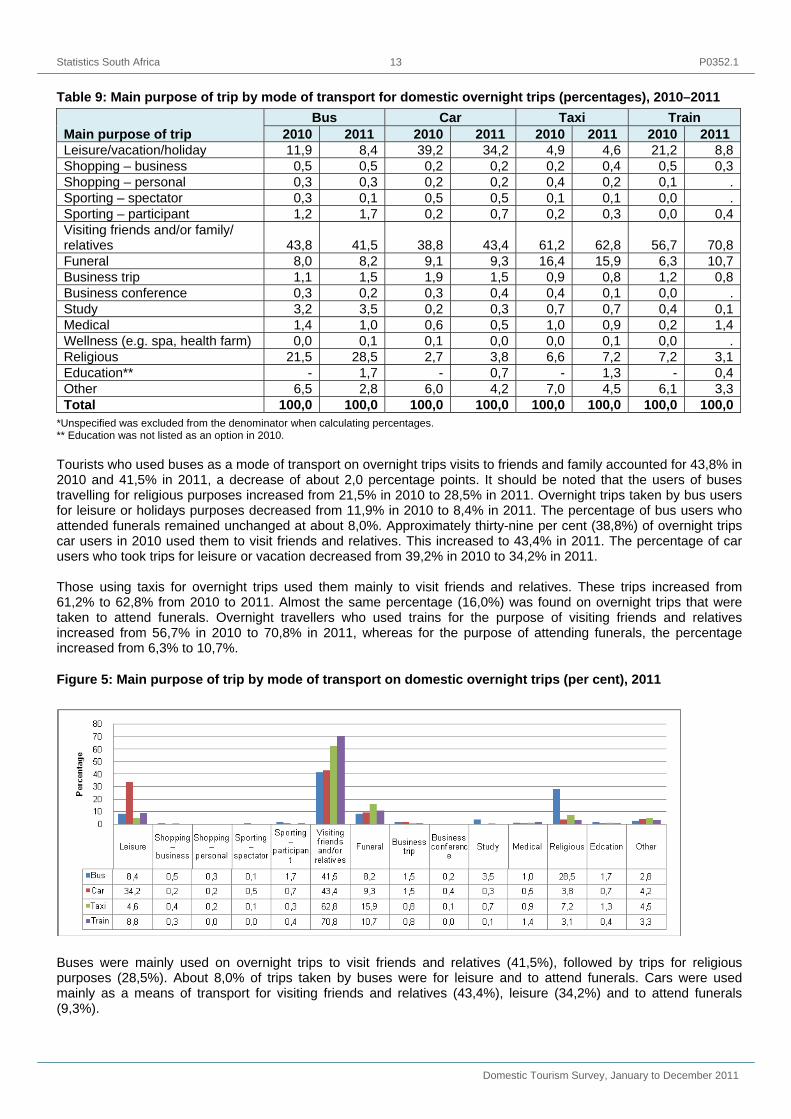
13 Table 9: Main purpose of trip by mode of transport for domestic overnight trips (percentages), 2010–2011 Main purpose of trip
Bus Car Taxi Train 2010 2011 2010 2011 2010 2011 2010 2011
*Unspecified was excluded from the denominator when calculating percentages. ** Education was not listed as an option in 2010. Tourists who used buses as a mode of transport on overnight trips visits to friends and family accounted for 43,8% in 2010 and 41,5% in 2011, a decrease of about 2,0 percentage points. It should be noted that the users of buses travelling for religious purposes increased from 21,5% in 2010 to 28,5% in 2011. Overnight trips taken by bus users for leisure or holidays purposes decreased from 11,9% in 2010 to 8,4% in 2011. The percentage of bus users who attended funerals remained unchanged at about 8,0%. Approximately thirty-nine per cent (38,8%) of overnight trips car users in 2010 used them to visit friends and relatives. This increased to 43,4% in 2011. The percentage of car users who took trips for leisure or vacation decreased from 39,2% in 2010 to 34,2% in 2011. Those using taxis for overnight trips used them mainly to visit friends and relatives. These trips increased from 61,2% to 62,8% from 2010 to 2011. Almost the same percentage (16,0%) was found on overnight trips that were taken to attend funerals. Overnight travellers who used trains for the purpose of visiting friends and relatives increased from 56,7% in 2010 to 70,8% in 2011, whereas for the purpose of attending funerals, the percentage increased from 6,3% to 10,7%.
Figure 5: Main purpose of trip by mode of transport on domestic overnight trips (per cent), 2011
Buses were mainly used on overnight trips to visit friends and relatives (41,5%), followed by trips for religious purposes (28,5%). About 8,0% of trips taken by buses were for leisure and to attend funerals. Cars were used mainly as a means of transport for visiting friends and relatives (43,4%), leisure (34,2%) and to attend funerals (9,3%).
Statistics South Africa P0352.1
Domestic Tourism Survey, January to December 2011
14
3.5 Activities undertaken during trips
3.5.1 Day trips
Table 10a provides comprehensive details of activities that were undertaken during domestic day trips, whilst Figure 6a gives the same situation in a summarised format. In addition to being asked what the main purpose of the trip was, respondents were also asked what activities they undertook whilst on the trip. This question was aimed at establishing what additional activities were engaged in, in addition to the main purpose of the trip, e.g. a person took the trip for business purposes, but whilst on the trip he/she may also have had dinner at a restaurant.
Figure 6a: Activities other than the main purpose of the trip undertaken on most recent person day trips (per cent), 2010 - 2011
From Table 10a and Figure 6a, it is clear that the broader activity category, namely 'Recreation and entertainment', which includes eating out, restaurants and cafes, formed the bulk of activities undertaken by day trip travellers – 63,4% in 2010 and 62,6% in 2011, followed by ‘Nature-based’ activities from 16,2% in 2010 to 19,7% in 2011. Almost 10,0% of activities undertaken as secondary activities from 2010 to 2011 on day trips were social activities. This includes visiting friends/family, and attending weddings amongst others. About two per cent (2,4%) of some of the engagements were religious activities in 2010 and this decreased slightly to 1,7% in 2011. The same trend was observed for sports activities with a decrease from 5,0% to 4,3%. Business or professional activities had the same proportions (2,0%) over a period of two years as well as medical/health activities (1,0%).
Statistics South Africa P0352.1
Domestic Tourism Survey, January to December 2011
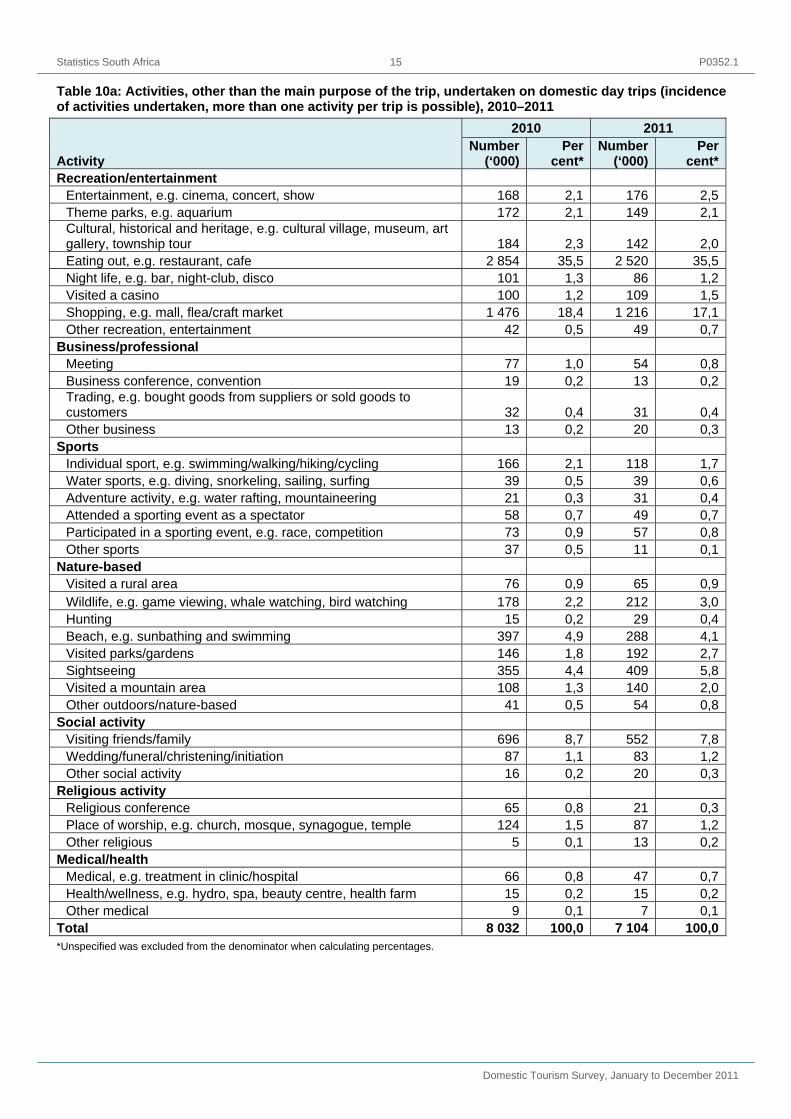
15 Table 10a: Activities, other than the main purpose of the trip, undertaken on domestic day trips (incidence of activities undertaken, more than one activity per trip is possible), 2010–2011
Activity
2010 2011 Number
(‘000)Per
cent* Number
(‘000) Per
cent*Recreation/entertainment
Entertainment, e.g. cinema, concert, show 168 2,1 176 2,5Theme parks, e.g. aquarium 172 2,1 149 2,1Cultural, historical and heritage, e.g. cultural village, museum, art gallery, township tour 184 2,3 142 2,0Eating out, e.g. restaurant, cafe 2 854 35,5 2 520 35,5Night life, e.g. bar, night-club, disco 101 1,3 86 1,2Visited a casino 100 1,2 109 1,5Shopping, e.g. mall, flea/craft market 1 476 18,4 1 216 17,1Other recreation, entertainment 42 0,5 49 0,7
Business/professional Meeting 77 1,0 54 0,8Business conference, convention 19 0,2 13 0,2Trading, e.g. bought goods from suppliers or sold goods to customers 32 0,4 31 0,4Other business 13 0,2 20 0,3
Sports Individual sport, e.g. swimming/walking/hiking/cycling 166 2,1 118 1,7Water sports, e.g. diving, snorkeling, sailing, surfing 39 0,5 39 0,6Adventure activity, e.g. water rafting, mountaineering 21 0,3 31 0,4Attended a sporting event as a spectator 58 0,7 49 0,7Participated in a sporting event, e.g. race, competition 73 0,9 57 0,8Other sports 37 0,5 11 0,1
Nature-based Visited a rural area 76 0,9 65 0,9Wildlife, e.g. game viewing, whale watching, bird watching 178 2,2 212 3,0Hunting 15 0,2 29 0,4Beach, e.g. sunbathing and swimming 397 4,9 288 4,1Visited parks/gardens 146 1,8 192 2,7Sightseeing 355 4,4 409 5,8Visited a mountain area 108 1,3 140 2,0Other outdoors/nature-based 41 0,5 54 0,8
Social activity Visiting friends/family 696 8,7 552 7,8Wedding/funeral/christening/initiation 87 1,1 83 1,2Other social activity 16 0,2 20 0,3
Religious activity Religious conference 65 0,8 21 0,3Place of worship, e.g. church, mosque, synagogue, temple 124 1,5 87 1,2Other religious 5 0,1 13 0,2
Medical/health Medical, e.g. treatment in clinic/hospital 66 0,8 47 0,7Health/wellness, e.g. hydro, spa, beauty centre, health farm 15 0,2 15 0,2Other medical 9 0,1 7 0,1
Total 8 032 100,0 7 104 100,0*Unspecified was excluded from the denominator when calculating percentages.
Statistics South Africa P0352.1
Domestic Tourism Survey, January to December 2011
16
3.5.2 Overnight trips
Figure 6b shows broad categories of the activities undertaken while on an overnight trip. A breakdown of activities that were undertaken during domestic overnight trips is presented in Table 10b. As in the case with day trips, respondents were asked about additional activities that they had engaged in when on an overnight trip. It is important to keep in mind that the main purpose for taking the overnight trip might have been for visiting family/friends in Cape Town for example, but whilst visiting friends/relatives, one might have visited a casino as well. This would have been indicated as such under recreation/entertainment in this section.
Figure 6b: Activities other than the main purpose of the trip undertaken on most recent person overnight trips (per cent), 2010 – 2011
Table 10b indicates a similar pattern of the type of additional activities undertaken during overnight trips as those for day trips. As was the case with day trips, the three most popular activities undertaken on overnight trips were shopping at malls/flea markets (20,0%) in 2010 and remained the same (19,9%) for 2011; eating out at restaurants/bars was 19,3% in 2010 and slightly increased to 19,9% in 2011. Visiting friends/family was almost 10,3% in 2010 and 9,8% in 2011. People were also more inclined to visit places of worship (5,9%) in 2010 than (5,0%) in 2011. Tourists also engaged in sunbathing and swimming, which accounted for 5,6% in 2010 and 5,3% in 2011. According to Figure 6b, the activity category 'recreation and entertainment', which includes eating out, shopping, and going to cinemas, formed the bulk of activities undertaken by tourists. It accounted for 54,5% in 2010 and increased to 55,1% in 2011. Approximately 18,8% and 19,9% of overnight trips were undertaken by individuals in 2010 and 2011 respectively, who engaged in nature-based activities. Taking part in social activities (visiting friends/family, weddings, etc.) was another popular type of activity which constituted 12,9% of additional activities in 2010 and 11,9% in 2011. Other activities such as sports constituted 5% in both years. Religious activities made up 6,9% and 6,2% respectively in 2010 and 2011.
Statistics South Africa P0352.1
Domestic Tourism Survey, January to December 2011
17
Table 10b: Activities, other than the main purpose of the trip, undertaken on domestic overnight trips (incidence of activities undertaken, more than one activity per trip is possible), 2010–2011
Activity
2010 2011 Number
(’000) Per cent Number
(’000) Per centRecreation/entertainment
Entertainment, e.g. cinema, concert, show 869 3,8 710 3,4Theme parks, e.g. aquarium 759 3,3 726 3,5Cultural, historical and heritage, e.g. cultural village, museum 655 2,8 589 2,9Eating out, e.g. restaurant, cafe 4 482 19,3 4 113 19,9Night life, e.g. bar, night club, disco 689 3,0 680 3,3Visited casino 426 1,8 415 2,0Shopping, e.g. mall, flea/craft market 4 624 20,0 4 113 19,9Other recreation, entertainment 118 0,5 44 0,2
Business/professional Meeting 63 0,3 70 0,3Business conference, convention 48 0,2 26 0,1Trading, e.g. bought goods from suppliers or sold goods to customers 38 0,2 26 0,1Other business 28 0,1 25 0,1
Sports Individual sports, e.g. swimming/walking/hiking/cycling 494 2,1 473 2,3Water sports, e.g. diving, snorkeling, sailing, surfing 127 0,5 150 0,7Adventure activity, e.g. water rafting, mountaineering 123 0,5 77 0,4Attended a sporting event as a spectator 291 1,3 208 1,0Participated in a sporting event, e.g. race, competition 62 0,3 115 0,6Other sports 60 0,3 39 0,2
Nature-based Visited a rural area 316 1,4 322 1,6Wildlife, e.g. game viewing, whale watching, bird watching 522 2,3 519 2,5Hunting 52 0,2 60 0,3Beach, e.g. sunbathing and swimming 1 307 5,6 1 085 5,3Visited parks/gardens 571 2,5 601 2,9Sightseeing 1 016 4,4 995 4,8Visited a mountain area 417 1,8 447 2,2Other outdoors/nature-based 135 0,6 59 0,3
Social activity Visiting friends/family 2 397 10,3 2 023 9,8Wedding/funeral/christening/initiation 525 2,3 372 1,8Other social activities 80 0,3 69 0,3Religious activity Religious conference 209 0,9 210 1,0Place of worship, e.g. church, mosque, synagogue, temple 1 366 5,9 1 038 5,0Other religious 19 0,1 37 0,2
Medical/health Medical, e.g. treatment in clinic/hospital 192 0,8 112 0,5Health/wellness, e.g. hydro, spa, beauty centre, health farm 76 0,3 59 0,3Other medical 10 0,0 10 0,0
Total 23 166 100,0 20 618 100,0Unspecified was excluded from the denominator when calculating percentages
Statistics South Africa P0352.1
Domestic Tourism Survey, January to December 2011
18 3.6 Demographic characteristics of day travellers and tourists Information on the characteristics of visitors and tourists is important in assessing the profile of people who travel to different destinations. Tables 11a and 11 b provide information on the demographic characteristics of domestic day visitors and tourists.
Table 11a: Demographic analysis by most recent person day trips, 2010–2011
Characteristics 2010 2011
Number (’000) Per cent Number (’000) Per centAge group
Total 7 636 - 6 730 -Unspecified was excluded from the denominator when calculating percentages Individuals in the age groups 25 to 34 years and 35 to 44 years made up almost 40,0% of the total number of day travellers. These age groups travelled the most over the reference period compared to other age groups. Table 11a shows that day travellers who have never been married were more likely to travel than individuals in other marital status groups (47,4% in 2010 and 49,0% in 2011). It also showed that when comparing travelling patterns by education levels, 30,2% of individuals who did not complete secondary school undertook most day trips in 2010 and again 29,1% day trips in 2011. Individuals with a Grade 7/ Standard 5 qualification were the least likely to travel with 4% doing so in both years.
Table 11b: Demographic analysis of most recent person overnight trips, 2010–2011
Characteristics 2010 2011
Number (’000) Per cent Number (’000) Per centAge group
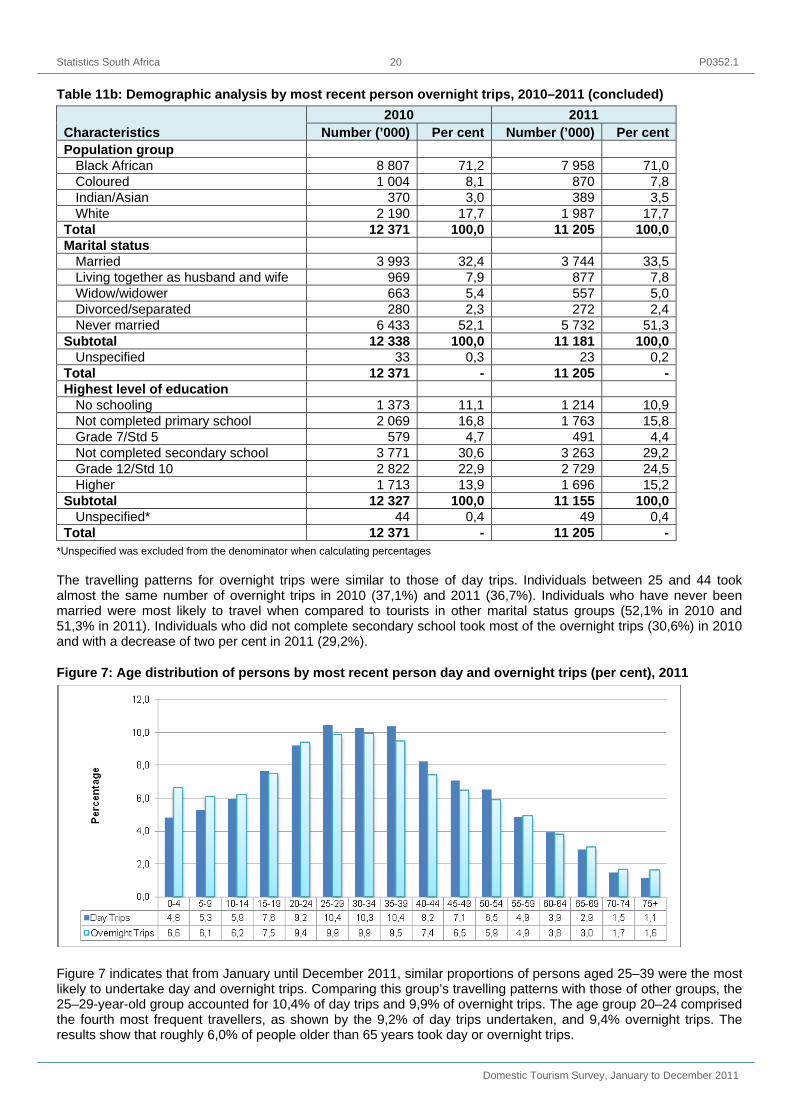
Total 12 371 - 11 205 -*Unspecified was excluded from the denominator when calculating percentages The travelling patterns for overnight trips were similar to those of day trips. Individuals between 25 and 44 took almost the same number of overnight trips in 2010 (37,1%) and 2011 (36,7%). Individuals who have never been married were most likely to travel when compared to tourists in other marital status groups (52,1% in 2010 and 51,3% in 2011). Individuals who did not complete secondary school took most of the overnight trips (30,6%) in 2010 and with a decrease of two per cent in 2011 (29,2%).
Figure 7: Age distribution of persons by most recent person day and overnight trips (per cent), 2011
Figure 7 indicates that from January until December 2011, similar proportions of persons aged 25–39 were the most likely to undertake day and overnight trips. Comparing this group’s travelling patterns with those of other groups, the 25–29-year-old group accounted for 10,4% of day trips and 9,9% of overnight trips. The age group 20–24 comprised the fourth most frequent travellers, as shown by the 9,2% of day trips undertaken, and 9,4% overnight trips. The results show that roughly 6,0% of people older than 65 years took day or overnight trips.
Statistics South Africa P0352.1
Domestic Tourism Survey, January to December 2011
21 Figure 8: Broad age group distribution of people who took domestic day trips and overnight trips (per cent), 2011
Figure 8 shows that persons in the broad age group 25 to 34 years undertook most of the day trips (20,7%) and overnight trips (19,8%) as compared to other groups. Persons in the age group 35 to 44 were the second most likely to travel, with about 18,7% day trips and 16,9% overnight trips.
Table 12: Broad age group distribution of people who took at least one domestic day trip and at least one overnight trip, 2011
Unspecified was excluded from the denominator when calculating percentages An estimated 822 thousand day trips and slightly over 1,7 million overnight trips were taken by children aged 0–11 years during the reference period. The age group 25–34 years had the highest estimated number of trips for both day (1,4 million) as well as overnight trips (2,2 million). The age group 55 years and older accounted for 14,3% of day trips and 15,1% of overnight trips.
Statistics South Africa P0352.1
Domestic Tourism Survey, January to December 2011
22 Figure 9: Most recent person day and overnight trips by sex (per cent), 2011
The gender distribution patterns for domestic day and overnight trips reflect that females were more likely to travel than males. More than half the people who took day trips were females (53,3%), while males accounted for 46,7% of the total. The picture remained similar for overnight trips with 54,1% females and 45,9% male tourists.
Figure 10: Most recent person day and overnight trips by population group (per cent), 2011
Black Africans undertook nearly two-thirds of domestic day trips (68,7%), followed by the white (18,7%), coloured (9,7%) and Asian/Indian (2,9%) population groups. Again the figure indicates that most black Africans took most of the overnight trips (71,0%) followed by white (17,7%), coloured (7,8%) and Indian/Asian (3,5%) population groups.
Statistics South Africa P0352.1
Domestic Tourism Survey, January to December 2011
23 3.7 Main destination and main purpose of trip for domestic overnight trips Table 13 and Figure 11 provide information on the main destination and main purpose of trip for domestic overnight tourists.
Table 13: Main destination by main purpose of trip for domestic overnight trips (per cent*), 2011
Figure 11: Main destination by main purpose of trip for domestic overnight trips (per cent), 2011
Category other includes sports, shopping, business conference, study, medical and wellness.
Statistics South Africa P0352.1
Domestic Tourism Survey, January to December 2011
24 Nearly 5 out of 10 tourists visiting Western Cape travelled for leisure, while roughly 34,0% travelled to visit friends and/or relatives. Other reasons tourists visited Western Cape were to visit friends or family (33,6%); for religious purposes (3,8%) and to attend funerals (3,3%). KwaZulu-Natal recorded the second highest percentage of individuals travelling for leisure (26,2%). In all provinces except Western Cape, visiting friends or family was the most frequently cited reason for visiting those provinces. Gauteng recorded 61,8% of such trips, 11,8% for leisure or holiday purposes and 7,4% for funeral attendance. Trips to visit friends and family accounted for 51,3% of trips to North West, followed by leisure and holiday purposes (18,7%) and trips to attend funerals (14,4%). Relative to the other provinces, Limpopo had the highest proportion of tourists who made overnight trips for religious purposes (18,4%).
3.8 Main destination and mode of transport for domestic overnight trips Table 14 provides information on the main destination and mode of transport for domestic overnight trips.
Table 14: Main destination by mode of transport for domestic overnight trips (per cent), 2010–2011
Destination Reference
period Air Bus Car Taxi Train Other Total Western Cape 2010 8,0 9,0 69,8 8,0 3,5 1,5 100,0
2011 3,1 10,6 45,2 38,1 1,4 1,6 100,0 ‘Other’ category includes Motorcycle; Bicycle and other modes of transport. Unspecified was excluded from the denominator when calculating percentages Information on the main destination and mode of transport for domestic overnight tourists is provided in Table 14. The results indicated that in 2010 and 2011, about 70,0% of overnight trips destined for the Western Cape were taken by cars. Trips made by aircraft increased from 8,0% in 2010 to 11,8% in 2011. Over a period of two years i.e. 2010 and 2011, there was an upward trend of tourists that used cars in the Eastern Cape (from 37,1% to 39,7%), Northern Cape (from 52,8% to 60,5%), Free State (from 45,1% to 48,3%), KwaZulu-Natal (from 42,9% to 45,3%) and Gauteng (from 33,8% to 38,7%). The use of taxis when travelling to the Free State increased from 41,0% in 2010 to 42,0% in 2011, followed by North West increasing from 37,3% in 2010 to 39,2% in 2011, and Mpumalanga increased from 43,8% in 2010 to 47,7% in 2011. The use of taxis whilst visiting Limpopo remained stable at 46,0%.
Statistics South Africa P0352.1
Domestic Tourism Survey, January to December 2011
25 Figure 12: Main destination by mode of transport for domestic overnight trips (per cent), 2011
Note: The category other includes 'Motorcycle; bicycle; walking and using mule/donkey/horse carts and other modes of transport’. Figure 12 gives information on the main destination and mode of transport for domestic overnight trips taken by tourists. The results show that when trips were made to Western Cape, tourists were most likely to use cars (70,2%); aircraft (11,8%), taxis (7,3%) and buses (7,0%). Tourists that travelled to Gauteng used mostly taxis (39,7%), cars (38,7%), buses (14,1%) and air transport (3,7%). Of those who visited Limpopo, 45,6% used taxis, 32,9% used cars and 19,7% used buses. The mode of transport used by most of the tourists to KwaZulu-Natal was predominantly taxis (41,6%), followed by cars (45,3%) and buses (6,5%). The use of aircraft as a mode of transport for overnight trips, was more prevalent when the tourists were travelling to Western Cape (11,8%); KwaZulu-Natal (4,4%) and Gauteng (3,7%).
3.9 Main destination and length of stay for domestic overnight trips Establishing how long people stay at a particular destination may be of importance to planners of tourism-related products. Table 15 provides a summary of this information.
Table 15: Main destination by length of stay for domestic overnight trips (per cent), 2011
26 While the most number of overnight trips, by domestic tourists, taken in South Africa in 2011 was estimated to be almost 11,2 million, about half of the overnight trips lasted at most three nights. About 27,7% of tourists stayed between four to seven nights, and only 4,0% stayed 22 nights or longer at their chosen destinations. The highest percentage of tourists who stayed at most three nights occurred in North West (63,0%), while almost a quarter of tourists to that province spent between four and seven nights. The percentage of tourists who spent at least 22 nights was the highest in Gauteng (8,2%) followed by Eastern Cape (5,0%) and Limpopo (4,0%).
3.10 Main destination and type of accommodation for domestic overnight trips Certain destinations may be associated with particular types of accommodation. For example, a group of people may travel to a province for a holiday and eventually stay with their family and relatives. Table 16a and 16b provide some information about this phenomenon.
Table 16a: Main destination by principal type of accommodation for domestic overnight trips (per cent), 2011
Destination Hot
el
Gue
st h
ouse
/ gu
est f
arm
Bed
and
bre
akfa
st
Lodg
e
Hos
tel/
back
pack
ers
Self-
cate
ring
esta
blis
hmen
t
Stay
ed w
ith fr
iend
s an
d/or
rela
tives
H
olid
ay
hom
e/se
cond
ho
me
Cam
psite
Car
avan
par
k
Oth
er
Tota
l
Western Cape 6,7 3,5 5,2 1,2 0,9 13,9 50,6 5,8 6,3 2,7 3,2 100,0Eastern Cape 2,9 2,1 2,9 0,7 0,3 3,4 77,6 4,3 0,6 0,1 5,1 100,0Northern Cape 1,7 2,7 0,2 0,4 0,1 1,2 85,9 1,4 1,8 0,7 3,9 100,0Free State 1,9 2,3 1,4 2,1 0,2 2,0 80,8 2,0 1,2 0,6 5,6 100,0KwaZulu-Natal 7,1 2,4 1,8 1,5 0,6 10,1 65,6 2,5 2,3 0,6 5,5 100,0North West 4,1 1,4 0,9 2,0 0,2 3,5 72,7 4,7 2,8 1,9 5,8 100,0Gauteng 5,9 1,3 0,4 1,5 0,2 1,8 80,8 0,8 0,9 1,1 5,3 100,0Mpumalanga 3,8 1,9 0,6 3,6 0,2 5,5 73,4 4,0 1,0 1,1 4,8 100,0Limpopo 0,8 0,7 0,3 2,0 0,5 1,6 74,8 1,8 3,9 1,6 11,9 100,0RSA 4,5 1,9 1,6 1,7 0,4 5,5 71,8 3,0 2,4 1,2 6,0 100,0Unspecified was excluded from the denominator when calculating percentages Close to seventy-two per cent (71,8%) of domestic tourists who spent nights in any South African province stayed with friends or family. More domestic tourists stayed at self-catering establishments (5,5%) than at hotels (4,5%) between January to December 2011. More than two per cent stayed at Campsites (2,4%), Guest houses (1,9%), Lodges (1,7%) and Bed and breakfast (1,6%). At least 8 out of 10 tourists who visited Northern Cape (85,9%), Gauteng (80,8%) and Free State (80,8%) stayed with friends or relatives. Only half of tourists who travelled to Western Cape (50,6%) used that type of accommodation. The results further showed that individuals that over 70,0% of individuals who visited Eastern Cape (77,6%), Limpopo (74,8%), Mpumalanga (73,4%) and North West (72,7%) stayed with friends or relatives. Of those who visited KwaZulu-Natal, 65,6% stayed with friends or relatives, 10,1% at self-catering establishments and 7,1% stayed at hotels
Statistics South Africa P0352.1
Domestic Tourism Survey, January to December 2011
27
Table 16b: Principal type of accommodation by main destination for domestic overnight trips (per cent), 2011
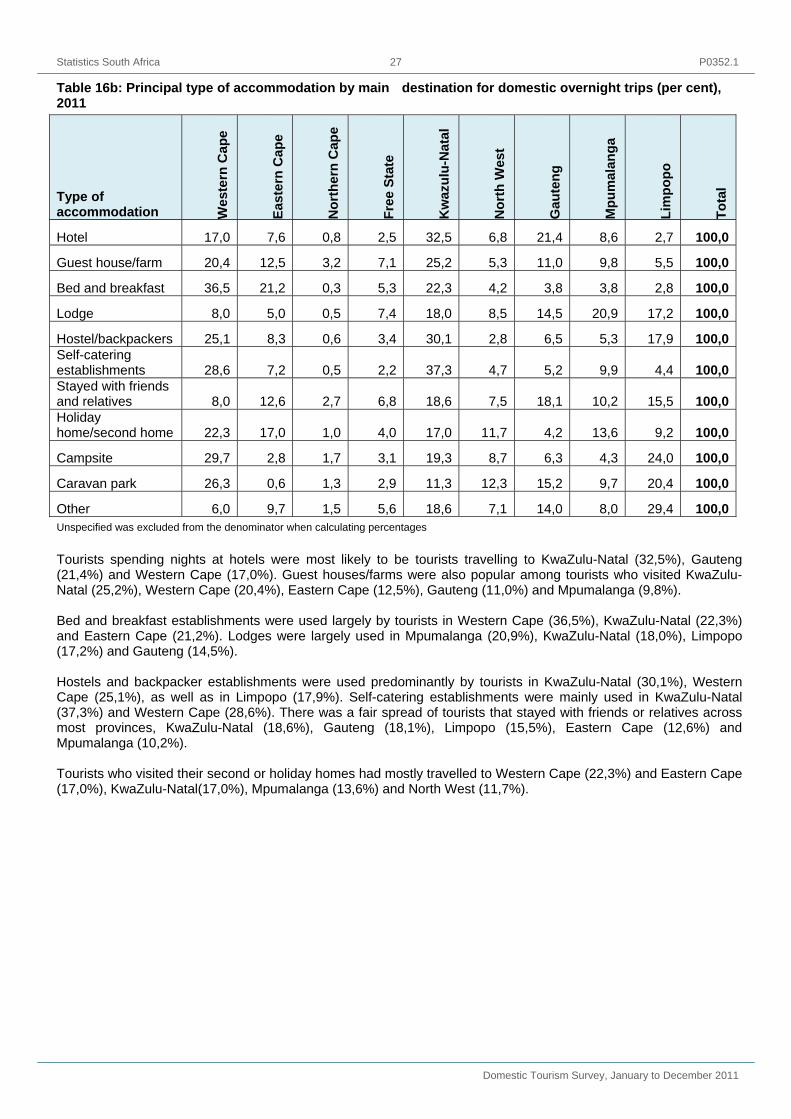
Other 6,0 9,7 1,5 5,6 18,6 7,1 14,0 8,0 29,4 100,0Unspecified was excluded from the denominator when calculating percentages Tourists spending nights at hotels were most likely to be tourists travelling to KwaZulu-Natal (32,5%), Gauteng (21,4%) and Western Cape (17,0%). Guest houses/farms were also popular among tourists who visited KwaZulu-Natal (25,2%), Western Cape (20,4%), Eastern Cape (12,5%), Gauteng (11,0%) and Mpumalanga (9,8%). Bed and breakfast establishments were used largely by tourists in Western Cape (36,5%), KwaZulu-Natal (22,3%) and Eastern Cape (21,2%). Lodges were largely used in Mpumalanga (20,9%), KwaZulu-Natal (18,0%), Limpopo (17,2%) and Gauteng (14,5%). Hostels and backpacker establishments were used predominantly by tourists in KwaZulu-Natal (30,1%), Western Cape (25,1%), as well as in Limpopo (17,9%). Self-catering establishments were mainly used in KwaZulu-Natal (37,3%) and Western Cape (28,6%). There was a fair spread of tourists that stayed with friends or relatives across most provinces, KwaZulu-Natal (18,6%), Gauteng (18,1%), Limpopo (15,5%), Eastern Cape (12,6%) and Mpumalanga (10,2%). Tourists who visited their second or holiday homes had mostly travelled to Western Cape (22,3%) and Eastern Cape (17,0%), KwaZulu-Natal(17,0%), Mpumalanga (13,6%) and North West (11,7%).
Statistics South Africa P0352.1
Domestic Tourism Survey, January to December 2011
28
3.11 Main purpose of trip and length of stay
Table 17 provides information on the main purpose of trip and length of stay for domestic overnight tourists.
Table 17: Main purpose of trip by length of stay for domestic overnight trips (per cent), 2011
Destination
Per cent Average
stay (number
of nights)
Quartiles of number of nights stayed
1–3 nights
4–7 nights
8–14 nights
15–21 nights
22+ nights Total
Lower quartile Median
Upper quartile
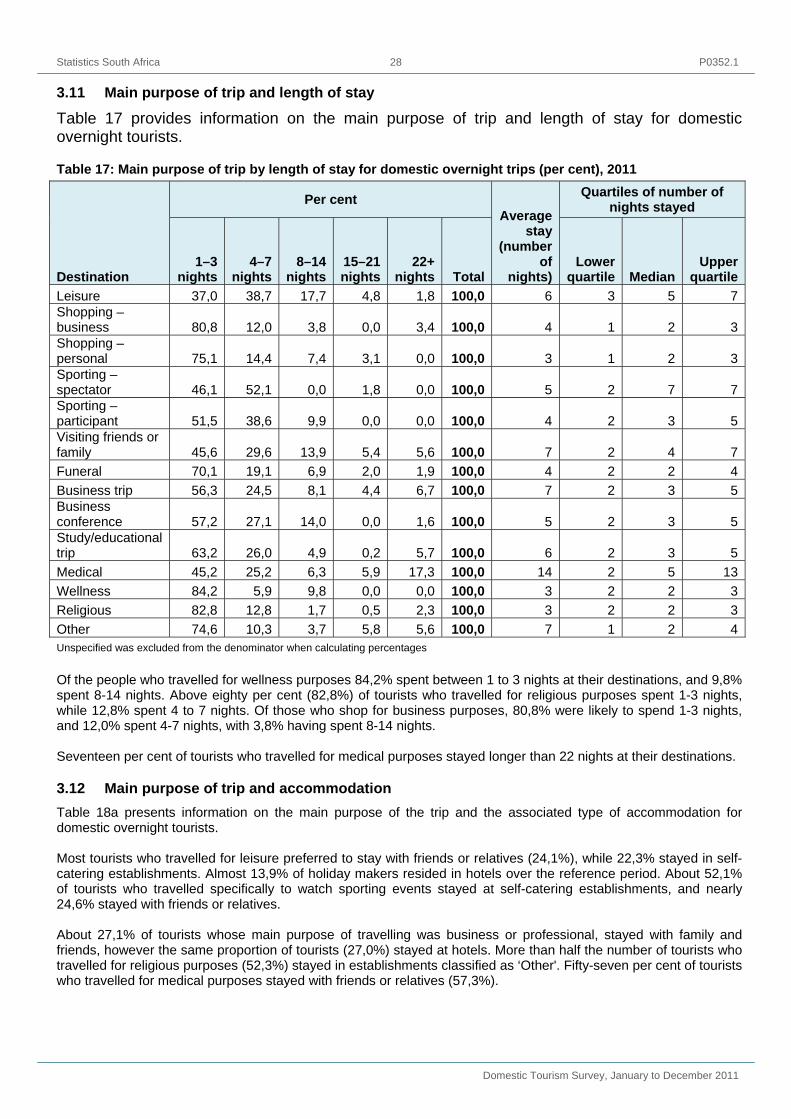
Leisure 37,0 38,7 17,7 4,8 1,8 100,0 6 3 5 7Shopping – business 80,8 12,0 3,8 0,0 3,4 100,0 4 1 2 3Shopping – personal 75,1 14,4 7,4 3,1 0,0 100,0 3 1 2 3Sporting – spectator 46,1 52,1 0,0 1,8 0,0 100,0 5 2 7 7Sporting – participant 51,5 38,6 9,9 0,0 0,0 100,0 4 2 3 5Visiting friends or family 45,6 29,6 13,9 5,4 5,6 100,0 7 2 4 7Funeral 70,1 19,1 6,9 2,0 1,9 100,0 4 2 2 4Business trip 56,3 24,5 8,1 4,4 6,7 100,0 7 2 3 5Business conference 57,2 27,1 14,0 0,0 1,6 100,0 5 2 3 5Study/educational trip 63,2 26,0 4,9 0,2 5,7 100,0 6 2 3 5Medical 45,2 25,2 6,3 5,9 17,3 100,0 14 2 5 13Wellness 84,2 5,9 9,8 0,0 0,0 100,0 3 2 2 3Religious 82,8 12,8 1,7 0,5 2,3 100,0 3 2 2 3Other 74,6 10,3 3,7 5,8 5,6 100,0 7 1 2 4Unspecified was excluded from the denominator when calculating percentages Of the people who travelled for wellness purposes 84,2% spent between 1 to 3 nights at their destinations, and 9,8% spent 8-14 nights. Above eighty per cent (82,8%) of tourists who travelled for religious purposes spent 1-3 nights, while 12,8% spent 4 to 7 nights. Of those who shop for business purposes, 80,8% were likely to spend 1-3 nights, and 12,0% spent 4-7 nights, with 3,8% having spent 8-14 nights. Seventeen per cent of tourists who travelled for medical purposes stayed longer than 22 nights at their destinations.
3.12 Main purpose of trip and accommodation Table 18a presents information on the main purpose of the trip and the associated type of accommodation for domestic overnight tourists. Most tourists who travelled for leisure preferred to stay with friends or relatives (24,1%), while 22,3% stayed in self-catering establishments. Almost 13,9% of holiday makers resided in hotels over the reference period. About 52,1% of tourists who travelled specifically to watch sporting events stayed at self-catering establishments, and nearly 24,6% stayed with friends or relatives. About 27,1% of tourists whose main purpose of travelling was business or professional, stayed with family and friends, however the same proportion of tourists (27,0%) stayed at hotels. More than half the number of tourists who travelled for religious purposes (52,3%) stayed in establishments classified as ‘Other'. Fifty-seven per cent of tourists who travelled for medical purposes stayed with friends or relatives (57,3%).
Statistics South Africa P0352.1
Domestic Tourism Survey, January to December 2011
29 Table 18a: Main purpose of trip by principal type of accommodation for domestic overnight trips (per cent), 2011
3.13 Booking patterns Table 19 provides information on the booking patterns of domestic overnight tourists in three categories: how the trip was booked, the method used to book the trips and the booking lead period.
Table 19: Booking patterns by main purpose of trip for domestic overnight trips (per cent), 2011
Booking patterns L
eisu
re
Sho
ppin
g –b
usin
ess
Sho
ppin
g –
pers
onal
Spo
rtin
g –
spec
tato
r
Spo
rtin
g –
p
artic
ipan
t
Vis
it f
riend
s/re
lativ
es
Fun
eral
Bus
ines
s tr
ip
Bus
ines
s c
onfe
renc
e
Stu
dy
Med
ical
Wel
lnes
s
Rel
igio
us
Oth
er
How trip booked Tour operator 0,6 1,4 0,0 0,0 0,0 0,2 0,0 2,6 8,0 6,4 0,0 0,0 0,4 0,0
Total 100,0 100,0 100,0 100,0 100,0 100,0 100,0 100,0 100,0 100,0 100,0 0,0 100,0 100,0 Unspecified was excluded from the denominator when calculating percentages
Figure 13: Booking patterns by main purpose of trip for domestic overnight trips (how the trip was booked) (per cent), 2011
Statistics South Africa P0352.1
Domestic Tourism Survey, January to December 2011
31 Various methods were used to book for the overnight trips whenever bookings were necessary for the trip. The tourists might have made the bookings by themselves or used agents such as tour operators who generally provided package trips for clients. South African households are self-reliant when it comes to booking their leisure/vacation or holiday trips with the majority indicating that no booking was necessary (48,8%) and 46,4% indicating that they booked the trip independently. It can be noted that even for business or professional trips most tourists did not make bookings (53,8%). Some of the business trips were booked through travel agents (23,8%) while 19,8% were booked independently. For almost all the trips to visit friends and family/relatives, no booking was necessary (97,2%). Similarly, no booking was necessary when the purpose of the trip was to attend funerals (98,8%).
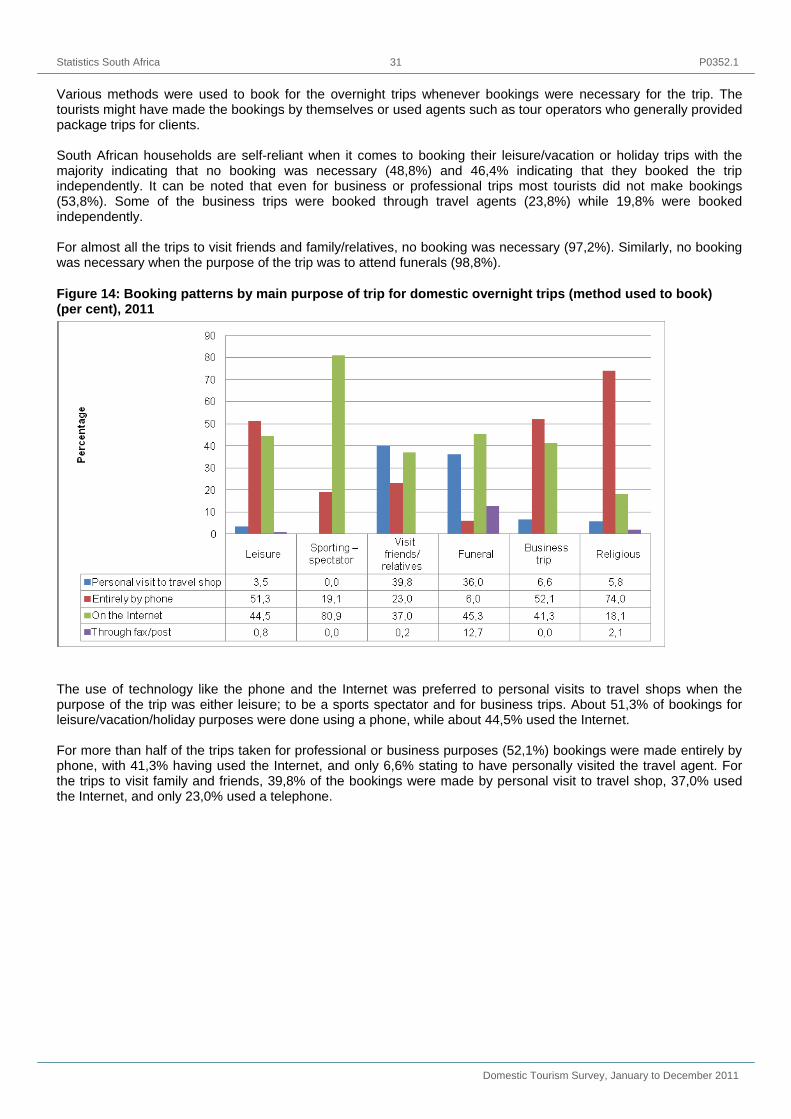
Figure 14: Booking patterns by main purpose of trip for domestic overnight trips (method used to book) (per cent), 2011
The use of technology like the phone and the Internet was preferred to personal visits to travel shops when the purpose of the trip was either leisure; to be a sports spectator and for business trips. About 51,3% of bookings for leisure/vacation/holiday purposes were done using a phone, while about 44,5% used the Internet. For more than half of the trips taken for professional or business purposes (52,1%) bookings were made entirely by phone, with 41,3% having used the Internet, and only 6,6% stating to have personally visited the travel agent. For the trips to visit family and friends, 39,8% of the bookings were made by personal visit to travel shop, 37,0% used the Internet, and only 23,0% used a telephone.
Statistics South Africa P0352.1
Domestic Tourism Survey, January to December 2011
32 Figure 15: Booking patterns by main purpose of trip for domestic overnight trips (booking lead period) (per cent), 2011
The booking lead period (how long before the trip the booking was made) for leisure/vacation/holiday purposes was two months or less in advance for most of the trips (78,7%). Specifically, 17,2% of the trips were booked at least a month in advance, with 16,4% of the trips booked less than two weeks before the trips. Almost sixteen per cent (15,6%) of the overnight trips taken to watch a sporting event were booked 3 months or more in advance in 2011, and 31,3% were booked two months in advance, whereas only 4,3% were booked less than two weeks before the sporting event was to take place. For attending a funeral, the booking lead period was less than two weeks. Almost 42,0% of religious trips, where bookings were made, were made less than 2 weeks in advance.
3.14 Expenditure by main destination and type of spending One of the objectives of the DTS is to establish expenditure patterns associated with certain types of trips. This information is presented in Table 20. For analysis purposes, the following are included under the grouping 'Other': travel insurance, other financial services, checking/servicing alarm system, hiring house-sitter, hiring security, and medical expenditure. The domestic transport category includes airfare, parking, land transport (fuel, taxi, bus/train tickets, car hire and toll fees). Table 20 gives information about the expenditure incurred on the most recent person trip taken by the tourist per province of destination for day and overnight trips. Estimated total spending on the most recent day trip was R3,9 billion and R14 billion for overnight trips. Of the R3,9 billion total day trip expenditure, travellers whose destination was Gauteng (R1 billion) seemed to have spent the most money with regard to the trips. The least expenditure was recorded for Northern Cape (R131 million), which is consistent with the finding that it was the least visited province in the country. Of the R1 billion spent in Gauteng, R582 million was spent on shopping, and about R252 million was spent on transport. A further R147 million was spent on food and beverages. Most tourists spent close to half a billion when their trips were destined to KwaZulu-Natal (R466 million) and Limpopo (R458 million). Expectedly, shopping accounted for over R2 billion of the total expenditure incurred by day travellers in 2011. The highest total expenditure on overnight trips by destination occurred in KwaZulu-Natal and Western Cape, with R3,4 billion and R2,5 million respectively. Shopping (R4,4 billion) and domestic transport (R4,3 billion) contributed the largest share of the total expenditure. Less expenditure was incurred on recreation and culture (R345 million). Expenditure on recreation and culture was highest in KwaZulu-Natal and the Western Cape, with an estimated R108 million and R70 million spent respectively.
Statistics South Africa P0352.1
Domestic Tourism Survey, January to December 2011
33 Table 20: Expenditure by main destination and type of spending for the most recent domestic day and overnight person trips (R’000), 2011
Totals include unspecified Expenditure by main purpose of trip and type of spending As shown by Table 21, domestic day trips undertaken for personal shopping reasons contributed roughly 40,0% of the total expenditure incurred over the reference period. Expenditure incurred as a result of visiting friends or family was the second highest expenditure incurred by day travellers (R653 million), surpassing the expenditure incurred on leisure travels, which was recorded at R584 million for the reference period (January to December 2011). South African day travellers, travelling to watch a sporting event spent slightly above R30 million in 2011, while those who travelled for medical purposes spent close to R99 million, while religious-purpose travellers spent roughly R56 million in the reference period. Over R5,9 billion was spent by tourists travelling for leisure purposes, with a further R5,1 billion having been spent by domestic tourists visiting friends and family. The next highest expenditure recorded was for people travelling to attend funerals, which was at R778 million, followed by individuals who took educational trips (R624 million). Just over R429 million was spent by individuals travelling for religious purposes in 2011, tourists further spent roughly R146 million for medical reasons, while over R211 million was spent by South Africans travelling for a sporting event, as participants.
Statistics South Africa P0352.1
Domestic Tourism Survey, January to December 2011
34 Table 21: Expenditure by main purpose of trip and type of spending for the most recent domestic day and overnight person trips (R ’000), 2011
Main purpose Accommodation Food and beverage
Domestic transport Recreation Shopping Other Total
35 Table 22: Expenditure by main purpose of trip and type of spending for the most recent domestic day and overnight person trips (R ’000) by population group of travellers, 2011
Totals include unspecified The estimated total expenditure on day trips in 2011 was R3,9 billion and R14 billion for overnight trips. Of the R3,9 billion total day trip expenditure, black African (R2,8 billion) and white (R731 million) population group together contributed almost 80,0% to the total day trip expenditure. Over R1,7 billion was spent by the black African group on shopping, and about R635 million was spent on domestic transport. This group further spent R316 million on food and beverages. The Indian/ Asian population group spent the least amount on day trips, only R88 million compared to other population groups. Around R7 billion was spent by the black African population group on overnight trips, the white population group spent roughly 4,9 billion, while the coloured population group spent over R1,1 billion. The black African population group spent most of their money on shopping (R2,7 billion), followed by expenditure on domestic transport (R2,4 billion), then on food and beverages (R1,1 billion), while accommodation (R565 million) was the expenditure item that this group spent the fourth highest amount on. The white population group spent the highest amount on domestic transport (R1,4 billion), and the second highest amount was spent on accommodation (R1,1 billion), shopping (R1,1 billion), as well as on food and beverages (R1 billion). The coloured population group spent money mostly on domestic transport (R316 million), followed by expenditure on shopping (R292 million), and about R214 million was spent by this group on food and beverages.
Statistics South Africa P0352.1
Domestic Tourism Survey, January to December 2011
36
4. Barriers to taking trips Table 23 and Figure 16a show the number of respondents who indicated that they had not taken any trips during the reference period. Information was gathered on reasons as to why neither day nor overnight trips were taken in the twelve months between January 2011 and December 2011.
Table 23: Reasons for respondents not taking day trips in the past twelve months, 2010–2011
Reason for not taking trips
Day trips
2010 2011 Number
(’000)Per
cent Number
‘’000) Per
centTrips within 40-km radius/family relatives stay within 17 038 49,9 17 214 47,2Financial reasons/ not enough money 8 221 24,1 9 376 25,7Too expensive/I would rather spend money on something else 366 1,1 887 2,4Not enough time to travel 950 2,8 991 2,7Too busy at work/school 2 126 6,2 2 160 5,9No family/ friends to visit somewhere else 798 2,3 797 2,2Too much hassle to travel 135 0,4 166 0,5Sick 436 1,3 509 1,4Disabled 80 0,2 77 0,2Too old to travel 527 1,5 700 1,9Worried about safety/security/crime 135 0,4 138 0,4Have young children 445 1,3 452 1,2I no longer wish to travel 118 0,3 187 0,5No interest/nothing to see or do that appeals to me 272 0,8 286 0,8Taking care of sick/elderly relative 196 0,6 232 0,6No particular reason 1 971 5,8 2 048 5,6Other 352 1,0 246 0,7Subtotal 34 165 100,0 36 466 100,0Unspecified 8 626 20,2 7 708 17,4Total 42 790 - 44 174 -
Unspecified was excluded from the denominator when calculating percentages. Almost 50,0% in 2010 and 47,2% in 2011 of South African households responded that they travelled within the 40-kilometre (km) radius of their usual environment, which does not qualify as a day trip according to the concepts and definitions of this survey. In 2010 about 24,1% of individuals did not travel because of financial reasons, which increased in 2011 to 25,7%. Only 1,1% stated that it was too expensive to take day trips in 2010 and in 2011 about 2,4% mentioned the same reason. Being too busy at work or at school was stated as a reason for not taking a day trip by 6,2% of individuals in 2010. This was similar in 2011 with 5,9%. In 2010, nearly 5,8% responded that they had no particular reason for not taking day trips, this figure decreased slightly to 5,6% in 2011. During 2010 and 2011 about 1,0% said nothing appealed to them to encourage them to travel.
Statistics South Africa P0352.1
Domestic Tourism Survey, January to December 2011
37 Figure 16a: Reasons for respondents not taking day trips during the reference period (per cent), 2010–2011
Table 24: Reasons for respondents not taking overnight trips in the past twelve months, 2010–2011
Reason for not taking trips
Overnight trips
2010 2011 Number
(’000)Per
cent Number
(’000) Per
centTrips within 40-km radius/family relatives stay within 9 827 36,8 9 923 33,1Financial reasons 8 046 30,1 9 897 33,0Too expensive/I would rather spend money on something else 561 2,1 1 051 3,5Not enough time to travel 779 2,9 860 2,9Too busy at work/school 1 293 4,8 1 669 5,6No family/ friends to visit somewhere else 871 3,3 771 2,6Too much hassle to travel 115 0,4 153 0,5Sick 432 1,6 515 1,7Disabled 77 0,3 66 0,2Too old to travel 497 1,9 651 2,2Worried about safety/security/crime 403 1,5 392 1,3Have young children 544 2,0 613 2,0I no longer wish to travel 163 0,6 191 0,6No interest/nothing to see or do that appeals to me 262 1,0 345 1,1Taking care of sick/elderly relative 254 1,0 354 1,2No particular reason 1 375 5,2 1 455 4,8Do not like sleeping in other places 632 2,4 615 2,0Other 558 2,1 486 1,6Subtotal 26 689 100,0 30 010 100,0Unspecified 11 366 29,9 9 689 24,4Total 38 055 - 39 699 -
Statistics South Africa P0352.1
Domestic Tourism Survey, January to December 2011
38 As far as overnight trips were concerned, in 2010, 36,8% travelled within the 40-km radius of their usual environment. This decreased to 33,1% in 2011. While in 2010, slightly less than a third of individuals did not take overnight trips due to financial reasons, there was a 3 percentage point increase in 2011 to 33,0% of individuals who cited the same reason. About 5,2% responded that there was no particular reason for not having taken such trips in 2010 as compared to 4,8% in 2011. Similarly in 2010, 4,8% indicated that they were too busy at work or school to travel and the very same reasons were given by about 5,6% in 2011. Almost 1,5% of potential tourists stated that they were worried about their safety or crime and that decreased to 1,3% in 2011. Not having enough time to travel was stated as a reason for not taking overnight trips by 2,9% in both 2010 and 2011. Figure 16b: Reasons for respondents not taking overnight trips during the reference period (per cent), 2010–2011
Statistics South Africa P0352.1
Domestic Tourism Survey, January to December 2011
39 5. Living Standards Measure (LSM) The South African Audience Reference Foundation (SAARF) Living Standards Measure (LSM) is widely used in the marketing and advertising industry and has been used by South African Tourism (SAT) for a number of years as a proxy for living standards. The LSM is segmented into 10 groups with a LSM of 10 (highest) and 1 (lowest). These are quite often grouped together into subgroups that roughly represent the low income group (LSM 1–4), middle income group (LSM 5–7) and high income group (8–10).
Figure 17: Most recent person day trips by province of destination and living standard measure (SAARF LSM)
In terms of province of destination there is a very clear pattern along LSM lines. With the exception of Gauteng (14,7%) which also boasts a relatively high day trip visitors count, migrant sending provinces such as Limpopo (24,0%), Eastern Cape (20,4%) and KwaZulu-Natal (16,8%) are the primary recipients of day trip trip visitors from the LSM categories 1–4. This LSM group’s preferred destination for overnight trips is similar to that for day trips with KwaZulu Natal (22,8%) as the most visited province, followed by Limpopo (20,6%), Gauteng (16,5%) and Eastern Cape (14,3%). Most day visitors from LSM 8–10 go to Gauteng (28,1%), Western Cape (19,7%), North West (12,0%) and KwaZulu-Natal (10,5%). Tourists from this category primarily visit Western Cape (23,5%), KwaZulu-Natal (23,3%) and Gauteng (14,8%).
Figure 18: Most recent person overnight trips by province of destination and living standard measure (SAARF LSM)
Statistics South Africa P0352.1
Domestic Tourism Survey, January to December 2011
40 All LSM groups strongly feature visiting friends and relatives as the main purpose of their day trips, but the LSM category 5–7 is the only one where it is the most popular (27,3%) reason. Amongst the LSM 1–4 group, shopping for personal use (36,1%) dominates, whilst those in LSM 8–10 group undertake day trips primarily for leisure and vacation (33%).
Figure 19: Most recent person day trips by main purpose and living standard measure (SAARF LSM)
For overnight trips, shopping has a less prominent role than during day trips, with visiting friends and relatives the most popular purpose amongst LSM 1–4 (61,4%) and LSM 5–7 (56,4%). Even though this is also a popular reason for the LSM group 8–10 (37,2%) this group primarily undertakes overnight trips for leisure and vacation (46,4%). Overnight trips for funerals and religious purposes also play an important role in the LSM groups 1–4 and 5–7.
Figure 20: Most recent person overnight trips by main purpose and living standard measure (SAARF LSM)
Day trip travellers from the LSM group 1-4 were the most likely to use taxis (67,0%), whilst the LSM 5-7 were more likely to travel with a car (44,0%) and taxi (42,2%). Travellers from LSM 8-10 almost exclusively make use of cars (93,5%) as the preferred mode of transport during their day trips.
Statistics South Africa P0352.1
Domestic Tourism Survey, January to December 2011
41 Figure 21: Mode of transport used to undertake day trips and living standard measure (SAARF LSM)
The patterns for mode of transport were similar for overnight trips albeit with a shift for the middle income group of LSM 5-7 to taxis as the most popular mode (48,9%) and a reduction in the use of a car (32,9%). In the LSM category 8-10, the popularity of car as transport for overnight trips is slightly reduced (84,5%) in favour of air transport (8,1%).
Figure 22: Mode of transport used to undertake overnight trips and living standard measure (SAARF LSM)
Statistics South Africa P0352.1
Domestic Tourism Survey, January to December 2011
42 6. Summary An estimated number of most recent person day trips decreased from 7,6 million in 2010 to 6,7 million in 2011. There was also a decline in the number of most recent person overnight trips from 12,4 million in 2010 to 11,2 million in 2011. Day travellers who have never been married were more likely to travel than individuals in other marital status groups (47,4% in 2010 and 49,0% in 2011). Individuals between the ages of 25 and 44 years took almost the same number of overnight trips in 2010 (37,1%) and 2011 (36,7%). The results show that females undertook day and overnight trips more than males in both 2010 and 2011. Visiting friends and family/relatives (VFR) was the main reason that contributed 28,5% of day trips in 2010 and 29,9% in 2011 while overnight trips accounted for 48,2% in 2010 and 52,7% in 2011 of the total trips undertaken. The second main reason stated for day trips was shopping for personal use (24,0% in 2010 and 25,15% in 2011); while for overnight trips it was leisure/vacation/holidays (22,2% in 2010 and 20,8% in 2011). KwaZulu-Natal was the most popular destination when it came to overnight trips, with nearly (20,8% in 2010 and 20,3% in 2011) of the total overnight trips undertaken. Gauteng was the most visited province for day trips (23,9% in 2010 and 24,9% in 2011). The two most frequently used modes of transport for domestic tourism were cars and taxis; with the use of cars being more dominant – from 44,1% in 2010 to 45,2% in 2011. A slight decrease was observed in the overnight trips made by taxis from 38,9% in 2010 to 38,1% in 2011. Eating out at restaurants and cafes was a very popular activity on both day and overnight trips. In 2010 and 2011, an estimated 36,0% of people ate at restaurants and cafes while they were on day trips and overnight trips. Above 17,0% of day travellers and 20,0% of tourists also engaged in shopping at malls/flea markets. Nearly half of overnight trips lasted between two to four nights. The type of accommodation most likely to be used for overnights trips was staying with friends and relatives. Pali Lehohla Statistician-General
joeyb
Stamp
Statistics South Africa P0352.1
Domestic Tourism Survey, January to December 2011
43 7. Technical notes
7.1 Response details The response rate of the survey was 93,87%, with the lowest response rate recorded in Gauteng (81,19%) and the highest in KwaZulu-Natal (99,07%).
Table 25: Response rates by province, DTS 2012
Province Per cent Western Cape 93,49 Eastern Cape 98,34 Northern Cape 94,47 Free State 95,21 KwaZulu-Natal 99,07 North West 96,84 Gauteng 81,19 Mpumalanga 95,62 Limpopo 98,45 South Africa 93,87
7.2 Sample design The sample design for the DTS 2012 was based on a master sample (MS) that was originally designed for the QLFS. This master sample is shared by the Quarterly Labour Force Surveys (QLFS), General Household Survey (GHS), Living Conditions Survey (LCS), Domestic Tourism Survey (DTS), Income and Expenditure Surveys (IES), and Victims of Crime Survey (VOCS). The master sample used a two-stage, stratified design with probability-proportional-to-size (PPS) sampling of PSUs from within strata, and systematic sampling of dwelling units (DUs) from the sampled primary sampling units (PSUs). A self-weighting design at provincial level was used and MS stratification was divided into two levels. Primary stratification was defined by metropolitan and non-metropolitan geographic area type. During secondary stratification, the Census 2001 data were summarised at PSU level. The following variables were used for secondary stratification: household size, education, occupancy status, gender, industry and income. Census enumeration areas (EAs) as delineated for Census 2001 formed the basis of the PSUs. The following additional rules were used:
• Where possible, PSU sizes were kept between 100 and 500 dwelling units (DUs); • EAs with fewer than 25 DUs were excluded; • EAs with between 26 and 99 DUs were pooled to form larger PSUs and the criteria used was 'same
settlement type'; • Virtual splits were applied to large PSUs: 500 to 999 split into two; 1 000 to 1 499 split into three; and 1 500
plus split into four PSUs and; • Informal PSUs were segmented.
A Randomised Probability Proportional to Size (RPPS) systematic sample of PSUs was drawn in each stratum, with the measure of size being the number of households in the PSU. Altogether approximately 3 080 PSUs were selected. In each selected PSU a systematic sample of dwelling units was drawn. The number of DUs selected per PSU varies from PSU to PSU and depends on the Inverse Sampling Ratios (ISR) of each PSU.
Statistics South Africa P0352.1
Domestic Tourism Survey, January to December 2011
44
7.3 Allocating sample sizes to strata1 The randomised PPS systematic sampling method is described below. This procedure was applied independently within each design stratum. Let N be the total number of PSUs in the stratum, and the number of PSUs to be selected from the stratum is
denoted byn . Also, let ix denote the size measure of the PSU iwithin the stratum, where ....,,3,2,1 Ni = Then, the method for selecting the sample of nPSUs with the Randomised PPS systematic sampling method can be described as follows: Step 1: Randomise the PSUs within the stratum
The list of N PSUs within the stratum can be randomised by generating uniform random between 0 and 1, and then by sorting theN PSUs in ascending or descending order of these random numbers. Once the PSUs have been randomised, we can generate permanent sequence numbers for the PSUs.
Step 2: Define normalised measures of size for the PSUs
We denote by ix the measure of size (MOS) of PSU i within the design stratum. Then, the measure of size for
the stratum is given by∑=
=N
iixX
1 . We define the normalised size measure ip of PSU i as
,,3,2,1; NiXxp i
i −−−==where N is the total number of PSUs in the design stratum. Then, ip is the
relative size of the PSU i in the stratum, and 1
1=∑
=
N
iip
for all strata. It should be noted that the value of ipn× , which is the selection probability of PSU i must be less than one.
Step 3: Obtain inverse sampling rates (ISRs)
Let R be the stratum inverse sampling rate (ISR). The stratum ISR is the same as the corresponding provincial ISR because of the proportional allocation within the province. It should also be noted that the proportional allocation within the province also results in a self-weighting design. Then, the PSU inverse sampling rates (ISRs) are obtained as follows:
First, define N real numbers NiRpnZ ii ,,3,2,1; −−−=××= . It is easy to verify that RnZ
N
ii ×=∑
=1 . Next,
round the N real numbers NiZi ...,,3,2,1; = to integer values NiRi ...,,3,2,1; = such that each iR is as
close as possible to the corresponding iZ value and the iR values add up to Rn× within the stratum. In other
words, the sum of the absolute differences between the iR and the corresponding iZ values is minimised
subject to the constraint that the iR values add up to Rn× within the stratum. Drew, Choudhry and Gray (1978)
provide a simple algorithm to obtain the integer iR values as follows:
Let ""d be the difference between the value Rn× and the sum[ ]∑
=
=N
iiZS
1 , where [ ]. is the integer function,
then iR values can be obtained by rounding up the ""d iZ values with the largest fraction parts, and by
rounding down the remaining ( )dN − of them.
1 Source: Sample Selection and Rotation for the Redesigned South African Labour Force Survey by G. Hussain Choudhry, 2007.
Statistics South Africa P0352.1
Domestic Tourism Survey, January to December 2011
45
It should be noted that the integer sizes
NiRi ...,,3,2,1; = are also the PSU inverse sampling rates (ISRs) for systematic sampling of dwelling units. Step 4: Obtain cumulative ISR values
We denote by NiCi ...,,3,2,1; = the cumulative ISRs of the PSUs within the stratum. It should be noted that the PSUs within the stratum have been sorted according to the sequence numbers that were assigned after the randomisation. Then, the cumulative ISRs are defined as follows:
( ) .,,3,2;,
1
11
NjRCCRC
jjj −−−=+==
−
It should be noted that the value NC will be equal to Rn× , which is also the total number of systematic samples of dwelling units that can be selected from the stratum.
Step 5: Generate an integer random number r between 1 and R , and compute n integers nrrr ,,, 21 −−− as follows:
( )
( ) ...
.
.
1
1
23
12
1
Rrr
Rrr
RrrRrr
rr
nn
ii
+=
+=
+=+=
=
−
−
Step 6: Select n PSUs out of the N PSUs in the stratum with the labels (sequence numbers)
number niii .,..,, 21 such that:
...
1
21
11
22
11
nn ini
ii
ii
CrC
CrC
CrC
≤<
≤<
≤<
−
−
−
Then, the n PSUs with the labels niii .,..,, 21 would get selected with probabilities proportional to size, and the
selection probability of the PSU i will be given by RRi
.
Statistics South Africa P0352.1
Domestic Tourism Survey, January to December 2011
46
7.4 Weighting2 The sampling weights for the data collected from the sampled households were constructed so that the responses could be properly expanded to represent the entire civilian population of South Africa. The design weights, which are the inverse sampling rate (ISR) for the province, are assigned to each of the households in a province. These were adjusted for four factors: Informal PSUs, Growth PSUs, Sample Stabilisation, and Non-responding Units. Mid-year population estimates produced by the Demographic Analysis Division were used for benchmarking. The final survey weights were constructed using regression estimation to calibrate to national level population estimates cross-classified by 5-year age groups, gender and race, and provincial population estimates by broad age groups. The 5-year age groups are: 0–4, 5–9, 10–14, 15–19; 20–24; 25–29; 30–34; 35–39; 40–44; 45–49; 50–54; 55–59, 60–64; 65–69; 70–74 and 75 and over. The provincial level age groups are 0–14, 15–34, 35–64; and 65 years and over. The calibrated weights were constructed such that all persons in a household would have the same final weight. The Statistics Canada software StatMx was used for constructing calibration weights. The population controls at national and provincial levels were used for the cells defined by cross-classification of Age by Gender by Race. Records for which the age, population group or sex had item non-response could not be weighted and were therefore excluded from the dataset. No additional imputation was done to retain these records.
7.5 Limitations to the study The DTS 2012 was the fifth round of DTS surveys to be conducted, and had a reference period of January–December 2011 and can be compared to the DTS 2011 which had 12-month reference i.e. period January–December 2010. In terms of comparability with the previous DTS surveys, the following have to be borne in mind: The reference period for DTS 2008 was February to July 2008; for DTS 2009, December 2008 to February 2009, and for DTS 2010 the reference period was December 2009 to May 2010.
7.6 Non-response adjustment In general, editing (i.e. invalid or inconsistent responses) and imputation (i.e. blanks within the questionnaire) was used for item non-response. The eligible households in the sampled dwellings can be divided into two response categories: households and non-households; and weight adjustment is applied to account for the non-respondent household (e.g. refusal, non-contact).
7.7 Benchmarking The population estimates produced by the Demographic Analysis Division were used during the weighting of the DTS as calibration totals. The calibration process was done at national and provincial levels. This process involved the following demographic variables: age, race and gender (i.e. national x race x gender and province x broad age group).
7.8 Estimation The final survey weights are used to obtain the estimates for various domains of interest, e.g. number of domestic overnight trips, respondents, province, purpose of trip by day and overnight trips.
7.9 Editing and imputation All questionnaires were scanned, and the data were sent to the post-capture process for editing and imputation. At each stage of checking, data was edited to ensure consistency. Data editing is concerned with the identification and, if possible, the correction of erroneous or highly suspect survey data. Data was checked for valid range, internal logic and consistency. The focus of the editing process was on clearing skip violations and ensuring that each variable only contains valid values. Very few limits to valid values were set and data were largely released as it was received from the field.
2 Source: Sampling and Weighting System for the Redesigned South African Labour Force Survey, by G. Hussain Choudhry, 2007.
Statistics South Africa P0352.1
Domestic Tourism Survey, January to December 2011
47 When testing for skip violations and doing automated editing the following general rules are applied in cases where one question follows the filter question and the skip is violated:
• If the filter question had a missing value, the filter is allocated the value that corresponds with the subsequent question which had a valid value.
• If the values of the filter question and subsequent question are inconsistent, the filter question’s value is
set to missing and imputed using either the hot-deck or nearest neighbour imputation techniques. The imputed value is then once again tested against the skip rule. If the skip rule remains violated the question subsequent to the filter question is dealt with by either setting it to missing and imputing or if that fails printing a message of edit failure for further investigation, decision-making and manual editing.
In cases where skip violations take place for questions where multiple questions follow the filter question, the rules used are as follows:
• If the filter question has a missing value, the filter is allocated the value that corresponds with the value expected given the completion of the remainder of the question set.
• If the filter question and the values of subsequent questions values were inconsistent, a counter is set to
see what proportion of the subsequent questions have been completed. If more than 50% of the subsequent questions have been completed the filter question’s value is modified to correspond with the fact that the rest of the questions in the set were completed. If less than 50% of the subsequent questions in the set were completed, the value of the filter question is set to missing and imputed using either the hot-deck or nearest neighbour imputation techniques. The imputed value is then once again tested against the skip rule. If the skip rule remains violated the questions in the set that follows the filter question are set to missing.
When dealing with internal inconsistencies as much as possible was done using logical imputation, i.e. information from other questions was compared with the inconsistent information. If other evidence is found to back up either of the two inconsistent viewpoints, the inconsistency is resolved accordingly. If the internal consistency remains, the question subsequent to the filter question is dealt with by either setting it to missing and imputing its value or printing a message of edit failure for further investigation, decision-making and manual editing. Two imputation techniques were used for imputing missing values: hot deck and nearest neighbour. In both cases an already published code was used for imputation. The variable composition of hot decks is based on a combination of the variables used for the Census (where appropriate), an analysis of odds ratios and logistic regression models. Generally, as in the QLFS system, the DTS adds geographic variables such as province, geography type, metro/non-metro, population group, etc. to further refine the decks. This was not done for Census 2001 and it is assumed that the reason for this is the differences in deck size and position for sample surveys as opposed to a multi-million record database. The ‘No’ imputations assume that if the ‘Yes’/’No’ question had to be completed and there is a missing value next to any of the options the response should have been ‘No’. Missing values are therefore converted to the code for ‘No’, namely ‘2’. This is only done if there is some evidence that the questions have been completed. Otherwise all remain missing. For questions for which each option represents a question, no ‘No’ imputations were made.
7.10 Definitions of terms Tourist accommodation Any facility that regularly (or occasionally) provides ‘paid’ or ‘unpaid’ overnight accommodation for tourists. Day trip A trip outside of the respondent’s usual environment, where they leave and return within the same day (i.e., do not stay overnight).
Statistics South Africa P0352.1
Domestic Tourism Survey, January to December 2011
48 Domestic trip A trip within the boundaries of South Africa but outside of the respondent’s usual environment. Note: The following categories are excluded from the definition of domestic visitor:
• Persons travelling to another place within the country with the intention of setting up their usual residence in that place, Persons who travel to another place within the country and are remunerated from within the place visited.
• Persons who travel regularly or frequently between neighbouring localities as defined by the ‘usual
environment’ rule.
Dwelling unit Structure or part of a structure or group of structures occupied or meant to be occupied by one or more than one household. Expenditure The total consumption expenditure made by a visitor or on behalf of a visitor during his/her trip and stay at a destination. Household A group of persons who live together and provide themselves jointly with food and/or other essentials for living, or a single person who lives alone. Household head The main decision-maker, or the person who owns or rents the dwelling, or the person who is the main breadwinner. Acting household head Any member of the household acting on behalf of the head of the household. Main purpose of trip This is the purpose in the absence of which the trip would not have been made. Multiple households Two or more households living in the same dwelling unit. Overnight trip A trip outside of the respondent’s usual environment where one night or more is spent away from the usual environment. Place of usual residence The geographical place where the person resides four nights a week on average. Reference period The period of time (day, week, month, or year) for which information is relevant. Tourism The activities of persons travelling to and staying in places outside their usual environment for not more than one consecutive year for leisure, business and other purposes not related to the exercise of an activity remunerated from within the place visited.
Statistics South Africa P0352.1
Domestic Tourism Survey, January to December 2011
49 Tourist A visitor who stays at least one night in the place visited. Traveller Is any person on a trip between two or more localities in his/her country of residence. Broadly, travellers can include visitors (same-day and overnight) and other travellers such as workers paid in the country visited, migrants, refugees, diplomats and others within the usual environment. Usual environment To be outside the ‘usual environment' the person should travel more than 40 kilometres from his/her place of residence (one way) AND the place should NOT be visited more than once a week. This includes place of work and place of study. Leisure and recreational trips are included irrespective of frequency. Visitor Someone who doesn’t stay permanently with and is not a member of the household.