Strategic Management Journal, Vol. 16, 415-430 (1995) /- / < \- \ DOMINANT DESIGNS AND THE SUR'flV AL OF FIRMS FERNANDO F. SUAREZ Business School of Valparaiso, Adolfo Ibanez University, V'ina del Mar, Chile JAMES M. UlTERBACK Sloan School of Management, Massachusetts Institute of Technology, Cambridge, Massachusetts, U.S.A. \ The economic, population ecology and strategic perspectives on firm survival are here complemented by viewing the same phenomenonfrom the viewpoint of technologyevolution as well. The hypothesis tested is that the competitive environment of an industry, and therefore the survival of firms in it, is substantially affected by the evolution of the technology on which it is based. Survival analysis is applied to data from six industries. The resultsshow that by explicitly including technologyas a dynamic and strategic variable our understanding of firms' survival potential and success can be enhanced. INTRODUCTION The question of why some firms die while others survive is one of the basic concerns of business scholars. Survival or long-term viability has long been recognized as a basic goal for a business organization (Barnard, 1938; Dertouzos, Lester, and Solow, 1989). Survival is, at least in the long term, a prerequisite for success in other terms, such as market share and profitability. The survival of firms has traditionally been studied indirectly through economics researchon industry businesscycles and analysisof declining industries (see, for instance, Lieberman, 1990; and Dunne, Roberts, and Samuelson, 1989). Firm survival has recently been studied more systematically by researchers in strategy and population ecology. Advocates of population ecologyhave argued that life chances of organiza- tions are affected by the population density at time of founding and throughout the life period of an organization. According to this argument, organizations founded during periods of high density have persistently higher age-specific rates of mortality than those founded during periods of low population density (Carroll and Hannan, 1989; Hannan and Freeman, 1988). In other words, a firm entering a crowded field has a lower chance of survival than one entering a less competitive field. Population ecologists have not only studied the effect of density on the risk profile of an organization, but also on the founding rate of new organizations. Currently, this research argues that the effect of density over birth and death of organizations varies over time (Carroll and Swaminathan, 1992). In a related stream of literature, researchers in strat- egy have proposed that a firm's survival is linked to factors such as entry timing (Mitchell, 1991) and financial strength (Willard and Cooper,1985). We argue that the economic, population ecology, and strategyperspectiveson firm survival must be complemented by a body of literature that has studied similar phenomena from the point of view of technology evolution and cycles (Utterback and Abernathy, 1975; Abernathy and Utterback, 1978; Utterback and Suarez, 1993). The hypothesis we intend to test is that the competitive environment of an industry, and Key words: design technology; firm survival; dominant Received20 May 1991 Final revision received 19 September 1994 CCC 0143-2095/95/070415-16 @ 1995 by John Wiley & Sons, Ltd
DOMINANT DESIGNS AND THE SUR'flV AL OFFIRMSFERNANDO F. SUAREZBusiness School of Valparaiso, Adolfo Ibanez University, V'ina del Mar, Chile
JAMES M. UlTERBACKSloan School of Management, Massachusetts Institute of Technology, Cambridge,Massachusetts, U.S.A.
\
The economic, population ecology and strategic perspectives on firm survival are herecomplemented by viewing the same phenomenon from the viewpoint of technology evolutionas well. The hypothesis tested is that the competitive environment of an industry, andtherefore the survival of firms in it, is substantially affected by the evolution of thetechnology on which it is based. Survival analysis is applied to data from six industries.The results show that by explicitly including technology as a dynamic and strategic variableour understanding of firms' survival potential and success can be enhanced.
INTRODUCTION
The question of why some firms die while otherssurvive is one of the basic concerns of businessscholars. Survival or long-term viability has longbeen recognized as a basic goal for a businessorganization (Barnard, 1938; Dertouzos, Lester,and Solow, 1989). Survival is, at least in thelong term, a prerequisite for success in otherterms, such as market share and profitability.
The survival of firms has traditionally beenstudied indirectly through economics research onindustry business cycles and analysis of decliningindustries (see, for instance, Lieberman, 1990;and Dunne, Roberts, and Samuelson, 1989).Firm survival has recently been studied moresystematically by researchers in strategy andpopulation ecology. Advocates of populationecology have argued that life chances of organiza-tions are affected by the population density attime of founding and throughout the life periodof an organization. According to this argument,organizations founded during periods of high
density have persistently higher age-specific ratesof mortality than those founded during periodsof low population density (Carroll and Hannan,1989; Hannan and Freeman, 1988). In otherwords, a firm entering a crowded field has alower chance of survival than one entering a lesscompetitive field. Population ecologists have notonly studied the effect of density on the riskprofile of an organization, but also on thefounding rate of new organizations. Currently,this research argues that the effect of densityover birth and death of organizations varies overtime (Carroll and Swaminathan, 1992). In arelated stream of literature, researchers in strat-egy have proposed that a firm's survival is linkedto factors such as entry timing (Mitchell, 1991)and financial strength (Willard and Cooper,1985).
We argue that the economic, populationecology, and strategy perspectives on firm survivalmust be complemented by a body of literaturethat has studied similar phenomena from thepoint of view of technology evolution and cycles(Utterback and Abernathy, 1975; Abernathy andUtterback, 1978; Utterback and Suarez, 1993).The hypothesis we intend to test is that thecompetitive environment of an industry, and
Key words:design
technology; firm survival; dominant
Received 20 May 1991Final revision received 19 September 1994
CCC 0143-2095/95/070415-16@ 1995 by John Wiley & Sons, Ltd
416 F. F. Suarez and J. M. Utterback
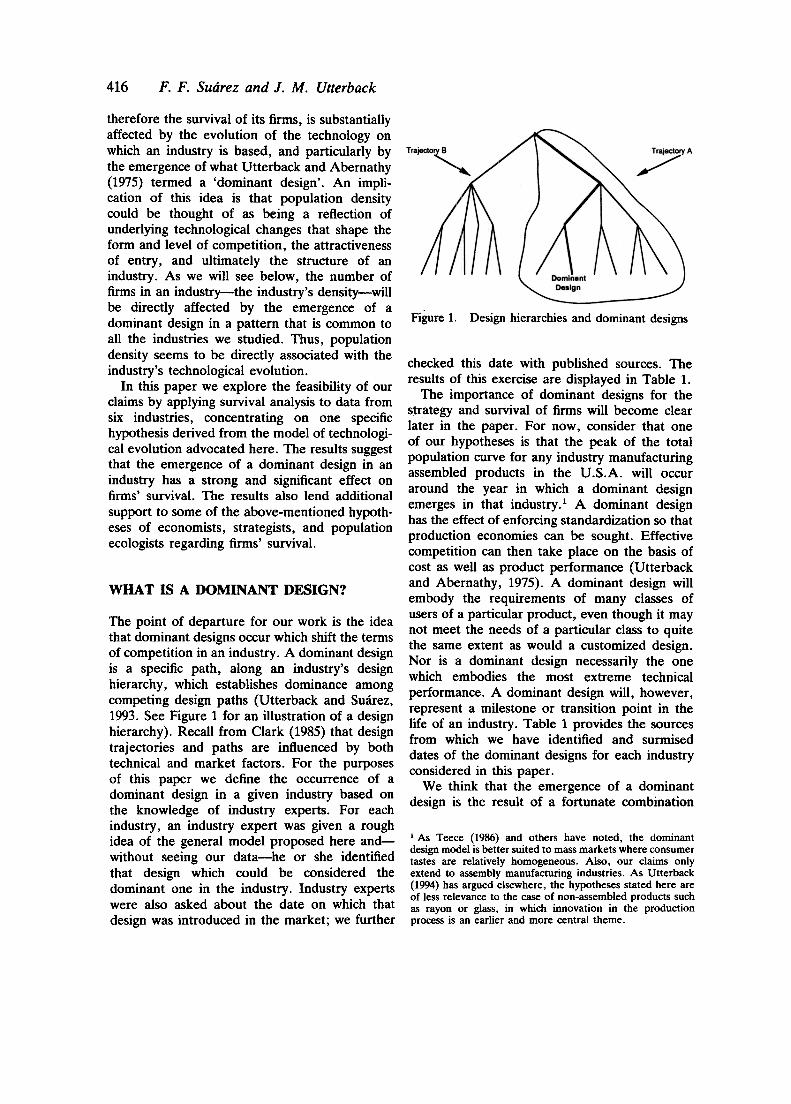
Figure 1 Design hierarchies and dominant designs
therefore the survival of its firms, is substantiallyaffected by the evolution of the technology onwhich an industry is based, and particularly bythe emergence of what Utterback and Abernathy(1975) termed a 'dominant design'. An impli-cation of this idea is that population densitycould be thought of as being a reflection ofunderlying technological changes that shape theform and level of competition, the attractivenessof entry, and ultimately the structure of anindustry. As we will see below, the number offirms in an industry-the industry's density-willbe directly affected by the emergence of adominant design in a pattern that is common toall the industries we studied. Thus, populationdensity seems to be directly associated with theindustry's technological evolution.
In this paper we explore the feasibility of ourclaims by applying survival analysis to data fromsix industries, concentrating on one specifichypothesis derived from the model of technologi-cal evolution advocated here. The results suggestthat the emergence of a dominant design in anindustry has a strong and significant effect onfirms' survival. The results also lend additionalsupport to some of the above-mentioned hypoth-eses of economists, strategists, and populationecologists regarding firms' survival.
WHAT IS A DOMINANT DESIGN?
The point of departure for our work is the ideathat dominant designs occur which shift the termsof competition in an industry. A dominant designis a specific path, along an industry's designhierarchy, which establishes dominance amongcompeting design paths (Utterback and Suarez,1993. See Figure 1 for an illustration of a designhierarchy). Recall from Clark (1985) that designtrajectories and paths are influenced by bothtechnical and market factors. For the purposesof this paper we define the occurrence of adominant design in a given industry based onthe knowledge of industry experts. For eachindustry, an industry expert was given a roughidea of the general model proposed here and-without seeing our data-he or she identifiedthat design which could be considered thedominant one in the industry. Industry expertswere also asked about the date on which thatdesign was introduced in the market; we further
checked this date with published sources. Theresults of this exercise are displayed in Table 1.
The importance of dominant designs for thestrategy and survival of firms will become clearlater in the paper. For now, consider that oneof our hypotheses is that the peak of the totalpopulation curve for any industry manufacturingassembled products in the U.S.A. will occuraround the year in which a dominant designemerges in that industry.! A dominant designhas the effect of enforcing standardization so thatproduction economies can be sought. Effectivecompetition can then take place on the basis ofcost as well as product performance (Utterbackand Abernathy, 1975). A dominant design willembody the requirements of many classes ofusers of a particular product, even though it maynot meet the needs of a particular class to quitethe same extent as would a customized design.Nor is a dominant design necessarily the onewhich embodies the most extreme technicalperformance. A dominant design will, however,represent a milestone or transition point in thelife of an industry. Table 1 provides the sourcesfrom which we have identified and surmiseddates of the dominant designs for each industryconsidered in this paper.
We think that the emergence of a dominantdesign is the result of a fortunate combination
1 As Teece (1986) and others have noted, the dominantdesign model is better suited to mass markets where consumertastes are relatively homogeneous. Also, our claims onlyextend to assembly manufacturing industries. As Utterback(1994) has argued elsewhere, the hypotheses stated here areof less relevance to the case of non-assembled products suchas rayon or glass, in which innovation in the productionprocess is an earlier and more central theme.
The Survival of Firms 417Table 1 A list of dominant designs by industry
Industry Dominant Design Date Source
Typewriter Underwood's Model 5;Hess' innovations
All steel, closed body
1906 Engler (1969)
Automobile 1923
Television 21-inch set; adoption ofRCA's technical standards
Majumdar (1977)Electronic calculator Calculator on a chip 1971
of technological, economic, and organizationalfactors. A dominant design is not always thatdesign which has greatest 'technological sweet-ness'. The notion of dominant design is relatedto the notion of a 'standard' which has receiveda great deal of attention in the literature lately.However, a standard is seen largely as the resultof a battle among different technical alternatives(such as different computer architectures), asopposed to the broader notion we have inmind with the dominant design concept. Whenstandards are defined broadly, such as 'thatwhich is accepted for current use throughauthority, custom or general consent'(Hemenway, 1975), the two concepts come closertogether. In such cases, and by implication, adominant design becomes the industry standardor, for complex assembled products with manyparts, embodies a collection of related standards.The notion of dominant design as industrystandard opens the door for factors other thantechnology to influence the adoption of a givendesign as dominant, in particular:
each of the above factors in important ways.Collateral or cospecialized assets (Teece, 1986)seem to have a two-way relationship with theemergence of a dominant design. On the onehand, a firm in possession of collateral assetssuch as market channels, brand image, andcustomer switching costs will have some advan-tage vis-a-vis its competitors in terms of enforcingits product as the dominant design. The experi-ence of IBM in the personal computer industryis a case in point. On the other hand, the valueof collateral assets to a firm will be greater aftera dominant design is in place. That is, there aremore incentives for a firm to acquire collateralassets after it knows its design has becomedominant. Thus, the opposite relationship mayalso hold: a dominant design will tend to stimulatethe creation or acquisition of collateral assets,which in turn will strengthen its dominance.
Industry regulation often has the power toenforce a standard, and thus define a dominantdesign. For instance, the FCC's approval of theRCA television broadcast standard worked tothe advantage of RCA by establishing its designas dominant for the television industry. The roleof the government in the emergence of adominant design need not be restricted toregulation. Government purchases of a productin the early stages of an industry, for instance,may tilt the balance in favor of the firm or firmsproducing it, and make this product more likelyto become the dominant design of the industry.
1. possession of collateral assets;2. industry regulation and government inter-
vention;3. strategic maneuvering at the finn level;4. existence of bandwagon effects or network
externalities in the industry.
The evolution of technology seems related to
418 F. F. Suarez and J. M. Utterback
effects or 'network externalities' exist in theindustry. Positive network externalities arisewhen a good is more valuable to a user the moreusers adopt the same good or compatible ones(Katz and Shapiro, 1985; Tirole, 1988). Thus, inthe presence of bandwagon effects, volume salesand economies of scale will indeed playa majorrole in the determination of a dominant design.Firms which are able to achieve larger scalemore quickly than their competitors may have abetter chance of winning the race to settle thestandard.2 Moreover, the impact of strategicmaneuvering at the firm level on the determi-nation of the industry's dominant design is greatlyenhanced by the existence of bandwagon effectsin the industry. In the presence of bandwagoneffects, strategic maneuvering is a powerful forcedriving the emergence of a dominant design, asthe case of VCRs described above illustrates.
Given the importance of industry standards tothe fate and prosperity of firms in an industry,government decisions that favor a given designoften tend to be accompanied by a politicalbattle among the firms involved.
At the firm level, and apart from technologyitself, there are also factors that can affect theemergence of a dominant design. The type ofstrategy followed by a firm with respect toits product vif-a-vif that of competitors maydetermine which firm's product becomes domi-nant. This is what Cusumano, Mylonadis, andRosenbloom (1992) have called 'strategic maneu-vering'. Indeed, VCRs are a crisp example ofthe importance of strategy. One of the reasonswhy the VHS system backed by NC swept theVCR industry instead of Sony's Betamax is thedifferent strategies followed by these two firms.While NC followed a 'humble' strategy estab-lishing alliances first in Japan and then in Europeand the U.S.A., Sony stressed reputation anddeliberately avoided alliances or contracts to bean OEM supplier. According to Cusumano,Mylonadis, and Rosenbloom, it was primarilyJVC's strategy, and not technological advantages,initial collateral assets, or government regulationthat finally made VHS the dominant design inthe industry. In fact JVC was a late comer, anduntil the mid-1970s it lagged technologically.
Prior to the appearance of a dominant designeconomies of scale will have little effect, becausea large number of variants of a product will beproduced by the many competing entrants in anindustry, with each producing at a relativelysmall scale. Once a dominant design is created,economies of scale can come into play withpowerful effect, leading to rapid growth ofthose firms which most competently master thedevelopment of products based on the dominantdesign, to the detriment of those firms which areslower to adapt. In general, we think thateconomies of scale are of primary importanceafter a dominant design is in place. In otherwords, traditional microeconomic arguments holdmore weight following the date of a dominantdesign. Our view is that traditional economicassumptions about economies of scale are muchmore appropriate to the period following adominant design than to the period of experimen-tation and creative turbulence which precedes it.
A notable exception to the previous statement isprovided by cases in which significant bandwagon~
HOW DOES A DOMINANT DESIGNOCCUR?
How does technology evolve so that a givendesign becomes the dominant one? Prior to theappearance of a dominant design many of itsseparate features may be tried in varied productswhich are either custom designed or designedfor a particular and demanding market niche.The turbulent competitive process through whichmany firms enter and some leave an industrymay be seen as a process of experimentation,with each product introduction viewed as a newexperiment on user preference (Klein, 1977).Performance dimensions will tend to be manyand highly varied and can often be incommensur-ate prior to the occurrence of a dominant design.As a product evolves certain features will beincorporated, subsuming the related performancedimensions into the design. With the appearanceof the dominant design the product can bedescribed by a few related and commensurabledimensions. A dominant design, then, is synthe-sized from more fragmented technological inno-vations introduced independently in prior pro-
2 Note, though, that a firm can achieve the same result bygiving away most of the production of its product design tothird parties rather than producing it only in-house. Thisinstance of strategic maneuvering was present in the VCRindustry .
The Survival of Firms 419
ducts and tested and often modified by users ofthose prior products.
A few examples may help clarify this idea.Early versions of the typewriter were able toproduce only capital letters. The addition oflower case letters and a shift key was at first aspecialized feature. Numbers and tabulation weresimilarly derived. The earliest typewriters markedon a paper held inside the machine. 'Visibletyping', with the paper in view of the operator,similarly began as an attraction of just a fewmodels. These features were later synthesized inthe Underwood Model 5, which was to becomethe exemplar of the dominant typewriter designin 1906. Who today could imagine typing withoutseeing the text, easily shifting to capital letters,or easily entering numbers and aligning columns?These are no longer serious issues or advertisedas advantages of one or another manufacturer'sproduct. They are subsumed within the dominantdesign established by Underwood. Yet withinrecent memory the Apple II personal computerproduced only 40 columns of capital letters. Theability to use 80 columns, to type in upper andlower case or to add a numeric keypad were allfeatures to be purchased from different vendorsand installed by the proud owner! Users of evenlarge computer systems patiently embeddedcontrol characters in the text of various editingand word-processing programs until the inno-vation of the WYSIWYG (what you see is whatyou get) display at Xerox PARC, later adoptedin the Macintosh, allowed users to easily changetype styles and sizes in a fascinating analogy withvisible typing.
A large number of participants are present ineach industry's history. For instance, a total of121 firms entered the television industry between1939 and the late 1980s. In the calculator industry,our least-populated example, 37 firms enteredbetween 1962 and 1974. We note that our datasets only include American firms.3
As an example, the data for the typewriterindustry are summarized in Figure 2( a) .Thesedata show a pattern typical for each of theindustries studied. A wave of entering firms inthe early stages of the industry's growth isfollowed by a wave of exits (mergers andfailures). The upper line in Figure 2(a) is simplythe sum of entries and exits, and thus shows thetotal number of active firms in the typewriterindustry in any given year. The curve of totalnumber of firms in an industry at any given year(cumulative entry minus exit) is shown in Figure2(b) for all the industries in the sample. Figure2(b) shows that the basic pattern of firmparticipation is quite similar even for industrieswhich begin almost a century apart.
HYPOTHESES AND METHOD
We believe that a firnt's probability of survivingthrough time will be directly affected by a firnt'sentry timing vis-a-vis'the evolution of technologyin the industry. In particular, we hypothesizethat the probability of survival will tend to begreater for firnts entering the industry before theemergence of a dominant design than for firntsentering after it. Moreover, our theory predictsthat the later a firnt enters an industry after thedominant design has emerged, the lower itschances of survival will be. That is, a firntentering the industry x + 1 years after theemergence of the dominant design will tend tohave lower survival chances than a firm enteringx years after the dominant design. A similarargument can be made for the period before theemergence of the dominant design: the earlier afirnt enters the industry vis-a-vis the dominantdesign, the higher its probability of success will
DATA
To test the hypothesis of concern here we willbuild on and expand data presented in Utterbackand Suarez (1993), to analyze the automobile,typewriter, transistor, electronic calculator, tele-vision, and picture tube industries. For eachindustry, a complete list of all participating firmswas made, indicating years of entry and exit foreach firm. The population density of the industryyear by year was computed from these data, aswell as an industry rank of entry timing. Forthose industries where data were available, weincluded industry sales and annual sales growthin the data set.
3 Several of the data on entry and exit dates have been
taken from others' original work: typewriters from Engler(1969), automobiles from Fabris (1966), transistors fromTilton (1971), and calculators from Majumdar (1977). Theauthors gathered data on television sets and picture tubesfrom archival sources.
420 F. F. Suarez and J. M. Utterback
YearsFigure 2(a). Number of firms participating in the typewriter industry in the U.S.A.
~
~ TOTAL0 EXIT.ENTRY
-1-
90
III
EIi:~t1z
be. As we will see below, the reasoning behindour theory's prediction is the relationship betweena dominant design and the rise of barriers toentry in the industry: a dominant design is s~enby our theory as a catalyst for the accumulationof collateral assets and the creation of barriersto entry by a reduced number of firms (thosewhich master the dominant design). After thedominant design emerges, each year is anopportunity for the firms that promote thedominant design to accumulate more collateralassets, exploit possible economies of scale, andraise entry and mobility barriers in the industry.Conversely, the earlier a firm enters the industrybefore the dominant design emerges, the greater
the advantage that firm has. The reason for thisis the fact that, by and large, dominant designsemerge as a process of experimentation betweenthe firm and the users of the product. Enteringearly allows the firm to 'buy' time in order toexperiment with the market and thus increaseits probability of corning up with a dominantdesign.
Thus, the period following the dominant designwill be marked by a wave of exiting firms madeup of both early entrants not able to master allaspects of the technology and those firms unluckyenough to enter following the dominant designas well. The development by incumbents ofcollateral assets and economies of scale (due to
50
45
40
, 35.......300
25
20
3.5
3.0
5 I
oLJ.874 J.891 J.SIO8 1925 1942
The Survival of Firms 421
Specialized processes developed by the earlierentrants will become increasingly importantsources of advantage. Barriers to entry fromexperience effects, or dynamic economics ofscale, and ordinary scale economies will beginto come into play against new entrants. At thesame time established firms challenged by thenew entrants will suffer from various forms ofinertia. For example, firms producing bias-plytires were discouraged from entering the radialtire business both by the fear of cannibalizingtheir own sales and by original equipmentpurchasers whose automotive suspensions weretuned to the older tire design (Denoual, 1980).Similarly, Christensen (1992) argues persuasivelythat established firms failed to master eachsuccessive generation of Winchester disc drivetechnology through being too wedded to existingcustomer demands and not attentive enough tothe emerging demands of manufacturers ofsmaller computers. Henderson and Clark (1990)give a powerful example from the electroniccapital goods sector in which established firmsare hampered by being wedded to the wrongproduct technology.
For cases in which there are strong networkexternalities, we do not expect the abovearguments to apply completely. Langlois (1990)argues that in the case of the IBM personalcomputer, for example, the dominance of astandard increased entry in the industry, sincemakers of clones could enter without the invest-ment needed to ensure adequate software. Forcases in which industry standards may differ fromstandards set based on technical qualities alone,Langlois further argues that the creation of astandard may open up the possibility of newentry by reducing consumer uncertainty. In ourown data the adoption of the RCA broadcaststandard for television presents just such a case,and entry does indeed increase rapidly for abrief period after the adoption of that standard.
Nonassembled products usually violate theassumption that simple and general productionprocesses are readily available. In cases wherespecialized process knowledge is vital for entrywe expect that established firms will be moresuccessful than newcomers. This again followsdirectly from arguments in Utterback and Aber-nathy (1975) who limit the concept of dominantdesign to relatively complex assembled products.Finally, one might speculate that the arguments~
increased production after a dominant design)will represent significant barriers to entry forfirms that venture to enter the industry aftera dominant design. Moreover, strong patentpositions may have been established by earlierentering firms that are difficult for later entrantsto completely circumvent. Our view in thisrespect is clearly consistent with the work ofBurton Klein (1977), who suggests a profoundconnection between industry structure and tech-nological change in his seminal work on dynamiceconomics.
However, an alternative hypotheses to ourswould be that firms entering before a dominantdesign is established will have lower chances forsurvival. While firms entering after a dominantdesign is established face difficulties as lateentrants in overcoming entry barriers, firmsentering before will face a high chance ofchoosing the wrong design. Why do we supposethat firms entering during a period of experimen-tation will do better than those which enter aftera commercially successful design has emerged?What are the circumstances under which earlyentry will be easier, and what are those whichmight augur against our hypothesis?
In brief, and following our reasoning above, wepresume that during a period of experimentationnone of the competitors introducing a newproduct will have important collateral assets.We assume that entry can occur in a small,performance-oriented niche, and therefore therewill be modest or no scale barriers to entry.Simple and general production processes areexpected to be readily available. The net resultof these expectations is that entry will requireonly moderate capital investment, but will requirea high degree of labor skills and flexibility. Inessence the advantages of early entrants will flowfrom their ability to quickly introduce many newproducts or variants and to learn at a rapid ratefrom close connections and feedback from users.These ideas flow directly from Utterback andAbernathy (1975), Abernathy (1978), and Aber-nathy and Utterback (1978). Once a dominantdesign is established there are several factorswhich will make it difficult for a new entrant tosimply imitate that design. Collateral assets suchas market knowledge, distribution networks andreputation which have been developed to somedegree by earlier entrants will take on increasingimportance as the terms of competition shift.~
422 F. F. Suarez and J. M. Utterback
above may not apply to finDS having immensefinancial power and collateral assets such as theJapanese conglomerates or IBM.
The focus of this paper is to try to determinewhether entry prior to or after the emergence ofa dominant design in the industry (and howmuch before or after) affects a firm's survivalprofile. Survival statistics are presented in orderto test the hypothesis that pre-dominant designentry involves lower risk of failure than post-dominant design entry. For each industry, twotypes of analyses were pedormed: nonparametricestimates of survival curves for a populationstratified in two groups, and a more elaborateanalysis adding control variables using Coxregressions (Cox and Oakes, 1984). Basic defi-nitions about the statistics used in this paper arereported below for those readers not familiarwith the techniques.
Survival analysis is a collection of techniquesdeveloped primarily in the field of biostatisticsto address the problem of censored data. Agiven data case is censored when the event understudy (exit from the industry in our case) doesnot occur during the period of study. In thispaper the survival time of a finD is defined asthe total number of (consecutive) years that afirm was active in any industry, i.e. the year ofexit minus the year of entry. The survivalfunction, S(t), is defined as the probability thata firm survives (t) years or longer. The survivalfunction is given as a probability ranging between0 and 1.0 where S(t) = P(T > I). By definitionS(t) = 1 for t = 0, and S(t) = 0 for t = -;therefore survival functions necessarily declineover time as exits occur. The hazard function,h(t), gives the probability that a case willexperience the event (exit from the industry) ina small time interval, given that it has surviveduntil the beginning of that time interval. Thehazard function registers changes in the slope ofthe (log) survivor function (for a more detailedreview see Singer and Willett, 1991, who discussapplications to social sciences. For technicaldetails, see Lee, 1980; or Cox and Oakes, 1984).
1. the survival function of the pre-dommantdesign entrants subgroup will always lie abovethat of the post-dominant design entrants;2. the hazard function of the post-dominantdesign entrants subgroup will lie above that ofthe predominant design entrants, particularlyduring the first years of a firm's existence
4 Our data set at this point is composed of the followingvariables for each industry:
Firm Name of the firmEntry Year of entry to the industryExit Year of exit from the industryTime Number of years that the firm operated in the
industry(one in cases where entry and exit are in thesame year)
Censor 0 when case is right-censored, 1 otherwise(see below)
Pre/Post 0 if firm entered the industry before thedominant design,1 if it entered after the dominant design.NON-PARAMETRIC ANALYSIS OF THE
DATA S We think that the liability of newness argument may holdbetter in pre-dominant design periods, given that entry inthese periods is in general 'less risky' than post-dominantdesign entry. Thus, firm entering an industry before thedominant design will have the hardest time during their first
As an exploratory step, we computed nonpara-metric estimates of the survival distributions in
our data. For each industry in our sample, thepopulation was divided into two groups: thosefirms which entered before the emergence ofthe dominant design, and those which enteredafterwards.4 For each subgroup, survival andhazard functions were estimated, and the corre-sponding likelihood ratios for testing the homo-geneity of the curves across strata were calculated.
If our hypothesis regarding entry before orafter a dominant design is true, we would expectthe following:
"'" ~~'"-~ 'C'~- -,j
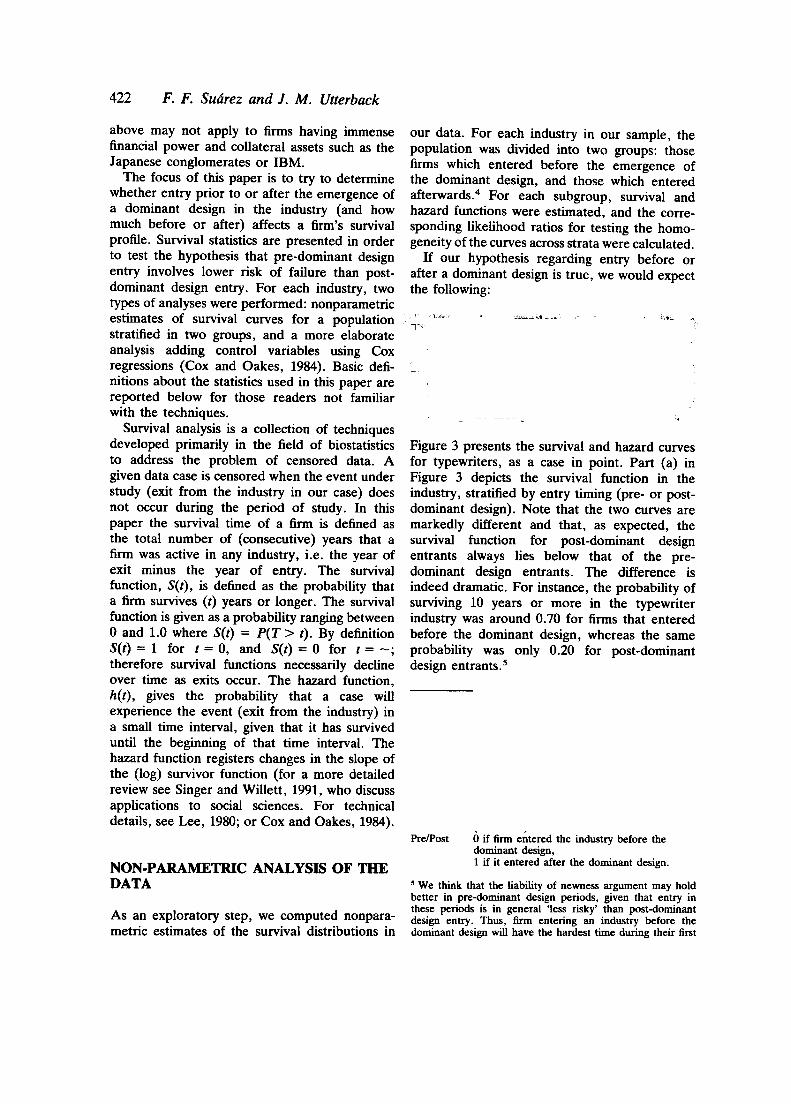
Figure 3 presents the survival and hazard curvesfor typewriters, as a case in point. Part (a) inFigure 3 depicts the survival function in theindustry, stratified by entry timing (pre- or post-dominant design). Note that the two curves aremarkedly different and that, as expected, thesurvival function for post-dominant designentrants always lies below that of the pre-dominant design entrants. The difference isindeed dramatic. For instance, the probability ofsurviving 10 years or more in the typewriterindustry was around 0.70 for firms that enteredbefore the dominant design, whereas the sameprobability was only 0.20 for post-dominantdesign entrants.s
The Survival of Firms 423
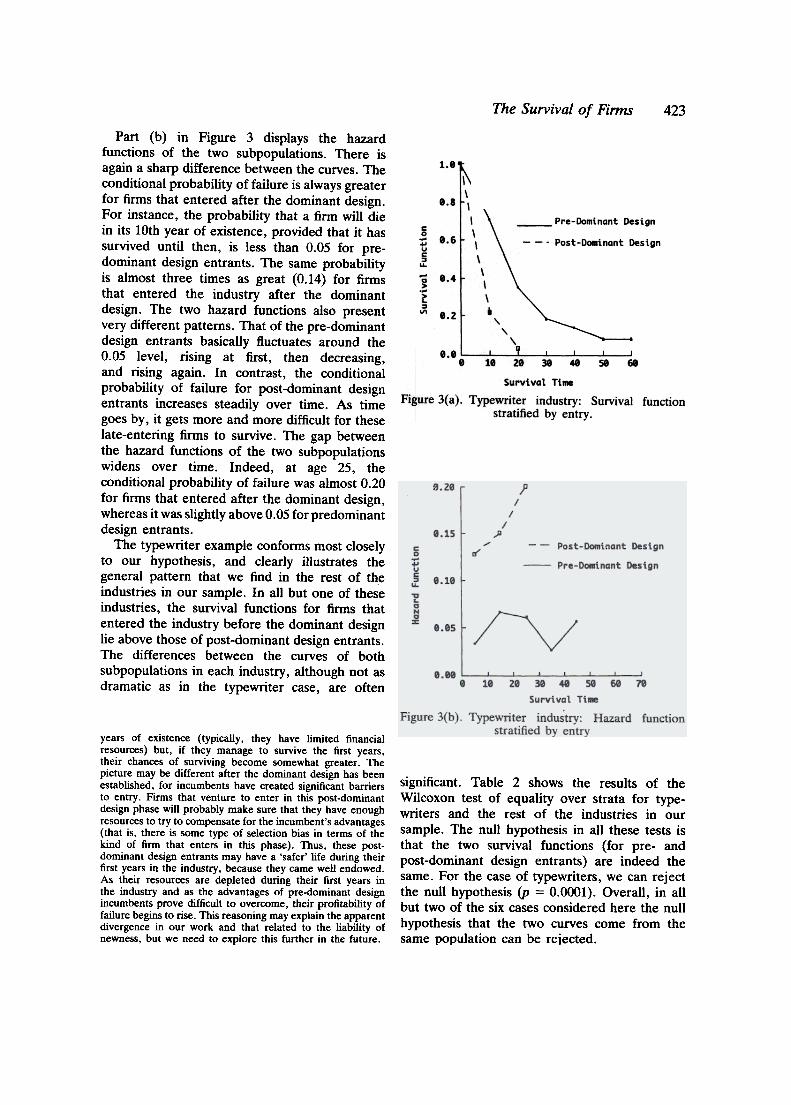
Part (b) in Figure 3 displays the hazardfunctions of the two subpopulations. There isagain a sharp difference between the curves. Theconditional probability of failure is always greaterfor firms that entered after the dominant design.For instance, the probability that a firm will diein its 10th year of existence, provided that it hassurvived until then, is less than 0.05 for pre-dominant design entrants. The same probabilityis almost three times as great (0.14) for firmsthat entered the industry after the dominantdesign. The two hazard functions also presentvery different patterns. That of the pre-dominantdesign entrants basically fluctuates around the0.05 level, rising at first, then decreasing,and rising again. In contrast, the conditionalprobability of failure for post-dominant designentrants increases steadily over time. As timegoes by, it gets more and more difficult for theselate-entering firms to survive. The gap betweenthe hazard functions of the two subpopulationswidens over time. Indeed, at age 25, theconditional probability of failure was almost 0.20for firms that entered after the dominant design,whereas it was slightly above 0.05 for predominantdesign entrants.
The typewriter example conforms most closelyto our hypothesis, and clearly illustrates thegeneral pattern that we find in the rest of theindustries in our sample. In all but one of theseindustries, the survival functions for firms thatentered the industry before the dominant designlie above those of post-dominant design entrants.The differences between the curves of bothsubpopulations in each industry, although not asdramatic as in the typewriter case, are often
years of existence (typically, they have limited financialresources) but, if they manage to survive the first years,their chances of surviving become somewhat greater. Thepicture may be different after the dominant design has beenestablished, for incumbents have created significant barriersto entry. Firms that venture to enter in this post-dominantdesign phase will probably make sure that they have enoughresources to try to compensate for the incumbent's advantages(that is, there is some type of selection bias in terms of thekind of firm that enters in this phase). Thus, these post-dominant design entrants may have a 'safer' life during theirfirst years in the industry, because they came well endowed.As their resources are depleted during their first years inthe industry and as the advantages of pre-dominant designincumbents prove difficult to overcome, their profitability offailure begins to rise. This reasoning may explain the apparentdivergence in our work and that related to the liability ofnewness, but we need to explore this further in the future.
significant. Table 2 shows the results of theWilcoxon test of equality over strata for type-writers and the rest of the industries in oursample. The null hypothesis in all these tests isthat the two survival functions (for pre- andpost-dominant design entrants) are indeed thesame. For the case of typewriters, we can rejectthe null hypothesis (p = 0.0001). Overall, in allbut two of the six cases considered here the nullhypothesis that the two curves come from thesame population can be rejected.
424 F. F. Suarez and J. M. Utterback
Table 2. Nonparametric analysis. Wilcoxon test of equality over strata: Survival functionsin six industries
industry; it is set to zero for post-dominant designentrants. The variable YRAFTDD registers thedifference between actual entry year and thedominant design date for those firms entering afterthe dominant design date; it is set to zero for pre-dominant design entry.6 Next, data on fouradditional variables can be used to control foralternative hypotheses regarding firms' survivalwhich have been proposed by researchers instrategy, economics, and population ecology (theseare explained more fully below and were brieflymentioned in the Introduction). Gathering dataon control variables was not an easy task in someof the industries, as it often involved going backseveral decades. In general, the older the industrythe more difficult it was to obtain reliable data forthe analysis. For each industry we tried to obtaindata on the following variables below. We wereable to obtain complete data sets for the televisionand automobile industry; for the other industries,data on industry sales and sales growth proved toodifficult to gather or too unreliable to be used inthe analysis:
The nonparametric analysis presented in the lastsection does not allow for the inclusion of controlvariables. It could be argued that the observeddifferences in the curves for each subgroup arethe reflection of differences in the value ofvariables not contemplated in the previousanalysis, and that these variables have norelationship with a firm's entry timing vis-a-visthe emergence of a dominant design in theindustry. Also, our characterization of pre- andpost-dominant design entry may be too simplistic.One would expect that the effect of entry on thesurvival profile will vary depending on how longbefore or after the dominant design a firm entersthe industry. It may be less risky to enter anindustry only 1 year after the emergence of adominant design than to do it a decade later.
In order to address these issues we performedfurther analyses using the technique of proportionalhazards modelling presented by Cox (1972). Thistechnique uses hazard (actually a logarithmictransformation of hazard given that raw hazardsare bounded to be nonnegative) as the outcomevariable. For each industry in our sample, arelationship can be stated between the hazardprofile and the explanatory and control variables.
First the dummy variable used in the last section(pre- or post-dominant design entry) can bereplaced by two continuous variables measuringhow many years before or after a dominant designa firm entered the industry (YRBEFDD andYRAFfDD). The variable YRBEFDD registersthe difference between the dominant design dateand the actual entry year for those cases where afirm enters before the dominant design in the
1. industry sales at the year of entry by a firm(sales in M 1982 dollars), INDSLENT;
2. industry sales growth rate (annual) at the yearof a firm's exit from the industry, ISLGWEX;
3. population density (number of firms in the
6 We thank an anonymous reviewer who suggested we use
two variables measuring the 'distance' from dominant design.Originally, we had created a single variable, YRFROMDD,taking negative or positive values depending on whether afirm entered before or after the dominant design. Havingtwo variables (YRBEFDD and YRAFfDD) allows us torelax the restriction that the effect of entry on hazard is thesame for both pre- and post-dominant design entrants.
The Survival of Firms 425
industry) at the year of a firm's entry,EDENSITY;
4. industry rank of entry timing (we used a naturallogarithmic transformation), LNENRANK.
A general model can be written as:
In h(t) = Bo(t) + B} YRBEFDD
+ B2 YRAFfDD + BJ INDSLENT
+ B4 ISLGWEX + Bs EDENSITY
+ B6 LNENRANK
simple model of log-hazard with YRBEFDD andYRAFfDD as the only predictors. This analysis isalready an improvement over the nonparametricanalysis of the previous section, given thatYRBEFDD and YRAFl'DD are continuousvariables measuring the effect on the log-hazardprofile of an additional year of early (or late)entry by a firm with respect to the dominantdesign date for the industry. The parameters ofYRBEFDD and YRAFfDD are highly signifi-cant in all cases and, as expected, they arealways more significant than the dummy predictorof pre- or post-dominant design entry (this is notreported in the table). The antilogarithms ofthese coefficients represent numerical multipliersof risk per unit difference in the predictor (Singerand Willett, 1991). Table 3 shows that entryprior to the dominant design consistently reducesa firm's risk of failure. For each year earlier thata firm enters with respect to the dominant designdate (a higher value for YRBEFDD), its hazardprofile is shifted down 6 to 15 percentage pointsdepending on the industry considered. Entryafter the dominant design (a value greater thanzero for YRAFfDD) has a more ambiguouseffect in terms of shifting the hazard profile.Post-dominant design entry increases risk offailure in one industry, has almost no effect intwo industries, and actually decreases risk in thepicture tube industry.
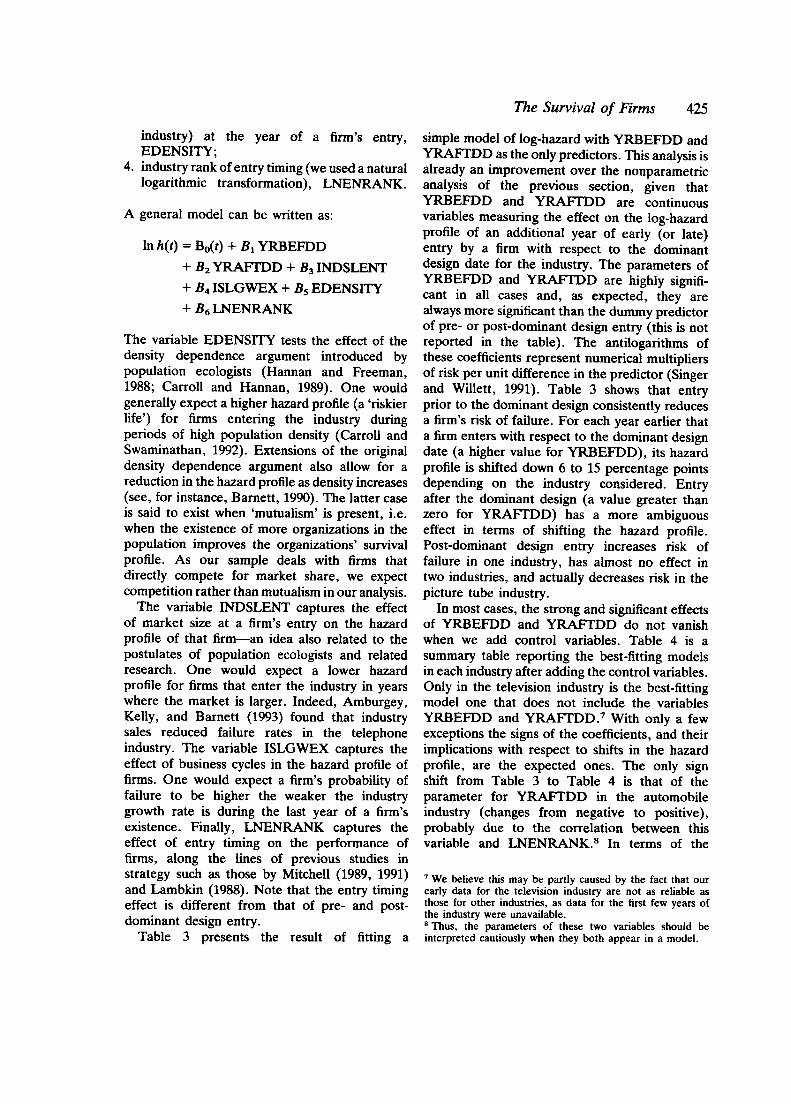
In most cases, the strong and significant effectsof YRBEFDD and YRAFfDD do not vanishwhen we add control variables. Table 4 is asummary table reporting the best-fitting modelsin each industry after adding the control variables.Only in the television industry is the best-fittingmodel one that does not include the variablesYRBEFDD and YRAFTDD.7 With only a fewexceptions the signs of the coefficients, and theirimplications with respect to shifts in the hazardprofile, are the expected ones. The only signshift from Table 3 to Table 4 is that of theparameter for YRAFTDD in the automobileindustry (changes from negative to positive),probably due to the correlation between thisvariable and LNENRANK.8 In terms of the
7 We believe this may be partly caused by the fact that our
early data for the television industry are not as reliable asthose for other industries, as data for the first few years ofthe industry were unavailable.8 Thus, the parameters of these two variables should be
interpreted cautiously when they both appear in a model.
The variable EDENSITY tests the effect of thedensity dependence argument introduced bypopulation ecologists (Hannan and Freeman,1988; Carroll and Hannan, 1989). One wouldgenerally expect a higher hazard profile (a 'riskierlife') for firms entering the industry duringperiods of high population density (Carroll andSwaminathan, 1992). Extensions of the originaldensity dependence argument also allow for areduction in the hazard profile as density increases(see, for instance, Barnett, 1990). The latter caseis said to exist when 'mutualism' is present, i.e.when the existence of more organizations in thepopulation improves the organizations' survivalprofile. As our sample deals with firms thatdirectly compete for market share, we expectcompetition rather than mutualism in our analysis.
The variable INDSLENT captures the effectof market size at a firm's entry on the hazardprofile of that firm-an idea also related to thepostulates of population ecologists and relatedresearch. One would expect a lower hazardprofile for firms that enter the industry in yearswhere the market is larger. Indeed, Amburgey,Kelly, and Barnett (1993) found that industrysales reduced failure rates in the telephoneindustry. The variable ISLGWEX captures theeffect of business cycles in the hazard profile offirms. One would expect a firm's probability offailure to be higher the weaker the industrygrowth rate is during the last year of a firm'sexistence. Finally, LNENRANK captures theeffect of entry timing on the performance offirms, along the lines of previous studies instrategy such as those by Mitchell (1989, 1991)and Lambkin (1988). Note that the entry timingeffect is different from that of pre- and post-dominant design entry.
Table 3 presents the result of fitting a
426 F. F. Suarez and J. M. Utterback
Table 3. Cox proportional hazards regression: Basic model
Model: In h(l) = Bo + BI YRBEFDD + B2 YRAFfDD
eBlIndustry N Bl eB2Shift in hazard B2 Shift in hazard
Down 7.1% 0.042***Down 6.1% -0.004***Down 8.1% 0.004***Down 15.9% -0.225***
1.043 Up 4.3%0.995 Down 0.4%1.004 Up 0.4%0.798 Down 20.1%
.p < 0.05; ..P < 0.01; ...p < 0.001Note: The analysis could not be performed for the calculator and transistor industries, as all but a few firms entered theformer industry before the dominant design, and aU but a few entered after the dominant design in the latter industry.
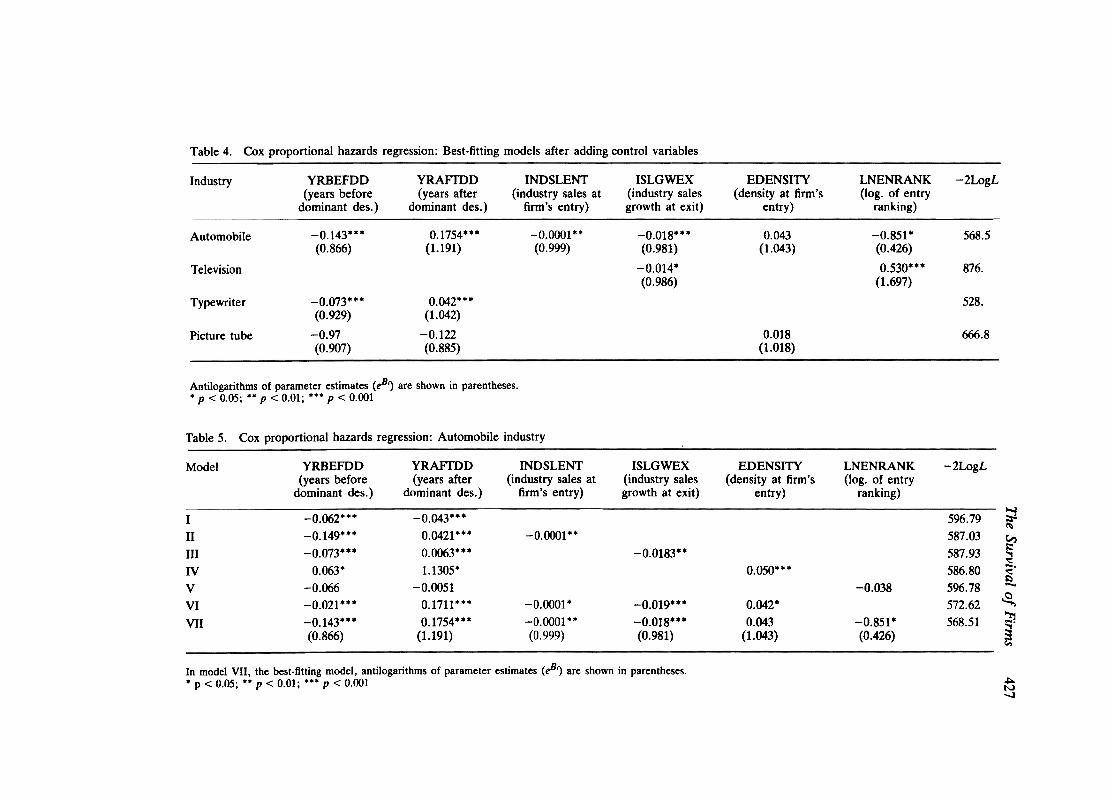
mechanics of the analysis, for each industry ataxonomy of models was tested, and the signifi-cance of a given variable in a model wascalculated by dropping the variable in questionfrom a model that included it, and performing a'decrement to chi-square' test between the twomodels. Appendices 1 and 2 report the resultsof all fitted models in each industry. Theautomobile case is discussed below as an example.
In order to illustrate the interpretation of thecoefficients in a Cox model, consider Table 5,which shows a taxonomy of models fitted for thecase of the automobile industry. The tableshows that the significance of YRBEFDD andYRAFTDD is not affected by the addition ofmore covariates; nor is the sign of their effecton hazard, with the only exception of YRAFTDDin the first model.9 The best-fitting model ismodel seven, which includes all variables. to Forthe best-fitting model, the antilogarithms ofparameter estimates are shown in parentheses.
Note that all parameters in the automobilecase present the expected sign. The hazardprofile of a firm is shifted upward (i.e., a firmhas a higher conditional probability of failure)by increments in YRAFTDD and EDENSITY.For instance, for each increment in populationdensity at any given year, the hazard profile ofa firm entering the industry that year goes upby 4.3 percent. Note, incidentally, that theunexpected negative sign for the coefficient ofYRAFTDD from the simple model (Table 3)
changes to a positive coefficient when we addthe controls. Entry after the dominant designnow increases the hazard profile, as we expected.The hazard profile is shifted downward byhigher values of YRBEFDD, INDSLENT, andISLGWEX. The earlier the entry vis-a-vis thedominant design, the bigger the market early inthe life of a firm; or the stronger the industrygrowth rate at a firm's final year, the lower theconditional probability of failure of such a firm.
RESEARCH AGENDA
The analysis presented above opens a broad agendafor future research. First, the concept of a dominantdesign clearly needs to be studied and specifiedmore rigorously. Although work remains to bedone, we think we have moved a significant stepforward here by linking the concept of dominantdesign with that of design hierarchies, which inturn allowed us to consider the emergence of adominant design as a combination of technological,economic, and organizational factors.
There is also further work to do in terms offinding some sensible metrics to narrow down thesearch for a dominant design date. This is probablythe most challenging task ahead. Some authorshave used measures which are tautological todetermine a dominant design, such as marketshare (Anderson and Tushman, 1990). A bettermeasure, for instance, might be a notable increasein licensing activity during several years by a givenfirm or by a group of firms with products basedon the same core technology. Licensing data, i.e.whether a particular product or process starts tocapture a large share of the industry's licensing
9 Model V is not significant and thus should not be consideredin this comparison.10 Note that we have included entry density in the best-
fitting model even though this variable is not significantbecause several of our variables are correlated.
'"Q)
:c~'C~]-c8coc:a~~...Q
)
~'""4)~0Eco.5~'9~Q
)
~~0.~Q)
~Q)
...'""E~~.c-;c0"::...8-~~8~Q)
~E--
--.u
onO
"'uc.s~~
u 'T
'.c =
"'rn~=
...~.-
~U
E»'0'-'~ -."'
,;~
uU~
~'O
~
-'" =...~
<~
=~
U
'-"--
>, e
"""-'0'0
-co
E--"'-
z~~
,., .u
-_flO
C
...J>-Q
)tI)\..",Q
--Z
~E
..."OtCC
:.::-
",-u
~.~
",,-><
~~
~~
~
't;O
~.c
..J=-
tn~~
-co-00 '"
~~
--"">
'fn.o...
~ >
,c"""'UQ
'V
;L1J~-0'-"
~~Z""-c~
""Q)c
~
zo~,.,
.~-~
..Z
o..JC
~.3NI~-'"="0~-
.?!.:s0e0-=< *** ---~
\O.,j-\o
00001'-'
***~-
~
1'--0\
0""- **-,,-..8~co-001'-'
*** -.* -.
IX)-
'ot"1O-IX
) -IX
)00\
00\00001'-'
1'-'
r')r')
~~0"':''-'
***
* '-'\0
or-.oriN
t"IO
\00"'"
orI\o000"';,-
-
":~II")
~~§O;;;
O>Q)
~E-
...P
-°i:~Q
)C
o>
.E
--
***--- ---
~O
\ t--
t--N
t--O00\
0\0\
00001"-'
1"-'
***--- ---
NN
N
Or)
~~
~
~0"';
00"-'
1"-'
00N'r1
---~
~--ccd...'-'
~~
U.0='
-u...='
u~
.;"'"".cC"...~Co
.5c~0.c'"~~C
"
~"-"-~
8~
o.5 v~
~"...*",-*"e.:.:~
O~
O
Cov
o~"'*e*.c ...E
'8~
.
bOO
.9v.g
~<
*
>.
...-cn="0.5.£:c0e0~.(=0.~'"~...tIO
~-E~~.c-;;=0.-28-0So
~8~~:c~f-o
,...,Q
) rn
O"'Q
)0..9-0~
Q)
,.,..0 =
-~~
~
~.5
~Q
)e>
0;""0--0
---0"";~
uu ,:::'0
~-
'" =..~
,.;~=
-U'-
>-bE.g
~~
",-z.£~rT
l ~
-"'C...1>
.Ucn~
",0"".Z
~e"O
~CC- ",-u.-;:
...,-1<~
~u
~ ~
~O
~.c
~=
-~
'O~
_=0
-CO
'"
~~
--t/)->'
Zoub
~>
,cO
'~
u
~~~'-"
~~Z""-
"'CC
I/)"'"
u C
~-~
zoc",
.cu-C
I/)...Z
o..JC
~.3NI"ij"00~
The S
urvival of Firm
s
*** **
*** **
**** **-
NO
\MM
\O""M
\O\O
'ot't-\O\O
N'ot'\O
0""0000""0000000000
I 1
1 I
I 1'-"
* *
* *
*** **
**** **
* ""r'"\Ir\""""~
-r'"\N
~O
Ir\""Ir\"" ~
~
r'"\0r--r--0\
00 ""0""""""
000"'-000"'-I
I '-'
O\~
~O
OO
N""
f'-O
0\ 00
f'-\OV
")..or..:r..:..o..oN
OO
O\O
OO
OO
OO
\f'-\OV
") V
") V
") V
") V
") V
") V
")
-->
~
--=
=->
~> **~0I
**("IC
X)
'='
0I
***0'80
00
~0I
**
*---~
OO
\~
8~000I
I '-'
* *
* *
* *-
0\ C
XI""C
XI
000\000I
1'-"
* .-.,
N
f'")f'")
~ ~
~00"':'
'-"
* -~Ir.NC
X)'ot"
001-
.,;"'""~cetUC
-
.5~0~'"etU
t:"'
~'""~.5~I.-"'Q
)
etUI.-tUC-
0e~'CtUco..§c-~
8"0;0"8ve~co*c*.;;: *.c ..,--0'"
.U
o.cvU-s~.*-*>
..~"0;0"0~
v0-,s* 427
428 F. F. Suarez and J. M. Utterback
Utterback and Abernathy (1975) has importantimplications for the fate of firms entering anindustry. Entry pre-dominant design is clearlyassociated with lower probability of failure, asentering a greater number of years before thedominant design allows a firm to buy time inorder to experiment with new products in aperiod when demand changes rapidly. Entrypost-dominant design presents more ambiguousresults; only one industry clearly supports ourprediction that the risk of failure would be higherfor firms entering a greater number of yearsafter the dominant design.
This model can complement postulates of otherstreams of thought such as those of populationecology, strategy, and economics, and togetherthese theories can better explain the survivalcharacteristics of firms. Work on strategic man-agement has often neglected technologicalchange. These results show that by explicitlyincluding technology as a dynamic and strategicvariable we can enhance our understanding offirms' survival potential and success.
activity at some time, may represent a good way toshed light on the occurrence of a dominant design.We expect that this would be particularly true incases in which there are strong network externalities.More generally we need to discover a way of keepingtrack of the different features of different models ofcompeting products to see if these begin to stabilizejust prior to the synthesis of a dominant design.Sanderson and Uzumeri (1m) have provided onepossibly fruitful approach based on analysis ofproduct literature and specifications.
Our sample has been limited. More industries,especially contemporary ones, are needed if ourhypotheses are to be more generally tested. We alsoneed to study counter-examples to our model. Inthe VCR industry, for instance, the post-dominantdesign period seems to have been associated withan increase in the entry of finns into the industry.By studying cases like this, perhaps we could isolatethe factors or characteristics of an industry to createa model more likely to be valid. Finally, the presentanalysis could also be expanded by adding morefinn-specific control variables.ll
Building upon Teece (1986), we suggested thatthe dominant design concept be related to issuessuch as collateral assets, network externalities,industry regulation, and finns' strategic maneuvering.The importance of relating the concepts of dominantdesign and standards was also stressed. There arestill many issues that need to be addressed in futureresearch. The specific effect of each of the mentionedfactors on the emergence of a dominant designneeds to be sorted out, as well as the conditions foreach of them to playa greater or lesser role.
ACKNOWLEDGEMENTS
The authors wish to thank several people forimportant help: Dr. Ingrid Munck at StatisticsSweden, Professor Michael Rappa at MIT,Professor John B. Willett at Harvard andProfessor Lisa Lynch at MIT for their commentson the statistical methods employed; and Pro-fessors Richard Rosenbloom at Harvard andRichard Langlois at the University of Connecticutfor helpful comments on an earlier draft. Errorsand omissions remain the responsibility of theauthors.
CONCLUSIONS
This paper has shed light on relationships betweentechnology, firm strategy, industry structure, andthe competitiveness of firms in an industry.The results show that the dominant design-technological evolution model proposed by
REFERENCES
11 For examples of other papers that have considered theeffect of multiple covariates on survival, see Willard andCooper (1985) or Mitchell (1991). Note that both thesestudies have only considered one industry. In fact, Willardand Cooper considered only the 19 largest firms in theirstudy of color TV (and also used more traditional statisticaltechniques than those we employ here). None of thesestudies tested the hypotheses derived from the dominantdesign model as a predictor of survival.
Abernathy, W. J. (1978). The Productivity Dilemma.Johns Hopkins University Press, Baltimore, MD.
Abernathy, W. J. and J. M. Utterback (1978). 'Pat-terns of innovation in industry', Technology Review,80 (7), pp. 40-47.
Amburgey, T., D. Kelly and W. Barnett (1993).'Resetting the clock: The dynamics of organizationalchange and failure', Administrative Science Quar-terly, 38 (1), pp. 51-73.
Anderson, P. and M. Tushman (1990). 'Technologicaldiscontinuities and dominant designs: A cyclical
The Survival of Firms 429
Katz, M. and C. Shapiro (1985). 'Network externalities,competition, and compatibility', American Eco-nomic Review, 75, pp. 424-440.
Klein, B. (1977). Dynamic Economics. HarvardUniversity Press, Cambridge, MA.
Lambkin, M. (1988). 'Order of entry and performancein new markets', Strategic Management Journal,Summer Special Issue, 9, pp. 127-140.
Langlois, R. N. (1990). 'Creating external capabilities:Innovation and vertical disintegration in themicrocomputer industry', Business and EconomicHistory, Second Series, 19, pp. 9~102.
Lee, E. (1980). Statistical Methods for Survival DataAnalysis. Lifetime Learning Publications, Belmont,CA.
Lieberman, M. B. (1990). 'Exit from declining indus-tries: Shakeout or stakeout?', RAND Journal ofEconomics, 21 (4), pp. 538-554.
Majumdar, B. (1977). 'Innovations, product develop-ment, and technology transfer: An empirical studyof dynamic competitive advantage, The Case ofElectronic Calculators', doctoral dissertation, CaseWestern University, Cleveland, OH.
Mitchell, W. (1989). 'Whether and when? Probabilityand timing of incumbents' entry into emergingindustrial subfields', Administrative Science Quar-terly, 34, pp. 208-230.
Mitchell, W. (1991). 'Dual clocks: Entry orderinfluences on incumbent and newcomer marketshare and survival when specialized assets retaintheir value', Strategic Management Journal, 12 (2),pp. 85-100.
Sanderson, S. W. and V. Uzumeri (1990). 'Strategiesfor new product development and renewal: Design-based incrementalism', unpublished working paper,Rensselaer Polytechnic Institute, Center for Scienceand Technology Policy.
Singer, J. and J. Willett (1991). 'Modeling the daysof our lives: Reviewing applications of survivalanalysis in psychological research', PsychologicalBulletin, 110 (2), pp. 268-290.
Teece, D. (1986). 'Profiting from technological inno-vation', Research Policy, 15 (6), pp. 285-306.
Television Factbook (1949-89). Television Digest,Washington, DC.
Tilton, J. E. (1971). International Diffusion of Tech-nology: The Case of Semiconductors. BrookingsInstitution, Washington, DC.
Tirole, J. (1988). The Theory of Industrial Organiza-tion. MIT Press, Cambridge, MA.
Utterback, J. M. (1994). Mastering the Dynamics ofInnovation. Harvard Business School Press, Boston,MA.
Utterback, J. M. and W. Abernathy (1975). 'Adynamic model of process and product innovation',Omega, 33, pp. 639-656.
Utterback, J. M. and F. F. Suarez (1993). 'Innovation,competition, and industry structure', ResearchPolicy, 22 (1), pp. 1-21.
Willard, G. and A. Cooper (1985). 'Survivors ofindustry shake-outs: The case of the U.S. colortelevision set industry', Strategic Management Jour-nal, 6 (4), pp. 299-318.
model of technological change', AdministrativeScience Quarterly, 35, pp. 604-633.
Barnard, C. I. (1938). The Functions of the Executive.Harvard University Press, Cambridge, MA.
Barnett, W. (1990). 'The organizational ecology ofa technological system', Administrative ScienceQuarterly, 35, pp. 31-60.
Braun, E. and S. MacDonald (1978). Revolution inMiniature: The History and Impact of SemiconductorElectronics. Cambridge University Press, Cam-bridge, U.K.
Carroll, G. R. and M. Hannan (1989). 'Density delayin the evolution of organizational populations: Amodel and five empirical tests', AdministrativeScience Quarterly, 34, pp. 411-430.
Carroll, G. R. and A. Swaminathan (1992). 'Theorganizational ecology of strategic groups in theAmerican brewing industry from 1975 to 1990',Industrial and Corporate Change, 1 (I), pp. 65-97.
Christensen, C. (1992). 'The innovator's challenge:Understanding the influence of market environmenton processes of technology development in therigid disk drive industry', doctoral dissertation,Harvard Business School, Boston, MA.
Clark, K. B. (1985). 'The interaction of designhierarchies and market concepts in technologicalevolution', Reseqrch Policy, 14 (5), pp. 235-251.
Cox, D. R. (1972). 'Regression models and lifetables', Journal of the Royal Statistical Society, 34,pp. 187-202.
Cox, D. and D. Oakes (1984). Analysis of SurvivalData. Chapman & Hall, New York.
Cusumano, M., Y. Mylonadis and R. Rosenbloom(1992). 'Strategic maneuvering and mass-marketdynamics: The triumph ofVHS over beta', BusinessHistory Review, 66 (Spring), pp. 51-94.
Denoual, D.-G. (1980). 'The diffusion of innovations:An institutional approach', doctoral dissertation,Harvard Business School, Boston, MA.
Dertouzos, M., R. Lester, R. Solow and the MITCommission on Industrial Productivity (1989). Madein America. MIT Press, Cambridge, MA.
Dunne, T., M. J. Roberts and L. Samuelson (1989).'The growth and failure of U.S. manufacturingplants', Quarterly Journal of Economics, 104,pp. 671-698.
Engler, N. (1969). 'The typewriter industry: Theimpact of a significant technological innovation',doctoral dissertation, University of California, LosAngeles, CA.
Fabris, R. (1966). 'Product innovation in the auto-mobile industry', doctoral dissertation, Universityof Michigan, Ann Arbor, MI.
Hannan, M. and J. Freeman (1988). 'Density depen-dence in the growth of organizational populations'.In G. Carroll (ed.), Ecological Models of Organiza-tions. Ballinger Books, Cambridge, MA, pp. 7-32.
Hemenway, D. (1975). Industrywide Voluntary ProductStandards. Ballinger, Cambridge, MA.
Henderson, R. and K. B. Clark (1990). 'Architecturalinnovation: The reconfiguration of existing producttechnologies and the failure of established firms',Administrative Science Quarterly, 35, pp. 9-30.
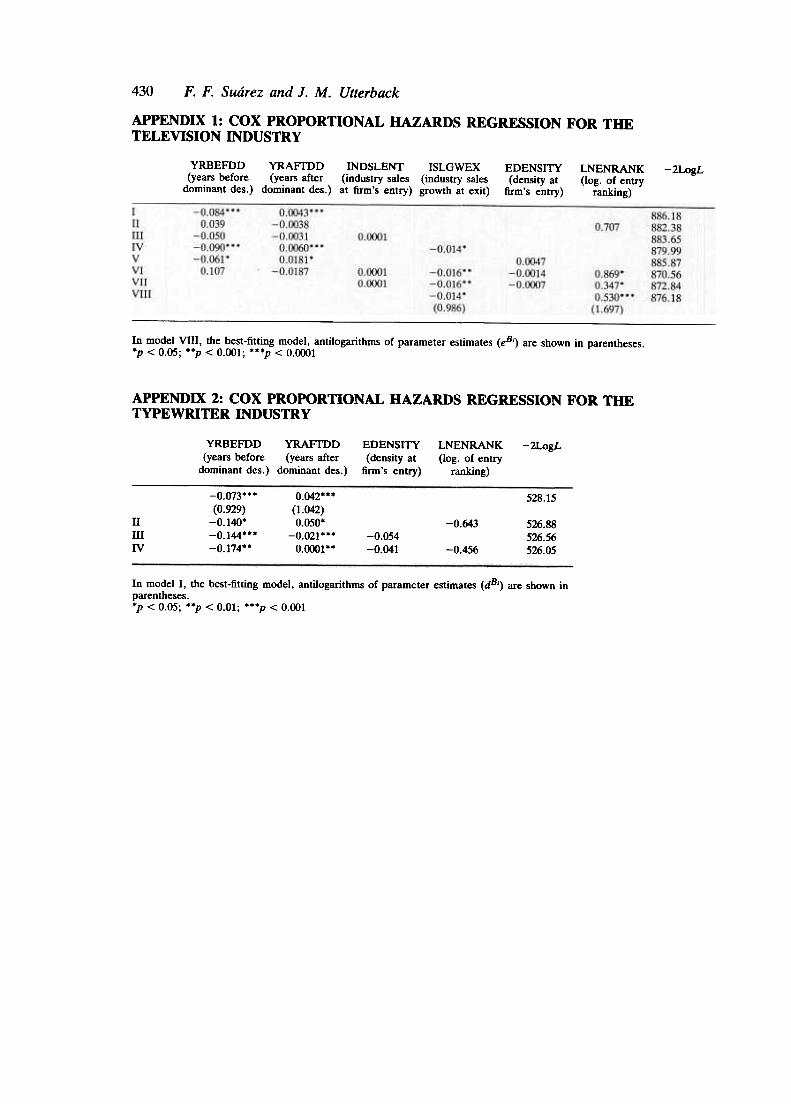
430 F. F. Suarez and J. M. Utterback
APPENDIX 1: COX PROPORTIONAL HAZARDS REGRESSION FOR THETELEVISION INDUSTRY
YRBEFDD YRAFroD INDSLENT ISLGWEX EDENSITY(years before (years after (industry sales (industry sales (density at
dominant des.) dominant des.) at firm's entry) growth at exit) firm's entry)
LNENRANK(log. of entry
ranking)
-2LogL
In model VIII, the best-fitting model, antilogarithms of parameter estimates (eBi) are shown in parentheses..p < 0.05; ..p < 0.001; ...p < 0.0001
APPENDIX 2: COX PROPORTIONAL HAZARDS REGRESSION FOR THETYPEWRITER INDUSTRY
YRBEFDD YRAFlDD EDENSITY(years before (years after (density atdominant des.) dominant des.) firm's entry)
LNENRANK(log. of entry
ranking)
-2LogL
-0.073...(0.929)
-0.140.-0.144...-0.174..
0.042***(1.042)0.050*
-0.021 ***0.0001 **
528.15
IIIIIIV
-0.643 526.88526.56526.05
-0.054
-0.041 -0.456
In model I, the best-fitting model, antilogarithms of parameter estimates (dB,) are shown inparentheses..p < 0.05; ..p < 0.01; ...p < 0.001