71
Don River Watershed Plan Geology and Groundwater Resources – Report on Current Conditions 2009 Prepared by: Toronto and Region Conservation

Don River Watershed Plan
Geology and Groundwater Resources
– Report on Current Conditions
2009
Prepared by: Toronto and Region Conservation
Don River Watershed Plan: Geology and Groundwater Resources – Report on Current Conditions
Toronto and Region Conservation CFN: 37590 2 2009
Table of Contents Table of Contents............................................................................................................................ 2 List of Tables................................................................................................................................... 3 List of Figures.................................................................................................................................. 3 1.0 Introduction............................................................................................................................... 4 2.0 Methodology............................................................................................................................. 4
2.1 Data Sources......................................................................................................................... 5 2.2 Stratigraphic Interpretation ................................................................................................... 6 2.3 Field Data Collection............................................................................................................. 6
3.0 Physical Setting ........................................................................................................................ 6 3.1 Physiography ........................................................................................................................ 6 3.2 Climate .................................................................................................................................. 7
4.0 Geology................................................................................................................................... 11 4.1 Stratigraphic Framework..................................................................................................... 11 4.2 Geologic Units..................................................................................................................... 15
4.2.1 Bedrock ........................................................................................................................ 15 4.2.2 Pre-Wisconsinan Deposits ........................................................................................... 15 4.2.3 Wisconsinan Deposits.................................................................................................. 18
5.0 Hydrogeology ......................................................................................................................... 29 5.1 Hydrostratigraphy ............................................................................................................... 29
5.1.1 North-South Cross Section A-A ................................................................................... 30 5.1.2 North-South Cross Section B-B ................................................................................... 30 5.1.3 West-East Cross Section C-C ...................................................................................... 36 5.1.4 West-East Cross Section D-D ...................................................................................... 37
5.2 Groundwater Flow............................................................................................................... 37 5.3 Hydraulic Properties............................................................................................................ 41 5.4 Groundwater Recharge....................................................................................................... 41 5.5 Groundwater Discharge...................................................................................................... 42 5.6 Groundwater Chemistry...................................................................................................... 45 5.7 Aquifer Vulnerability ............................................................................................................ 45 5.8 Water Budget ...................................................................................................................... 48 5.9 Summary of Hydrogeology................................................................................................. 50
6.0 Indicators, Measures and Targets.......................................................................................... 51 6.1 Groundwater Recharge and Discharge.............................................................................. 51
6.1.1 Water Level in PGMN Wells ......................................................................................... 52 6.1.2 Average Groundwater Recharge Rates ....................................................................... 52 6.1.4 Summary ...................................................................................................................... 52
6.2 Groundwater Chemistry and Bacteria ................................................................................ 53 6.3 Groundwater Withdrawals .................................................................................................. 54
7.0 Groundwater Management Considerations........................................................................... 55 7.1 Groundwater Recharge....................................................................................................... 55 7.2 Groundwater Levels ............................................................................................................ 56 7.3 Groundwater Takings.......................................................................................................... 56 7.4 Groundwater Quality Impacts ............................................................................................. 56
8.0 References .............................................................................................................................. 58 APPENDIX A: PGMN Groundwater Hydrograph ......................................................................... 67 APPENDIX B: Groundwater Chemical Quality ............................................................................. 69

Don River Watershed Plan: Geology and Groundwater Resources – Report on Current Conditions
Toronto and Region Conservation CFN: 37590 3 2009
List of Tables Table 1: Hydrostratigraphic Units................................................................................................. 29
List of Figures Figure 1: Don River watershed ground surface topography. ........................................................ 8 Figure 2: Physiographic regions within the Don River watershed................................................. 9 Figure 3: Long term Toronto precipitation and Lake Ontario water level trends. ....................... 10 Figure 4: GSC stratigraphic framework for the Oak Ridges Moraine and South Slope (Sharpe et
al., 2002). ............................................................................................................................... 12 Figure 5: Quaternary deposits found within the study area (Eyles, 2002). ................................. 13 Figure 6: OGS surficial geology and observation locations. ....................................................... 14 Figure 7: Don River watershed bedrock topography. ................................................................. 16 Figure 8: Don River watershed overburden thickness................................................................. 17 Figure 9: Scarborough Formation (Aquifer) thickness. ............................................................... 19 Figure 10: Thorncliffe Formation (Aquifer) thickness................................................................... 21 Figure 11: Conceptual model of the internal architecture of the Newmarket Till (aka Northern
Till) Aquitard (Gerber et al., 2001)......................................................................................... 22 Figure 12: Newmarket Till (Aquitard) thickness. .......................................................................... 24 Figure 13: Interpreted tunnel channel location. ........................................................................... 25 Figure 14: Oak Ridges Moraine deposit (Aquifer) thickness....................................................... 27 Figure 15: Halton Till (Aquitard) thickness. .................................................................................. 28 Figure 16: Geologic cross-section location plan. ........................................................................ 31 Figure 17: Don River Watershed Cross Section A-A (West Don River, north-south). ................. 32 Figure 18: Don River Watershed Cross-Section B-B (East Don River, north-south)................... 33 Figure 19: Don River Watershed Cross Section C-C (west-east in the upper Don River
watershed). ............................................................................................................................ 34 Figure 20: Don River Watershed Cross Section D-D (west-east in the lower Don River
watershed). ............................................................................................................................ 35 Figure 21: ORM Aquifer Complex heads and water table contours............................................ 38 Figure 22: Thorncliffe Aquifer Complex potentiometric surface contours................................... 39 Figure 23: Scarborough Aquifer Complex potentiometric surface.............................................. 40 Figure 24: Groundwater recharge. ............................................................................................... 43 Figure 25: Groundwater discharge to streams (Kassenaar and Wexler, 2006). ......................... 44 Figure 26: Aquifer Vulnerability Index mapping for the Don River watershed. ........................... 47 Figure 27: Overall Don River watershed water budget. ............................................................... 49

Don River Watershed Plan: Geology and Groundwater Resources – Report on Current Conditions
Toronto and Region Conservation CFN: 37590 4 2009
1.0 Introduction The Toronto and Region Conservation Authority (TRCA), in consultation with the multi-stakeholder Don Watershed Regeneration Council and watershed municipalities, is developing a watershed plan for the Don River. This watershed planning process has been initiated in response to a number of recent policy and planning developments, including the need to fulfill York Region’s watershed planning requirements under the Oak Ridges Moraine Conservation Plan (ORMCP, Ontario Regulation 140/02) and to update the original management strategy outlined in Forty Steps to a New Don (Metropolitan Toronto and Region Conservation Authority (MTRCA), 1994). The goal of the watershed planning study is to recommend updated management strategies that will guide land and water use decisions, such that the overall ecological health of the Don River watershed is protected and improved. The aim is to build on the Forty Steps’ principles to protect what is healthy, regenerate what is degraded, and take responsibility for the Don. Recognizing the significant watershed planning work that has already been completed, and given that there are limited undeveloped lands remaining on the Oak Ridges Moraine within the watershed boundary, this study will focus mainly on filling information gaps, guiding land use planning and approval decisions, and providing direction to advance implementation of regeneration priorities. This report has been prepared as part of the scoping and characterization phase of the watershed planning process, in which current watershed conditions are presented in the form of technical reports covering a range of subject areas, including groundwater quality and quantity, surface water quantity, low flows and water use, fluvial geomorphology, surface water quality, aquatic systems, terrestrial systems, nature-based experiences, cultural heritage, and land and resource use. This report summarizes the quantity and quality of the groundwater resources within the Don watershed. Links between the groundwater system and other aspects of the natural heritage system which include surface water, fish and plants are presented. At the end of this portion of the document, overall groundwater related management objectives are outlined and rated while future management actions are discussed.
2.0 Methodology This report presents the first summary of current groundwater conditions in the Don River watershed, filling a gap identified in the original Forty Steps work. Long-term regional groundwater investigations were initiated in 2001 for much of south-central Ontario by a coalition of conservation authorities and municipal government agencies known as the Conservation Authorities Moraine Coalition (CAMC). Partners include the nine conservation authorities associated with the Oak Ridges Moraine, the Regions of York, Peel and Durham and the City of Toronto (YPDT). In 2003, the Ontario Geological Service (OGS) partnered with the CAMC/YPDT to complete Groundwater Resource Project (GRP) reports for the nine conservation authority jurisdictions encompassing the Oak Ridges Moraine The geology and hydrogeology summarized for the Don River watershed is extracted from the wider study based on historical published information augmented with more recent investigations conducted by the CAMC/YPDT partnership. These newer investigations in the

Don River Watershed Plan: Geology and Groundwater Resources – Report on Current Conditions
Toronto and Region Conservation CFN: 37590 5 2009
wider study, include the compilation of a database of water related information (boreholes, wells, climate, streamflow, etc), refinement of the three dimensional stratigraphy provided by the Geological Survey of Canada (GSC), construction of a three-dimensional numerical groundwater flow model (MODFLOW; Kassenaar and Wexler, 2006) and field investigations to fill in key data gaps (Holysh and Davies, 2003; Davies and Holysh, 2004). In general, the urbanized areas obtain a water supply from Lake Ontario with rural areas obtaining water from individual wells. Historically, the increased reliance on water supplies from Lake Ontario has followed urban expansion northward. Much of this report is based on existing reports and information largely published by various consultants, the Ontario Geological Survey and the Geological Survey of Canada. Since 2001, the CAMC Oak Ridges Moraine hydrogeological investigation has conducted data compilation of existing information and collected new data to fill in gaps. These recent investigations involving new data collection will be briefly described at the end of this section.
2.1 Data Sources A database of water related information has been compiled by the CAMC Oak Ridges Moraine hydrogeology investigation. This database includes borehole and water well related information along with climate (Environment Canada) and streamflow (Water Survey of Canada and various conservation authorities) data. The data sources for the database include:
• Ontario Ministry of the Environment water well records (base information) augmented with:
• City of Toronto geotechnical borehole compilations in support of the Toronto Wet Weather Flow Management Master Plan (TWWFM) - compiled by Golder Associates in 2001 from investigations undertaken within the City of Toronto boundaries,
• Ontario Geological Survey (OGS) data from the Urban Geological Automated Information System (UGAIS) which collates geological and geotechnical data, in this case, for the Greater Toronto Area,
• Geologic Survey of Canada mapping, and • borehole, piezometer and water well information from consultant reports prepared for
the various CAMC partners. This CAMC database is continually being updated with information from the various sources described above. Another source of subsurface geologic and hydrogeologic information for possible future incorporation into the CAMC database is the Geotechnical Cross-Reference and Retrieval System (GEOCRES) database initiated and maintained by the Ontario Ministry of Transportation (MTO) since 1956 (Baker et al., 1998). Spatial mapping information has also been provided by the Ontario Ministry of Natural Resources (MNR), the MOE, the OGS, the GSC and various CAMC partners. This information includes:
• Digital ground surface elevation models; • Roads and other infrastructure coverage; • Classified stream networks; • Watershed boundaries; and

Don River Watershed Plan: Geology and Groundwater Resources – Report on Current Conditions
Toronto and Region Conservation CFN: 37590 6 2009
• Surficial geology, bedrock geology and bedrock topography maps.
2.2 Stratigraphic Interpretation Part of the on-going CAMC regional hydrogeologic investigations involves the construction of a three-dimensional numerical groundwater flow model. A key component of this task is to interpret the existing information to compile the three-dimensional interpreted geologic architecture of the study area. This geologic interpretation is then used to form the three-dimensional hydrostratigraphic surfaces that are incorporated into the numerical groundwater flow model. The stratigraphic/geologic framework built on and refined the work provided by the OGS and the GSC (Barnett et al., 1998; Brennand et al, 1997; Russell et al., 2002a; 2002b; Sharpe et al., 2002a; 2002b). This refinement process utilized information included in geologic maps and reports of the OGS and the GSC, MOE water well records, consultant reports and borehole logs, published research papers, and university theses. The geologic interpretive process ranged from analysis at the individual borehole level (geology, well screens, water found, water levels, etc) in addition to plan and section contouring, the incorporation of conceptual depositional/erosional models to extend the interpretation through areas of sparse data. This was necessary to properly define the complex stratigraphy encountered, particularly the significant erosional features (unconformities) present including bedrock valley systems and meltwater channels, and the presence of geologic unit pinch-outs. The interpreted stratigraphic framework will be discussed further in subsequent sections.
2.3 Field Data Collection The geologic architecture construction and refinement process delineated numerous areas that were either data poor or subject to conflicting information. The more sensitive areas have been subject to further field investigation including borehole drilling and seismic survey completion. One feature chosen for further field study was the Laurentian bedrock valley system which extends from Georgian Bay to Lake Ontario near Toronto (Spencer, 1881; Eyles et al., 1993; Middleton, 2004). This valley system is interpreted as a preglacial, subaerial river system in-filled with a Quaternary sediment package up to 270 m thick. In 2004, a borehole was drilled at Earl Bales Park on the West Don to explore the depth of the bedrock surface. This new information has been added to the database and incorporated into the hydrogeologic interpretation discussed in subsequent sections of this report.
3.0 Physical Setting
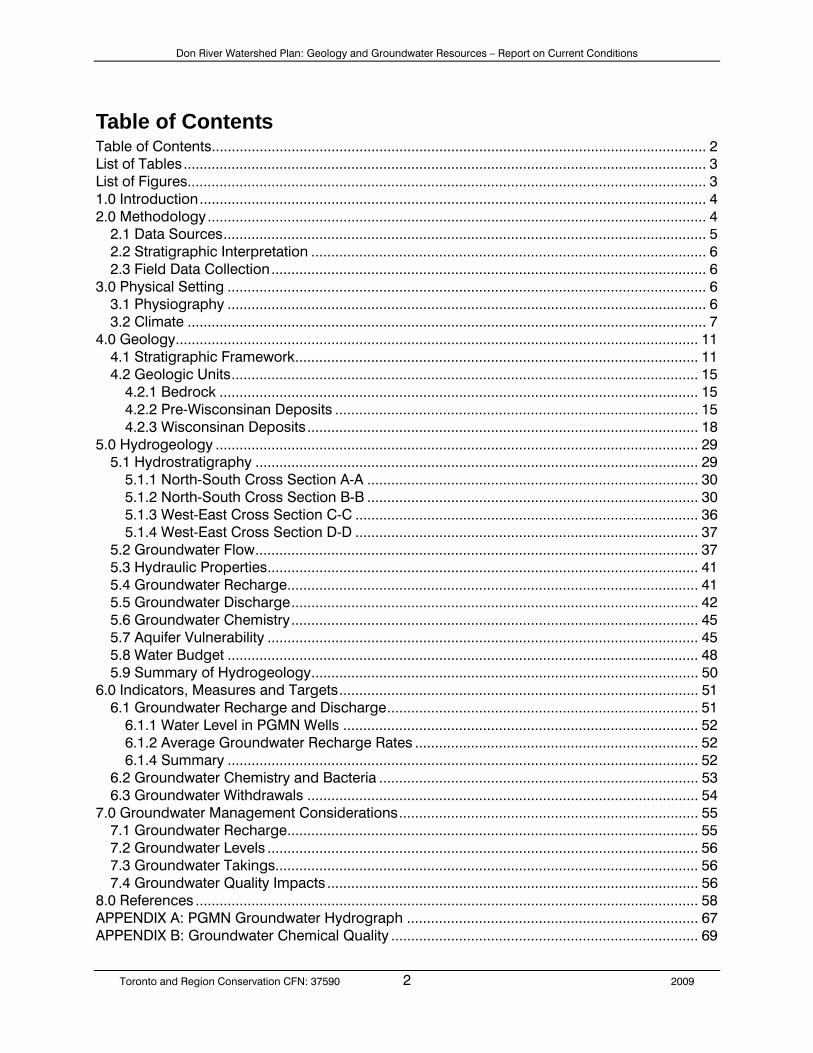
3.1 Physiography The Don River watershed within the TRCA jurisdiction drains southward from the height of land along the Oak Ridges Moraine (ORM) in the north (~315 m above mean sea level masl; amsl) or towards Lake Ontario in the south (75 m amsl) as presented in Figure 1. Figure 2 shows the three main physiographic or geologic areas corresponding to the physiographic regions of Chapman and Putnam (1984). These areas include:
• the ORM (and associated hummocky terrain) which occurs along the northern boundary of the study area and consists largely of sand and gravel;

Don River Watershed Plan: Geology and Groundwater Resources – Report on Current Conditions
Toronto and Region Conservation CFN: 37590 7 2009
• the South Slope area occurring to the south of the ORM and largely consisting of till deposits at surface with a localized lacustrine veneer (Peel Plain); and
• sand, silt and clay deposits of Glacial Lake Iroquois occurring immediately north of Lake Ontario.
The outline of the Oak Ridges Moraine Planning Area roughly corresponds to the 245 m amsl elevation contour as indicated on Figure 1. Note that the ORM is considered to include the hummocky Halton Till that occurs on its southern flank. Detailed mapping of the areas of hummocky terrain has been prepared by the Ministry of Natural Resources (Lenney and Kenny, 2003). The approximate Lake Iroquois shoreline is also shown on Figure 1, demarcated there by the 135 m amsl elevation contour.
3.2 Climate Climate varies across the study area both spatially and temporally with local variation created by such factors as topography, prevailing winds and proximity to Lake Ontario. Human activities can also affect local climate. Deforestation may increase stream and peak flood flows while decreasing evapotranspiration. Urbanization can increase cloudiness, precipitation and extreme winter temperatures while decreasing relative humidity, incident radiation and wind speed (Phillips and McCulloch, 1972). The TRCA lands occur within three climate regions; the Simcoe, the South Slope and the Lake Ontario Shore (Brown et al., 1980). The climate throughout the study area is largely influenced by Lake Ontario. The summary of climatic temperature, precipitation, evapotranspiration and water surplus values for the TRCA regions follows; Temperature (a) Mean Daily - Simcoe climate region 5.6 to 6.7°C Mean Daily - Lake Ontario Shore 6.7 to 7.8°C Mean Daily - Lake Ontario Shore - January (winter) -6.7 to -4.4°C Mean Daily - Lake Ontario Shore - July (summer) 20 to 21.1°C Precipitation (a) Mean Annual - southern Ontario 813 mm Mean Annual Snowfall - Great Lakes area (b) 203 cm Mean - May to September growing season - moraine 380 mm Mean - May to September growing season - Lake Ontario Shore 356 mm
Don River Watershed Plan: Geology and Groundwater Resources – Report on Current Conditions
Toronto and Region Conservation CFN: 37590 8 2009
Figure 1: Don River watershed ground surface topography.

Don River Watershed Plan: Geology and Groundwater Resources – Report on Current Conditions
Toronto and Region Conservation CFN: 37590 9 2009
Figure 2: Physiographic regions within the Don River watershed.
Don River Watershed Plan: Geology and Groundwater Resources – Report on Current Conditions
Toronto and Region Conservation CFN: 37590 10 2009
Figure 3: Long term Toronto precipitation and Lake Ontario water level trends.

Don River Watershed Plan: Geology and Groundwater Resources – Report on Current Conditions
Toronto and Region Conservation CFN: 37590 11 2009
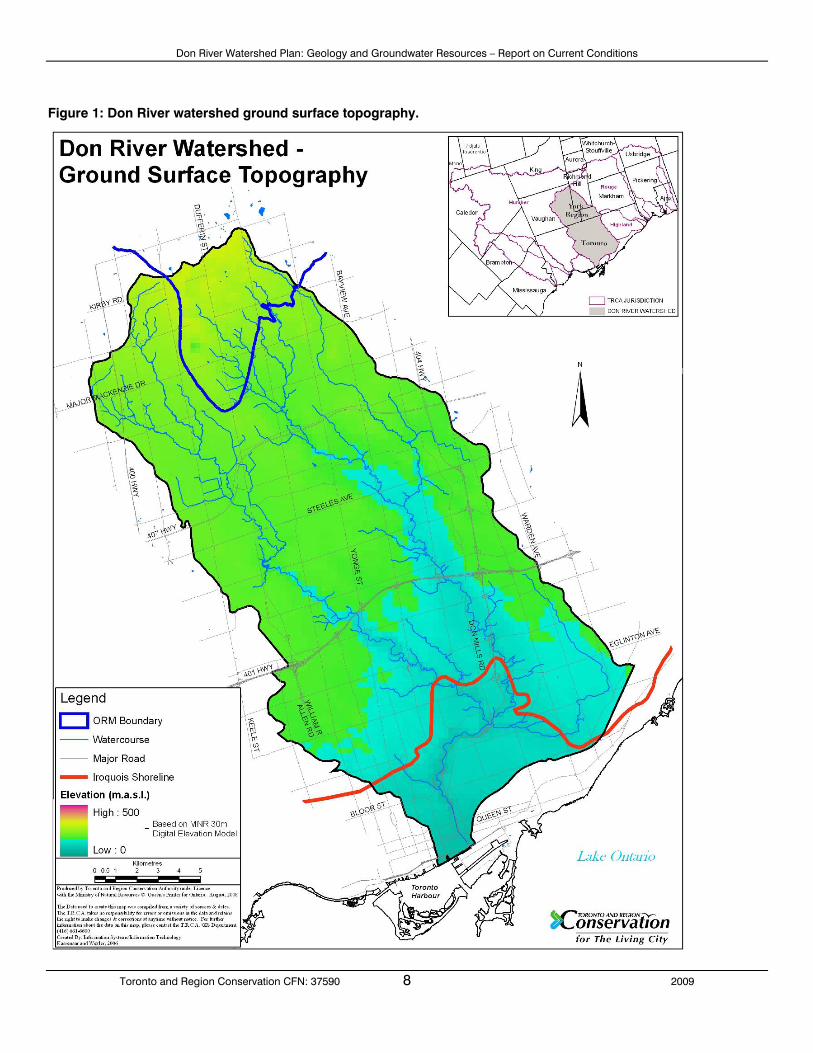
Evapotranspiration (a) Mean Annual Potential - moraine 584 mm Mean Annual Potential - Lake Ontario Shore 610 mm Mean Annual Actual 533 mm Water Surplus during periods of soil moisture capacity (a) Along moraine highlands 279 mm Along the north and south flanks of the moraine 330 mm. Data sources - (a) Brown et al., 1980 and (b) Phillips and McCulloch, 1972. The longest recording precipitation gauge is located in Toronto (Station# 6158350 in the Queen’s Park area, immediately west of the lower Humber / Don River watershed boundary), operating continuously since the mid-1840’s. Total annual precipitation values and year-to-year variations in amounts recorded at this station are of principal of interest within Figure 3. The average total precipitation recorded is 816 mm/yr with maximum and minimum amounts of 1235 and 607 mm/yr respectively.
4.0 Geology The geology of the study area generally consists of Quaternary sediments infilling a fluvial valley system incised upon the bedrock surface. This bedrock valley system drained the upper Great Lakes basin to the St. Lawrence River. The sediments overlying bedrock consist of a sequence of glacial and interglacial (lacustrine/fluvial) units recording deposition over approximately the last 135,000 years. This sedimentary package ranges in thickness from zero (bedrock outcrop) to 270 meters within the Laurentian bedrock valley system. The three main geologic features present within the Don River watershed include:
• The bedrock valley system; • The Oak Ridges Moraine; and • Areas of in-filling of eroded Quaternary sediments.
The various geologic deposits and their characteristics will be described in more detail in subsequent sections. It should be noted that there is still some disagreement and considerable discussion and research regarding the stratigraphy present within the study area. Historical work (e.g. White, 1975; Karrow, 1967) is still being re-interpreted by various groups including the OGS and the GSC (e.g. Barnett et al., 1998; Sharpe et al., 2004).
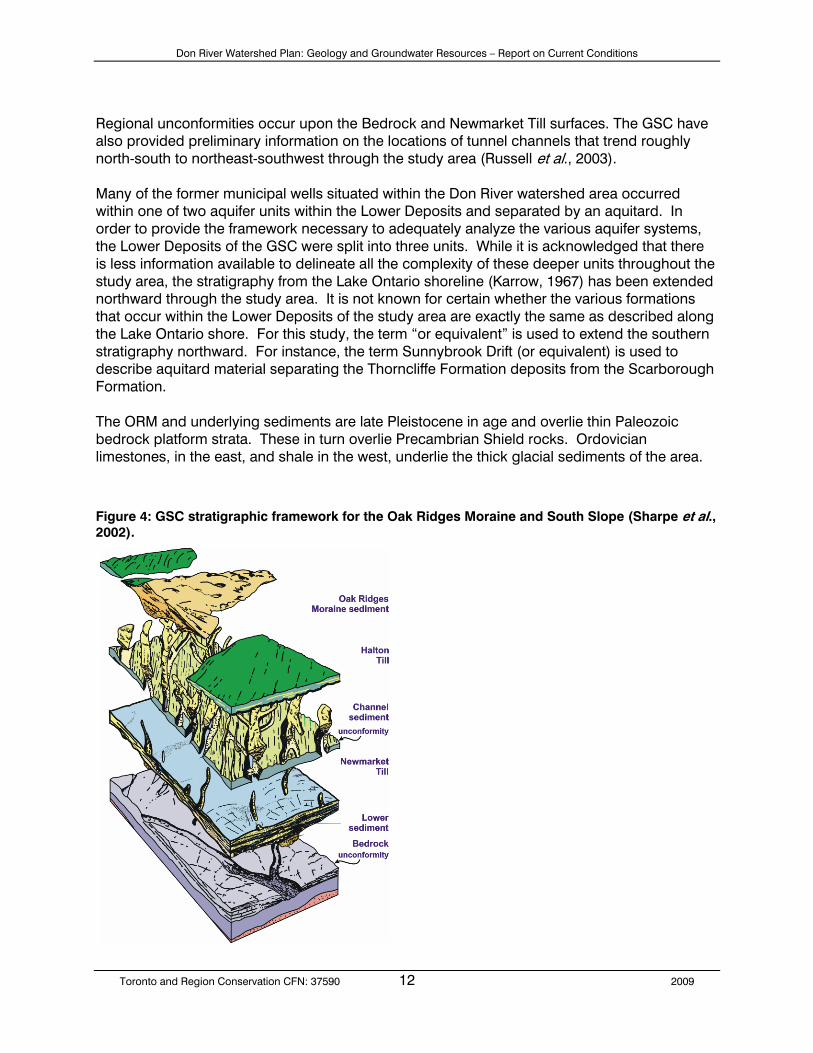
4.1 Stratigraphic Framework The stratigraphic framework for the study area is well established from previous work (Karrow, 1967; White, 1975; Sharpe et al., 1999). The GSC has constructed an initial version of three-dimensional geologic surfaces which group the pertinent geological deposits into five units, as presented in Figure 4, which include:
• Halton Till (youngest; Russell et al., 2002a) • Oak Ridges Moraine Deposits (Russell et al., 2002b) • Newmarket Till (Sharpe et al., 2002a) • Lower Deposits (Sharpe et al., 2002b) • Bedrock (oldest; Brennand et al., 1997).
Don River Watershed Plan: Geology and Groundwater Resources – Report on Current Conditions
Toronto and Region Conservation CFN: 37590 12 2009
Regional unconformities occur upon the Bedrock and Newmarket Till surfaces. The GSC have also provided preliminary information on the locations of tunnel channels that trend roughly north-south to northeast-southwest through the study area (Russell et al., 2003). Many of the former municipal wells situated within the Don River watershed area occurred within one of two aquifer units within the Lower Deposits and separated by an aquitard. In order to provide the framework necessary to adequately analyze the various aquifer systems, the Lower Deposits of the GSC were split into three units. While it is acknowledged that there is less information available to delineate all the complexity of these deeper units throughout the study area, the stratigraphy from the Lake Ontario shoreline (Karrow, 1967) has been extended northward through the study area. It is not known for certain whether the various formations that occur within the Lower Deposits of the study area are exactly the same as described along the Lake Ontario shore. For this study, the term “or equivalent” is used to extend the southern stratigraphy northward. For instance, the term Sunnybrook Drift (or equivalent) is used to describe aquitard material separating the Thorncliffe Formation deposits from the Scarborough Formation. The ORM and underlying sediments are late Pleistocene in age and overlie thin Paleozoic bedrock platform strata. These in turn overlie Precambrian Shield rocks. Ordovician limestones, in the east, and shale in the west, underlie the thick glacial sediments of the area.
Figure 4: GSC stratigraphic framework for the Oak Ridges Moraine and South Slope (Sharpe et al., 2002).
Don River Watershed Plan: Geology and Groundwater Resources – Report on Current Conditions
Toronto and Region Conservation CFN: 37590 13 2009
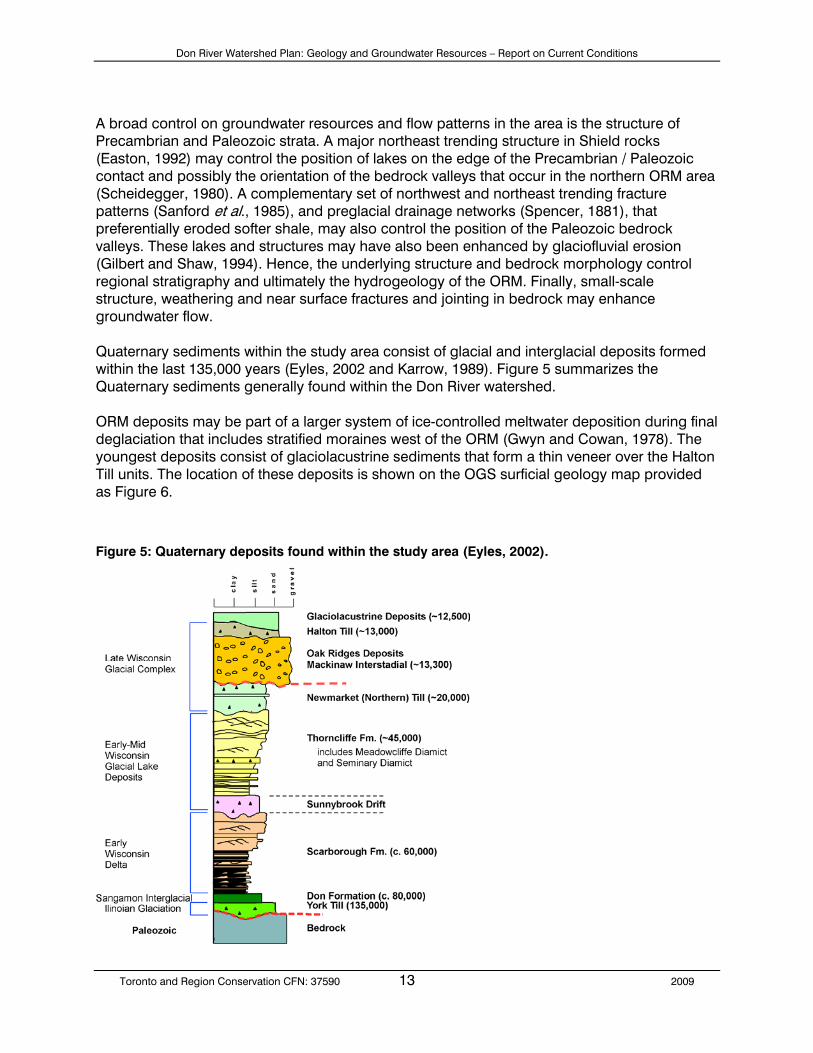
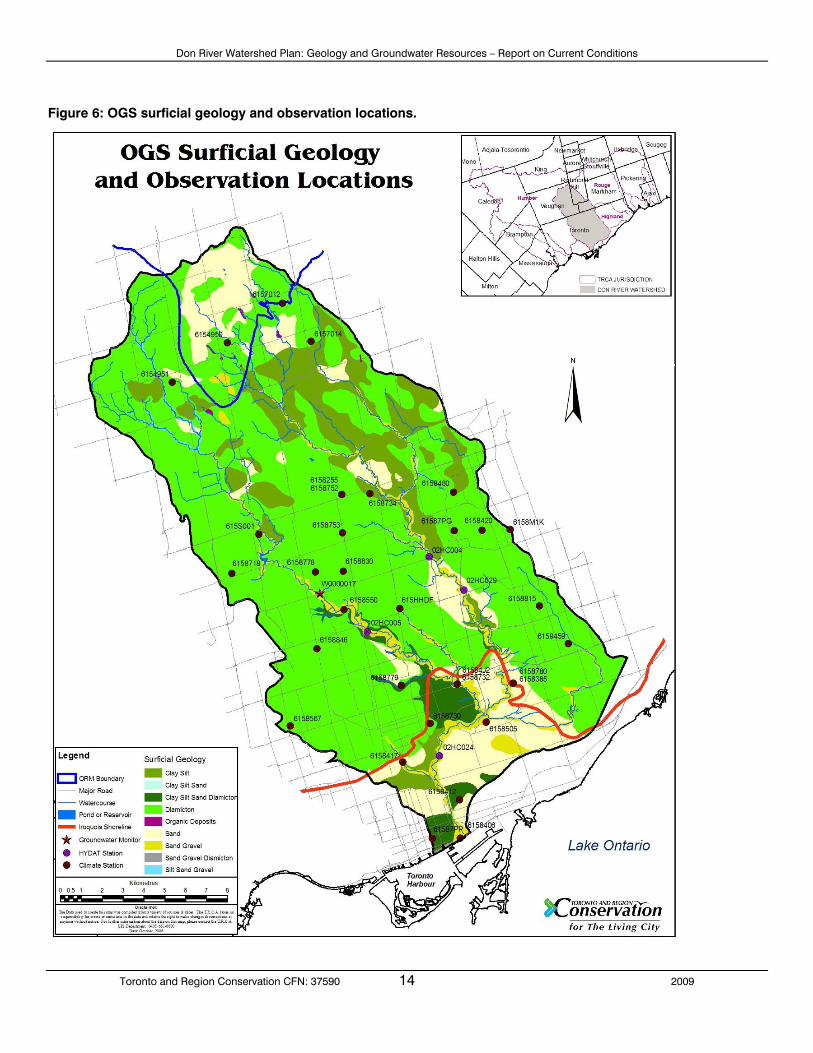
A broad control on groundwater resources and flow patterns in the area is the structure of Precambrian and Paleozoic strata. A major northeast trending structure in Shield rocks (Easton, 1992) may control the position of lakes on the edge of the Precambrian / Paleozoic contact and possibly the orientation of the bedrock valleys that occur in the northern ORM area (Scheidegger, 1980). A complementary set of northwest and northeast trending fracture patterns (Sanford et al., 1985), and preglacial drainage networks (Spencer, 1881), that preferentially eroded softer shale, may also control the position of the Paleozoic bedrock valleys. These lakes and structures may have also been enhanced by glaciofluvial erosion (Gilbert and Shaw, 1994). Hence, the underlying structure and bedrock morphology control regional stratigraphy and ultimately the hydrogeology of the ORM. Finally, small-scale structure, weathering and near surface fractures and jointing in bedrock may enhance groundwater flow. Quaternary sediments within the study area consist of glacial and interglacial deposits formed within the last 135,000 years (Eyles, 2002 and Karrow, 1989). Figure 5 summarizes the Quaternary sediments generally found within the Don River watershed. ORM deposits may be part of a larger system of ice-controlled meltwater deposition during final deglaciation that includes stratified moraines west of the ORM (Gwyn and Cowan, 1978). The youngest deposits consist of glaciolacustrine sediments that form a thin veneer over the Halton Till units. The location of these deposits is shown on the OGS surficial geology map provided as Figure 6.
Figure 5: Quaternary deposits found within the study area (Eyles, 2002).
Don River Watershed Plan: Geology and Groundwater Resources – Report on Current Conditions
Toronto and Region Conservation CFN: 37590 14 2009
Figure 6: OGS surficial geology and observation locations.
Don River Watershed Plan: Geology and Groundwater Resources – Report on Current Conditions
Toronto and Region Conservation CFN: 37590 15 2009
4.2 Geologic Units The following subsections describe the physical properties and depositional environments of the rock and soil formations that underlie the Don River watershed. The water-bearing characteristics of these formations, some classified as aquifers and others as aquitards, are discussed in Section 5.1 - Hydrostratigraphy.
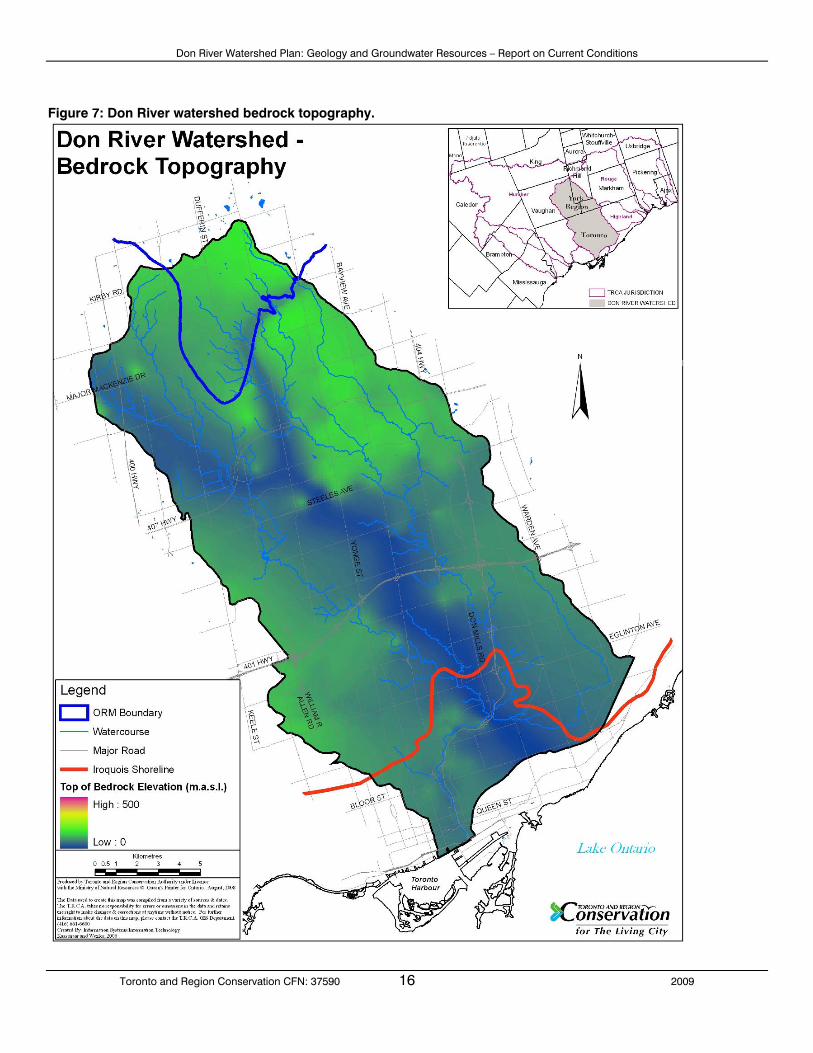
4.2.1 Bedrock Bedrock within the study area consists of shale of the Upper Ordovician Georgian Bay Formation. These rocks are between 505 and 438 million years old and were deposited in an ancient sea. The bedrock surface declines to the south from an elevation of about 170 masl beneath the Oak Ridges moraine to approximately 40 masl at Lake Ontario. These Ordovician shales, which also include limestone interbeds, lie upon PreCambrian shield rocks 1.45 to 1.1 billion years old that are at least 70 km thick. The bedrock surface has been deeply eroded forming valleys. The valleys were subsequently infilled with sediments, thus becoming buried valleys. The best documented of these buried valleys, the Laurentian Channel, extends from Georgian Bay to Lake Ontario (Spencer, 1881) and is buried by sediment up to 270 m thick. An updated bedrock topographic surface map has been generated (Earthfx, 2006) which includes the valleys associated with the former Laurentian River drainage system as depicted in Figure 7. The major channel of the Laurentian River valley (Figure 7) trends northwest near Maple and onward to Nobleton. A tributary branch off of the main channel near Maple, extends north and then northeast to drain the area near the Holland Marsh. The main channel outlet was interpreted to occur along the Lake Ontario shoreline, east of the Toronto Islands following the original Don River channel.
4.2.2 Pre-Wisconsinan Deposits The overburden thickness within the Don River watershed study area ranges from approximately 2 to 270 m as shown on Figure 8. These sediments are thinnest in the southern portion of the watershed while they thicken beneath areas of ground surface highs such as along the Oak Ridges Moraine, and over bedrock surface lows such as along the Laurentian bedrock valley system. The thickest overburden occurs where these two features (the main bedrock valley and the ORM) cross in the Elgin Mills and Yonge Street area of Richmond Hill as depicted in reddish orange on Figure 8. York Till The York Till, the oldest known glacial sediment in southern Ontario (Eyles, 2002; Barnett, 1992) occurs only sporadically and is believed to be preserved in depressions upon the bedrock surface. Given the discontinuous nature of this dark grey, sandy silt deposit and the paucity of deep borehole data within the Don watershed, the York Till has not been mapped for this study.
Don River Watershed Plan: Geology and Groundwater Resources – Report on Current Conditions
Toronto and Region Conservation CFN: 37590 16 2009
Figure 7: Don River watershed bedrock topography.

Don River Watershed Plan: Geology and Groundwater Resources – Report on Current Conditions
Toronto and Region Conservation CFN: 37590 17 2009
Figure 8: Don River watershed overburden thickness.

Don River Watershed Plan: Geology and Groundwater Resources – Report on Current Conditions
Toronto and Region Conservation CFN: 37590 18 2009
Don Formation The Don Formation, like the York Till, is only rarely preserved within southern Ontario and was observed as an outcrop in the Don Valley Brickyards (Eyles and Clark, 1988). Described as alternating beds of fossil-containing sand and mud, the Don Formation was not mapped in this study due to the discontinuous nature of this deposit and the paucity of deep borehole data.
4.2.3 Wisconsinan Deposits Scarborough Formation (Aquifer) The Scarborough Formation marks the start of the Wisconsinan glaciation which started approximately 70,000 to 90,000 years ago. The Scarborough Formation deposits are interpreted as a fluvial-deltaic system fed by large braided melt-water rivers draining from an ice sheet. These rivers deposited organic-rich (peat) sands over silts and clays (Karrow, 1967; Eyles, 1997). The lower silts and clays are about 5.2 meters thick at the Don Valley Brickyard. The upper sands are channelized in some locations, possibly as a result of fluvial erosion due to fluctuating lake levels. Scarborough Formation deposits are believed to extend from the Lake Ontario shore northward towards Lake Simcoe (Fligg and Rodrigues, 1983; Eyles et al., 1985; Pugin et al., 1996; Sharp et al., 1996). Figure 9 illustrates the interpreted thickness of the Scarborough Formation and older sediments where they occur. This water-bearing formation is found in appreciable thickness in the bedrock valleys. Sunnybrook Drift (Aquitard) The Sunnybrook Drift unit was deposited in close proximity to an ice sheet as it finally reached the Don River watershed about 45,000 years ago. The Sunnybrook Drift is interpreted to be a clast-poor mud (silt and clay) deposited on the floor of a glacially dammed lake approximately 100 m deeper than the modern Lake Ontario (Eyles, 2002). Boulders and pebbles are rare and are interpreted to result from melting icebergs. The Sunnybrook Drift within the Don River watershed is generally less than 10 to 20 m thick but thickens over lows upon the underlying layers Thorncliffe Formation (Aquifer) The Thorncliffe Formation deposits represent glaciofluvial deposition of sand and silty sand in the low lying areas of the underlying deposits. Further to the south, the formation comprises predominantly glaciolacustrine deposits of silt, sand and pebbly silt and clay deposited by glacial meltwaters entering a deep, ice-dammed ancestral Lake Ontario. This unit was deposited approximately 45,000 years ago (30,000 to 50,000 years ago; Barnett, 1992).

Don River Watershed Plan: Geology and Groundwater Resources – Report on Current Conditions
Toronto and Region Conservation CFN: 37590 19 2009
Figure 9: Scarborough Formation (Aquifer) thickness.
Don River Watershed Plan: Geology and Groundwater Resources – Report on Current Conditions
Toronto and Region Conservation CFN: 37590 20 2009
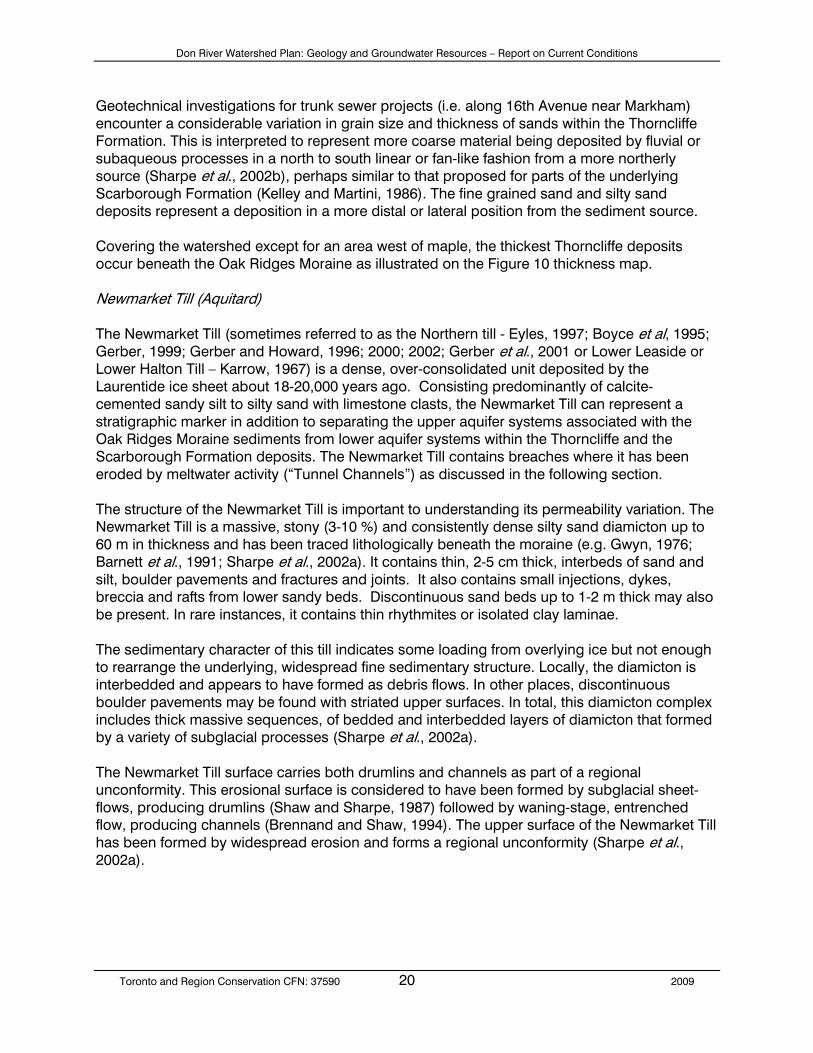
Geotechnical investigations for trunk sewer projects (i.e. along 16th Avenue near Markham) encounter a considerable variation in grain size and thickness of sands within the Thorncliffe Formation. This is interpreted to represent more coarse material being deposited by fluvial or subaqueous processes in a north to south linear or fan-like fashion from a more northerly source (Sharpe et al., 2002b), perhaps similar to that proposed for parts of the underlying Scarborough Formation (Kelley and Martini, 1986). The fine grained sand and silty sand deposits represent a deposition in a more distal or lateral position from the sediment source. Covering the watershed except for an area west of maple, the thickest Thorncliffe deposits occur beneath the Oak Ridges Moraine as illustrated on the Figure 10 thickness map. Newmarket Till (Aquitard) The Newmarket Till (sometimes referred to as the Northern till - Eyles, 1997; Boyce et al, 1995; Gerber, 1999; Gerber and Howard, 1996; 2000; 2002; Gerber et al., 2001 or Lower Leaside or Lower Halton Till – Karrow, 1967) is a dense, over-consolidated unit deposited by the Laurentide ice sheet about 18-20,000 years ago. Consisting predominantly of calcite-cemented sandy silt to silty sand with limestone clasts, the Newmarket Till can represent a stratigraphic marker in addition to separating the upper aquifer systems associated with the Oak Ridges Moraine sediments from lower aquifer systems within the Thorncliffe and the Scarborough Formation deposits. The Newmarket Till contains breaches where it has been eroded by meltwater activity (“Tunnel Channels”) as discussed in the following section. The structure of the Newmarket Till is important to understanding its permeability variation. The Newmarket Till is a massive, stony (3-10 %) and consistently dense silty sand diamicton up to 60 m in thickness and has been traced lithologically beneath the moraine (e.g. Gwyn, 1976; Barnett et al., 1991; Sharpe et al., 2002a). It contains thin, 2-5 cm thick, interbeds of sand and silt, boulder pavements and fractures and joints. It also contains small injections, dykes, breccia and rafts from lower sandy beds. Discontinuous sand beds up to 1-2 m thick may also be present. In rare instances, it contains thin rhythmites or isolated clay laminae. The sedimentary character of this till indicates some loading from overlying ice but not enough to rearrange the underlying, widespread fine sedimentary structure. Locally, the diamicton is interbedded and appears to have formed as debris flows. In other places, discontinuous boulder pavements may be found with striated upper surfaces. In total, this diamicton complex includes thick massive sequences, of bedded and interbedded layers of diamicton that formed by a variety of subglacial processes (Sharpe et al., 2002a). The Newmarket Till surface carries both drumlins and channels as part of a regional unconformity. This erosional surface is considered to have been formed by subglacial sheet-flows, producing drumlins (Shaw and Sharpe, 1987) followed by waning-stage, entrenched flow, producing channels (Brennand and Shaw, 1994). The upper surface of the Newmarket Till has been formed by widespread erosion and forms a regional unconformity (Sharpe et al., 2002a).

Don River Watershed Plan: Geology and Groundwater Resources – Report on Current Conditions
Toronto and Region Conservation CFN: 37590 21 2009
Figure 10: Thorncliffe Formation (Aquifer) thickness.

Don River Watershed Plan: Geology and Groundwater Resources – Report on Current Conditions
Toronto and Region Conservation CFN: 37590 22 2009
Hydrogeologic investigations conducted by MM Dillon Limited (1990), the Interim Waste Authority (994a-e) and continued by Gerber (1999; Gerber and Howard, 1996; 2000; Gerber et al., 2001) suggest that bulk hydraulic conductivity (K) of the Newmarket Till is controlled by structures or pathways as conceptualized in Figure 11 (Gerber et al., 2001). Horizontal pathways include sand and gravel interbeds and boulder pavements marking erosional surfaces identified in Newmarket Till outcrops and in shallow seismic reflection profiles (Boyce et al., 1995). Vertical pathways include fractures, sand dykes and steeply-dipping shear surfaces. Vertical leakage through the Newmarket Till to the underlying Thorncliffe Formation is estimated at 30-40 mm/yr on a regional basis. The amount of vertical leakage will obviously differ where the till has been removed by meltwater erosion (“tunnel channels”) and will depend on the channel infill sediments.
Figure 11: Conceptual model of the internal architecture of the Newmarket Till (aka Northern Till) Aquitard (Gerber et al., 2001).
B
THORNCLIFFE FORMATION (AQUIFER)
FRACTURES
SAND DIKES
INTERBED
INTERBED
DIAMICT BED
BOULDER PAVEMENT
SAND LENSE
INCLUSIONS
groundwater flow path
ANORTHERN TILL (AQUITARD)
SAND/GRAVELINTERBEDS
BASALDEFORMEDZONE
DIAMICTBEDS (TILL)
FRACTURESAND JOINTS
While it can exist up to approximately 60 m thick locally, the Newmarket Till is generally about 20-30 m thick as displayed on the Figure 12 thickness map. The till has been eroded in parts of the northern watershed that correspond to locations of interpreted tunnel channels where meltwater flow has eroded down through the Newmarket Till into underlying sediments. Regional Unconformity (“Tunnel Channels”) An interpreted network of south-southwest-oriented channels (Kassenaar and Wexler, 2006) has been cut into or through the Newmarket Till. These channels have been located, extended and refined from information provided in Russell et al. (2003) and from the elevation of ground surface topography north of the Oak Ridges Moraine. The surface expression of these channels disappears beneath the ORM but re-emerges in the watershed regions north of the TRCA (NVCA, LSRCA). Mapping and drilling (Barnett, 1993), and seismic reflection profiling (Pugin et al., 1996) show that tunnel channels continue beneath the ORM. The tunnel channels
Don River Watershed Plan: Geology and Groundwater Resources – Report on Current Conditions
Toronto and Region Conservation CFN: 37590 23 2009
are, in places, confined within the Newmarket Till, but in others, have eroded through it into lower sediments. The channels at surface are 1-4 km wide and tens of meters deep. The channels mainly contain sandy sediments; however, some channels contain thick (10 to15 m), cross-bedded gravels (Shaw and Gorrell, 1991; Pugin et al., 1999; Russell et al., 2002). The channel network is attributed to subglacial floods (e.g. Barnett, 1990; Shaw and Gilbert, 1990; Russell et al., 2002). These channels may be hydrogeologically significant as high yield aquifers (Sharpe et al., 1996) or, depending on channel infill, will affect the amount of leakage between upper aquifers associated with the Oak Ridges Moraine and deeper aquifers situated within the Thorncliffe and the Scarborough Formation units. Of the three major channel systems interpreted to exist within the larger TRCA jurisdiction, a north-northeast to south-southwest trending channel clips the northwest corner of the Don River watershed as depicted in Figure 13. This tunnel channel otherwise, termed the Oak Ridges Channel, trends south-southwest through Newmarket and Aurora, east of King City, through Maple and appears to join the westerly Nobleton Channel near Woodbridge. Oak Ridges Moraine (ORM) Deposits (Aquifer) Early work on the ORM has been summarized by Duckworth (1979), Gwyn and Cowan (1978) and Chapman (1985). Groundwater studies have relied on analysis of water wells, earlier geologic mapping (e.g. Deane, 1950), and later work by the Ontario Geological Survey (Watt, 1957; 1968; Karrow, 1967). This geologic mapping was important for regional hydrogeological assessments by Haefeli (1970), the Ontario Ministry of Environment (MOE) (Turner, 1977; 1978; Sibul et al., 1977; Ostry, 1979) and others (e.g. Howard and Beck, 1986; Howard et al., 1997). Much of this earlier geologic work has been updated by the GSC (Russell et al., 2002b). The ORM is a regionally extensive stratified sediment complex 160 km long and 5 to 20 km wide. The ORM may reach thicknesses of 150 m in the subsurface, particularly beneath younger till sediments which flank the moraine. The lower contact of the ORM sits on the Newmarket Till and lower sediments. ORM sediments occur primarily within fan-shaped bodies on the scale of 10 to100 m thick, 100 to 5,000 m long and 10 to1000 m wide. These sediments are arranged from coarse to fine in a down flow direction and vertically up section. Core logging shows that moraine sediments may consist of 2-3 fining-upward sequences (Gilbert, 1997; Russell et al., 1997). Rhythmically interbedded fine sands and silts are the dominant sediments, but coarse, diffusely-bedded sands and heterogeneous gravels are prominent locally, at the apex of fans and at depth in channels. Clay laminae are also present locally. The deposits are interpreted as glaciofluvial, transitional to glaciolacustrine subaqueous fan, and delta sediments. They are believed to have been deposited in a glacial lake ponded between two glacial ice lobes (Simcoe and Ontario Lobes) and the Niagara Escarpment to the west about 12-13,000 years ago.

Don River Watershed Plan: Geology and Groundwater Resources – Report on Current Conditions
Toronto and Region Conservation CFN: 37590 24 2009
Figure 12: Newmarket Till (Aquitard) thickness.

Don River Watershed Plan: Geology and Groundwater Resources – Report on Current Conditions
Toronto and Region Conservation CFN: 37590 25 2009
Figure 13: Interpreted tunnel channel location.

Don River Watershed Plan: Geology and Groundwater Resources – Report on Current Conditions
Toronto and Region Conservation CFN: 37590 26 2009
Figure 14 presents the thickness of the Oak Ridges Moraine deposits. Note that on this figure the channel fill deposits are lumped in with the Oak Ridges Moraine sediments leading to an exaggerated thickness for this unit in some locations. Generally, the Oak Ridges Moraine deposits are less than 90 m thick, and thin along the south flank of the moraine where they are covered by surface tills. The extent of the ORM sediments within the subsurface along the flanks is more extensive than mapped by Turner (1978). The borehole and water well record database show the presence of significant sand bodies, although they are not present everywhere, between the underlying Newmarket Till and overlying Halton Till. Halton Till (Aquitard) The latest glacial ice advance over the southern part of the study area occurred from the Lake Ontario Basin about 13,000 years ago and resulted in the deposition of the Halton Till from the Lake Ontario ice. The Halton Till is typically 3 to 6 m thick but locally in the northwest corner of the Don River watershed, it attains of thickness of about 40 meters as shown on Figure 15 . The Halton till is texturally variable but is generally a sandy silt to clayey silt till interbedded with silt, clay, sand and gravel (Russell et al., 2002). In some areas it is very clay-rich where the Halton ice has overridden glaciolacustrine deposits. In this study, the Halton Till is believed to form the surficial till unit extending southward to the Lake Iroquois shoreline. This interpretation extends the till further south than the GSC interpretation (Russell et al., 2002a). On the southern flanks of the Oak Ridges Moraine, the Halton Till has overridden the granular Oak Ridges Moraine deposits extending as far north as Oak Ridges in Richmond Hill. Surficial Glaciolacustrine Deposits The uppermost regionally significant surficial geologic unit consists of a sequence of glaciolacustrine deposits that form a veneer over the underlying Halton and Newmarket tills. These deposits vary from near shore sands and gravel beach deposits of the Lake Iroquois shoreline located within the southern part of the study area, to the fine sands, silts and clays of glaciolacustrine pondings that occur north of the Lake Iroquois shoreline. These sediments generally form a thin veneer over the underlying deposits, although locally they can be several meters thick. These units represent local ponding of water, or higher water levels in Lake Ontario and Lake Simcoe, following retreat of the glaciers approximately 12,500 years ago. For example, Glacial Lake Iroquois (ancestral Lake Ontario) water levels were at least 40 to 60 m higher than present due to ice blockage and damming of water along the St. Lawrence River (Anderson and Lewis, 1985; Eyles, 1997). Shoreline elevations are slowly changing as a result of postglacial glacio-isostatic rebound (Eyles, 1997).

Don River Watershed Plan: Geology and Groundwater Resources – Report on Current Conditions
Toronto and Region Conservation CFN: 37590 27 2009
Figure 14: Oak Ridges Moraine deposit (Aquifer) thickness.

Don River Watershed Plan: Geology and Groundwater Resources – Report on Current Conditions
Toronto and Region Conservation CFN: 37590 28 2009
Figure 15: Halton Till (Aquitard) thickness.
Don River Watershed Plan: Geology and Groundwater Resources – Report on Current Conditions
Toronto and Region Conservation CFN: 37590 29 2009
5.0 Hydrogeology This section builds on the geologic framework provided in the previous section and describes the present understanding of how water flows through the various geologic units. The discussion in this section starts with a description of the hydrostratigraphic framework and then describes how groundwater enters the ground surface or study area (recharge), how this water moves through the subsurface and where groundwater leaves the subsurface or intersects with the ground surface (groundwater discharge). Also included in this section are brief descriptions of the available groundwater quality data, attempts to determine vulnerability of aquifers to contamination, and the development of a tool, a numerical groundwater flow model, to help quantify and understand the groundwater flow system.
5.1 Hydrostratigraphy Hydrostratigraphy is different than the geologic stratigraphy in that hydrostratigraphic layers represent a classification of the geologic units into aquifers or aquitards, and also combines geologic units with similar hydraulic properties into a single unit. The hydrostratigraphic classification for this study is included in Table 1.
Table 1: Hydrostratigraphic Units.
Geologic Unit Hydrostratigraphic Unit Aquifers Aquitards Glaciolacustrine and Recent Sediments
Halton Till Halton Aquitard Oak Ridges Moraine/Mackinaw Interstadial
Oak Ridges Aquifer Complex
Tunnel Channel infill Channel Aquifer Complex Channel Aquitard Newmarket Till Newmarket Aquitard Thorncliffe Formation Thorncliffe Aquifer Complex Sunnybrook Drift Sunnybrook Aquitard Scarborough Formation Scarborough Aquifer Complex Don Formation York Till Bedrock As with the geologic units, all hydrostratigraphic units are not present everywhere throughout the study area. The present Scarborough Aquifer Complex includes local occurrences of York Till, Don Formation, and Scarborough Formation sand and clay deposits. In other words, all sediments present within the Scarborough Aquifer Complex are not strictly aquifer material. These deposits are presently lumped together due to the paucity of deep borehole information. The hydrostratigraphic interpretation for the study area includes three aquifer systems – the Oak Ridges, Thorncliffe and Scarborough Aquifer Complexes. Table 1 includes the Channel Aquifer Complex which includes sand and gravel tunnel channel infill. Tunnel Channels are believed to be eroded into or through the Newmarket Aquitard. In most instances, this Channel Aquifer Complex is in hydraulic communication with the Thorncliffe Aquifer Complex and can be envisioned as a different hydraulic conductivity characteristic of the Thorncliffe Aquifer

Don River Watershed Plan: Geology and Groundwater Resources – Report on Current Conditions
Toronto and Region Conservation CFN: 37590 30 2009
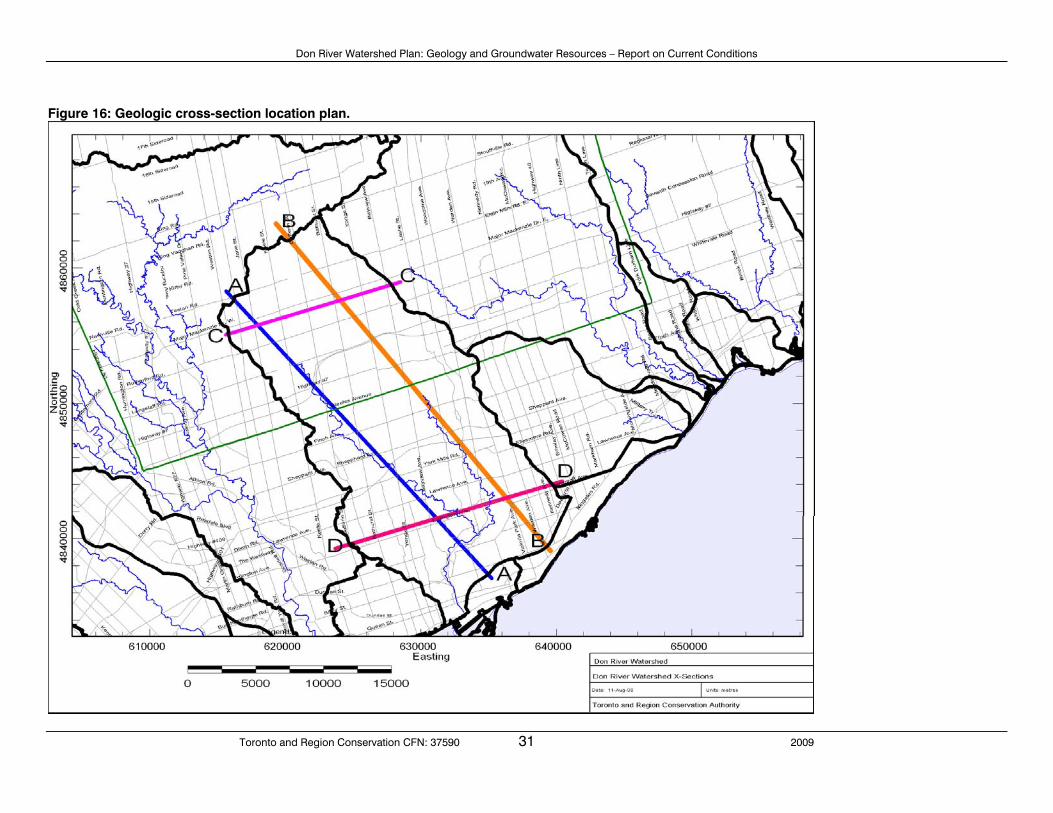
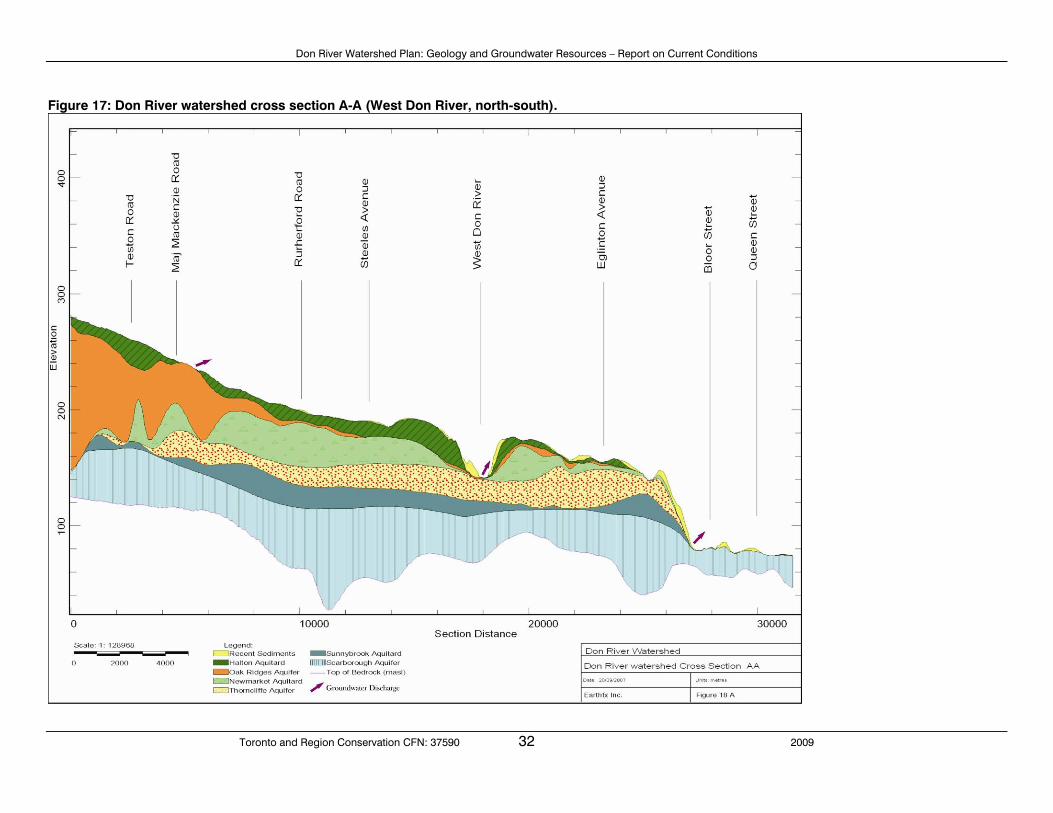
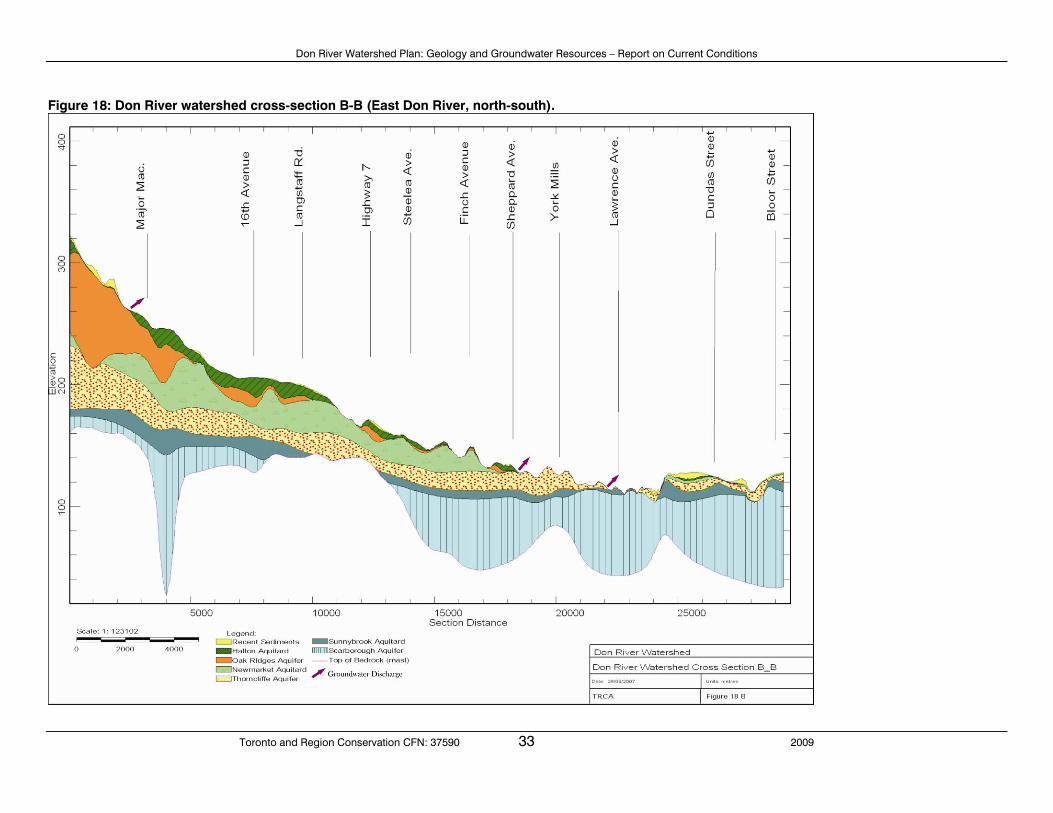
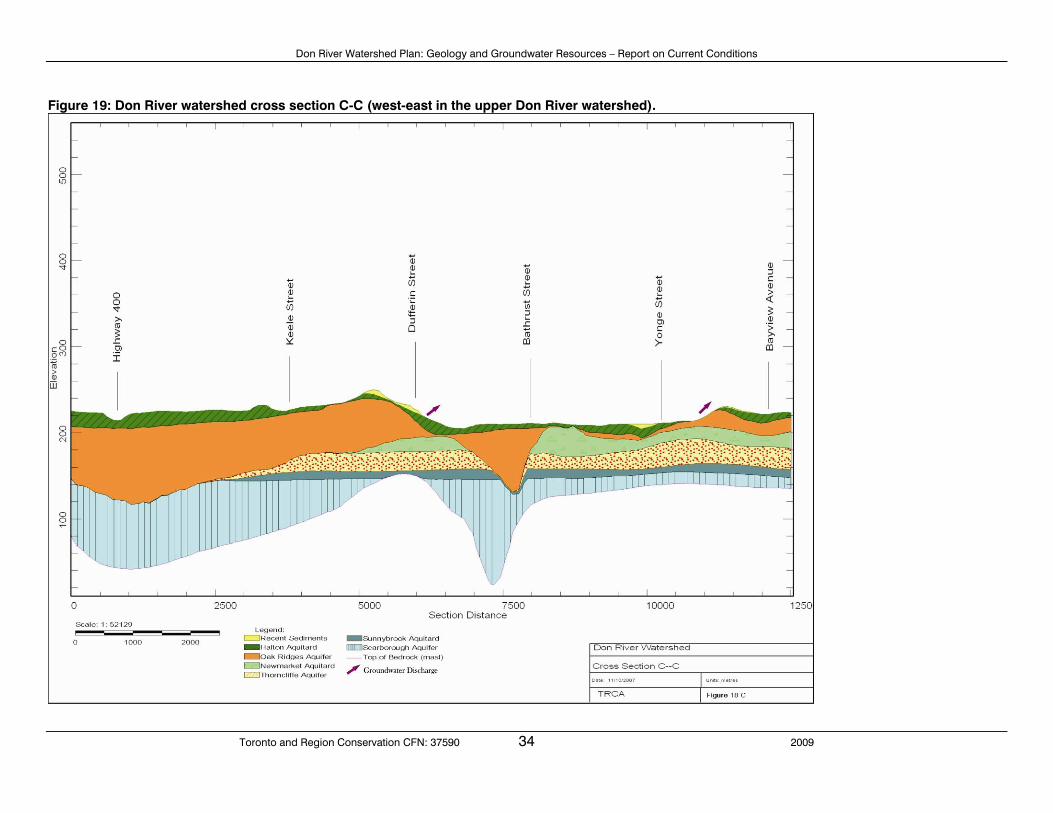
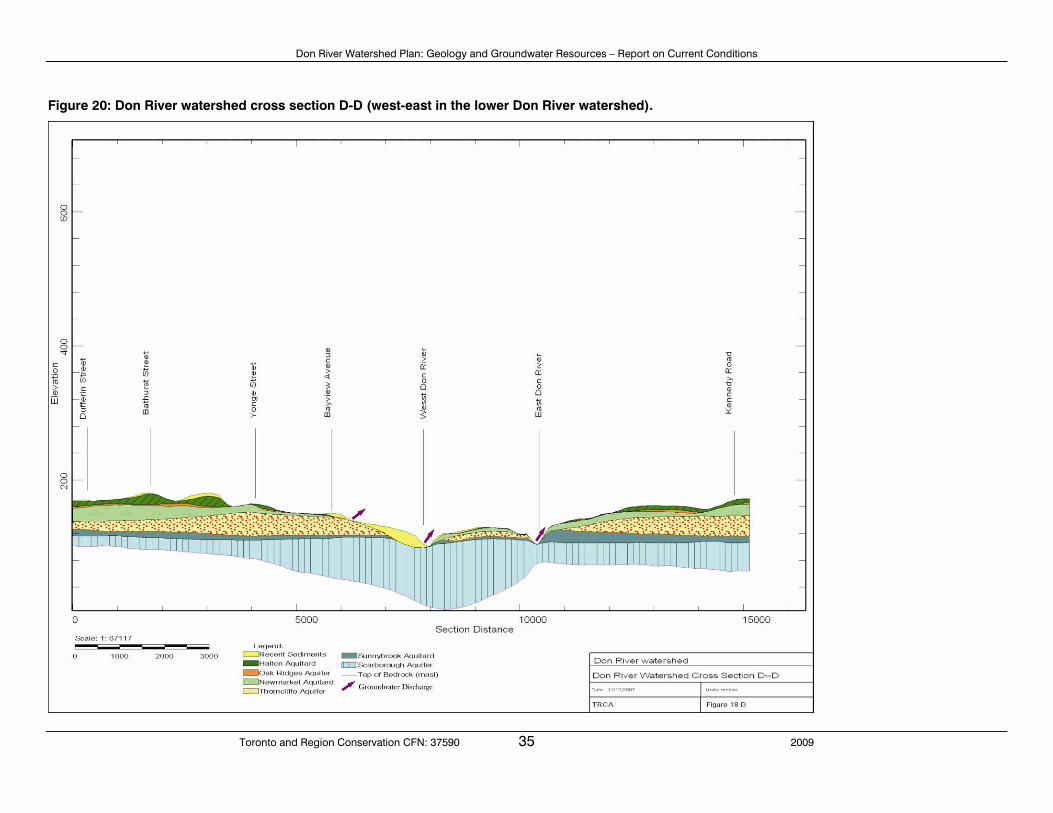
Complex. The Channel Aquitard is largely comprised of silt or clay within the tunnel channel infill package and is believed to provide some degree of hydraulic separation between the Oak Ridges Aquifer Complex and the underlying Thorncliffe Aquifer Complex. Figure 16 presents the location plan of four hydrogeological cross-sections within the Don River watershed with two oriented in a northwest - southeast direction (Figure 17 and Figure 18) and two in a west-southwest - east-northeast direction (Figure 19 and Figure 20). The layering of the overburden sediments are depicted draped over the underlying bedrock surface.
5.1.1 North-South Cross Section A-A The north-south cross section A-A through the West Don River, as shown in Figure 17, stretches from Highway 400 at Teston Road in Vaughan to the area of Pape and Danforth Avenues in Toronto. The Halton Aquitard (Till) caps the Oak Ridges Aquifer southward from Teston to at least Steeles Avenue, except for a portion just south of Major Mackenzie Drive. As the Oak Ridges Aquifer thins around Steeles Avenue, the Halton Aquitard lies, in general, directly on the Newmarket Aquitard (Till) to south of Eglinton Avenue, except where relatively thin, discontinuous pockets of Oak Ridges Aquifer are sandwiched between the two till sheets. The Halton Aquitard unit disappears south of Eglinton where the Newmarket Aquitard separates the overlying Recent Sediments and the underlying Thorncliffe Aquifer to just north of Bloor Street. From Bloor Street southward, the Recent Sediments (associated with the former Lake Iroquois shoreline deposits) directly overlie the Scarborough Aquifer. The Thorncliffe Aquifer (yellow with red stippling on the above-mentioned figure), confined by the overlying Newmarket Aquitard and the underlying Sunnybrook Aquitard, stretches from north of Major Mackenzie Drive to pinch out just north of Bloor Street. The Scarborough Aquifer, which is overlain by the Sunnybrook Aquitard and lays directly on bedrock shale, stretches the length of the cross-section. Groundwater discharge occurs particularly where the aquifer units are exposed at surface such as south of Major Mackenzie Drive, the West Don River (between Steeles and Eglinton) and from just north of Bloor Street.
5.1.2 North-South Cross Section B-B The north-south cross section B-B through the East Don River, as presented in Figure 18, stretches from around Kirby Road at Dufferin Street in Vaughan to the area of Warden Avenue at Danforth Avenue in Toronto. Discontinuous portions of Halton Aquitard (Till) overlie the Oak Ridges Aquifer and stretch southward from Kirby at Dufferin to just south of Langstaff Road. Isolated stretches of Halton Aquitard (Till) at surface occur south of Highway 7 to just south of Langstaff Road. The Newmarket Aquitard underlies the Oak Ridges Aquifer deposits from north of Major Mackenzie Drive to north of Sheppard Avenue, except where the Oak Ridges Aquifer is absent.
Don River Watershed Plan: Geology and Groundwater Resources – Report on Current Conditions
Toronto and Region Conservation CFN: 37590 31 2009
Figure 16: Geologic cross-section location plan.
Don River Watershed Plan: Geology and Groundwater Resources – Report on Current Conditions
Toronto and Region Conservation CFN: 37590 32 2009
Figure 17: Don River watershed cross section A-A (West Don River, north-south).
Don River Watershed Plan: Geology and Groundwater Resources – Report on Current Conditions
Toronto and Region Conservation CFN: 37590 33 2009
Figure 18: Don River watershed cross-section B-B (East Don River, north-south).
Don River Watershed Plan: Geology and Groundwater Resources – Report on Current Conditions
Toronto and Region Conservation CFN: 37590 34 2009
Figure 19: Don River watershed cross section C-C (west-east in the upper Don River watershed).
Don River Watershed Plan: Geology and Groundwater Resources – Report on Current Conditions
Toronto and Region Conservation CFN: 37590 35 2009
Figure 20: Don River watershed cross section D-D (west-east in the lower Don River watershed).
Don River Watershed Plan: Geology and Groundwater Resources – Report on Current Conditions
Toronto and Region Conservation CFN: 37590 36 2009
The Halton Aquitard directly overlies the Newmarket Aquitard in an area just south of Langstaff Road. The Thorncliffe Aquifer (yellow with red stippling in the above-mentioned figure), generally underlies the Newmarket Aquitard with surface exposures occurring south of Sheppard Avenue to south of Lawrence Avenue. An interconnection between the Oak Ridges Aquifer and the lower Thorncliffe Aquifer apparently exists at the most northern portion of this cross-section (north of Major Mackenzie Drive) where the Thorncliffe Aquitard is absent. The Sunnybrook Aquitard separates the overlying Thorncliffe Aquifer from the underlying Scarborough Aquifer, except in the area from Langstaff Road to Highway 7 where the Thorncliffe Aquifer lies directly on the bedrock shale. The Scarborough Aquifer lies beneath the Sunnybrook Aquitard and directly on the shale bedrock surface, except in the area south of 16th Avenue and Highway 7. A significant bedrock valley feature, infilled with Scarborough Aquifer sediments, occurs just south of Major Mackenzie Drive in the area of Bathurst Street. Groundwater discharge occurs particularly where the aquifer units are exposed at surface such as north of Major Mackenzie Drive, south of Sheppard Avenue and north of Lawrence Avenue.
5.1.3 West-East Cross Section C-C The west to east cross section C-C through the headwater are of the Don River, as depicted in Figure 19, stretches from Weston Road in Vaughan to slightly east of Bayview Avenue in Richmond Hill, parallel to and slightly south of Major Mackenzie Drive. The Halton Aquitard (Till) blankets the Oak Ridges Aquifer through the entire cross-section length, except where the Oak Ridges Aquifer surface exposures occur in the area about mid-way between Yonge Street and Bayview Avenue. The greatest thickness of the Oak Ridges Aquifer occurs in the Highway 400 area and thins eastward toward Bayview Avenue. An interpreted broad tunnel channel developed in the Highway 400 area where the Oak Ridges Aquifer cut through the Newmarket Aquitard (Till), the Thorncliffe Aquifer, and the Sunnybrook Aquitard, to directly overlie the lower Scarborough Aquifer. A segment of the Newmarket Aquitard that separates the overlying Oak Ridges Aquifer from the underlying Thorncliffe Aquifer (yellow with red stippling in the above-mentioned figure), extends from approximately mid-way between Keele and Dufferin Streets to about mid-way between Dufferin and Bathurst Streets. The Newmarket Aquitard continues eastward from Bathurst to beyond Bayview Avenue. The Thorncliffe Aquifer is sandwiched between the Newmarket and Sunnybrook Aquitards except where the Oak Ridges Aquifer directly overlies the Thorncliffe (area near Keele Street) and in an infilled valley feature west of Bathurst Street. The Sunnybrooke Aquitard separates the Thorncliffe Aquifer from the lower Scarborough Aquifer from slightly west of Keele Street to, at least, just east of Bayview Avenue, except near Dufferin Street where the Sunnybrook directly lies on the shale bedrock surface. Groundwater discharge occurs principally where the aquifer units are exposed at surface, such as between Yonge Street and Bayview Avenue. Groundwater seepage through the thin Halton

Don River Watershed Plan: Geology and Groundwater Resources – Report on Current Conditions
Toronto and Region Conservation CFN: 37590 37 2009
Aquitard and subsequently from the sand / silt Recent Sediments, occurs in the area east of Dufferin Street.
5.1.4 West-East Cross Section D-D The west-to-east cross section D-D through the southern portion of the Don River, as depicted in Figure 20, stretches from Dufferin Street east to Kennedy Road, parallel to and slightly north of Eglinton Avenue in Toronto. The Halton Aquitard (Till) covers a thin layer of the Oak Ridges Aquifer eastward from Dufferin Street to slightly east of Yonge Street. Isolated veneers of Recent Sediment occur on the Halton Aquitard west of Bathurst Street and on the elevated portion mid-way between Bathurst and Yonge Streets. To the west of Bayview Avenue, the Newmarket Aquitard (Till) overlies the Thorncliffe Aquifer (yellow with red stippling in the above-mentioned figure). The Thorncliffe Aquifer subcrops beneath the Recent Sediments between Bayview and to the west of the West Don River. The Sunnybrook Aquitard isolates the Thorncliffe from the lower Scarborough Aquifer westward from about mid-way between West Don River and Bayview Avenue. In the area between the West Don and the East Don Rivers, a descending sequence of thin intervals of Recent Sediments, Newmarket Aquitard, Thorncliffe Aquifer and Sunnybrook Aquitard cover the Scarborough Aquifer. A somewhat similar sequence of deposits developed east of the East Don River to beyond Kennedy Road with the exception where the Halton Aquitard and Oak Ridges Aquifer overlie the Newmarket Aquitard. The Scarborough Aquifer extends continuously across the cross-section and overlies directly the bedrock (shale) surface. Groundwater discharge occurs primarily where the aquifer units are exposed at surface such as slightly east of Bayview Avenue and in the West and East Don Rivers. The latter two locations represent groundwater discharge from the underlying Scarborough Aquifer.
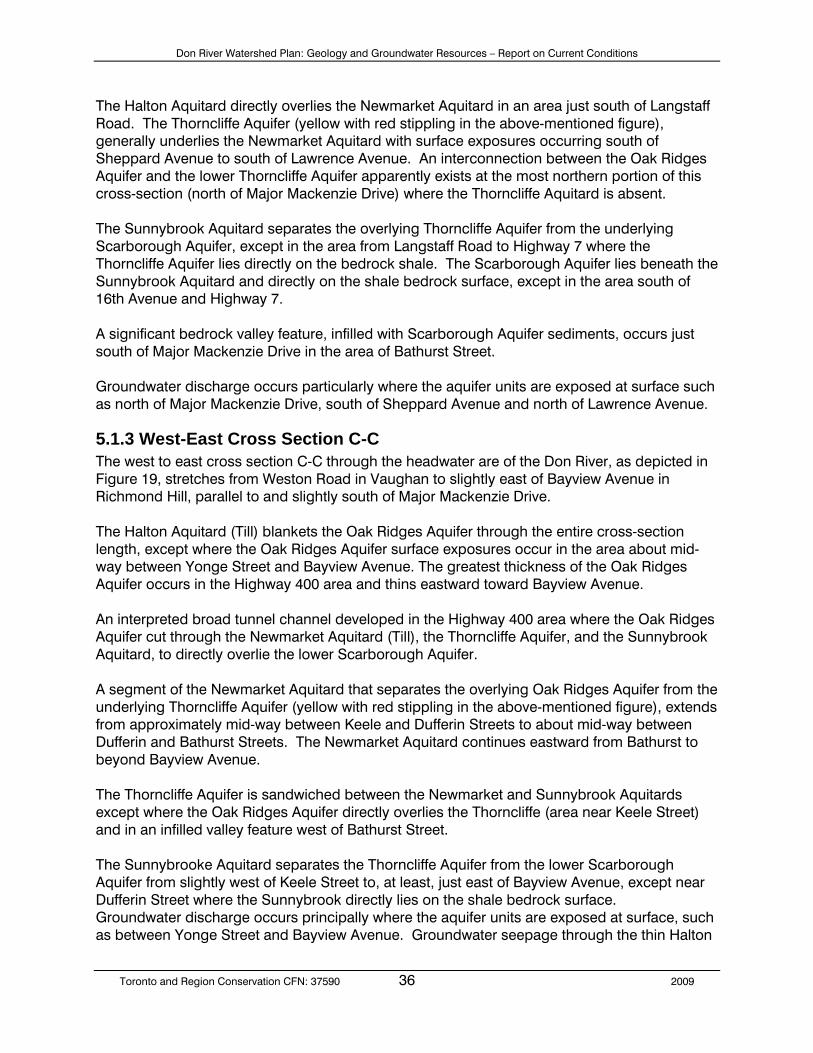
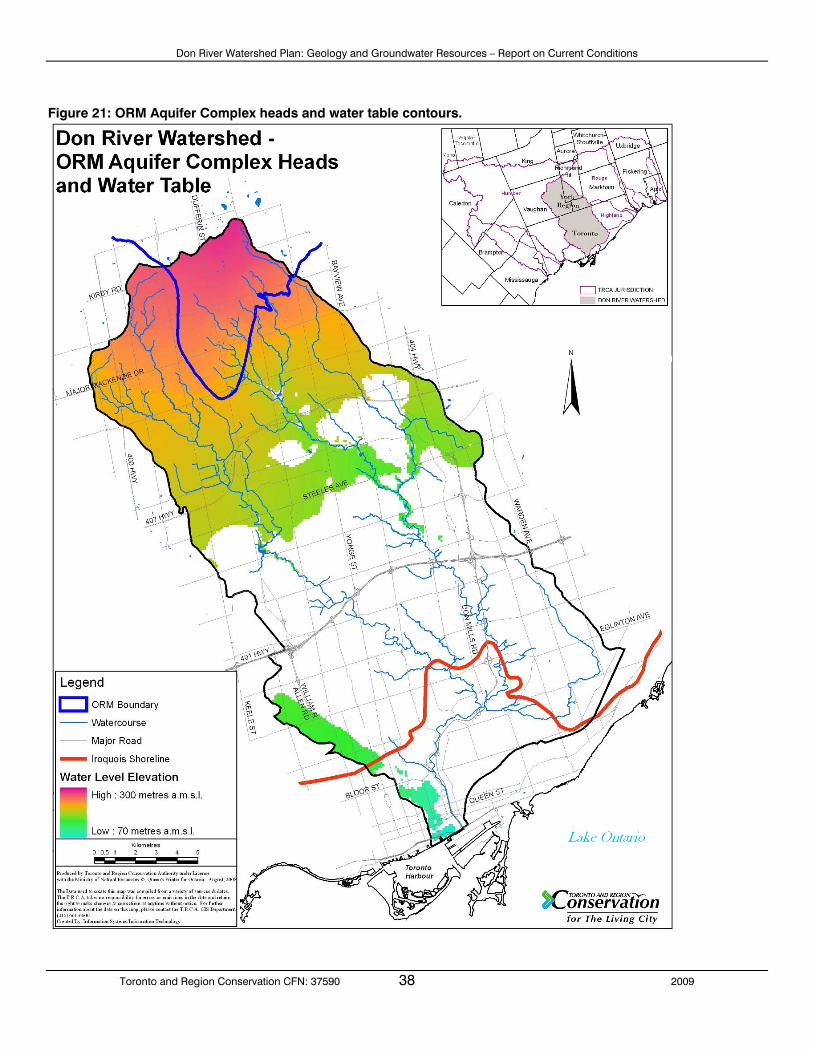
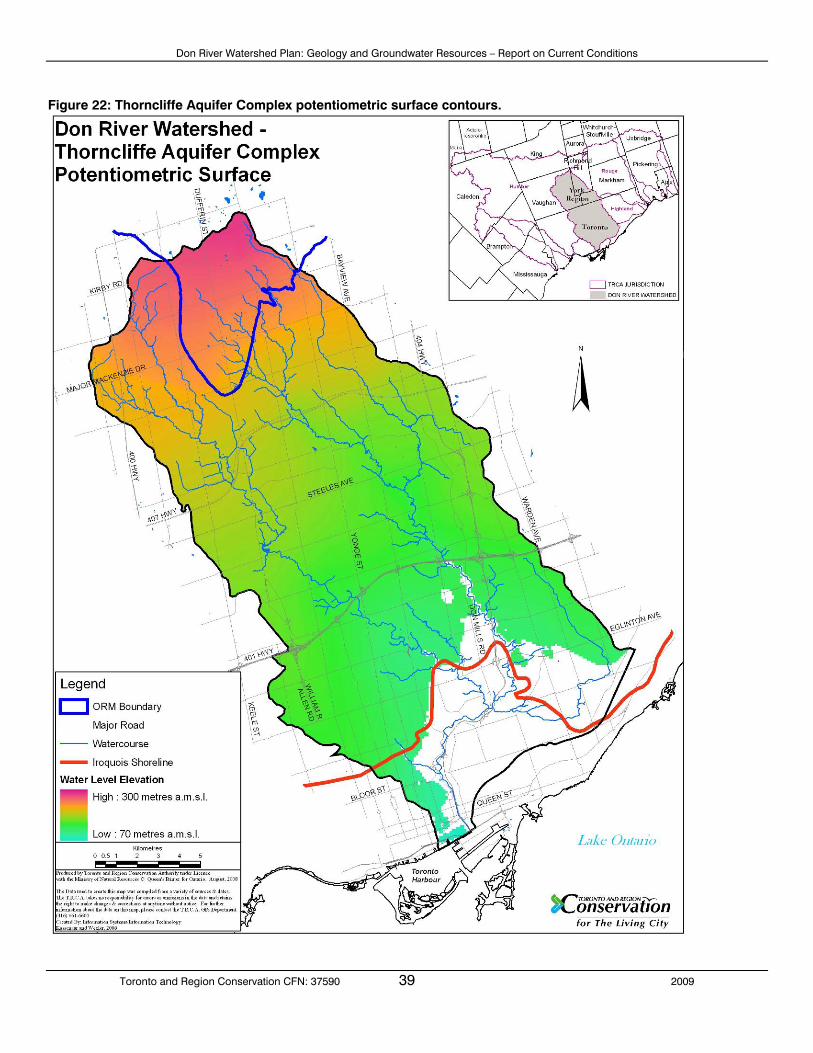
5.2 Groundwater Flow Groundwater flow directions within all aquifers in the Don River watershed are southeastwardly with ultimate discharge into Lake Ontario. Local flow deflections also occur near streams and associated valleys. The modelled groundwater water levels for all three aquifer systems are shown on Figure 21, Figure 22, and Figure 23. The Don River watershed headwater functions as a groundwater divide for all three aquifer systems. Interbasin groundwater flow is interpreted to occur from the Humber River watershed (East Humber sub-watershed) into the northern portion of the Upper West Don, the Upper East Don and the German Mills Creek sub-watersheds.
Don River Watershed Plan: Geology and Groundwater Resources – Report on Current Conditions
Toronto and Region Conservation CFN: 37590 38 2009
Figure 21: ORM Aquifer Complex heads and water table contours.
Don River Watershed Plan: Geology and Groundwater Resources – Report on Current Conditions
Toronto and Region Conservation CFN: 37590 39 2009
Figure 22: Thorncliffe Aquifer Complex potentiometric surface contours.
Don River Watershed Plan: Geology and Groundwater Resources – Report on Current Conditions
Toronto and Region Conservation CFN: 37590 40 2009
Figure 23: Scarborough Aquifer Complex potentiometric surface.

Don River Watershed Plan: Geology and Groundwater Resources – Report on Current Conditions
Toronto and Region Conservation CFN: 37590 41 2009
Groundwater level monitoring has been undertaken to assist in determining groundwater level fluctuation, especially related to the Scarborough Aquifer Complex. A single Provincial Groundwater Monitoring Network (PGMN) monitoring well, located in Earl Bales Park in the West Don River subwatershed, has a semi-continuous water level record beginning in the summer of 2001. Figure A-2 in Appendix A presents the groundwater hydrograph. Water level trends have generally remained stable at about elevation 140.1 meters above mean sea level.
5.3 Hydraulic Properties The amount and rate of groundwater flow through porous media is determined by the hydraulic properties of the unit, particularly hydraulic conductivity (K), the hydraulic gradient and porosity. The response of a flow system to various stresses is largely determined by the previously mentioned parameters along with storage. Hydraulic conductivity is a key hydraulic parameter that can be estimated by numerous field and laboratory methods including slug tests and pumping tests
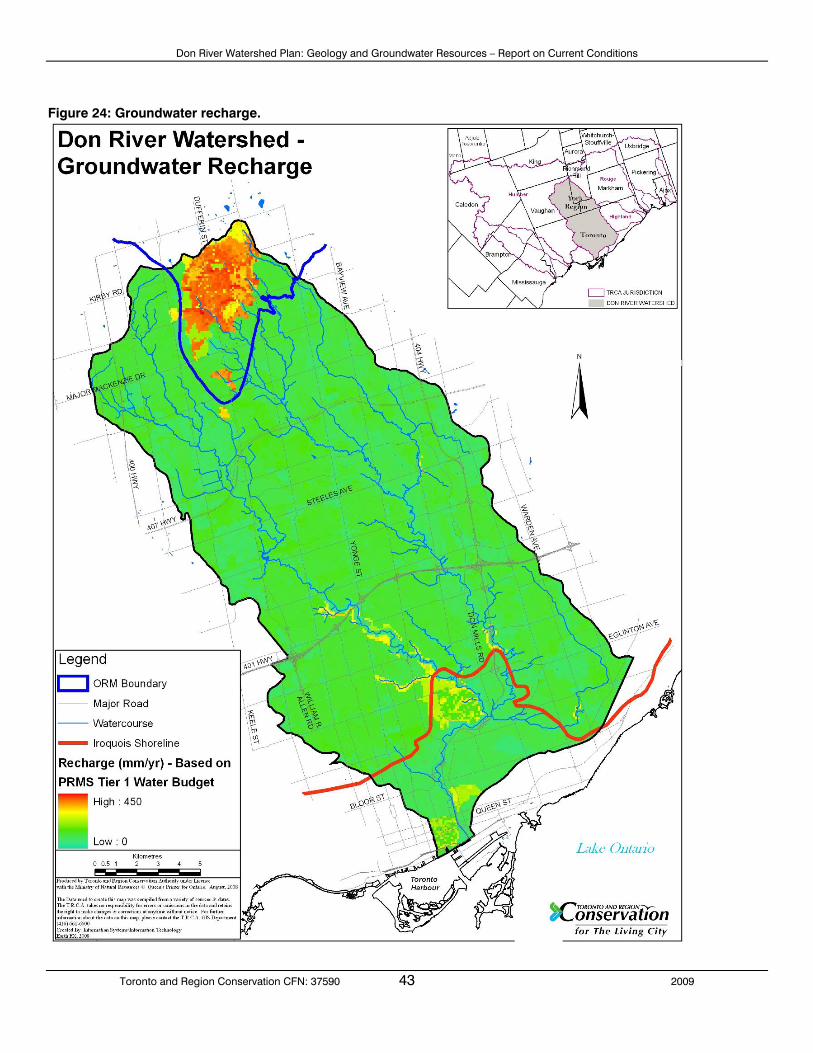
5.4 Groundwater Recharge Recharge or infiltration to the groundwater system occurs by the migration of precipitation through the surficial soil. The amount of recharge or infiltration at a specific site depends on the amount of precipitation evaporated back into the atmosphere, the amount of water transpired from natural vegetation to the air, site topography, type of vegetation and surficial soil type. Surficial geology influences recharge rates. Areas of hummocky topography exhibit higher recharge rates since soil run-off collects in depressions where it can then infiltrate through the surficial soils. Reduction in recharge within urban settings occur due to paved driveways/roads or impermeable rooftop surfaces. A variety of water budget studies to estimate groundwater recharge have previously been conducted within the study area. The various methodologies used by the authors, ranged from hydrograph separation techniques to numerical computer programs (HSP-F [Hydrological Simulation Program - Fortran] and MODFLOW [3-dimensional groundwater flow]). Depending on the permeability of the surface soils, previous recharge estimates for the site specific material present ranged from less than 25 to 420 mm / year. Watershed average recharge value, depending on method employed, ranged from about 90 mm/year (MODFLOW ) to about 170 mm/year (hydrograph separation and HSP-F) (Kassenaar and Wexler, 2006; Totten Sims Hubicki, 2003; XCG Consultants Ltd., 2003; Marshall Macklin Monaghan Limited, 2003; Aquafor Beech Limited, 2003; Clarifica, 2002; 2003b). In light of the recent Source Water Protection - Tier 1 Water Budget modeling (Earthfx, 2008) using the Precipitation Runoff Modeling System (PRMS) - an open source United States Geological Survey software program, this report uses updated recharge estimates for the Don River. Within the watershed, recharge ranges from about 25 to slightly in excess of 420 mm/year, with an averaged net infiltration value of 123 mm/year (1.41 cubic meters per second [m3/s]. The spatial distribution of recharge is provided on Figure 24. In general, the ORM and associated hummocky topography have the highest recharge rates. The moraine flanks are largely till with variable lacustrine veneer and interpreted to have much lower unit recharge rates. The urban areas also have reduced estimated recharge reflecting the higher proportion of impervious surfaces.

Don River Watershed Plan: Geology and Groundwater Resources – Report on Current Conditions
Toronto and Region Conservation CFN: 37590 42 2009
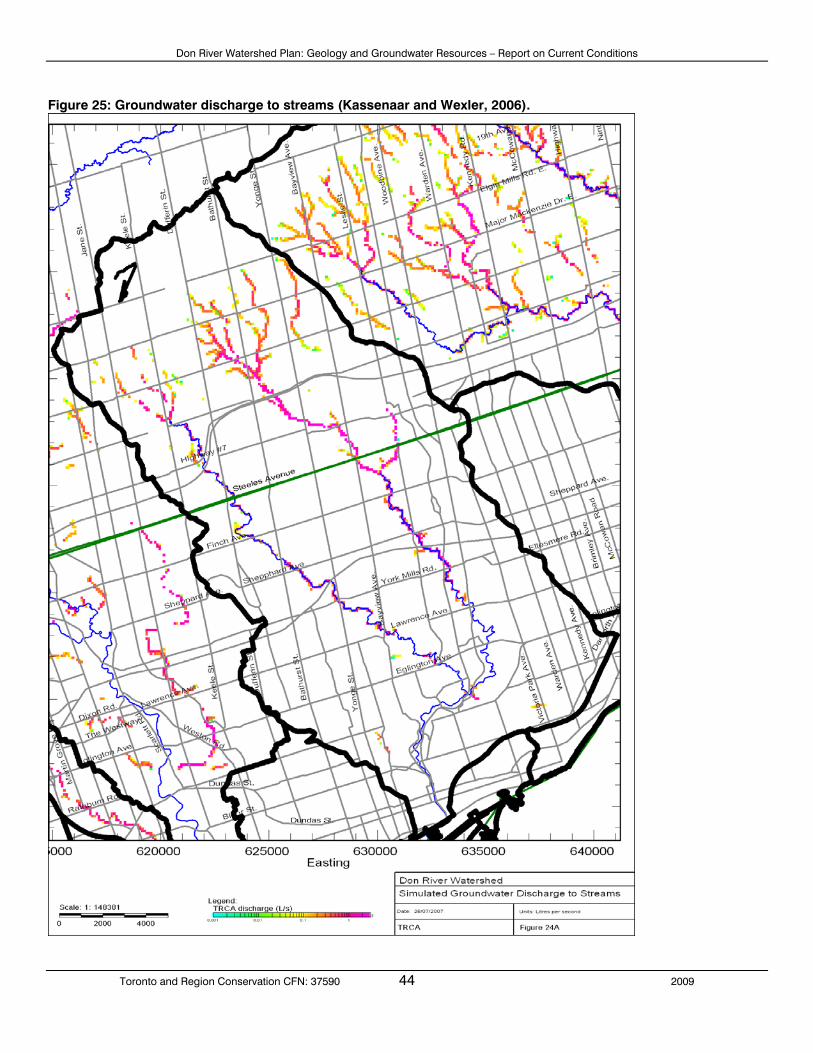
5.5 Groundwater Discharge As part of the water cycle, groundwater is a major contributor to flow in many streams and rivers and strongly influences river and wetland habitats for plants and animals. Groundwater enters the ground in recharge areas and leaves the ground at discharge points. Discharge is continuous as long as sufficient water is available above the discharge point. The most visible evidence of groundwater discharge occurs as seepage or springs along watercourse banks and is also noted within stream beds as upwellings and boiling creek bed sediments. Groundwater discharge is defined, in this report, in terms of the volumetric flow rate [i.e. cubic meters per second or cubic feet per second] of groundwater exiting the aquifer system to the surface environment. Estimates of groundwater discharge, within the Don River watershed, can be derived from a variety of methods including streamflow hydrograph separation, low flow streamflow surveys and groundwater flow models. The TRCA report entitled “Baseflow and Water Use Assessment” (TRCA, 2008a), describes the procedures for collection of low flow data and presents baseflow evaluation for groundwater discharge. Flow models that derived groundwater discharge values were reported by various authors such as Kassenaar and Wexler (2006), Mowatt (2000) and Smart (1994). As the methodologies employed in the various estimation procedures differ, variation in discharge rates do occur. Estimates of groundwater discharge for the Don River watershed, from HSP-F and MODFLOW numerical models, range from 158 to 174 mm/year as referenced in TRCA (2008a) along with Kassenaar and Wexler (2006). This range is equivalent to a volumetric discharge flow rate of between 1.81 and 1.98 m3/s. The recent Tier 1 Water Budget evaluation executed for Source Water Protection, provided a groundwater discharge estimate of 1.69 m3/s (148 mm/yr), slightly below the range quoted earlier. A depiction of the spatial distribution of groundwater discharge to the Don River and its tributaries (in liters per second per 100 meter of watercourse) is presented in Figure 25, based on numerical modeling (Kassenaar and Wexler. 2006). Significant discharge zones within the Don River watershed are associated with areas of ORM sediments, both along the immediate southern slope of the ORM and further south of this area where buried Oak Ridges Moraine sediments intersect stream reaches. South of the City of Toronto boundary along Steeles Avenue, significant groundwater discharge zones to the Don River occur where the deeper aquifers (Thorncliffe and Scarborough Aquifer Complexes) intersect the river valley.
Don River Watershed Plan: Geology and Groundwater Resources – Report on Current Conditions
Toronto and Region Conservation CFN: 37590 43 2009
Figure 24: Groundwater recharge.
Don River Watershed Plan: Geology and Groundwater Resources – Report on Current Conditions
Toronto and Region Conservation CFN: 37590 44 2009
Figure 25: Groundwater discharge to streams (Kassenaar and Wexler, 2006).

Don River Watershed Plan: Geology and Groundwater Resources – Report on Current Conditions
Toronto and Region Conservation CFN: 37590 45 2009
5.6 Groundwater Chemistry There is a paucity of readily available groundwater chemistry data within the Don River watershed. The PGMN groundwater monitoring program analyzed groundwater samples in 2003 and 2004 for various chemical parameters. Chemical water quality data is available for the sole PGMN monitoring well installation within the Don River watershed. Situated on the west bank of the East Don River immediately north of Earl Bales Park, this former municipal water supply well (MOE Water Well Record No. 69-25901) is interpreted to be completed into the Lower aquifer that occurs in the Scarborough Formation. Groundwater samples were collected from the single monitoring well and submitted to the chemical laboratories in October 2003, October 2004 and December 2004. Appendix B contains the spreadsheets of the compiled available reported analytical results. From the results at this sampling location, the deepest Scarborough aquifer has elevated hardness (275 to 292 mg/l), iron (2 to 3.05 mg/l), total phosphorous (0.19 to 0.22 mg/l) and manganese (0.056 to 0.097 mg/l) above the Ontario Drinking Water Standard of 100, 0.3, 0.02 and 0,05 mg/l respectively. The iron, manganese and hardness values are not unusual and are natural for groundwater in deep overburden glacial aquifer systems. The elevated total phosphorous concentration may be the result of anthropogenic activities upgradient of the monitoring well. Although the above quality results characterize the deep groundwater within the Scarborough aquifer, there is a lack of analytical information about the water quality in the two significant overlying aquifers - the Thorncliffe and the Oak Ridges Moraine aquifers. This is due to a lack of groundwater monitoring in the latter two aquifers within the Don River watershed. TRCA recommends that additional monitoring wells be acquired to determine water quality in those aquifers in addition to water level monitoring.
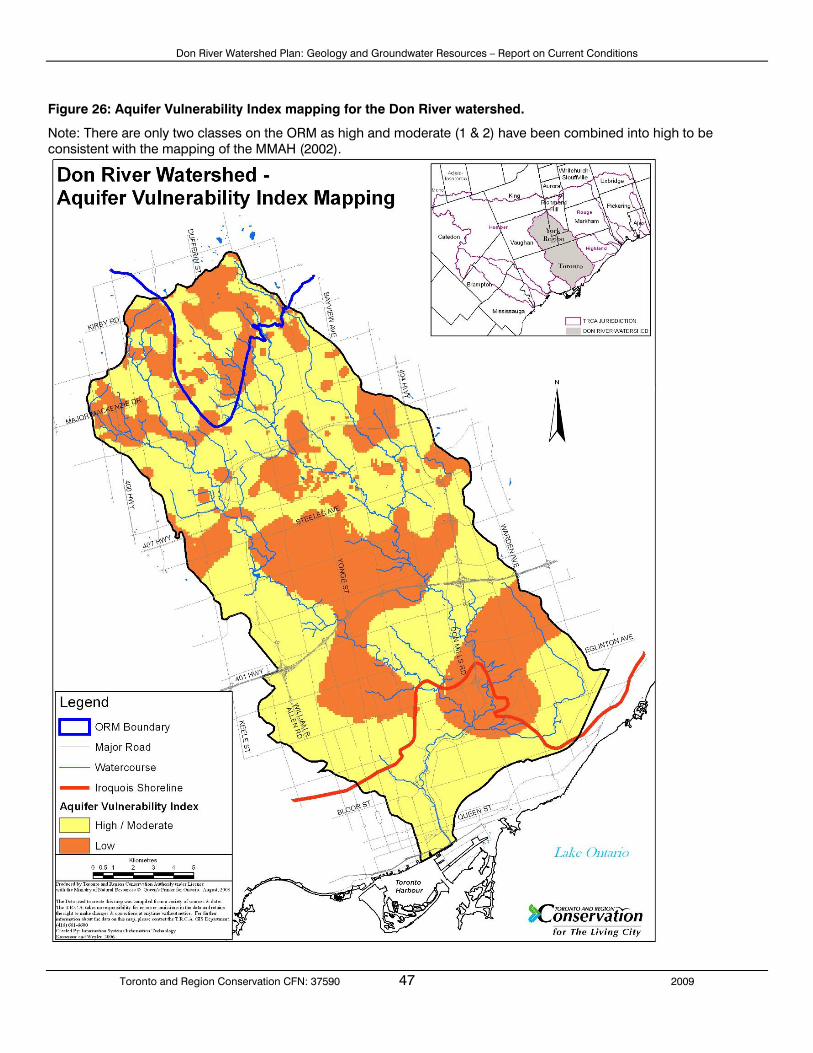
5.7 Aquifer Vulnerability The concept of aquifer vulnerability assumes that the physical or subsurface environment may provide some degree of protection to aquifers from the introduction of contaminants, and that relative vulnerability is different for different areas (Vrba and Zaporozec, 1994). This concept could also be expanded to include relative vulnerability to quantity threats as well as quality threats. The MOE initially undertook a Municipal Groundwater Study program (Provincial Water Protection Fund) that provided wellhead protection and regional groundwater assessments for the province. The current Source Water Protection program being undertaken by the Conservation Authorities contains a component dealing with chemical Threats and Risk Assessment to water supplies. One of the requirements of the groundwater assessment is the preparation of groundwater vulnerability maps that delineate the relative susceptibility to contamination (MOE, 2001a). These maps, known as Groundwater Intrinsic Susceptibility (GwIS or Intrinsic Susceptibility Index - ISI) maps or Aquifer Vulnerability Index (AVI) maps, identify areas where contamination of groundwater is more or less likely to occur as a result of surface contamination. These areas are based on a travel-time for a non-reactive contaminant to travel to either the top of the aquifer for a confined aquifer, or to the water table for an unconfined aquifer. Parameters basically include hydraulic conductivity (actually a K factor) for materials listed in the water well
Don River Watershed Plan: Geology and Groundwater Resources – Report on Current Conditions
Toronto and Region Conservation CFN: 37590 46 2009
record database and thickness of material overlying a confined aquifer or depth to water table for an unconfined aquifer. This method does not include hydraulic gradients or porosity. These maps are intended to form a general guide for land managers and planners to protect groundwater resources. The MOE has a municipal Watershed-Based Source Protection Planning program aimed at protecting the province’s drinking water. The Technical Experts Committee for this program recommends using ISI/AVI mapping as an initial tool to define aquifer vulnerability. This mapping will be updated to incorporate more rigorous methods as more data become available (MOE, 2004). The AVI mapping that included the Don River watershed was initially conducted as part for the CAMC-YPDT study. The resulting maps should be used with caution as described in the CAMC guidance document. Further discussion regarding the limitations regarding vulnerability mapping are provided by the MOE (November, 2001) and Vrba and Zaporozec (1994). This mapping directly incorporates the GwIS mapping that has been previously released by the government of Ontario in 2002 for the Oak Ridges Moraine planning area (Ministry of Municipal Affairs and Housing, 2002). The AVI map for the Don River watershed is provided here for information purposes and to discuss the implications of the mapping to the watershed. It is expected that given the level of hydrogeologic understanding available for the study, the Source Protection Studies conducted within this watershed will incorporate more rigorous, complex methodology (MOE, 2004). In general the AVI method delineates three categories of relative aquifer vulnerability as follows:
• High Aquifer Vulnerability (AVI=1) – sandy areas with shallow water table; • Moderate Aquifer Vulnerability (AVI=2) – loam soils with moderate depth to water table;
and • Low Aquifer Vulnerability (AVI=3) – clayey soils with deeper water table.
It should also be noted that these classifications are derived from MOE water well record information which is acknowledged to contain errors, particularly with respect to geology. Again it is emphasized that this mapping provides an estimate to guide more detailed determinations in the future. Figure 26 shows areas of relative groundwater vulnerability centered on the Don River watershed as extracted from the larger CAMC-YPDT project. In this presentation, the High (AVI=1) and Moderate (AVI=2) Aquifer Vulnerability have been combined and the areas shown in yellow. Areas in orange (AVI=3) have a lower mapped vulnerability to surface introduction of contamination, or contaminants would take longer to reach the uppermost aquifer or the water table. Presumably, this may also allow for a longer time period to respond with and undertake remedial actions. Areas in yellow have a higher vulnerability from a contaminant travel-time perspective in that the travel times for contaminant arrival to an aquifer or the water table are expected to be shorter.
Don River Watershed Plan: Geology and Groundwater Resources – Report on Current Conditions
Toronto and Region Conservation CFN: 37590 47 2009
Figure 26: Aquifer Vulnerability Index mapping for the Don River watershed.
Note: There are only two classes on the ORM as high and moderate (1 & 2) have been combined into high to be consistent with the mapping of the MMAH (2002).

Don River Watershed Plan: Geology and Groundwater Resources – Report on Current Conditions
Toronto and Region Conservation CFN: 37590 48 2009
In general, for the Don River watershed, areas of relatively higher vulnerability from a contaminant travel-time perspective occur along the Oak Ridges Moraine and south of the Lake Iroquois shoreline. The areas associated with the Lake Iroquois shoreline area have more permeable sediments situated near surface and a shallow water table. Areas of lower vulnerability generally correspond to the intervening areas (between the moraine and the Lake Iroquois deposits) of the South Slope till plain where thick till deposits and associated lacustrine veneer will have a longer travel time for contaminants to reach the water table or a confined aquifer. An area of higher vulnerability exists in the south central portion of the watershed, stretching from the West Don to the East Don River and centered in the vicinity of Rosedale Golf Course / Windfield Park. In those areas where a high / moderate aquifer vulnerability has been delineated, the introduction / surface application of materials / substances that would impair the existing groundwater quality (such as salt, oils, chemical spills), should be eliminated as practically possible. Such measures would lessen the possibility of future impairment of groundwater quality at the discharge locations within the Don River and its tributaries.
5.8 Water Budget A water budget for a given area consists of inputs, outputs and changes in storage. The inputs include precipitation, groundwater or surface water inflows, and anthropogenic inputs such as waste effluent. The inputs must equal outputs, which are evapotranspiration, water supply removals or extractions, surface or groundwater outflows, as well as any changes in storage within the area of interest (OMOE, 2007). This can be expressed as follows: Inputs = Outputs + Change in Storage , or P + SWin + GWin + ANTHin = ET + SWout + GWout + ANTHout + ªS Where: P = precipitation SWin = surface water flow into the watershed GWin = lateral groundwater flow into watershed ANTHin = anthropogenic or human inputs such as waste discharges ET = evapotranspiration SWout = surface water flow out (includes runoff) GWout = groundwater flow out (to Lake Ontario) ANTHout = discharge to wells (i.e. drinking water supplies) ªS = change in storage (surface water, soil moisture, groundwater).
Note: For the purposes of this water budget analysis, the surface water flow in was zero, since the study area included the entire watershed catchment area. The change in storage was assumed to be zero, since steady state conditions were assumed in the groundwater modeling. Human inputs were assumed to be zero. The modeling did not include the North Toronto Water Pollution Control Plant discharges.
The overall water budget for the Don River watershed is summarized in Figure 27 and as presented on the following page. Some of the key findings of this analysis are summarized below.

Don River Watershed Plan: Geology and Groundwater Resources – Report on Current Conditions
Toronto and Region Conservation CFN: 37590 49 2009
The surficial geology of the Don River watershed is dominated by low permeability glacial tills, which generally limits groundwater infiltration to less than 100 mm/year. The low permeability tills also protect the underlying aquifers from near surface sources of contamination. The exception to the rule is the high recharge hummocky areas on the oak Ridges Moraine where runoff is limited by internal drainage to local depressions, despite the low permeability soils. The highest recharge area for the Don River groundwatershed exists in the northeast corner of the watershed where the Oak Ridges Aquifer sand and gravel outcrop at surface. An area of high recharge that contributes to lateral groundwater inflow to the Don River watershed occurs outside the northeast corner from the Rouge River watershed. Elevated recharge (150 mm/year) also occurs at the bottom of the watershed where the Iroquois sands and gravels overlie the till. Groundwater discharge is greatest in two general areas. The first occurs in the upper reaches between Major Mackenzie Drive and Highway 7, where the Oak Ridges Aquifer (or equivalent) becomes thinner and is close to the ground surface. The second is situated in the middle reaches from around Finch Avenue south to about Lawrence Avenue where the Thorncliffe Aquifer is exposed in the floodplain. Although the Scarborough Aquifer outcrops in the lower reaches of the watershed, there is little effect on the surface water flow system.
Figure 27: Overall Don River watershed water budget.
Don River Watershed Plan: Geology and Groundwater Resources – Report on Current Conditions
Toronto and Region Conservation CFN: 37590 50 2009
Groundwater use is concentrated in the upper reaches of the watershed for irrigation, private domestic supply (in undeveloped areas), groundwater pressure control, and commercial use. There are no municipal takings for potable water within the Don River watershed.
5.9 Summary of Hydrogeology Three main water-bearing aquifers (derived from glacial activities) exist within the Don River watershed; the Oak Ridges Moraine Aquifer Complex, the Thorncliffe Aquifer with the lowest being the Scarborough Aquifer. The thickness and distribution of each aquifer varies, generally thicker in the north and diminishes to the south of the watershed. Aquitards generally separate each of the aforementioned aquifers by the Halton Till Aquitard, the Newmarket / Northern Till Aquitard and the Sunnybrooke Till Aquitard respectively. Groundwater is replenished by the infiltration of precipitation through the soils at ground surface. The highest recharge of slightly in excess of 420 mm/yr occurs in the northeast corner of the watershed where the hummocky topography and the exposed granular sand deposits of the Oak Ridges Moraine Aquifer Complex occur at ground surface. Lower infiltration rates occur toward the south. From the Drinking Water Source Protection - Tier 1 Water Budget, the calculated average net infiltration amounts to 1.41 m3/s or 123 mm/year. Groundwater flow within the three aquifers occurs generally to the southeast with primary groundwater discharge to the Don River and its tributaries upstream of Eglinton Avenue. The most recent estimate of groundwater discharge to the Don River and tributaries was calculated at about 1.69 m3/s (148 mm/yr) based on the Tier 1 Water Budget. It is this groundwater discharge that contributes to the Don River stream baseflow with eventual discharge into Lake Ontario. The chemical groundwater quality from a sample obtained from the Scarborough Aquifer met the pertinent Ontario Drinking Water Standard concentration except for elevated iron, manganese, total phosphorous and hardness. The elevated iron (2 to 3.05 mg/l), manganese (0.056 to 0.097 mg/l) and hardness (275 to 292 mg/l) concentrations are not unusual and are natural for groundwater in deep overburden glacial aquifer systems. The elevated total phosphorous (0.19 to 0.22 mg/l) concentration may be derived from anthropogenic (human-induced) activities within the watershed upgradient of the monitoring well.
Don River Watershed Plan: Geology and Groundwater Resources – Report on Current Conditions
Toronto and Region Conservation CFN: 37590 51 2009
6.0 Indicators, Measures and Targets In evaluating current conditions in the Don River watershed, a rating system was adopted based on standard letter grades. Each of these categories corresponds with “poor”, “fair”, “good” and “excellent” levels of condition as shown in the table below. Where the measures and targets were quantitative and data permitted, ratings were assigned, in part, to reflect the percent satisfaction of the target. Comparisons to conditions in other watersheds under TRCA jurisdiction were made and informed evaluations where data were available, to reflect relative conditions. Where measures and targets were qualitative, or data were lacking, evaluations were based on professional judgment. Grade Rank Percent of Target Achieved A Excellent Better than 80 B Good Between 70 and 79 C Fair Between 60 and 69 D Poor Between 50 and 59 F Fail Below 50 TBD To be determined Further study required; baseline data not available The management objectives, indicators, measures, targets, and current conditions ratings for groundwater recharge, discharge, quality and withdrawals are presented below. Current conditions have been compared to previous assessments of condition undertaken as part of report cards prepared after Forty Steps, where detailed assessments were available (Don Watershed Regeneration Council (DWRC) and MTRCA, 1997; TRCA, 2000, 2003).
Overall Rating Objective: Protect and restore the quantity and quality of groundwater – recharge and discharge
C
Indicator Measure Target
Water levels in PGMN wells
No general negative trend in water levels in PGMN monitoring wells
Recharge / Discharge
Average groundwater recharge rates
Maintain or enhance average annual groundwater recharge rates
6.1 Groundwater Recharge and Discharge During its natural state (undeveloped), a plot of land would have vegetative cover such as trees, shrubs, grasses or agricultural plantings. The underlying surface soils would allow water to infiltrate at various rates, based on the soil type (such as sand or clay) and the slope of the land. When the land use changes from natural to residential, industrial or commercial occur, a portion of the natural soils are replaced by impervious surfaces such as concrete or paved driveways and sidewalks, building roofs and roadways. Changing the surfaces from pervious to impervious, the portion of rainfall that would normally infiltrate now runs off. The amount of recharge over the development site decreases while the runoff volume increases to the stormwater management pond and eventually to the watercourse. Minimizing the impervious area on a site reduces the amount of recharge loss at the same time reduces the increase in runoff to the watercourse.
Don River Watershed Plan: Geology and Groundwater Resources – Report on Current Conditions
Toronto and Region Conservation CFN: 37590 52 2009
6.1.1 Water Level in PGMN Wells Groundwater levels in various aquifers, as measured in monitoring wells, respond to rainfall and snowmelt events on a seasonal basis with small fluctuations on a daily basis. Development can result in a decline in groundwater level when impervious surfaces replace natural pervious surfaces or when permanent dewatering occurs during and subsequent to infrastructure installation such as for sewers, watermains and similar services. Decrease in water levels suggests that the rate of groundwater discharge to the relevant watercourse. Consequently, the target should be that no general negative trend in groundwater levels should occur in the PGMN monitoring wells. In the case of the existing Don River PGMN well, no negative trend in groundwater levels should occur as the base conditions indicate stable levels in the hydrograph displayed in Appendix A.
6.1.2 Average Groundwater Recharge Rates A groundwater recharge rate represents the rate at which water infiltrates the surface soils to become groundwater. When development of a site occurs, some impervious surfaces replace or are superimposed over previous pervious surfaces. In order to mitigate such a recharge loss, measures are devised to replace such a loss. As a development site generally encompasses a significant land area (possibly tens to hundreds of hectares), groundwater recharge rates can be averaged over the study site. Consequently, the target should be to maintain or enhance the average annual groundwater recharge rates as depicted in Figure 24.
6.1.4 Summary Although there are stable groundwater conditions as indicated by the available PGMN well monitoring data, a “C” or “Fair” rating has been assigned reflecting the lack of monitoring points and the current high level of impervious cover (such as pavement and roof areas) over the Don River watershed. Subject to funding availability, establishment of monitoring well nests for groundwater level monitoring within each aquifer unit should be undertaken. Currently, there is one groundwater monitoring well within the Provincial Groundwater Monitoring Network in the Don River, where the Scarborough Aquifer water levels are being monitored. There are no groundwater levels available for the two other significant aquifers, the Oak Ridges Moraine Aquifer Complex and the Thorncliffe Aquifer as no monitoring wells have been completed and instrumented in these aquifers. In order to understand the existing conditions and monitor impacts, additional monitoring wells are highly recommended. The following key aspects of groundwater recharge and discharge are noted for this watershed;
i) The major recharge areas within the watershed occur in the northeast portion, on the hummocky terrain of the Oak Ridges Moraine, where the infiltration to the sand and gravel deposits may exceed 300 millimeters per year.
ii) Groundwater flow direction within all aquifers in the watershed is generally from the Oak Ridges Moraine in the north to Lake Ontario in the south. The headwater areas

Don River Watershed Plan: Geology and Groundwater Resources – Report on Current Conditions
Toronto and Region Conservation CFN: 37590 53 2009
of the watershed generally function as groundwater divide for all three aquifer systems in the Don River watershed.
iii) Inter-basin groundwater flow is interpreted to occur from the Humber River watershed (East Humber sub-watershed) into the northern portion of the Upper West Don, the Upper East Don and the German Mills Creek sub-watersheds.
iv) The major zone of groundwater discharge to the watercourses within the Don River watershed occurs along the southern flank of the Oak Ridges Moraine. Higher groundwater discharge occurs south of Finch Avenue where the West Don and Lower East Don incise through the Thorncliffe Aquifer. Another zone occurs south of the Lake Iroquois shoreline where the deeper Scarborough Aquifer complex discharges to the Don River or as seeps along the riverbanks.
6.2 Groundwater Chemistry and Bacteria TRCA has adopted the objective of the prevention of groundwater contamination to address groundwater quality issues within the Don River watershed. The following table outlines the indicators and measures for evaluating the extent to which the objective is being achieved. It also provides targets for each indicator and a report card rating based on the available information for the indicator and measure.
Overall Rating Objective: Protect and restore the quantity and quality of groundwater – groundwater chemistry and bacteria
B/TBD1
Indicator Measure Target
Groundwater chemistry and bacteria
Anions, cations, heavy metals, nutrients (mg/l) and bacteria (in CFU) in PGMN wells
The more stringent MOE Ontario Drinking Water Standards or MOE Provincial Water Quality Objectives
1 Data from the single monitoring well indicate a B grade, but additional wells are needed to assess groundwater conditions in all aquifers. The rating of “B” or “Good” reflects the general lack of groundwater quality impacts in the lower Scarborough Aquifer system but recognizes that local exceedences of some parameters have been reported in the shallow surficial groundwater formations, mostly associated with anthropogenic sources of chlorides (i.e. road salting). Groundwater quality sampling has been undertaken at the Don River watershed monitoring well at Earl Bales Park. Appendix B contains a summary of the general water chemistry results for groundwater extracted from the Scarborough Aquifer system. For the sampling events that have been completed and analyzed to date, all parameter concentrations have been reported below the more stringent applicable criteria (Ontario Drinking Water Standards or Provincial Water Quality Guidelines) except for iron, manganese, total phosphorous and hardness. High concentrations of iron, manganese and hardness reported in the monitoring well samples are likely due to natural chemical reactions associated with the mineral composition of the glacial derived soils. The elevated total phosphorous concentration may be a result of anthropogenic activities upgradient of the sample location.
Don River Watershed Plan: Geology and Groundwater Resources – Report on Current Conditions
Toronto and Region Conservation CFN: 37590 54 2009
Due to the largely urban area within the Don River watershed, anecdotally, localized shallow groundwater quality impacts have been known and subjected to remediation, such as at fuel delivery sites and from former sanitary landfill operations. Effects of roadway de-icing operations have produced localized elevated chloride levels in shallow groundwater. As mentioned above, subject to funding availability, establishment of monitoring well nests for groundwater quality monitoring within each aquifer unit should be undertaken. Currently, there is one groundwater monitoring well within the Provincial Groundwater Monitoring Network in the Don River, where the Scarborough aquifer chemical water quality is being monitored.
6.3 Groundwater Withdrawals About 2,506 million L/year of groundwater are withdrawn annually by water users in the watershed. Major groundwater extractions are for groundwater remediation (e.g., former Keele Valley landfill site), industrial and commercial uses (including golf course irrigation). Surface water and groundwater use in the Don River watershed is reported on in the Baseflow and Water Use Assessment – Current Conditions Report (TRCA, 2008). Takings of surface or groundwater greater than 50,000 L/d require a Permit to Take Water (PTTW) from the Ministry of the Environment. There are at least 10 former municipal wells within the Region of York portion of the Don River watershed. Although these former supply wells serviced Maple, Concord, Richmond Hill and Markham, these communities have switched to a Lake Ontario based supply as urban expansion has extended northward from the Lake Ontario shoreline. A single former municipal supply well exists within the City of Toronto, informally referred to as the North York well. Situated immediately north of Earl Bales Park (north of Sheppard Avenue West and east of Bathurst Street), this installation currently forms part of the Provincial Groundwater Monitoring Network. Although the database indicates both active and inactive wells, no municipal groundwater takings occur from these installations. Most groundwater extraction for groundwater level control is temporary in nature during construction of underground parking garages and deep utilities such as gravity sewers. The use of permanent dewatering wells or perforated sub-drain systems for groundwater control is not completely known although at least four systems are operational within the Don River watershed. These systems were installed in areas of strong upward groundwater movement to prevent flooding of apartments and buildings. Although primarily urbanized with municipal water supply sourced from Lake Ontario, the TRCA has adopted the objective of ensuring sustainable rates of groundwater use to address groundwater extraction within the Don River watershed. The following table presents the appropriate indicator, measure and a target for the indicator and measure.

Don River Watershed Plan: Geology and Groundwater Resources – Report on Current Conditions
Toronto and Region Conservation CFN: 37590 55 2009
Overall Rating Objective: Protect and restore the quantity and quality of groundwater –
groundwater withdrawals B
Indicator Measure Target
Groundwater Withdrawals*
Portion of average annual recharge that is withdrawn from groundwater system
Less than 10%
* See the Baseflow and Water Use Assessment – Report on Current Conditions (TRCA, 2009) for an evaluation of the impacts of surface water withdrawals on baseflow. Based on the estimated annual recharge rates, the Don River watershed receives approximately 1.41 cubic meters per second to the groundwater systems. As the available reported groundwater extraction amounts to about 0.08 cubic meters per second, groundwater consumption amounts to about 5.7% of annual average recharge. As the consumption is less than 10% of recharge, the Don River watershed is considered to have a low groundwater stress level. The rating of “B” or “Good” reflects the lack of groundwater use impacts in aquifers within the Don River watershed. As mentioned previously, groundwater takings within the Don River watershed are for industrial, commercial (e.g., golf course irrigation), and remediation purposes. There are no groundwater takings for municipal supply, as potable water supplies are surface-water lake-based from Lake Ontario.
7.0 Groundwater Management Considerations This section outlines potential groundwater considerations in terms of the maintenance or enhancement of groundwater recharge, maintenance of groundwater levels, minimizing groundwater takings (where practical) and improving groundwater quality.
7.1 Groundwater Recharge Groundwater management in terms of groundwater recharge can occur in relation to new and existing urban development. New developments should be encouraged to incorporate infiltration trenches or pervious pavement where practical and where they will function effectively for infiltration of clean water roof run-off. Where possible and practical, infiltration of clean roof water through a ‘third pipe” [a perforated pipe in the granular bedding beneath the roadway storm sewer pipe] should be encouraged. For properties undergoing renovation / redevelopment south of the Lake Iroquois shoreline where significant thickness of beach sands occur, serious consideration should be given to incorporating soak-away pits, infiltration trenches or other infiltration techniques within the property to receive clean roof water. Evaluation of the feasibility and effectiveness of operating these systems would occur on a site specific basis.

Don River Watershed Plan: Geology and Groundwater Resources – Report on Current Conditions
Toronto and Region Conservation CFN: 37590 56 2009
7.2 Groundwater Levels Currently, one monitoring well has been instrumented within the Don River watershed from which the TRCA has access to the electronic water level data [the Provincial Ground Water Monitoring Network well at Earls Bale Park - North York]. Consultation with the Ministry of the Environment regarding possible access to available digital water level data from either golf courses or industrial facilities (as part of their Permit To Take Water conditions) remains another possible information source. Subject to funding availability, establishment of monitoring well nests for groundwater level monitoring within each aquifer unit should be undertaken. There are no groundwater levels available for the two other significant aquifers, the Oak Ridges Moraine Aquifer Complex and the Thorncliffe Aquifer as no monitoring wells have been completed and instrumented in these aquifers. In order to understand the existing conditions and monitor impacts, additional monitoring wells are highly recommended. Whenever a civic infrastructure project is undertaken that involves groundwater monitoring for construction purposes, a possibility exists to preserve a monitoring well [assuming the installation is completed into one of the major aquifer units] and instrument it with a continuous water level transducer / datalogger unit. Similarly, for redevelopment of former industrial land in the lower Don River, strategically placed monitoring wells, installed as part of site cleanup / monitoring activities, may be available to the TRCA for water level monitoring purposes. However, in assuming these additional installations, consideration should be given as to funding sources for the operation of the transducer / datalogger and possible future well decommissioning.
7.3 Groundwater Takings As indicated previously, the municipal water takings within the Don River watershed have been converted to a surface water lake based water supply system from the groundwater source. Groundwater takings can fall into four main categories; for industrial, recreation (turf management), infrastructure construction and contaminated site remediation. Best Management Practices (BMPs) should be encouraged to minimize takings relative to activities such as industrial cooling, golf course turf management and infrastructure (sewer service) construction. Directional drilling and innovation tunnel boring methodologies should be encouraged to minimize construction dewatering takings.
7.4 Groundwater Quality Impacts The most common source of groundwater quality impairment in the urban setting originates from winter road de-icing activities. Use of Best Management Practices, as developed by the Ministry of Transportation Ontario and the Ministry of the Environment, should be encouraged by the municipalities and their contractors. Subject to funding availability, establishment of monitoring well nests for groundwater quality monitoring within each aquifer unit should be undertaken. Currently, there is one groundwater monitoring well within the Provincial Groundwater Monitoring Network in the Don River, where the Scarborough chemical water quality is being monitored.

Don River Watershed Plan: Geology and Groundwater Resources – Report on Current Conditions
Toronto and Region Conservation CFN: 37590 57 2009
In areas of significant groundwater recharge, BMPs should be undertaken for nutrient / fertilizer and herbicide / pesticide application. For those areas undergoing service rehabilitation, elimination or at least reduction of leakage (where possible) from storm and sanitary sewers (from joints, cracks, and corrosion) should occur to minimize quality impairment of groundwater. In industrial / commercial areas, BMPs should be encouraged during the handling, storage, use and eventual disposal of hazardous substances that potentially, if released in quantity, would result in groundwater quality changes above drinking or ecological water quality standards. Report prepared by: Andrew Taylor Report reviewed by: Janet Ivey Don Ford Deborah Martin-Downs
Don River Watershed Plan: Geology and Groundwater Resources – Report on Current Conditions
Toronto and Region Conservation CFN: 37590 58 2009
8.0 References Anderson, T.W. and C.F.M. Lewis. 1985. Postglacial water-level history of the Lake Ontario
basin. In Quaternary Evolution of the Great Lakes, edited by P.F. Karrow and P.E. Calkin, Geological Association of Canada Special Paper 30, 231-253.
Aravena, R., and L.I. Wassenaar. 1993. Dissolved organic carbon and methane in a regional
confined aquifer, southern Ontario, Canada: carbon isotope evidence for associated subsurface sources. Applied Geochemistry, v. 8, p. 483-493.
Baker, C.L., L.R. Lahti and D.C. Roumbanis. 1998. Urban Geology of Toronto and
Surrounding Area. In Urban Geology of Canadian Cities. Edited by P.F. Karrow and O.L. White. Geological Association of Canada Special Paper 42, 323-352.
Barnett, P.J. 1990. Tunnel valleys: evidence of catastrophic release of subglacial meltwater,
central-southern Ontario, Canada. In Abstracts with Programs, Northeastern Section, Geological Society of America, Syracuse, New York, p. 3.
Barnett, PJ. 1992. Quaternary Geology of Ontario. In Geology of Ontario, Ontario Geological
Survey, Ontario Ministry of Northern Development and Mines, Edited by PC Thurston, HR Williams, RH Sutcliffe and GM Stott. Special Volume 4, Part 2, Chapter 21, 1011-1088.
Barnett, P.J., D.R. Sharpe, H.A.J. Russell, T.A. Brennand, G. Gorrell, F. Kenny, and A. Pugin.
1998. On the origins of the Oak Ridges Moraine. Canadian Journal of Earth Sciences, vol. 35, pp. 1152 – 1167.
Bicknell, BR, J.C. Imhoff, J.L. Kittle Jr and A.S. Donigian Jr. 1996. Hydrological Simulation
Program - FORTRAN, User’s Manual for Release 11. A manual prepared for the Environmental Research Laboratory, Office of Research and Development, U.S. Environmental Protection Agency, Athens, Georgia.
Boyce, J.I. 1997. Facies architecture and stratigraphic heterogeneity in glacial deposits and
their relation to hydrogeologic function. Ph.D. thesis, University of Toronto. Boyce, J.I., N. Eyles and A. Pugin. 1995. Seismic reflection, borehole and outcrop geometry of
Late Wisconsin tills at a proposed landfill near Toronto, Ontario. Canadian Journal of Earth Sciences, v. 32, p.1331-1349.
Bradbury, K.R. and E.R. Rothschild. 1985. A computerized technique for estimating the
hydraulic conductivity of aquifers from specific capacity data. Ground Water, 23(2), 240-246.
Brennand, T. A., C. Logan, F. Kenny, A. Moore, H.A.J. Russell, D.R. Sharpe and P.J. Barnett.
1997. Bedrock Topography of the Greater Toronto and Oak Ridges Moraine NATMAP areas, southern Ontario; Geological Survey of Canada Open File 3419, scale 1:200 000.

Don River Watershed Plan: Geology and Groundwater Resources – Report on Current Conditions
Toronto and Region Conservation CFN: 37590 59 2009
Brennand, T., and J. Shaw. 1994, Tunnel channels and associated landforms: their implication for ice sheet hydrology. Canadian Journal of Earth Sciences, v. 31, p. 502-522.
Brown, D.M., McKay, G.A. and Chapman, L.J., 1980, The Climate of Southern Ontario.
Climatological Studies, Number 5: Environment Canada, Atmospheric Environment Service.
Chapman, L.J. 1985, On the origin of the Oak Ridges Moraine, southern Ontario. Canadian
Journal of Earth Sciences, v. 22, p. 300-303. Chapman, L.J. and D.F. Putnam. 1984. The Physiography of Southern Ontario, 3rd Edition.
Ontario Geological Survey, Special Volume 2. Chow, V,T. 1964. Handbook of Applied Hydrology. McGraw-Hill, Inc. Conestoga Rovers and Associates. 2003. York Peel Durham Groundwater Management
Strategy Study, Aquifer Characterization Study, Stream Baseflow Assessment Program. Prepared for the Conservation Authorities Moraine Coalition, May.
Davies, S.D. and S. Holysh. 2004. Groundwater resource projects across the Oak Ridges
Moraine. In Summary of Field Work and Other Activities 2004, Ontario Geological Survey, Open File Report 6145, p27-1 to 27-8.
Deane, R.E. 1950, Pleistocene geology of the Lake Simcoe district, Ontario. Geological Survey
of Canada, Memoir 256. Duckworth, P.B. 1979. The late depositional history of the western end of the Oak Ridges
Moraine, southern Ontario. Canadian Journal of Earth Sciences, v. 16, p.1094-1107. Easton, R.M. 1992, The Grenville Province and the Proterozoic history of central and southern
Ontario. In Geology of Ontario. Edited by P.C Thurston, H.R. Williams, R.H. Sutcliffe, and G.M. Stott. Ontario Geological Survey, Special Volume 4, Part 2, pp. 715-904.
Eyles, N.E. 1987. Late Pleistocene depositional systems of Metropolitan Toronto and their
engineering and glacial geological significance. Canadian Journal of Earth Sciences, 24, p.1009-1021.
Eyles, N. 1997. Chapter 2. Environmental Geology of a Supercity: The Greater Toronto Area.
In Eyles, N. (Ed), Environmental Geology of Urban Areas, Geological Association of Canada, Geotext #3, 7-80.
Earthfx. 2006. ViewLog modelled GRD output files dated June 9, 2006. Eyles, N. 2002. Ontario rocks: three billion years of environmental change. Fitzhenry and
Whiteside, Markham, Ontario.
Don River Watershed Plan: Geology and Groundwater Resources – Report on Current Conditions
Toronto and Region Conservation CFN: 37590 60 2009
Eyles, N., J. Boyce, and A.A. Mohajer, 1993. The bedrock surface of the western Lake Ontario Region: Evidence of reactivated basement structures. Geographie physique et Quaternaire, 1993, vol. 47, N. 3, pp 269-283.
Eyles, N. and B.M. Clark. 1988. Last interglacial sediments of the Don Valley Brickyard,
Toronto, Canada, and their paleoenvironmental significance. Can. J. Earth Sci., 25, 1108-1122.
Eyles, N., B.M. Clark, B.G. Kaye, K.W.F. Howard and C.H. Eyles. 1985. The application of
basin analysis techniques to glaciated terrains: an example from the Lake Ontario basin, Canada. Geoscience Canada, v. 12, p. 22-32.
Fligg, K., and B. Rodrigues. 1983, Geophysical well log correlations between Barrie and the
Oak Ridges Moraine. Water Resources Branch, Ontario Ministry of the Environment, Map 2273.
Freeze, R.A. and J.A. Cherry. 1979. Groundwater. Prentice Hall, Inc. USA. Gerber, R.E. 1994. Recharge analysis for the central portion of the Oak Ridges Moraine.
Unpublished M.Sc. thesis, University of Toronto. Gerber, R.E. 1999. Hydrogeologic behaviour of the Northern till aquitard near Toronto, Ontario.
Ph.D. thesis, University of Toronto, 172p. Gerber, R.E., and K.W.F. Howard. 1996. Evidence for recent groundwater flow through Late
Wisconsinan till near Toronto, Ontario. Canadian Geotechnical Journal, v. 33, p. 538-555.
Gerber, R.E. and K.W.F. Howard. 2000. Recharge through a regional till aquitard: three-
dimensional flow model water balance approach. Ground Water, 38 (3), 410-422. Gerber, RE, J.I. Boyce and K.W.F. Howard. 2001. Evaluation of heterogeneity and field-scale
groundwater flow regime in a leaky till aquitard. Hydrogeology Journal, 9 : 60-78. Gerber, R.E., and S. Holysh. 2005. Geology and Groundwater Resources, Toronto and Region
Conservation Authority watersheds, Draft v1. Prepared for Ontario Ministry of Northern Development and Mines and Ontario Geological Survey. January 31.
Gilbert, R. 1997. Glaciolacustrine sedimentation in part of the Oak Ridges Moraine, Géographie
Physique et Quaternaire, 7(1): 55-66. Gilbert, R. and J. Shaw. 1994, Inferred subglacial meltwater origin of lakes on the southern
border of the Canadian Shield. Canadian Journal of Earth Sciences, 31(11), 1630 - 1637.
Golder Associates. 2001. City of Toronto Borehole Database Manual Report (v1). Prepared in
support of WWFMMP Report prepared for the City of Toronto. Available from City of Toronto Urban Affairs Library, 1st Floor Metro Hall, 55 John Street, Toronto, Ontario.

Don River Watershed Plan: Geology and Groundwater Resources – Report on Current Conditions
Toronto and Region Conservation CFN: 37590 61 2009
Graham, EI, HR Whiteley and NR Thomson. 1997. Development and initial refinement of a
water balance model as a planning tool for stormwater management application. Advances in Modeling and Management of Stormwater Impacts, Vol. 5, W James (editor). Published by CHI, Guelph, Canada.
Gwyn, Q.H.J. and W.R. Cowan. 1978, The origin of the Oak Ridges and Orangeville moraines
of southern Ontario. Canadian Geographer, XXII, v. 4, p. 345-351. Gwyn, Q.H.J., and R.N.W. DiLabio. 1973, Quaternary geology of the Newmarket area,
southern Ontario. Ontario Division of Mines, Preliminary Map P836, scale 1:50,000. Haefeli, C.J. 1970, Regional groundwater flow between Lake Simcoe and Lake Ontario.
Department of Energy, Mines and Resources, Inland Waters Branch Technical Bulletin 23.
Harbaugh, A.W. and M.G. McDonald. 1996. User’s documentation for MODFLOW-96, an
update to the U.S. Geological Survey modular finite-difference ground-water flow model. U.S. Geological Survey Open-File Report 96-485, 56p.
Hicock, S.R. and A. Dreimanis. 1989. Sunnybrook drift indicates a grounded, early Wisconsin
glacier in the Lake Ontario basin. Geology, 17, 169-172. Hill, M.C. 1990. Preconditioned Conjugate-Gradient 2 (PCG2), A Computer Program for
Solving Ground-Water Flow Equations. U.S. Geological Survey, Water-Resources Investigations Report 90-4048.
Hinton, MJ. 1996. Measuring stream discharge to infer the spatial distribution of groundwater
discharge. In Proceedings of the Watershed Management Symposium, Canada Centre for Inland Waters, Burlington, Ontario. Canada. December 6-8, 1995, 27-32.
Holden, K.M., J. Thomas and P.F. Karrow. 1993d. Bedrock topography, Newmarket area,
southern Ontario. Ontario Geological Survey, Preliminary Map P.3214, Scale 1:50,000. Holysh, S. and S.D. Davies. 2003. Groundwater resource inventory papers (GRIPs) for the
Oak Ridges Moraine area. In Summary of Field Work and Other Activities 2003, Ontario Geological Survey, Open File Report 6120, p30-1 to 30-8.
Holysh, S, J. Pitcher and D. Boyd. 2001. Regional Groundwater Mapping: An Assessment
Tool for Incorporating Groundwater into the Planning Process. www.grandriver.ca/groundwater/cwra_paper.pdf.
Howard, K.W.F., and P. Beck. 1986, Hydrochemical interpretation of groundwater flow
systems in Quaternary sediments in southern Ontario. Canadian Journal of Earth Sciences, v. 23, p. 938-947.
Howard, K.W.F., N. Eyles, P. Smart, J. Boyce, R.E. Gerber, S.L. Salvatori and M. Doughty.
1997. The Oak Ridges Moraine of southern Ontario: a ground-water resource at risk. In
Don River Watershed Plan: Geology and Groundwater Resources – Report on Current Conditions
Toronto and Region Conservation CFN: 37590 62 2009
N. Eyles editor, Environmental Geology of Urban Areas, Geological Association of Canada, pp.153-172.
Hunter and Associates and Raven Beck Environmental Ltd. 1996. Hydrogeological evaluation
of the Oak Ridges Moraine area: technical report. Part of Background Report 3 for the Oak Ridges Moraine Planning Study. Prepared for the Oak Ridges Moraine Technical Working Committee.
Jensen, M.E. and H.R. Haise. 1963. Estimating evapotranspiration from solar radiation.
Proceedings of the American Society of Civil Engineers, Journal of Irrigation and Drainage, Vol. 89, No. IR4, 15-41.
Johnson M.D., D.K. Armstrong, B.V. Sanford, P.G. Telford and M.A. Rutka. 1992. Paleozoic
and Mesozoic Geology of Ontario. In : Geology of Ontario, Edited by P.C. Thurston and others, Ministry of Northern Development and Mines, 907-1010.
Karrow, PF. 1967. Pleistocene geology of the Scarborough area. Ontario Geological Survey,
Report 46, Ontario Department of Mines. Karrow, P.F. 1970. Bedrock Topography, Thornhill Area, York County. Ontario Department of
Mines, Preliminary Map P.574, Scale 1 :25,000. Karrow, P.F. 1989, Quaternary geology of the Great Lakes subregion. In Chapter 4, Quaternary
Geology of Canada and Greenland. Edited by J.O. Wheeler, Geological Survey of Canada, Geology of Canada, v. 1, pp. 326-350.
Karrow, P.F. 1992. Bedrock Topography of the Markham Area, Southern Ontario. Ontario
Geological Survey, Open File Map 196, Bedrock Topography Ser., Scale 1 :50,000. Compilation 1991.
Karrow, P.F, J.H. McAndrews, B.B. Miller, A.V. Morgan, K.L. Seymour and O.L. White. 2001.
Illinoian to Late Wisconsinan stratigraphy at Woodbridge, Ontario. Canadian Journal of Earth Sciences, 38(6), 921-942.
Kassenaar, J.D.C. and Wexler, E.J., 2006. Groundwater Modelling of the Oak Ridges Moraine
Area. CAMC-YPDT Technical Report #01-06. Kelley, R.I. and I.P. Martini. 1986. Pleistocene glacio-lacustrine deltaic deposits of the
Scarborough Formation, Ontario, Canada. Sedimentary Geology, 47, 27-52. Lenney, S. and F Kenny, 2003. Standardized Hummocky and Closed Drainage Topography
Mapping. Summary Report prepared by the Ontario Ministry of Natural Resources for the Conservation Authorities Moraine Coalition; 20 pp.
MacViro Consultants Inc and CH2M HILL Canada Limited. 2003. Combined Sewer Service
Area, Study Area 1 of City of Toronto, Toronto Wet Weather Flow Management Master Plan. Report prepared for the City of Toronto.
Don River Watershed Plan: Geology and Groundwater Resources – Report on Current Conditions
Toronto and Region Conservation CFN: 37590 63 2009
Marshall Macklin Monaghan Limited. 2002. Don watershed HSP-F output. Prepared for the Toronto and Region Conservation Authority. May 7.
Marshall Macklin Monaghan Limited. 2003. Wet Weather Flow Management Master Plan -
Stage 2, Don River Watershed, Study Area 4. Report for the City of Toronto. July. Martini, I.P. and M.E. Brookfield. 1995, Sequence analysis of upper Pleistocene (Wisconsinan)
glaciolacustrine deposits of the north-shore bluffs of Lake Ontario, Canada. Journal of Sedimentary Research, v. B65 (3), p. 388-400.
McDonald, M.G. and A.W. Harbaugh. 1988. Chapter A1: A modular three-dimensional finite-
difference ground-water flow model, Book 6 modeling techniques. Techniques of Water-Resources Investigations of the United States Geological Survey.
McDonald, M.G., A.W. Harbaugh, B.R. Orr and D.J. Ackerman. 1991. A method of converting
no-flow cells to variable-head cells for the U.S. Geological Survey modular finite-difference ground-water flow model. U.S. Geological Survey, Open-File Report 91-536.
Metropolitan Toronto and Region Conservation Authority (MTRCA). 1994. Forty Steps to a New
Don. The Report of the Don Watershed Task Force. Toronto, Ontario: MTRCA. Middleton, G.V. 2004. J.W. Spencer (1851-1921): his Life in Canada, and his Work on
Preglacial River Valleys. Geoscience Canada, 31 (2), 49-56. Morton, FI. 1983. Operational estimates of areal evapotranspiration and their significance to
the science and practice of hydrology. Journal of Hydrology, 66, 1-76. Mowatt, GD. 2000. A finite element groundwater flow model analysis of the glacial stratigraphy
of the Greater Toronto area. Unpublished M.Sc. thesis, University of Toronto. Ontario Ministry of the Environment. 2001. Municipal Groundwater Studies 2001/2002,
Summary of Study Requirements. August, 2001. Land Use Policy Branch. Ontario Ministry of the Environment. 2001. Municipal Groundwater Studies 2001/2002,
Technical Terms of Reference. November, 2001. Ontario Ministry of the Environment. 2004. Watershed-Based Source Protection Planning,
Science-based Decision-making for Protecting Ontario’s Drinking Water Sources: A Threats Assessment Framework, Technical Experts Committee, Report to the Minister of the Environment. November.
Ontario Ministry of Municipal Affairs and Housing. 2002. Oak Ridges Moraine Area, Areas of
High Aquifer Vulnerability. Reference map for Ontario Regulation 140/02 (Oak Ridges Moraine Conservation Plan) made under the Oak Ridges Moraine Conservation Act, 2001. 1:50,000 scale (www.mah.gov.on.ca).
Ontario Ministry of Transportation. 1997. MTO Drainage Manual, Chapter H, Part 3.
Don River Watershed Plan: Geology and Groundwater Resources – Report on Current Conditions
Toronto and Region Conservation CFN: 37590 64 2009
Phillips, D.W. and McCulloch, J.A.W., 1972, The Climate of the Great Lakes Basin: Climatological Studies, Number 20, Environment Canada, Atmospheric Environment Service.
Pollock, D.W. 1989. Documentation of computer programs to compute and display pathlines
using results from the U.S. Geological Survey modular three-dimensional finite-difference ground-water flow model. U.S. Geological Survey, Open-file Report 89-381.
Pugin, A., S.E. Pullen and D.R. Sharpe. 1996. Observations of tunnel channels in glacial
sediments with shallow land-based seismic reflection. Annals of Glaciology, v. 22, p. 176-180.
Pugin, A., S.E. Pullan and D.R. Sharpe. 1999. Sharpe Seismic facies and regional architecture
of the Oak Ridges Moraine area, southern Ontario. Canadian Journal of Earth Sciences, 36 : 409-432.
Pullan, S.E., A. Pugin, L.D. Dyke, J.A. Hunter, J.A. Pilon, B.J. Todd, V.S. Allen and P.J. Barnett,
P.J. 1994, Shallow geophysics in a hydrogeological investigation of the Oak Ridges Moraine, Ontario. In Proceedings, symposium on the application of geophysics to engineering and environmental problems. Edited by Bell, R.S. and Lepper, C.M., March 27-31, Boston, Massachusetts, v. 1, p. 143-161.
Rogers, D.P., R.C. Ostry and P.F. Karrow. 1961. Metropolitan Toronto Bedrock Contours.
Ontario Department of Mines, Preliminary Map 102. Russell, H.A.J, R.W.C. Arnott and D.R. Sharpe. 2002. Evidence for rapid sedimentation in a
tunnel channel, Oak Ridges Moraine, southern Ontario, Canada. Sedimentary Geology, 3134, 1-23.
Russell, H.A.J., T.A. Brennand, C. Logan and D.R. Sharpe. 1998. Standardization and
assessment of geological descriptions from water well records, Greater Toronto and Oak Ridges Moraine areas, southern Ontario. In Current Research 1998-E; Geological Survey of Canada, 89-102.
Russell, H.A.J, D.R. Sharpe and C. Logan. 2002a. Structural Model of the Oak Ridges Moraine
and Greater Toronto Areas, Southern Ontario : Halton Till. Geological Survey of Canada, Open File 4239, scale 1 :250,000.
Russell, H.A.J, D.R. Sharpe and C. Logan. 2002b. Structural Model of the Oak Ridges Moraine
and Greater Toronto Areas, Southern Ontario : Oak Ridges Moraine Sediment. Geological Survey of Canada, Open File 4240, scale 1 :250,000.
Russell, H.A.J, D.R. Sharpe, T.A. Brennand, P.J. Barnett and C. Logan. 2003. Tunnel
Channels of the Oak Ridges Moraine and Greater Toronto Area, Southern Ontario. Geological Survey of Canada, Open File 4485, scale 1 :250,000.
Don River Watershed Plan: Geology and Groundwater Resources – Report on Current Conditions
Toronto and Region Conservation CFN: 37590 65 2009
Sado, E., O.L. White, P.J. Barnett and D.R. Sharpe. 1984, The glacial geology, stratigraphy and geomorphology of the North Toronto area: a field excursion. In Correlation of Quaternary Chronologies. Edited by W. C. Mahaney, GeoBooks, Norwich, pp. 505-517.
Sanford, B.V., F.J. Thompson and G.H. McFall. 1985, Plate tectonics - a possible controlling
mechanism in the development of hydrocarbon traps in southwestern Ontario. Bulletin of Canadian Petroleum Geology, v. 33(1), p. 52-76.
Sarvas, P., R.I. Kelly and C.L. Baker. 2004. Groundwater resource projects (GRPs). In
Summary of Field Work and Other Activities 2004, Ontario Geological Survey, Open File Report 6145, p25-1 to 25-4.
Scheidegger, A.E., 1980, The orientation of valley trends in Ontario. Zeitschrift für
Geomorphologie, v. 24, p. 19-30. Sharpe, D.R. and H.A.J. Russel. 2001. The Aurora-Maple Channel Aquifer System in the Oak
Ridges Moraine Area, southern Ontario. (http://sts.gsc.nrcan.gc.ca/page1/envir/orm/orm.htm)
Sharpe, DR, PJ Barnett, TA Brennand, D Finley, G Gorrell, HAJ Russel and P Stacey. 1997.
Surficial Geology of the Greater Toronto and Oak Ridges Moraine Area, Southern Ontario; Geological Survey of Canada, Open File 3062, Scale 1:200,000.
Sharpe, D.R., L.D. Dyke, M.J. Hinton, S.E. Pullan, H.A.J. Russell, T.A. Brennand, P.J. Barnett
and A. Pugin. 1996. Groundwater prospects in the Oak Ridges Moraine area, southern Ontario: application of regional geological models. In Current Research 1996-E. Geological Survey of Canada, p. 181-190.
Sharpe, D.R., L.D. Dyke and S.E. Pullan. 1994. Hydrogeology of the Oak Ridges Moraine:
partners in geoscience, Geological Survey of Canada, Open File 2867. Sharpe, D.R., M.J. Hinton, H.H.J. Russell, and A. Desbarats, March, 2002. The Need for Basin
Analysis in Regional Hydrogeological Studies, Oak Ridges Moraine, Southern Ontario. Geoscience Canada, Volume 29, Number 1.
Sharpe, D.R., A. Pugin, S. Pullan and J. Shaw. 2004. Regional unconformities and the
sedimentary architecture of the Oak Ridges Moraine area, southern Ontario. Canadian Journal of Earth Sciences, 41, 183-198.
Sharpe, D.R., H.A.J. Russell and C. Logan. 2002a. Structural Model of the Oak Ridges
Moraine and Greater Toronto Areas, Southern Ontario : Newmarket Till. Geological Survey of Canada, Open File 4241, scale 1 :250,000.
Sharpe, D.R., H.A.J. Russell and C. Logan. 2002b. Structural Model of the Oak Ridges
Moraine and Greater Toronto Areas, Southern Ontario : Lower Sediment. Geological Survey of Canada, Open File 4242, scale 1 :250,000.
Don River Watershed Plan: Geology and Groundwater Resources – Report on Current Conditions
Toronto and Region Conservation CFN: 37590 66 2009
Shaw, J., and D.R. Sharpe. 1987. Drumlin formation by subglacial meltwater erosion; Canadian Journal of Earth Sciences, 24: 2316-2322.
Shaw, J. and R. Gilbert. 1990. Evidence for large-scale subglacial meltwater flood events in
southern Ontario and northern New York State. Geology, v. 18, p. 1169-1172. Smart, PJ. 1994. A water balance numerical groundwater flow model analysis of the Oak
Ridges Aquifer Complex, south central Ontario. Unpublished M.Sc. thesis, University of Toronto.
Spencer, J.W., 1881. Discovery of the preglacial outlet of the basin of Lake Erie into that of
Lake Ontario. Canadian Naturalist (New series), v. 10, p. 65-79. Toronto and Region Conservation Authority (TRCA). 2009. Baseflow and Water Use
Assessment – Report on Current Conditions. Don River Watershed Plan. Turner, M.E., 1978. Oak Ridges Aquifer Complex. Major Aquifers in Ontario Series, Ontario
Ministry of the Environment, Hydrogeological Map 78-2, Scale 1 :100,000. Viessman, W, J.W. Kanpp, G.L. Lewis and T.E. Harbaugh. 1977. Introduction to Hydrology,
Second Edition. Harper and Row. Vrba, J and A Zaporozec. 1994. Guidebook on Mapping Groundwater Vulnerability.
International Association of Hydrogeologists, International Contributions to Hydrogeology, Volume 16.
Walton, W.C. 1970. Groundwater Resource Evaluation. McGraw-Hill Book Company. Watt, AK. 1957. Pleistocene geology and ground-water resources of the Township of North
York, York County. Sixty-fourth annual report of the Ontario Department of Mines. White, OL. 1975. Quaternary geology of the Bolton area, southern Ontario. Geological Report
117, Ontario Division of Mines. Zaporozec, A. 1972. Graphical interpretation of water quality data. Ground Water, 10, 32-43.

Don River Watershed Plan: Geology and Groundwater Resources – Report on Current Conditions
Toronto and Region Conservation CFN: 37590 67 2009
APPENDIX A: PGMN Groundwater Hydrograph
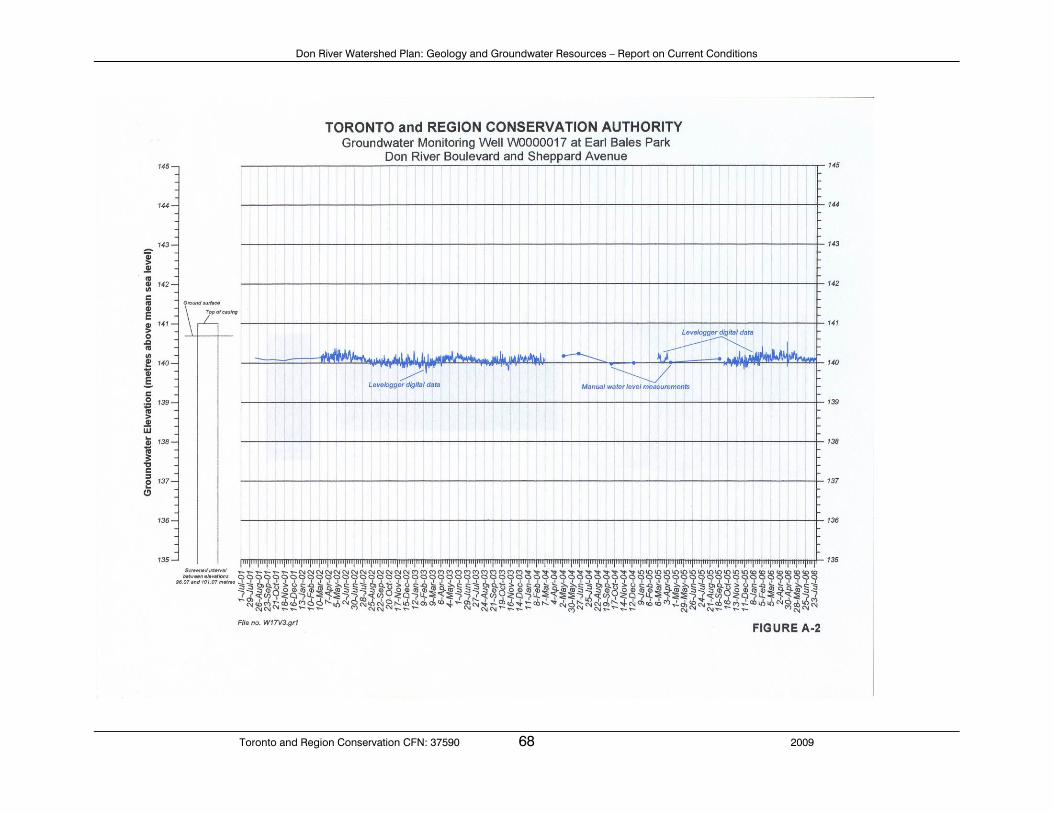
Don River Watershed Plan: Geology and Groundwater Resources – Report on Current Conditions
Toronto and Region Conservation CFN: 37590 68 2009
Don River Watershed Plan: Geology and Groundwater Resources – Report on Current Conditions
Toronto and Region Conservation CFN: 37590 69 2009
APPENDIX B: Groundwater Chemical Quality

Don River Watershed Plan: Geology and Groundwater Resources – Report on Current Conditions
Toronto and Region Conservation CFN: 37590 70 2009
DON RIVER WATERSHED
PROVINCIAL GROUNDWATER MONITORING WELL - North York - W000017
CHEMICAL WATER QUALITY RESULTS - METALS
Date Sampled
Parameter ODWS October 5,
2003 October 5,
2004 December 6,
2004
Laboratory MOE Entech Entech
Aluminum 0.1 0.0001 <0.0008 <0.0008
Antimony 0.006 0.00028 <0.001 <0.001
Arsenic 0.025 0.0001 <0.001 <0.001
Barium 1 0.212 0.21 0.065
Beryllium <0.00005 <0.00004 <0.00004
Bismuth n/a <0.001 <0.001
Boron 5 0.068 0.074 0.01
Cadmium 0.005 0.00002 <0.0001 <0.0001
Chromium 0.05 0.0016 <0.001 <0.001
Copper 1 0.0003 0.00092 0.004
Iron 0.3 2 3.057 <0.001
Lead 0.01 <0.00005 0.001 <0.0006
Manganese 0.05 0.0827 0.097 0.056
Mercury 0.001 n/a <0.00002 <0.00002
Molybdenum 0.00024 0.004 0.027
Nickel 0.0005 <0.0002 <0.0002
Selenium 0.01 <0.001 <0.001 <0.001
Silver <0.00005 <0.0001 0.00014
Strontium 0.578 0.552 0.082
Thallium <0.00005 n/a n/a
Titanium 0.0002 <0.0002 <0.0002
Uranium 0.02 <0.00005 n/a n/a
Vanadium 0.00011 0.00048 0.0002
Zinc 5 0.0016 0.007 0.001
Note: a) units in mg/l, b) n/a = not analyzed

Don River Watershed Plan: Geology and Groundwater Resources – Report on Current Conditions
Toronto and Region Conservation CFN: 37590 71 2009
DON RIVER WATERSHED
PROVINCIAL GROUNDWATER MONITORING WELL - North York - W000017
CHEMICAL WATER QUALITY RESULTS - GENERAL PARAMETERS
Date Sampled
Parameter ODWS October 5,
2003 October 5,
2004 December 6,
2004
Laboratory MOE Entech Entech
Calcium 77 72.445 19.132
Magnesium 24.2 22.37 4.981
Potassium 1.9 2.449 6.94
Sodium 200 / 20 22 25.479 24.162
Chloride 250 16.9 n/a n/a
Fluoride 1.5 0.16 n/a n/a
Sulphate 500 11.1 n/a n/a
Alkalinity(as CaCo3) 300-500 n/a 302 88.4
Nitrate(as N) 10 n/a <0.005 <0.005
Nitrite (as N) 1 n/a <0.005 <0.005 Total kjeldahl nitrogen (as N) 2.21 2.2 1.1
Ammonia n/a 2 1
Phosphorous (Total) 0.02 0.22 0.19 0.02
Conductivity (FS/cm) n/a 585 253 Dissolved Inorganic Carbon 77 43.5 13
Dissolved Organic Carbon 5 2.4 2.9 2.3
Hardness 80-100 292 275 66.4
Silicon (reactive) 12.1 n/a n/a
Total Dissolved Solids 500 367 464 150
pH 6.5-8.5 n/a 7.5 7.7
Note: a) units in mg/l or as indicated


