60
Don’t Drip and Drive A Social Marketing Program to Address Vehicle Leaks Report Prepared By The Don’t Drip and Drive Steering Committee Grant Funding Provided By:
Don’t Drip and Drive A Social Marketing Program to Address Vehicle Leaks
Report Prepared By The Don’t Drip and Drive Steering Committee
Grant Funding Provided By:


i
Executive Summary
Project Overview
The Don’t Drip and Drive program addresses an important source of pollution in the Puget Sound region - vehicles that leak fluids and cause significant water quality impairments. From November 2013 to March 2015, Stormwater Outreach for Regional Municipalities (STORM) and King County Education, Communication and Outreach Network (King ECO Net) conducted Don’t Drip and Drive Phase II: a Behavior Change Program, designed to improve vehicle owners’ awareness of leaks and motivate them to fix their leaks. Phase II built upon work conducted in Phase I (spring 2013).
Phase II included the following key components:• CampaignPromotion-Online advertising, social media and other localized media
channels to promote campaign messages and direct our target audience to a resource website
• Events-Leak check events to identify leaking vehicles, promote repairing leaks and testing different intervention strategies for effectiveness
• ParticipatingRepairShops-Free leak inspections and discounted repairs provided by participating repair shops
• Workshops-Free auto leaks inspection workshops at technical training centers taught by mechanic instructors that provide information about vehicle maintenance, with a focus on leak repair.
The Phase II campaign goals were to build vehicle owners’ awareness of their vehicle leak and increase their likelihood of repairing it within three months. The program’s long-term goal is to change social norms so that people value finding and fixing vehicle leaks.
The campaign adopted a social marketing1 approach to design a program that makes it easier for the vehicle owners to fix leaks. This includes minimizing barriers that impede their ability to repair their vehicle and using motivating messages that emphasize the benefits of making repairs that resonate with vehicle owners. The target audience for the Phase II campaign is vehicle owners aware of their leaking vehicle who are over 25 years old, have an income of $40,000 or more, own a vehicle more than two years old and want to get the leak repaired.
1 Social marketing seeks to develop and integrate marketing concepts with other approaches to influence behavior that benefit individuals and communities for the greater social good. (Wikipedia, 2015)
Did you know?
Washington Department of Ecology estimates that 7 million quarts of oil are carried to the Puget Sound watershed annually impacting fish and wildlife habitat. (Herrera, 2011)

ii Executive Summary
Summary of Results
The campaign achieved and, in many cases, exceeded its goals.
Objectives Outcomes
Hold a minimum of 20 leak check events 34 leak check events heldReach 16,500 vehicle owners through the campaign
28,325 vehicle owners reached through leak check events, participating repair shops and the campaign website
Influence vehicle owners to repair a minimum of 1,600 vehicles region-wide
An estimated 1,669 vehicle leaks repaired (extrapolated from 714 reported repairs)
To reach drivers, the campaign used a combination of regional advertising and a variety of face-to-face strategies: online advertising, the campaign website, leak check events, participating auto shops and other outreach activities. The estimated 28,325 vehicle owners were reached as follows:
• 8,308 vehicles received free inspections for leaks through direct contact: ‐ Leak check events - 3,819 cars were tested and 271 leaks were identified ‐ Participating repair shops - 4,489 vehicles were checked and 1,296 leaks were identified (not all tracking forms were received, so this number represents a minimum)• The remaining vehicle owners were reached through campaign promotions: ‐ Campaign website - 20,017 website visitors – with an average visit length of almost 4 minutes2 ‐ Advertising - More than 12 million online ad impressions - website visits dropped 74% the day the ads ended ‐ Partner organizations – the campaign was promoted by at least thirteen partner organizations
Overall, at least 1,669 leaks were estimated to be repaired as a result of the campaign. The campaign tracked 714 reported vehicle repairs. This may be under-reported due to many participating shops that did not turn in tracking forms and event participants that did not respond to the follow-up survey. Figure 1, the program infographic provides key program results.
2 “ Users often leave Web pages in 10-20 seconds, but pages with a clear value proposition can hold people’s attention for much longer…” (Nielson, 2011)
Table 1 highlights program objectives and
outcomes
Left photo: Oil leak in parking lot in Kirkland (Credit Tiffany O’Dell)
Right photo: Oil leak in parking lot in Puyallup (Credit Tiffany O’Dell)

iiiExecutive Summary
Leak rates varied among leak check events and repair shops. Based on Phases I and II data, the overall vehicle leak rate across the region is approximately 10% (for leaks that drip directly onto pavement without combustion). Based on approximately 4.5 million vehicles in the Puget Sound region, this translates to approximately 450,000 leaking vehicles.
Figure 1 Program infographic STOPPING VEHICLE
LEAKS1.7 MILLION VEHICLES IN THE PUGET SOUND REGION LEAK 7 MILLION QUARTS OF OIL A YEAR
EQUAL TO A TANKER TRUCK PER DAY!
102AUTO SHOPSPARTICIPATED
SHOPS FOUND
3,023LEAKS (EST.)
LEAKSREPAIRED 79%46% IN 2 WEEKS 59% IN 3 MONTHS
REPAIR SHOPS
FIX IT
NO LEAKS!
LEAKSREPAIRED 39%19% IN 2 WEEKS 35% IN 3 MONTHS
LEAK CHECKEVENTS
3,819 CARS TESTED
271 LEAKS IDENTIFIED
2/3 OF EVENT LEAKERS WHO VISITED
A SHOP USED THEIR REGULAR SHOP
NO LEAKS!
43% COMPLETED REPAIRS
33% PARTIAL REPAIRS
WORKSHOPS 65% OF VEHICLES HAD LEAKS
95WORKSHOPS
1,120ATTENDEES
WHY FIX?TO KEEP CAR RELIABLE,
PREVENT DAMAGE TO CAR, AND PROTECT ENVIRONMENT
WHY WAIT?SAVE UP MONEY AND
WAIT FOR CONVENIENT TIME OR PLACE
WHY NOT FIX?
NOT WORTH FIXING, CAN’T AFFORD COST, THINK LEAK
IS NOT A BIG PROBLEM
REASONS TO FIX OR NOT FIX
20,017WEBSITE VISITORS
Average visit was 3.75 minutes
CAMPAIGN PROMOTION
WEBSITE VISITS DROPPED 74% THE DAY
ADS ENDED12 MILLION+
ONLINE AD IMPRESSIONS
FRIENDLY‛S REPAIR
2015 DO
N’T D
RIP AN
D D
RIVE VISIT O
UR W
EBSITE: FIXCARLEA
KS.ORG
DO
WN
LOA
D TH
E PHA
SE II FINA
L REPORT: PIERCECO
UN
TYWA
.ORG
/DO
NTD
RIPAN
DD
RIVE
iv Executive Summary
Participant Follow-up Survey Results
Vehicle owners reached at leak check events and participating shops were surveyed three to six months later. Survey information collected included:
• whether they fixed their leak, • the repair costs and motivations, and • barriers regarding getting leaks repaired.
Vehicle owners who participated in workshops were surveyed through a separate evaluation process that used different measures. Evaluation results for the workshops are in Appendix 1.
Vehicle owners that participated in a leak check event:• 35% of leakers made repairs: 19% within two weeks and 35% within three months • 32% of leakers didn’t plan to repair their leaks
Vehicle owners that visited a participating repair shop:• 79% of leakers made repairs, 46% within two weeks and 59% within three months • 10% of leakers didn’t plan to repair their leaks
Most respondents who visited a repair shop learned about Don’t Drip and Drive from the repair shop, as opposed to events or advertising. Most respondents who attended a leak check event took their vehicle to their regular repair shop. About half of workshop participants also reported taking their vehicle to their regular repair shop.
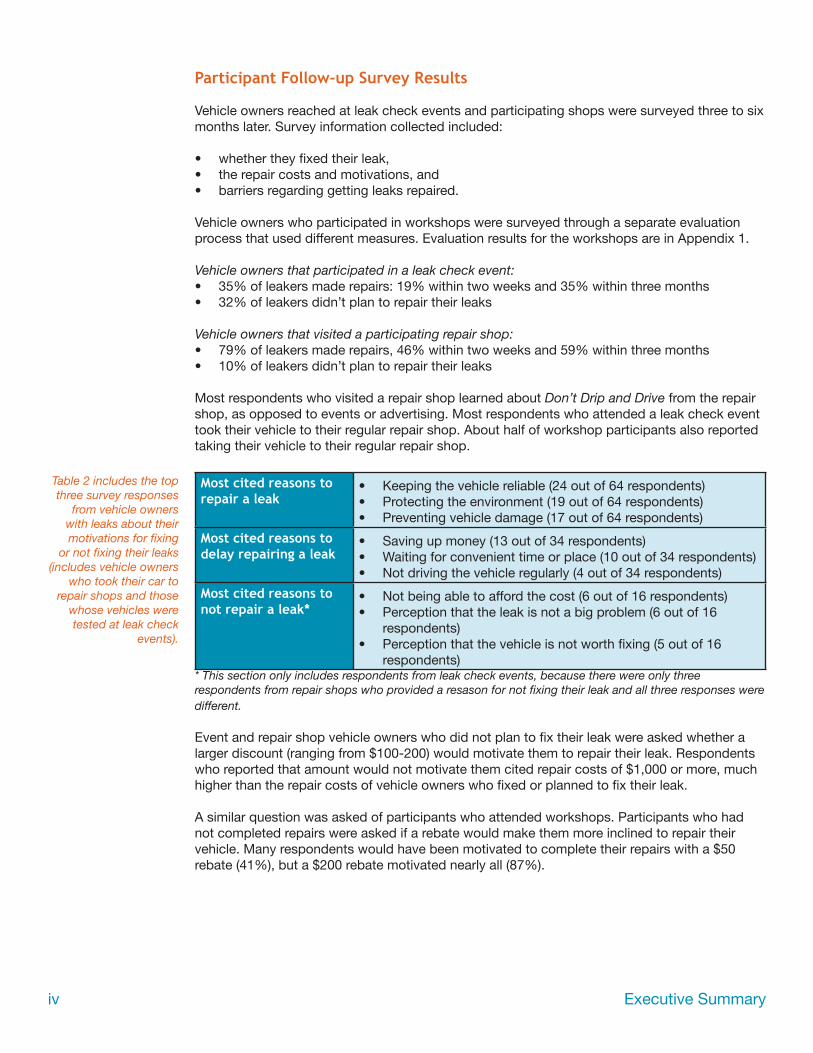
Most cited reasons to repair a leak
• Keeping the vehicle reliable (24 out of 64 respondents) • Protecting the environment (19 out of 64 respondents)• Preventing vehicle damage (17 out of 64 respondents)
Most cited reasons to delay repairing a leak
• Saving up money (13 out of 34 respondents)• Waiting for convenient time or place (10 out of 34 respondents)• Not driving the vehicle regularly (4 out of 34 respondents)
Most cited reasons to not repair a leak*
• Not being able to afford the cost (6 out of 16 respondents)• Perception that the leak is not a big problem (6 out of 16
respondents)• Perception that the vehicle is not worth fixing (5 out of 16
respondents)* This section only includes respondents from leak check events, because there were only three respondents from repair shops who provided a resason for not fixing their leak and all three responses were different.
Event and repair shop vehicle owners who did not plan to fix their leak were asked whether a larger discount (ranging from $100-200) would motivate them to repair their leak. Respondents who reported that amount would not motivate them cited repair costs of $1,000 or more, much higher than the repair costs of vehicle owners who fixed or planned to fix their leak.
A similar question was asked of participants who attended workshops. Participants who had not completed repairs were asked if a rebate would make them more inclined to repair their vehicle. Many respondents would have been motivated to complete their repairs with a $50 rebate (41%), but a $200 rebate motivated nearly all (87%).
Table 2 includes the top three survey responses
from vehicle owners with leaks about their motivations for fixing
or not fixing their leaks (includes vehicle owners
who took their car to repair shops and those
whose vehicles were tested at leak check
events).

vExecutive Summary
Recommendations for Future Implementation
Lessons learned in Phase II significantly expanded the understanding of vehicle owner motivators and barriers to fixing vehicle leaks and best practices for campaign implementation. The following are the key lessons learned in Phase II and recommendations for future implementation. An expanded list of lessons learned and recommendations is available in the full report.
1. CampaignPromotion-IncorporatePhaseIImessagingintoanexpandedmulti-modalregionalandlocaladvertisingstrategyinfuturephases.Web-based advertising in Phase II successfully identified messaging that attracted the target audience to the campaign’s resources.
• •
• For audiences searching for vehicle leaks information, the two most successful messages emphasized an environmental ethic and preventing a leak from disrupting a vacation. • For a general regional audience, successful messaging emphasized the safety and health of children and the logo and repair discount from participating repair shops. • For audiences in Seattle, environmental messaging was most successful.
Offering the target audience information that addressed the lack of knowledge about vehicle leaks and how to choose a mechanic was effective. Website analytics showed time spent on the website ranged from three to ten minutes, which indicates that the users found this information worth reviewing. Future phases should continue to refine the website based on audience information needs.
2. Leakcheckevents–Continuetoincludeleakcheckeventstoimprovebroad-scalecampaignawarenessandengagepartners.
Leak check events were successful in building broad interest in and awareness about the campaign and measuring the response to vehicle leak repair as a social norm. Events provided a way for partner organizations to support and identify with the campaign and to engage people in diverse locations. Events were difficult and expensive to implement, however, and it was challenging to collect contact information and track behaviors from owners with leaking vehicles. Streamlining
Left photo: Sample ad about safety of children
Middle photo: Sample ad about environmental
impact of leaks
Right photo: Sample of ad about missing
vacation due to leaks
“One of my favorite events was at Point Defiance Zoo, where we had a large team of volunteers who really got into it. It was exciting to see them enthusiastically talk to drivers, test for drips and work together with our team – it was like a big game for a good cause. At the end of the day, we were exhausted, but also felt a lot of satisfaction from all of the people we reached.”
Jimmy Pasch, Event Organizer Puget Soundkeeper Alliance
vi Executive Summary
leak check events in the future by distributing leak check report cards without collecting contact information would help increase program awareness and increase partnership opportunities with organizations and businesses.
The third party mechanic consultation provided at workshops and at many leak check events was well received by participants and seemed to provide additional credibility and support. This strategy needs to be refined so it is available to more vehicle owners and its impact evaluated in future phases.
3. Participatingrepairshops-Expandrepairshoppartnerships.
Phase II confirmed audience research findings that most people take their car to a trusted repair shop. Partnering with more repair shops to reach more vehicle owners will be critical for future campaigns.
Tracking program results is critical when developing a social marketing program. Data from repair shops via tracking sheets were not consistently recorded or turned in. This hampers our understanding of the likelihood of customers to repair their vehicles once they come to a repair shop. We think the likelihood of repairs increases significantly once a person takes their car to a shop. Once we understand the likelihood of repair in general, we will be able to inform program design to be more successful at influencing repairs. For example, we can test whether there is a significant difference in the rate of repairs made when offering different discount amounts (e.g. a $50 vs. $200 discount).
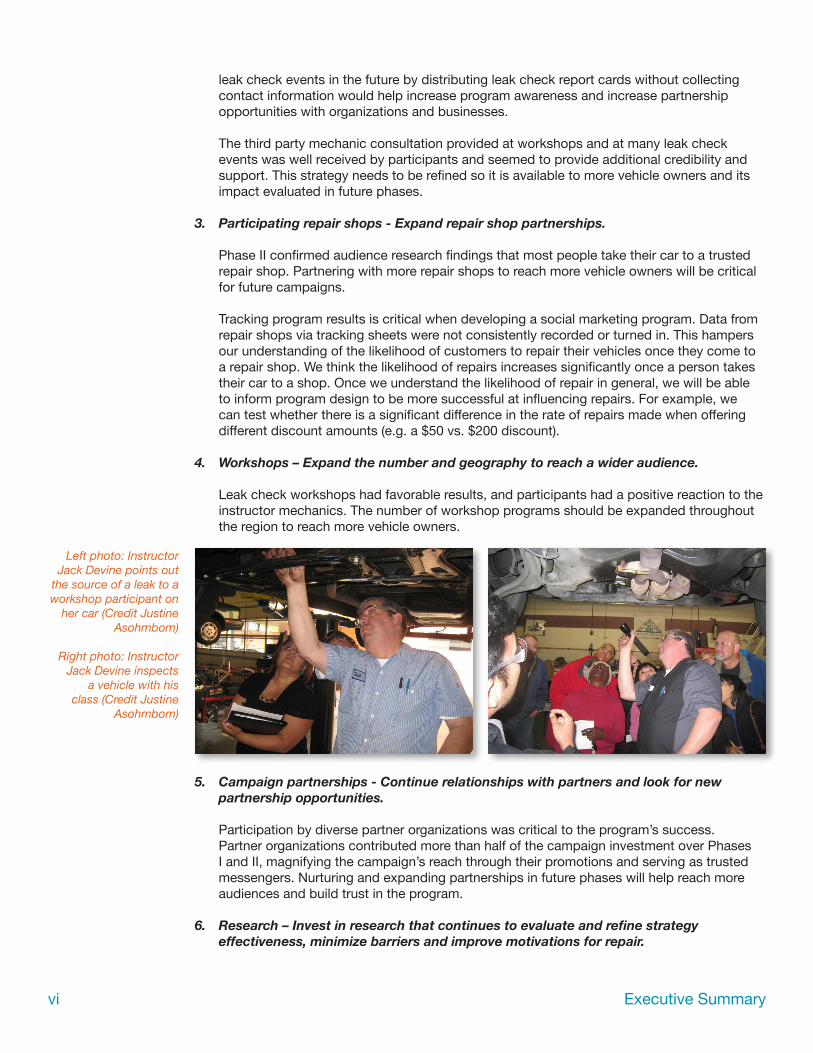
4. Workshops–Expandthenumberandgeographytoreachawideraudience.
Leak check workshops had favorable results, and participants had a positive reaction to the instructor mechanics. The number of workshop programs should be expanded throughout the region to reach more vehicle owners.
5. Campaignpartnerships-Continuerelationshipswithpartnersandlookfornewpartnershipopportunities.
Participation by diverse partner organizations was critical to the program’s success. Partner organizations contributed more than half of the campaign investment over Phases I and II, magnifying the campaign’s reach through their promotions and serving as trusted messengers. Nurturing and expanding partnerships in future phases will help reach more audiences and build trust in the program.
6. Research–Investinresearchthatcontinuestoevaluateandrefinestrategyeffectiveness,minimizebarriersandimprovemotivationsforrepair.
Left photo: Instructor Jack Devine points out
the source of a leak to a workshop participant on
her car (Credit Justine Asohmbom)
Right photo: Instructor Jack Devine inspects
a vehicle with his class (Credit Justine
Asohmbom)

viiExecutive Summary
Research conducted in Phases I and II identified vehicle owner motivators and barriers for repairing leaks. Primary barriers for fixing leaks are cost, convenience and lack of knowledge about vehicle systems. Motivators for fixing leaks include having a reliable vehicle, safety while driving, safety of children and pets, maintaining the value of their vehicle and protecting the environment.
Developing behavior change strategies to address the target audience, subsets of this audience and those who do not fall into this category will increase reach and improve outcomes.
For some leaks, repairs can be extremely expensive, making cost a primary barrier for some members of the target audience to repair. Providing a financial incentive significant enough to influence repair will help support and influence behavior change. Surveys conducted for participants in workshops, customers at repair shops and with participants at leak test events indicate that people are more likely to repair their leak when the discount is $200 or greater.
Data collected in the first two phases of the campaign indicate the number of leaking vehicles ranges from seven to fourteen percent. The Puget Sound region has 4.5 million registered vehicles, or an estimated 315,000 to 630,000 leaking vehicles. As with most behavior change campaigns, the likelihood of change by vehicle owners depends on many factors including the cost of the leak, the value of the vehicle, the owner’s income, the owner’s knowledge of the leak, the severity of the leak, its impact on the vehicle’s performance and other factors. It is important to improve our understanding of why vehicle owners do or don’t fix leaks and continue to refine campaign approaches to have more influence on behavior.
7. Funding-Identifyalong-termfundingsourcetocontinuedevelopmentandimplementationofDon’tDripandDriveasamodelbehaviorchangeprogram.
Accomplishing behavior change related to vehicle leaks requires a long timeline and consistent effort. Phases I and II are the first steps to designing a behavior change program, but efforts to test strategies and develop a model program will require long-term investment. Like programs such as recycling or wearing seatbelts, vehicle leaks will warrant regional behavior change strategies that need a long-term, multiple approach strategy and investment to maintain change.
Conclusion
Regional or statewide approaches to reach residents are likely to be the most efficient and effective way to deliver a consistent and successful program due to the mobile nature of pollution from vehicle leaks. Vehicles move throughout the region, as do the waterways that carry their pollution, thus a program is unlikely to be as successful if it is implemented only on a local scale.
To date, a funding source that allows the campaign to test levels of financial incentives for fixing vehicle leaks has not been identified. For many members of the target audience, the campaign may have some impact on less-expensive repairs, but is unlikely to influence higher repair costs without providing larger financial incentives or implementation of other programs. Identifying future funding sources that allow testing of financial incentives will help us understand the return on investment of financial incentive-based programs compared to regulatory programs. Research of model programs was begun in Phase II and research summary and recommendations are available in Appendix 8.
Addressing the impact of vehicle leaks on the environment requires a strong behavior change
viii Executive Summary
campaign, as well as consideration of other factors. By looking at system-wide approaches to solving the problem, significant reduction in this major pollution source may be possible. Other factors related to vehicle leaks include:
• Stormwaterretrofits- Reducing the impact of leaks on waterways by retrofitting the built environment in areas with high vehicle traffic with drainage systems that direct stormwater runoff to waterways without treatment.
• Regulation- Reducing the number of leaking vehicles through potential regulatory changes addressing condition of vehicles when they are bought, sold and driven throughout the region, similar to the steps that have been taken to reduce vehicle emissions pollution.
• Vehicledesign- Reducing leaks or impacts of leaks by encouraging automotive manufacturers to search for solutions by designing vehicles differently, or developing vehicle fluids that have less environmental impact.
• Short-termprevention- Reducing impacts of leaks by using technologies or tools to contain leaks and limit damage until vehicles can be repaired.
Vehicle leaks are a multifaceted issue causing significant pollution in the Puget Sound watershed. This complexity is magnified by the mobile nature of the pollution source. A strong Don’t Drip and Drive campaign that supports behavioral change and a shift of a regional social norm that heightens the value of car care and the environment creates the foundation for addressing a problem of this complexity.

ix
Acknowledgements
This document is dedicated to the residents throughout the Puget Sound region who have donated countless hours developing and implementing education and outreach programs aimed at protecting water quality and our region’s quality of life. The following are significant contributors to the program, but many others are great partners without whom could not do this work.
VehicleLeaksSteeringCommittee– Provided general campaign leadership, organization and oversight of day-to-day operations:
• Doug Rice, King County• Heather Trim, Futurewise – Puget Sound Partnership social marketing grant project manager• Justine Asohmbohm, Ecology – co-manager of leak inspection workshop program • Mary Rabourn, King County • Stef Frenzl, Snohomish County• Tiffany O’Dell, Pierce County – Ecology Grant of Regional or Statewide Significance project
manager
VehicleLeaksAdvisoryCommittee- Composed of education and outreach professionals from jurisdictions and organizations throughout the Puget Sound region. Throughout the program, the Advisory Committee provided thoughtful guidance and feedback, leading to increased program effectiveness and cooperation throughout the region. Some advisory committee members also led leak check events, as noted below. Advisory Committee members included:
• Andy Gregory, Puget Soundkeeper Alliance – coordinated leak check events• Ann Boyce, ECOSS – coordinated leak check events• Blair Scott, King County• Chris Towe, Pierce Conservation District – coordinated leak check events• David Bain, Cascadia Environmental Science Center• Emily Hagerty, City of Bellingham• Hollie Shilley, City of Federal Way – coordinated leak check events• Janet Geer, City of Bothell• Jimmy Pasch, Puget Soundkeeper Alliance – coordinated leak check events• Kathryn Davis, Puget Soundkeeper Alliance – coordinated leak check events • Laura James, Tox-Ick• Laurie Devereaux, City of Bellevue• Lee First, ReSources Bellingham – coordinated leak check events• Lisa Syravong, Sound Salmon Solutions – coordinated leak check events • Maythia Airhart, City of Seattle – co-manager of leak inspection workshop program• Stephanie Leeper, WSU–Snohomish County Extension – coordinated leak check events
AutoIndustryPartners- Don’t Drip and Drive is a program that relies on having partners in the automotive industry. These partners not only provide valuable services to the people of Puget Sound, but they provide insight into their industry that has led to continuous improvements to our program. We hope to continue this partnership for years to come. Automotive industry partners included:
• Jeff Lovell, Automotive Services Association

x Acknowledgements
• EnviroStars program coordinators• AAA Northwest regional office• 102 repair shops throughout the Puget Sound region (a full list of participating repair shops
is in Appendix 7)
Consultants– Provided expertise in marketing and evaluation that made this program more successful.
• PRR, Inc. – Katherine Diers, Account Manager, and other contributing staff• Cascadia Consulting Services – Jessica Branom-Zwick, Senior Associate, and other
contributing staff• Social Marketing Services, Inc. - Nancy Lee, President• Organizational Research Services - Marc Bolan, Affiliated Senior Associate
Funders- Without our major funders, this program would not be possible.
• Washington State Department of Ecology • Puget Sound Partnership • Partner organizations that contributed time and funding in-kind

xi
Table of Contents
Executive Summary ..................................................................................................... i-viii
Acknowledgements ..................................................................................................... ix-x
Program Overview ........................................................................................................ 1-7
Results ........................................................................................................................ 8-32
Lessons Learned and Recommendations ................................................................ 33-41
Next Steps ..................................................................................................................... 42
Conclusion .................................................................................................................43-44
Bibliography ...............................................................................................................45-46
List of Tables and Figures
Table 1. Program objectives and outcomes ..................................................................... ii Figure 1. Program infographic ......................................................................................... iii
Table 2. Survey responses from vehicle owners about leaks .......................................... iv
Figure 2. Diffusion of information model .......................................................................... 2
Figure 3. Impact of vehicle leaks on pavement ................................................................ 3
Table 3. Motivators and barriers for repairing leaks ......................................................... 4
Figure 4. Website screenshot - Home page ................................................................... 11
Figure 5. Website screenshot - Dr. Drip’s Tips ............................................................... 11
Figure 6. Website screen shot - Where is your leak ....................................................... 11
Figure 7. Website visits per day ..................................................................................... 12
Figure 8. Creative concepts for web-based ads ............................................................ 13
Table 4. Online advertising data by publisher and creative ............................................ 14
Figure 9. Sample facebook ad ....................................................................................... 15
Figure 10. Don’t Drip and Drive facebook page ............................................................. 15
Table 5. Partner promotions ........................................................................................... 16

xii Table Of Contents
Figure 11. Map of leak check event locations ................................................................ 17
Table 6. Strategies delivered at leak check events ........................................................ 18
Table 7. Leak check event summary ......................................................................... 18-19
Table 8. Coupon survey results ...................................................................................... 23
Table 9. Primary use of leaking vehicle .......................................................................... 26
Table 10. Features vehicle owners will look for in their next car .................................... 26
Table 11. Type of residence ............................................................................................ 27
Table 12. Grant of Regional of Statewide Significance budget ...................................... 28
Table 13. Social marketing grant budget ....................................................................... 29
Table 14. In-kind contributions by partners ................................................................... 29
Table 15. Total estimated program cost ......................................................................... 30
Figure 12. Model diffusion curve for Don’t Drip and Drive ............................................. 44
List of Appendices
Appendix 1. Auto Leaks Workshop Evaluation Report
Appendix 2. Event Toolkit
Appendix 3. Partner Promotions Toolkit
Appendix 4. Participating Repair Shop Toolkit
Appendix 5. Event Observations and Follow-up Survey Results for Leak Check Events and Repair Shops
Appendix 6. Media Plan, Final Media Report and Online Advertising Test-Panel Report
Appendix 7. List of Participating Repair Shops
Appendix 8. Long-term Funding Research Summary and Recommendations
Appendix 9. Expanded Repair Shop Interview Summary

1
Program Overview
From November 2013 to March 2015, Stormwater Outreach for Regional Municipalities (STORM) and King County Education, Communication and Outreach Network (King ECO Net) and partners conducted Don’t Drip and Drive Phase II: A Behavior Change Program designed to improve vehicle owners’ awareness of leaks and motivate them to fix their leaks. Repairing leaks helps protect water quality in the Puget Sound region.
The program was funded by the Washington Department of Ecology’s Grants of Regional or Statewide Significance (GROSS) program and a Puget Sound Partnership Social Marketing grant, with additional financial and in-kind support from program team members, partners and volunteers.
Phase II’s goal was to refine and expand the Phase I Don’t Drip and Drive campaign. From July to September 2014, this comprehensive social marketing campaign included the following four key components:
• CampaignPromotion-Online advertising, social media and other localized media channels to promote campaign messages and direct our target audience to a resource website
• Events-Leak check events to identify leaking vehicles, promote repairing leaks and testing different intervention strategies for effectiveness
• ParticipatingRepairShops-Free leak inspections and discounted repairs provided by participating repair shops
• Workshops-Free auto leaks inspection workshops at technical training centers taught by mechanic instructors that provide information about vehicle maintenance, with a focus on leak repair.
Partner organizations that included auto repair shops, nonprofit groups, cities and counties, state agencies and businesses participated in the campaign. Partner organizations were asked to track their activities and were surveyed after the campaign. Owners of leaking vehicles who provided their contact information were surveyed three to six months after their participation.
The campaign adopted a social marketing3 approach to design a program that makes it easier for the target audience to fix leaks. This includes minimizing barriers that impede their ability or willingness to repair their car and using motivating messages that emphasize the benefits of making repairs that resonate with vehicle owners. The target audience for Phase II is vehicle owners aware of their leaking vehicle, who are over 25 years old, have an income of $40,000 or more, own a vehicle more than two years old and want to get their leak repaired.
Figure 2 illustrates the common bell-curve of audiences on the spectrum of how likely they are to change their behavior. This spectrum likely applies to vehicle leaks. The target audience for the Don’t Drip and Drive campaign overall are those in the first three sections of the bell-curve graph. Those likely reached without financial incentives available are those compromising up to 40 percent of the bell-curve.
3 Social marketing seeks to develop and integrate marketing concepts with other approaches to influence behavior that benefit individuals and communities for the greater social good. (Wikipedia, 2015)

Program Overview2
Background
Studies by the Washington State Department of Ecology (Ecology) indicate that petroleum-based products are significant toxic contaminants reaching Puget Sound through stormwater runoff (Colton, et. al., 2011) These products include oil, grease and, to a lesser extent, other fluids such as transmission, power steering, brake and windshield wiper fluids. As stormwater picks up these products off of impermeable, paved surfaces they are carried into aquatic environments, slowly accumulating in the sediments, entering the food web, harming aquatic life and affecting water quality. The specific impact on the environment varies according to the composition of the petroleum product, the organisms or habitat affected and the circumstances of exposure (Overton, et. al, 1994).
Automobile fluids such as motor oil, gasoline, brake fluid and transmission fluid are just one source of petroleum product that adds to the total hydrocarbons in polluted stormwater runoff. In addition, the ingredients in motor oil can vary depending on the brand and are not subject to ingredient disclosure laws.
Ecology, in a recent toxic loading study, estimates that 9,200 metric tons of motor oil and other petroleum products enter the Puget Sound basin every year, most of which comes from car and truck motor oil drips (Herrera, 2011). This amount is the equivalent of seven million quarts of motor oil dripped into the Puget Sound basin each year. Vehicle leaks often occur drop-by-drop and continuously, creating a large area of pollution over time. It is difficult to calculate the total load of pollution from vehicles due to the diffuse nature by which motor oil drips over miles of roadway. Given that the average quart of motor oil costs $5-10 dollars, we estimate that consumers are spending $53,615,500 each year on oil lost through leakage.
Ecology’s toxic loading study estimates highways and industrial areas contribute more total petroleum hydrocarbons (TPH) to Puget Sound per unit area than residential areas. Residential areas, however, make up such a large portion of land use in the Puget Sound Area that their total contribution (75%) overshadows that of the “dirtier” land uses (EnviroVision, 2008). Since cars generally leak while being driven (heating of components causes them to shrink and release leaks) indications of leaking can be found in areas where cars are stopped, such as parking lots and gas stations.
In addition to ecological concerns, leaks such as motor oil degrade asphalt pavement. Dripping petroleum products over time penetrate and soften the asphalt irreversibly leading to potholes and costly repairs (McDonald, 2010) (See Figure 3). This phenomenon can be seen especially in parking lots, where drips accumulate as vehicles are parked and start to cool down (See photo).
Figure 2 illustrates the bell-curve of behavior
change for most audiences.
(Chaffey, 2013)

Program Overview 3
Overview of Don’t Drip & Drive Campaign Phase IPhase I (the pilot phase) of the Don’t Drip and Drive program involved audience research, development of campaign logo and messaging, a website, radio advertisements, outreach activities, leak check events, partnership with the Automotive Services Association (ASA), discount coupons and tracking the use of coupons at participating automotive repair shops. Phase I included initial research about the nature of vehicle leaks, including the frequency and the spectrum of their severity. Data collected in Phase I identified the leak rate at leak check events to be around nine percent, while participating repair shops reported a leak rate of about 45 percent. With limited and inconsistent data collected, the program team concluded that more data were needed to better quantify the impact of vehicle leaks. In addition, there are limited available data on the severity of impacts from vehicle leaks on wildlife or humans (i.e. increased accidents related to oil on roadways).
Phase I formative audience research included focus groups and surveys of repair shops which provided insight into vehicle owner motivators for having leaks fixed and the barriers that keep them from fixing leaks, as shown in Table 3.
Figure 3 (left). Illustrates the impact of vehicle
leaks on asphalt breakdown over time, with complete asphalt
failure as a result of prolonged exposure to petroleum , after
McDonald, 2010
Right top photo: Damage from vehicle leaks in a parking lot(Credit Heather Trim)
Right bottom photo: Oil leak dispersing in a
Puyallup parking lot(Credit Tiffany O’Dell)

Program Overview4
Motivators BarriersKeeping the vehicle reliableSafety while drivingSafety of kids and petsMaintain vehicle valueProtect the environment
Cost of repairsLack of knowledge about vehicle functions/systemsLack of knowledge about finding reliable mechanicsFear of being taken advantage of by mechanicsTime/hassle of getting leak fixedForget - fixing leaks is not a priorityDon’t believe leak is a problem
The lessons learned in Phase I were used to develop Phase II. The complete Phase I evaluation report is available on our resources website: piercecountywa.org/dontdripanddrive.
Planning, Organization and Activities
The Phase II program was developed and implemented by the program team working with local partners and consultants. Program partners played the following roles:
• SteeringCommittee—a core team managing day-to-day planning and campaign oversight through every-other-week meetings and between-meeting coordination
• AdvisoryCommittee—local jurisdiction and organization partners providing input and review on planning decisions such as campaign materials and activities at monthly meetings.
• Consultants—PRR assisting with developing automotive industry partnerships, messaging and materials development, online advertising and website design. Cascadia Consulting Group assisting with developing and conducting the evaluation and conducting interviews for the long-term funding plan. Social Marketing Services, Inc. providing advice and review of campaign strategies and evaluation methods. Organizational Research Services, evaluation consultant to the Puget Sound Partnership, providing additional input into the evaluation approach.
Program Goals
The Don’t Drip and Drive Phase II primary goals for vehicle owners were that they:• Become aware that leaking vehicles can cause damage to their vehicle and the
environment. • Have resources to identify and repair leaks.• Believe repairing leaks is the right thing to do for their safety, their family’s safety and for the
environment. • Repair all leaks within three months of identifying leaks.
In addition, the primary Phase II objectives were to:• Hold a minimum of 20 leak check events.• Reach a minimum of 16,500 vehicle owners through the campaign.• Motivate at least 1,600 leak repairs.• Motivate at least 20 percent of vehicle owners to get their leaks repaired within three
months of a leak check event.• Learn from Phase II activities and move toward building a model program.
The program also sought to identify the following:• Most compelling promotional messages.• Vehicle owner motivations to repair leaks.• Vehicle owner responses to various strategies to influence leak repair.• Length of time vehicle owners wait to repair leaks once they are identified.
Table 3 identifies motivators and barriers
for vehicle owners related to repairing
vehicle leaks

Program Overview 5
• Psychographic4 profile of vehicle owners who did or did not repair leaks.
The long-term goal of the Don’t Drip and Drive program is to change social norms so that vehicle owners value finding and fixing leaks. The campaign also served to help STORM members meet Washington State’s municipal National Pollutant Discharge Elimination System (NPDES) permit’s education and outreach requirements. This program has exceeded those requirements by creating a regional campaign.
Defining the Target Audience
The program team defined the audience targeted for this phase of the campaign to be:
• Vehicle owners over the age of 25, because they are more likely to be the primary decision-maker for car repairs,
• Owners of vehicles greater than 2 years old, because the vehicle is more likely to be past the warranty period,
• Owners with incomes of over $40,000, because they are more likely to be able to afford repairs,
• Owners who are aware of their leak, and • Owners who are motivated to fix their leaks (they are the innovators, early adopters and
early majority categories on the behavior change bell curve graph showing in Figure 2).
Program Evaluation
Phase II evaluation goals were to:
• Assess the effectiveness of program elements and intervention strategies, so program partners can narrow down the most effective elements and strategies to use in future phases to improve and expand the program.
• Obtain support for future funding to continue the Don’t Drip and Drive program by demonstrating success and, if possible, estimate overall effectiveness on changing social norms.
• Compile information that will motivate and help additional agencies, organizations and businesses to implement the program.
• Enable STORM member jurisdictions to meet and exceed NPDES Permit requirements for measuring the understanding and adoption of the targeted behavior.
Left photo: Oil leak flowing into an Olympia
storm drain(Credit Tiffany O’Dell)
Right photo: Oil leak in storm drain in Tacoma(Credit Tiffany O’Dell)

Program Overview6
Evaluation MethodologyEvaluation was based on information from vehicle owner surveys, interviews of participating automotive shops, analyses from web advertising services and feedback from the Steering Committee, the Advisory Committee and consultants who participated in campaign design and implementation. The Free Auto Leaks Workshops were evaluated separately by Applied Research Northwest (see Appendix 1).
The following sources of data and information were used for program evaluation:
• Trackingsheets- Tracking sheets completed by partner organizations to record event information including:‐ Number of vehicles checked for leaks and number of vehicles with leaks detected. ‐ For vehicles with leaks, the type of vehicle, condition of the exterior of the vehicle and
gender and approximate age of vehicle owner were recorded.‐ Confidential contact information for vehicle owners whose vehicles had leaks, along
with type and number of intervention strategies distributed to those owners.• Redeemedcoupons- Discount coupons included in information packets given to all
participants at leak check events, downloaded from the website or obtained from a participating repair shop.
• Follow-upsurveysofvehicleowners- Online and telephone follow-up surveys of leak check event participants who had identified leaks and shared their contact information.
• Partnersurveys- Telephone surveys of event organizers.
• TrackingSheets- Tracking sheets completed by participating repair shops recording the number of vehicles inspected and repaired during the campaign.
• Redeemedcoupons- Discount coupons distributed at participating repair shops or downloaded from the campaign website.
• Follow-upsurveysofvehicleowners- Online and telephone follow-up surveys of repair shop customers who redeemed coupons for leak repairs and provided their contact information.
• Partnersurveys- Telephone surveys of participating shops.
• Adtesting- Test panel results for eight preliminary ad themes for messaging and ads.• Adanalytics- Web-based impressions and clicks for five online ads.• Websiteanalytics- Website analytics for the Don’t Drip and Drive website (fixcarleaks.org).• Partnerreports- Reports from STORM members and leak check event organizers tracking
their campaign promotion efforts.
• Participant“dayof”surveys- Exit surveys at the workshop to assess participant experience.
• Participantfollow-upsurveys- Online follow-up participant survey assessing program impacts.
• Instructorinterviews- Interviews with workshop instructors.
Leak check events
Left photo: Event organizer, Ann Boyce, recording leak results at leak check event in Kirkland (Credit Andy
Gregory)
Right photo: Event organizer, Stephanie
Leeper, preparing leak results for a driver at an event in Everett (Credit
Heather Trim)
Participating repair shops
Campaign promotions
Workshops
Program Overview 7
• Committeefeedback– End of program debrief with Steering Committee and Advisory Committee.
• Internaltrackingdocuments- Campaign documents with information on budget, program activities and campaign materials.
In addition, data regarding general leak-related behaviors and perceptions from previous surveys with topics related to vehicle leaks are documented in the Regional Surveys Analysis section (pages 30-32) to provide a baseline that future campaigns can use for comparison.
The accuracy of evaluation results may be affected by data limitations. In particular, the sample of vehicles checked for leaks was not entirely random, and sample size was limited for some components of the program. In addition, repair shop data submitted were not collected in a uniform manner and some repair shops that participated in the program did not provide information on their activities and results.
Overall campaign

8
This section presents program results and findings organized into the following categories:
• ProgramOutcomessummarizes how the Don’t Drip and Drive Phase II campaign met goals for vehicle owners reached, events held and leaks repaired, with additional detail on the numeric results reported by leak check event organizers and participating repair shops.
• CampaignPromotionsdiscusses the campaign’s website, online advertising campaign and promotional efforts by local jurisdictions and partners.
• LeakCheckEventsdescribes the campaign’s partnerships with local jurisdictions and organizations that implemented events, including feedback and suggestions obtained through interviews with event organizers and survey data collected from vehicle owners with leaks identified at leak check events.
• ParticipatingRepairShopsdescribes the campaign’s partnerships with participating repair shops, including feedback and suggestions obtained through interviews with shop owners and managers and survey data collected from vehicle owners with leaks identified at partner repair shops who redeemed coupons for repairs.
• VehicleLeakWorkshopsdescribes workshops and feedback received from workshop attendees and instructors. Workshops were evaluated separately and the full evaluation report is included as Appendix 1 – Auto Leaks Workshop Program Evaluation Report.
• ProgramCostAnalysis summarizes expenditures funded by Ecology’s grant, the Puget Sound Partnership’s grant and additional contributions provided by program partners.
• RegionalSurveyDataAnalysissummarizes findings from regional surveys about Puget Sound regional resident behaviors related to finding and fixing vehicle leaks.
Program Outcomes
Overall, 8,308 vehicles received free inspections for leaks at leak check events and at repair shops during the approximately three month period of active implementation of Don’t Drip and Drive Phase II.
Leak check events outcomes• 3,819 vehicles were checked at 34 leak check events held from June 24 to September 30,
2014. • 271 vehicles (7%) were found to have leaks using drip sheets which were placed under
vehicles within a few minutes of arrival and left in place at least 30 minutes. • When leaks were identified, vehicle owners were offered information on the discount to
repair their vehicle (10% off up to $50) that participating shops offered and some were also offered one of two additional interventions: ‐ a reminder window cling or ‐ an immediate on-site visit with a third party mechanic who informed the vehicle owner about the type of leak and the range of cost for repair.
• 56 out of 271 event participants with leaks (21%) participated in the follow-up survey three to six months after their leak check event. ‐ 22 people (39%) said they had fixed their leak ‐ 8 people (14%) said they planned to fix their leak ‐ 16 people (29%) said they did not plan to fix their leak ‐ 10 people (18%) didn’t remember or reported that they rechecked for a leak and did not
find one
Results

Results 9
Participating repair shops outcomes• 4,489 vehicles were reported to be checked by participating repair shops during the months
of July through September 2014 • 1,303 vehicles (29%) were found to have leaks• When leaks were identified, vehicle owners were offered the discount coupon for 10% or up
to $50 off repairs (whichever was less) • 692 vehicles were repaired by participating repair shops for an immediate leak repair rate of
53% • 28 out of 102 participating auto shops (27%) returned inspection and repair tracking forms
(Because of the busy summer seasons, many non-reporting shops may still have promoted the campaign and offered discounts without taking the time to complete and submit tracking forms)
• 54 out of 106 participating repair shop customers who provided their contact information responded to the follow-up survey. 39 people (reported that they had a leak. Of those: ‐ 30 people (77%) said that they had fixed their leaks ‐ 4 people (3%) said that they planned to fix their leak ‐ 4 people (3%) said they did not plan to fix their leak ‐ 1 person did not respond to this question
Although we cannot confirm results from owners of cars with leaks from participating repair shops and leak check events that did not provide evaluation data, we can hypothesize about their actions by extrapolating the results from reporting participants.3 Overall, we hypothesize that
• At least 34,255 vehicle owners were received the campaign information, • At least 3,294 leaks were identified by partnering repair shops, and• At least 1,669 leaks were repaired.
It is important to note the following factors when considering results:
• While we believe that the leak rate is within an order of magnitude, more testing is needed to get a statistically valid rate. The average event leak rate may not represent the average leak rate for the region, because the vehicles checked at events do not represent a random sampling of vehicles in the region, and because vehicle owners were able to “opt-out” of having their vehicle tested. We hypothesize that vehicle owners may have opted-out of leak checks at events, because they knew their vehicle had a leak, did not have time to participate or did not want volunteers touching their car, among other reasons.
• The rate of leaks found by auto shops was much higher than the rate found at the leak check events. This is a similar finding to Phase I. Potential explanations include:
3 Unreported vehicle owners reached, leaks found and repairs were calculated by assuming (1) that the level of reach, inspection and repair among the 74 non-reporting shops was half that of the 28 report-ing shops and (2) the repair rate for the 215 non-responding event participants was half that of the 56 surveyed participants.
Left photo: Repair shop employee completing
a leak repair (Credit iStock)
Right photo: Vehicles awaiting repair in a repair shop (Credit
iStock)

Results10
‐ Leaks that drip onto the drip sheets at events may be “drippier” and slower leaks are more easily detected at a repair shop.
‐ Auto shop technicians may be better able to identify leaks of all sizes and types. ‐ Event test accuracy decreases if a drip sheet is not placed under the vehicle as soon as
the vehicle stops running. Additionally, windy site conditions may have caused drip test sheets to shift at some of the events.
‐ Vehicles are often brought to repair shops specifically because the owner already suspects or knows about a problem with the vehicle.
‐ Repair shops were not using consistent methods for tracking leak rates, with some only tracking customers who asked about the program and others tracking every vehicle who came through their shop.
• Leak rates found by auto shops may not represent the actual average leak rates for all vehicles brought to repair shops, because approximately 73 percent of participating repair shops did not return any tracking forms.
Campaign Promotions
In Phase II, web based ads were designed and the campaign website was substantially upgraded. The marketing campaign was promoted primarily through online ads and the campaign website. Overall, the website received 20,017 unique visitors during the three month campaign, and purchased, web-based advertising received 12,293,695 impressions.
Partner organizations also promoted the campaign, but impressions for those efforts were not calculated consistently. Local jurisdictional and organization partners promoted the campaign using paper and electronic newsletters, bill inserts, press releases, social media and other methods. Partner organizations were provided promotional tools via an online toolkit (piercecountywa.org/dontdripanddrive). At least ten partner jurisdictions and three non-profit organizations promoted the campaign. Full partner promotions toolkit is in Appendix 3.
Campaign WebsiteThe website was redesigned to be more user-friendly and to directly address vehicle owner barriers to repairing leaks that were identified by audience research. The overall look and navigation was updated. The website includes the following key sections:
• Home-welcomes visitors and highlights three key sections (Diagnose Your Leak, Dr. Drip’s Tips, and Contact a Repair Shop).
• DiagnoseYourLeak-identifies common leaks based on the fluid color and location under the vehicle. This addresses the barrier that many vehicle owners are not familiar with where leaks occur and what the color of the leak indicates.
• Dr.Drip’sTips-answers common questions about going to a repair shop. This addresses potential concerns by vehicle owners about up-selling or improper repair work. The character Dr. Drip was developed by the campaign to be a secondary mascot and is also used in videos for the leak repair workshops.
• FixYourLeak-provides a searchable, map-based directory of participating shops, including information on shop hours, vehicle types serviced and additional services offered (availability of an after-hours key drop-off, loaner car and shuttle). This addresses the need for vehicle owners to know where to find shops that are participating in the campaign and offering the discount. It also addresses the barrier of convenience by providing information on the amenities offered by each shop.
• In addition, the website includes an AboutUs page for information about the campaign, a FrequentlyAskedQuestions page to help vehicle owners better understand how the campaign works and answer questions about leaks, and a link to the Department of Ecology webpage where drivers can sign up for Workshops.

Results 11
The fixcarleaks.org website received a large number of visitors: 35,286 page views, 28,186 visits and 20,017 unique visitors from July 1 through September 29, 2014. The discount coupon was downloaded 950 times.4 In Phase I, the website received 1,759 unique visitors in one month of radio advertising, as compared to an average of 6,672 unique visitors per month in Phase II over three months of online advertising.
Most people (13,264 out of 35,286, 38%) reached the website by following a link to the campaign from another source (such as a partner website, advertising link or social media post) or by typing the URL directly into their internet browser.5
Online advertising appears to be a key factor in driving website visits, as shown in Figure 7 presenting the number of visits per day from July 1 to October 14, 2014, which spans the duration of the active online ads and the weeks following the discontinuation of ads. Visits to
4 The number of people who printed the coupon is unknown.5 The number of clicks tracked by a campaign website is usually far lower than the number of click-throughs reported by ad publishers (described in the following section). Ad publishers are not able to explain the discrepancy, but this is typical of web-based advertising campaigns.
Figure 4. Don’t Drip and Drive website
home page
Figure 5. (Left) Dr. Drip’s Tips webpage answers questions about leaks
and working with mechanics
Figure 6. (Right) Where is your leak webpage
helps drivers identify the source of their leak.
Web visit volume was high
Web visit volume was driven by ads

Results12
the website slowly increased during July, as advertising ramped up, and fluctuated during the rest of the campaign and dropped off significantly after the last day of online advertising. On September 14, the last day of online advertising, the website had 536 visits. On September 15 (when advertising stopped), visits decreased by nearly three-quarters to 141. Visits trailed off through September 30 (when the campaign ended and coupons expired). Over the course of the campaign, the website averaged 459 visits per day, and for the months after advertising stopped, average daily visits dropped to twenty.
CampaignStarts
Last Dayof Online Ads
Campaign EndsCoupon Expires
0
100
200
300
400
500
600
700
7/1 7/16 7/31 8/15 8/30 9/14 9/29 10/14
Web
site
Vis
its
Website Visits Key Campaign Dates
74% drop the day ads ended.
Visitors spent an average of 3 minutes and 44 seconds on the website, calculated across all visitors, including people who left the site immediately. Most website sessions lasted three to ten minutes, indicating the visitors were primarily real people and not internet robots. An article from Time suggests that on average 55% of visitors spend less than 15 seconds on a website (Haile, 2014).
More than 80% of website users visited the site from a mobile device: 58% using the Android operating system and 25% using Apple’s iOS. Most desktop visitors used a computer operating Windows (13%), as opposed to Apple’s Macintosh (2%). The most commonly used browsers were Chrome (39%), Android Browser (23%) and Safari (20%).
Online AdvertisingPhase II advertising goals were to drive people to the campaign website and to identify successful campaign messaging. Online advertising provided the opportunity to accomplish both of these goals on the limited advertising budget. Online advertising links directly to the campaign website and provides analytics reports about which messages and advertising sources were most successful.
To develop Phase II advertising, the program team created eight distinct creative ad concepts based on audience motivations and barriers identified in audience research. These concepts were tested using an online survey panel. Detailed results of ad testing, including ad preferences by age group and gender, are presented in Appendix 5. Results of the ad testing led the program team to narrow the concepts down to five web-based creative concepts (shown in Figure 8) which had the following themes:
Figure 7. Website Visits per day during the
campaign
Average time on site
How users accessed the site

Results 13
The five ads were published using the Google Display Network, KING5.com and SeattlePI.com. These publishers were selected in order to match the Phase II campaign target audience. While the media sites displayed the ads randomly to website visitors, the Google Display Network showed ads to people using the search engine to find information about topics related to auto repair, car maintenance, mechanic/auto shop, fluids in car, transmission fluid and similar terms. Three online ads in different sizes (such as banners and sidebars) were produced for each of the five creative concepts.
Figure 8. Creative concepts for
web-based ads
Animated ad
Hiker ad
Child ad
Rainbow ad
Vacation ad

Results14
Table 4. Advertising results by publisher and
creative (white rows are those that were
most effective for that publisher)
Advertising was designed to drive viewers to the campaign website (fixcarleaks.org). Table 4 presents the number of impressions, clicks, and click-through rate for each ad by publisher. The click-through-rate for each ad varied by publisher, because each publisher has a slightly different audience. KING5.com and SeattlePI.com have relatively broad audiences, while Google Display Network targeted ads only to people already searching for terms related to auto leaks or vehicle repair. As a result, click-through rates are higher for Google Display Network. Although the traditional media websites had lower click-through rates, they were included in order to reach people who weren’t actively thinking about repairs.
PublisherandCreativeTheme Impressions Clicks
Click-through-rate Costperclick
Google Display NetworkAnimated 470,617 3,386 0.72% $0.46Child 663,056 4,861 0.73% $0.42Rainbow 539,400 5,721 1.10% $0.35Hiker 948,792 11,673 1.23% $0.36Vacation 517,734 6,363 1.23% $0.41King5.comAnimated 899,319 1,347 0.15% $2.44Child 898,734 1,211 0.13% $2.72Rainbow 899,014 1,192 0.13% $2.76Hiker 635,084 566 0.09% $4.10Vacation 451,888 312 0.07% $2.66SeattlePI.comAnimated 1,286,965 1,349 0.10% $3.13Child 1,534,867 1,458 0.09% $3.23Rainbow 1,106,802 463 0.04% $6.36Hiker 374,714 812 0.22% $1.67Vacation 451,888 312 0.07% $2.66FacebookNews Feed Posts
397,524 2,907 0.73% $0.70
Right column ads
126,514 86 0.07% $0.92
Total 12,293,695 44,082 0.36% $0.98
Overall, the campaign’s click-through rates for online ads are considered to be excellent for online advertising. Generally, a click-through rate of 0.04% is considered to be good for government promotions, and a click-through-rate of 0.10% is average for all online advertising (Double Click, 2010). Don’t Drip and Drive online advertising exceeded both average overall and government rates in most cases. On the Google Display Network, the Hiker and Vacation creative concepts had the highest click-through rates: users clicked on these ads 1.23% of the time they were displayed. The Hiker ad was also the most effective ad on SeattlePI.com, with a click-through rate of 0.22%. In contrast, the Animated, Kid, and Rainbow creative concepts were more popular on KING5.com with click-through rates of 0.15% to 0.13%.

Results 15
Facebook ads did not use the same themes as the other online ads, instead using the campaign logo and general campaign offer. On Facebook, the news feed posts had higher click-through rates (0.73%) than right column ads (0.07%). For Facebook news feed ads, a click-through-rate above two percent is considered good for all campaigns, those for government campaigns is significantly lower (0.02% - 0.05%) (McDermott, 2014). Not using the same advertising themes on Facebook may have negatively impacted outcomes.
Social Media CampaignThe campaign developed a facebook page during Phase I. The Facebook page was actively managed by the steering committee and PRR during Phase II to promote the campaign through advertising and upcoming leak check events.
Before Phase II promotion began, the campaign Facebook page had 68 followers. By the end of the campaign, followers had increased to 773, an increase of 705 followers over three months. The majority of new followers were as a result of paid news feed ads during the campaign. On those days when paid ads were running new likes ranged from three to 40 per day. On those days when ads were not running, new likes generally ranged from zero to two. Those followers will continue to receive campaign updates in future phases. Resulting impressions from Facebook ads are included in Table 4.
Promotion by partner jurisdictions and organizationsPartner organizations and jurisdictions throughout the region contributed to marketing and outreach about the campaign. Marketing methods included direct mail (such as newsletters and bill inserts), electronic newsletters, social media, print, websites, information booths and press releases. Table 5 identifies the promotional activities that organizations reported conducting with the number of impressions, where available. Because this reporting comes directly from our partners, number of impressions is unavailable for all products that do not include a direct mailing list.
Figure 9 (Right). Sample Facebook ad
Figure 10. Don’t Drip and Drive
Facebook page

Results16
MediaType Events DirectMail
SocialMedia,OnlineandeNewsletters
PaidRadio,TV,Printand
Web
EarnedRadio,TV,Printand
WebDes Moines 24,000Edmonds x 526Kirkland x 25,300 800West Sound Stormwater Outreach Group
x 22,184 124,085 x
Lakewood x xSnohomish County
24,372
Sammamish x 40,000 148Shoreline 22,500 x xPierce Conservation District
x
Pierce County 6,500 x xPuget Soundkeeper Alliance
x x
Sound Salmon Solutions
x
Sumner x 9,400 730 x
Further details on marketing campaign elements, including additional statistics on the web-based ads and fixcarleaks.org, can be found in Appendix 6.
Leak Check Events
Thirty-four leak check events were organized by seven local partner organizations in Whatcom, Snohomish, King, Pierce and Thurston counties. Event organizers partnered with local businesses, governments and organizations to test vehicles for leaks. Leak check event locations are on the map in Figure 11.
Event ImplementationEvents were held at four types of locations:
• Workplaces—for employees• Festivalsandevents—for attendees• Parks,librariesandotherattractions—for visitors• Retailshops—for shoppers
Event organizers trained volunteers to talk to vehicle owners about the leak check event process, how to check vehicles for leaks by rolling out a drip-sheet under the car’s engine area
Table 5. Partner promotions by organization or
jurisdiction

Results 17
within minutes of the engine being turned off and report leak test results. Leak checks were free for participants. At most events, vehicle owners were able to opt-out of having their car tested. Based on event organizer observations, at least 50% of vehicle owners agreed to be tested with higher participation rates at workplaces.
Event staff and volunteers invited drivers to participate, asked for each driver’s name, and placed a numbered placard on each vehicle. After testing, event staff intercepted drivers and gave all drivers their leak result and a campaign information packet.6 Campaign information included details about the leak repair discount offered by participating automotive shops. Event staff offered one of three strategies to drivers with leaking vehicles:
1. Campaigninformationpacket including the basic campaign discount coupon for repairs.2. Campaigninformationpacketandasmallwindowclingto be placed inside their
windshield (next to the oil change reminder cling) to serve as a reminder to have the leak fixed.
3. Campaigninformationpacketandaconsultationwithathird-partymechanicat the event provided vehicle owners with an objective opinion on the leak and more information on the leak type, source and potential cost to repair the leak.
Strategies distributed to drivers at leak check events are included in Table 6.
6 At two leak check events, drivers were not intercepted. Instead, a campaign information packet with the leak result was placed on the windshield of every vehicle that was tested. Drivers with leaks at these events received only the basic campaign repair discount. At other events when drivers did not return to their vehicles before the end of the event, their leak result and a basic packet was also left on their windshield.
Figure 11. Map of leak check event locations
(Source: Google maps)

Results18
Basic information package 149Window cling 73Third party mechanic 35No intervention 4Total 177
To allow the campaign to conduct follow-up surveys with drivers who had leaks, drivers who had leaks were asked for their contact information. Inexpensive candies were provided at some of the leak check events to incentivize receipt of participant contact information.Instructions, materials, and forms for leak check events, including campaign information packets given to drivers are in Appendix 2.
Overall, a total of 3,819 vehicles were checked at 34 leak check events from June 23 to September 27, 2014. Among the vehicles checked, 271 were found to have leaks, for an average leak rate of seven percent.
Additional details on the number of vehicles checked and leaks found at individual leak check events by event type are shown in Table 7. The highest leak rates occurred at festivals and events (12%) while the lowest rates occurred at workplaces (5%).
EventTypeandNameEventDate
VehiclesChecked
LeaksFound LeakRate
Workplace 1,632 88 5%McKinstry (Seattle) 6/23 184 11 6%Tacoma Recovery and Transfer Center 7/17 101 16 16%KOMO Garage (Seattle) 9/3 104 6 6%Washington State Department of Transporta-tion (Olympia)
9/4 100 4 4%
Washington State Department of Ecology (Lacey)
9/11 365 30 8%
Weyerhaeuser (Federal Way) 9/16 250 6 2%Weyerhaeuser (Federal Way) 9/17 268 3 1%Federal Way City Hall 9/18 82 0 0%NOAA - Sandpoint (Seattle) 9/25 178 12 7%Festival or Event 631 73 12%Arlington Street Festival 7/12 111 11 10%Tacoma Rainiers Game 7/13 219 24 11%Backyard Collective (Discovery Park, Seattle) 7/18 54 8 15%Everett Aqua Sox Game 7/27 60 12 20%Church Softball Tournament (Twin Rivers Park, Arlington)
8/2 28 3 11%
Lakewood Farmers’ Market 8/26 100 8 8%Evergreen Church Classic Car Show (Bothell) 9/13 59 7 12%Park, Library or Attraction 981 79 8%
Table 6. Strategies delivered at leak check
events
Table 7. Leak check event summary

Results 19
Willis Tucker Park (Snohomish) 8/5 47 6 13%Kirkland Library and Public Pool Garage 8/14 120 3 3%Everett Public Library - Main branch 8/18 81 8 10%Lake Sammamish State Park (Issaquah) 8/22 74 10 14%Center for Spiritual Living (Seattle) 8/24 116 10 9%Barkley Village Cinema (Bellingham) 9/5 50 4 8%Sno-Isle Monroe Library 9/6 23 1 4%Everett Public Library - Evergreen Branch 9/8 33 3 9%Point Defiance Zoo and Aquarium (Tacoma) 9/14 235 18 8%Yost Community Pool (Edmonds) 9/15 41 1 2%Barkley Village Cinema (Bellingham) 9/27 71 9 13%Mukilteo Library 9/27 90 6 7%Retail Shop 575 31 6Mill Creek Central Market 7/15 135 4 3%Bellingham RE Store 8/16 52 8 15%Edmonds PCC 8/22 107 3 3%Ballard Market 9/18 156 8 5%Shoreline Central Market 9/20 60 2 3%Bellingham Public Market 9/26 65 6 9%Overall 3,819 271 7%
Staff and volunteers made some visual observations at the events to see if any trends could be determined. Of the 211 drivers observed to have leaking vehicles, 124 were male drivers and 87 were female drivers. The conditions of the cars show that the majority (223) of leaking cars were in good physical condition or had less than five dings. 81 had 5 or more dings and only 11 had damaged parts. 225 of the 271 leaking cars were identified by manufacturer. 34 different vehicle manufacturers were identified among those that had leaks. The highest numbers of vehicles with leaks at the events were Ford (34), Toyota (30), Honda (22), Chevrolet (20), Subaru (19) and Volkswagen (10).
These observations will need to be further researched in future phases of the Don’t Drip and Drive program, because these are a relatively low number of observations and may reflect the proportion of cars that are sold in this region and the overall demographics of people who participated in the events.
Event observations and follow-up survey results are in Appendix 5.
Participant Follow-up SurveysOut of the 271 event participants with leaking vehicles, 177 people provided contact information (either an email address, phone number or both). Participants with email addresses were invited to participate in a web-based survey and were offered an incentive of a one-day Discover Pass to Washington State Parks to participate. Participants who only provided a telephone number or who did not respond to the web-based survey were called so that the survey could be administered by phone. Overall, 56 people (32% of those who provided contact information,

Results20
which represents 21% of leakers identified at events) responded to the survey.7
Key findings from the survey are:
• 47% of respondents took their vehicle to a shop after the event (27 out of 56). ‐ People who used a shop most commonly reported using their regular auto shop (18 out
of 27), as opposed to finding one through the campaign website, internet searches, or asking friends.
‐ 29% had their vehicle inspected informally by themselves or someone they know with auto repair experience (16 out of 56).
39% of respondents had the leak repaired (22 out of 56.) 14% planned to repair the leak, but had not completed the repair, yet (8 out of 56)
• Respondents who fixed their leak were asked how long they waited before completing repairs: ‐ 50% did so within 2 weeks (11 out of 22) ‐ 27% did so within 1 month (6 out of 22) ‐ 17% did so within 3 months (3 out of 22) ‐ 9% did so within 6 months (2 out of 22)
• The most common motivations among respondents who had fixed or planned to fix the leak were: (respondents could indicate up to 3 reasons) ‐ 40% protect the environment (12 out of 30) ‐ 27% prevent vehicle damage (8 out of 30) ‐ 27% keep the vehicle reliable (8 out of 30) ‐ Other reasons with one or two responses included keeping driveway/garage clean (no
drips), keeping road safe from oil slicks, needed another repair anyway, keeping family/pets safe from exposure to chemicals, and the discount offered by the Don’t Drip and Drive program.
• The reasons for waiting to fix the leak mentioned by respondents who had waited longer than two weeks were (they could select up to three answers): ‐ 39% to save up money for the repair (7 out of 18) ‐ 33% to wait for a convenient time or place (6 out of 18) ‐ 17% plan to repair it at their next regularly scheduled maintenance or need another
repair (3 out of 18) ‐ Other responses included forgetting to make an appointment, lack of time, and being
out of state.• Respondents who fixed or planned to fix their leaks were asked about the cost of repairs:
‐ Most reported that the cost to fix it was $100 or less (10 out of 29) ‐ Some reported that the repair cost $101 to $500 (6 out of 29). ‐ Three respondents said the repair cost was $1,000 or more.
29% of respondents (16 out of 56) said they did not plan to have the vehicle repaired.
• Respondents were asked why they would not repair the leak and responded: (they could select up to three answers) ‐ they can’t afford the cost of the repair (6 out of 16) ‐ the leak is not a big problem (6 out of 16) ‐ the car is not worth fixing (5 of 16) ‐ they plan to sell the car or have sold their car (5 out of 16)
• Respondents who did not plan to fix their leaks most commonly reported higher estimated repair costs than respondents who had or planned to fix their leaks. They most commonly said that the repair cost was $1,000 or more (5 out of 14 people). However, another five
7 Because only participants who provided contact information could respond to the survey, results may not reflect the opinions of all event participants who had leaks.
General findings
Findings about people who had
their leak repaired, or intend to
Findings about people who will not
repair their leak

Results 21
respondents could not remember the estimated cost and two people said they had not received an estimate.
• Respondents who did not plan to fix their leak were asked whether they would have fixed their leak if the discount had been higher. They were randomly assigned one of three values: $100, $150 or $200. ‐ 2 would have repaired the vehicle ‐ 1 might have repaired the vehicle ‐ 10 would not have repaired the vehicle
Appendix 5 presents more details from survey responses, including results for questions regarding respondent attitudes and demographics.
Event organizer follow-up surveysSix out of seven organizations that implemented at least one leak check event completed a phone survey about their participation. The following are the key findings from those surveys:
• Advisorycommittee- Respondents mentioned that participating in the monthly Don’t Drip and Drive Advisory Committee provided the opportunity to share and learn from each other’s event planning experiences during committee meetings.
• Challenges- The most highly cited difficulties in planning and implementing a leak check event were working with businesses to host an event, the logistics of setting up at different locations, volunteer recruitment and the short timeline of the event schedule.
• Time- When asked about the time required to plan and implement events, four respondents said 40 to 50 hours while two said 10 to 20 hours.
• Volunteers- Respondents reported that although many volunteers generally enjoyed their experience, some volunteers had difficulty with logistics, weather or understanding and conveying the material. One respondent mentioned that offering volunteers an annual Discover Pass to Washington State Parks ($30 value) for participating was very helpful.
• Futureparticipation- Three respondents said they would participate in a leak check event in the future, while the other half said they didn’t know. Uncertain respondents said that the events would need to be simpler, fit into their schedules and be more organized.
• Suggestedimprovements- Suggestions for improving the events in the future included streamlining and centralizing event planning, simplifying events and tracking and increasing the connection to auto and quick lube shops.
Participating Repair Shops
Phase II built on the relationship with the Automotive Services Association Northwest (ASA) member repair shops (developed in Phase I) and expanded partnerships to include repair shops that are members of EnviroStars and AAA Washington, as well as non-affiliated repair shops.
Left photo: Volunteers at a Bellingham leak check
event with third party mechanic, Jack Devine
(Credit Lee First)
Right photo: Suzi Wong Swint, Snohomish
County, demonstrates how to place a
drip sheet (Credit Heather Trim)

Results22
Participating Repair Shops ImplementationPartner organizations helped promote the campaign and recruit their member automotive repair shops to provide free inspections and discounts on leak repairs. Local jurisdictions also helped recruit shops in their area. Participating shops agreed to offer customers free visual vehicle leak inspections and discounted leak repairs from July through September 2014. Discounts provided by auto shops (at no cost to the campaign) offered ten percent off leak repairs, up to $50. The shop repair discounts were promoted through online ads, the website and other outreach activities.
Repair shops were provided with a toolkit that included in-shop advertising materials such as displays, door decals and discount coupons. Customers were asked to provide their contact information on the back of the coupon in order to receive their service. Repair shops also received tracking forms to track vehicles inspected including number of vehicles without leaks, number of vehicles with leaks and number of vehicles repaired. Shops were asked to return tracking forms and filled-out coupons to campaign organizers monthly from July through September 2014.
Appendix 4—Auto Shop Partner Toolkit contains the recruitment letters, electronic versions of materials provided to shops and tracking instructions and forms.
A total of 102 auto repair shops registered to participate in the program. Of these shops, 28 participants (27%) returned tracking forms. Reporting shops documented that they inspected a total of 4,489 vehicles, finding that 29 percent (1,303) of tested vehicles had leaks. Of the leaking vehicles identified, shops reported repairing 692 vehicles for an average 53 percent immediate repair rate. 16 shops returned 213 coupons during the campaign, and of those coupons, 105 contained contact information.
Left photo: Repair shop counter-top display
Right photo: Coupon provided to customers
at repair shops
Receive a FREE visual leak inspection today – and save up to $50 if you have a leak! But only until September 30th.
Funded by a grant from the Department of Ecology
Visit www.fixcarleaks.org for more information.
Oil leaks have a big impact on the safety and reliability of your vehicle – not fixing them can cause more damage to your car and its ability to get where you need to go safely. And those small leaks lead to big messes: oil leaks are one of the largest polluters of the Puget Sound.
Don’t Drip & Drive is a regional program supported by the Washington Department of Ecology and jurisdictions around Puget Sound. Receive a FREE visual leak inspection at participating repair shops – an $80 value! And should a leak be found, you can get 10% off repairs (up to $50). But only for a limited time.
Visit www.fixcarleaks.org for more information
If your car is leaking oil, it doesn’t just mean your engine is at risk – it also means that leaking oil may run off to rivers, lakes, streams and Puget Sound. Don’t Drip & Drive. Fix That Leak! Use this coupon by September 30, 2014 to receive a FREE visual Leak Inspection and receive 10% off (up to $50)
on leak repairs at participating repair shops. Visit www.fixcarleaks.org to find a location near you.
www.fixcarleaks.orgStorm Member 2014
Coupon expires September 30, 2014.

Results 23
The percentage of vehicles with leaks found by repair shops varied from shop to shop throughout the region, ranging from 19 percent to 65 percent of vehicles with leaks. The repair rate among vehicles with leaks also varied, ranging from 46 percent to 75 percent.8 In addition, repair rates reported by shops did not differentiate between multiple visit customers who may have had a leak identified and not repaired on one occasion and returned to have it repaired on another occasion.
Customer follow-up surveysIn total, 213 shop participants filled out the back of the customer discount coupon, which included questions about why drivers had visited the shop and where they had heard about the campaign, in addition to requesting contact information. Nearly half of participants who filled out the coupon provided an email address, a phone number or both (105 people). Of these, 54 people responded to the follow-up survey. 39 respondents had leaks and 15 respondents reported that they did not have a leak (used the coupon for a free inspection) or did not remember if they had a leak.
Key findings from the survey are:
• The vast majority of respondents (89%) said they had heard about the free leak inspection and discount offer from the shop. Nine percent indicated they learned about the campaign from another source. Three people listed the other source: Google, AAA and a friend. Only two people said they learned about the campaign from a leak event. Coupon participants most commonly said they visited the shop for routine maintenance (43%), leak check (27%) or leak repair (22%).
• Respondents were asked about their motivation for visiting the shop. Table 8 provides their responses:
Count PercentageRoutine maintenance 85 43%Leak check 54 27%Leak repair 44 22%Other repair 61 31%
Note: Respondents were encouraged to select all that applied. 15 respondents selected both leak check and leak repair.
• 72 percent of respondents said their vehicle had a leak (39 out of 54)• Only four respondents said they did not plan to fix their leak. This low number is expected
because discount coupons were redeemed on the spot to help reduce the cost of repairing their vehicle in most cases. In addition, shops may have requested or required coupons only when offering the repair discount, because many already performed free leak checks as part of their routine service.
79% of those with a leak had their leak repaired (30 out of 39) and 10% of those with a leak reported they planned to have their leak repaired, but have not done so, yet (4 out of 39)
• The motivations among respondents who had fixed or planned to fix their leak were: ‐ 47% Keep the vehicle reliable (16 out of 34) ‐ 26% Prevent vehicle damage (9 out of 34) ‐ 21% Protect the environment (7 out of 34)
8 Use of the tracking forms provided among those repair shops who did report was inconsistent, and as such, these numbers may not reflect overall repair rates, only those the repair shop determined to be related to the campaign. In some cases, repair shops advertised the campaign to every customer, while others only offered the campaign to those who inquired about it.
General findings
Table 8. Coupon survey: Why did you come into
the shop today?
Findings about people who repaired their leaks or intend to repair their leaks

Results24
‐ 18% Keep driveway/garage clean (no drips) (6 out of 34) ‐ 15% Keep roads safe from oil slicks (5 out of 34) ‐ Other responses (1-2 persons each) included the Don’t Drip and Drive discount,
convenience of already having the car at the shop, and disliking leaks.• The most common reasons for waiting to fix the leak were:
‐ 38% To save up money for the repair (6 out of 16) ‐ 25% To wait for a convenient time or place (4 out of 16) ‐ 25% Respondent didn’t drive the vehicle regularly (4 out of 16) ‐ 19% Needed time to think about it (3 out of 16) ‐ Other responses (1-2 persons each) included wanting a second opinion, planning to fix
it when the leak gets worse and the vehicle is a long-term project (vintage car).
10% of those with a leak do not plan to have their leak repaired (4 out of 39). Only three respondents not planning to fix their leak shared their reasoning. Each had a different response:
• The car was not worth fixing.• They were planning to sell the car soon anyway.• They don’t drive the car regularly.
Appendix 5 contains more details on these questions as well as results for questions regarding respondent attitudes and demographics.
Repair shop partners follow-up interviewsTelephone surveys with 35 of the participating shops were conducted by an advisory committee member after the campaign. The survey’s goal was to obtain feedback about the overall campaign and suggestions for future efforts. Phone calls were made to 106 out of 126 repair shops that participated in either Phase I or II of the campaign, and 35 interviews were completed.
“Thisprogramisawin-win-itsavespeoplemoneyandprotectsPugetSound,”saidaparticipatingrepairshopowner.
Key findings:
• Primary motivators for program participation were to attract more business (41%), to protect the environment (35%), belief that it was a good program (47%) and membership in ASA (29%).
• Most shops (92%) offered seasonal or regular discounts before participating in Don’t Drip and Drive.
• When asked what percentage of vehicles entering their shops typically have leaks, more than a third (36%) of respondents estimated less than 25% of vehicles. Another third (33%) of respondents estimated between 25 and 50% of vehicles.
• Most respondents found the process to register their shop for the program very simple and straightforward (67%) and the tracking sheets easy to use (63%).
• Several stated that they had overall positive reactions from customers. Only two respondents said they had customers who were not receptive: one said customers didn’t have money to fix the leak or were already planning to get rid of the car, and one said customers were skeptical about the state providing funding and asking for contact information.
• The majority of respondents (81%) gave the campaign-provided marketing materials a 3 or 4 on a scale from 1 (I didn’t like them at all) to 4 (I loved them). Eight shops suggested additional marketing materials, including additional advertisements, a banner, something to attach to customer emails and press releases for local papers.
• Some respondents (9 shops, 26% of respondents) mentioned that the campaign was more successful in Phase I than in Phase II. Reasons cited included: they felt that Phase I had more advertising and that timing the campaign in the less busy spring season rather than
Findings about people who did not
repair their leaks and do not intend to

Results 25
the summer was better, because they had more time available to promote the program to their customers.
• Most respondents reported that they promoted the program to customers who either had a leak (28% of respondents) or had a concern about leaks (52%). ‐ 7% of shops told every customer about the promotion. ‐ 14% of shops only offered the promotion to customers who asked about it.
• Generally, shops felt that no additional offer would have motivated their shop to promote the campaign to every customer. Reasons cited included: it doesn’t make sense to promote the program to customers without leaks and they know their customers.
• Most common suggestions for program improvement in the future included increasing advertising and changing the campaign timing to a less busy season.
• The most highly recommended months for the campaign were January, February, June, July, or August (recommended by 40% of respondents); another 32 percent of respondents recommended March or April. While many respondents mentioned that the time of year was not greatly important, other respondents generally reported that: ‐ Winter (especially January and February) is slow, so a campaign to increase business
would be helpful. ‐ Spring and early summer are good because people are preparing their vehicles for
summer trips. ‐ Summer is the busiest time for repair shops, so they have less time to promote and
track the campaign. ‐ Early fall is good because families that are busy all summer have more time and money.
• The majority of respondents (81%) said they would participate in the program in the future. • Respondents commonly described the program as a “win-win,” “good cause,” and “the
right thing to do.” • The primary reason cited for not participating in the future was that the shop did not receive
enough customer traffic from the campaign.
Additional details from repair shop interviews are presented in Appendix 9.
Psychographics from Follow-up Surveys for Leak Check Event and Repair Shop Participants
Respondents to the follow-up leak check event and shop repair surveys were asked questions to help determine psychographic profiles of those who tend to repair their leaks and those who do not. While the overall survey response numbers are low, some potential trends can be identified.9 Additional research in future phases of the Don’t Drip and Drive program is needed to quantify these characteristics and associations.
Use of VehicleParticipants (leak check events and shop repair) who had leaks were asked “What do you use the car that has/had a leak for primarily? (select all that apply).” There did not appear to be a significant difference in vehicle usage between those who fixed their leaks and those that did not. Table 9 provides details about survey responses related to use of the leaking vehicle.
9 The analysis combines event and shop participants, which may cause some distortion of results, because it is possible that these participants had different demographic profiles. In addition, the respondents who did not plan to fix their leak represent results for event participants, who make up the largest share of respondents in that group (14 out of the 18 respondents who do not plan to fix).

Results26
Respondents who fixed their leak or planned to fix their leak
Respondents who do not plan to fix their leak
I commute to work, school or daily activities
70% (45 out of 64) 66% (12 out of 18)
It is my back-up car that I don’t drive often
19% (12 out of 64) 22% (4 out of 18)
I use it for my weekend recreational activities
9% (6 out of 64) 17% (3 out of 18)
I transport my family 8% (5 out of 64) 11% (2 out of 18)*Other responses not included in the table are those with one or two responses.
Preferred vehicle featuresParticipants who had leaks were asked “What features will be most important for you when you purchase your next car?” (Could choose top 3 choices). This question was asked in order to determine if there were any characteristic values or behaviors associated with those who tend to fix their leaks. There was not a significant difference in vehicle usage between those who fixed their leaks and those that did not, except that those who fixed or planned to fix their leaks noted a preference (19%) for reputation for low maintenance needs. Responses are included in Table 10.
Respondents who fixed their leak or planned to fix their leak
Respondents who did not fix their leak
Fuel efficient 55% (35 out of 64) 53% (9 out of 15)Brand or model has a reputation for lasting a long time
28% (18 out of 64) 18% (3 out of 15)
Brand or model has a reputation for low maintenance needs
19% (12 out of 64)
High safety rating 13% (8 out of 64)4-wheel or all-wheel drive 11% (7 out of 64)Large enough to carry my children/family
8% (5 out of 64) 18% (3 out of 15)
Used car 8% (5 out of 64)*Other responses not included in the table were those with one or two responses
Type of homeParticipants (leak check events and shop repair) who had leaks were asked “What kind of home do you live in?” A difference was seen in the responses, although results were not statistically tested and the sample size for respondents who do not plan to fix their leak is extremely small. More respondents who fixed or planned to fix their leak own their house (59%) than the respondents who did not fix their leak (28%). Renters were proportionately reversed: 29% versus 55%. Table 11 provides survey responses about type of home the vehicle owner lives in.
Table 9. Survey respondents identified the primary use of the
leaking vehicle
Table 10. Survey respondents selected
those features that they will look for in their
next car

Results 27
Respondents who fixed their leak or planned to fix their leak
Respondents who did not fix their leak
House/duplex that I own 59% (37 out of 63) 28% (5 out of 18)Condo/apartment that I rent 19% (12 out of 63) 44% (8 out of 18)House/duplex that I rent 10% (6 out of 63)
*Other responses not included in the table are those with one or two responses.
Workshops
The Free Auto Leaks Workshop program, a collaboration between the Department of Ecology and Seattle Public Utilities, was designed to improve vehicle owner awareness of the benefits of checking for and repairing leaks. The four-hour long workshops consisted of a lecture, short instructional video, inspection of each participants’ vehicle and distribution of vehicle maintenance check kits. Workshops were held at auto repair training centers in local schools and taught by instructor mechanics. In all, 95 Seattle-area workshops were held over 13 months with an estimated 1,120 people attending. The program evaluation included data from workshop exit surveys, a post-workshop online survey and interviews with workshop instructors.
Exit Surveys356 participants completed exit surveys at the workshops. Participants said that as a result of the workshop they were very likely to:
• Check for leaks on their cars (88%)• Use the vehicle maintenance checklist (86%)• Change how they maintained their cars (78%)
The main reason participants gave for not repairing their leaks was cost (61%). Many said that having money, discounts or being able to make payments would make repairing leaks easier (35%). Some also said the knowing how to fix it would make it easier (27%).
Follow-up Surveys269 participants responded to an online survey. Most said that the instructor found a leak or problem with their vehicle during the workshop (65%). Of those, 76% had repaired all or some of the problems at the time of the survey. Most said their motivation for getting their car repaired was to extend the life of the vehicle (66%) or that they didn’t want to pollute the Puget Sound watershed (61%).
Among those who still had problems needing repairs, many said they had not done so because they didn’t have the money (40%). Most said they would definitely have completed repairs if they had been offered as much as a $100 rebate (63%) and additional 24% would have repaired with a $200 rebate, and 13% required $300 or more to make their repairs.
Table 11. Survey respondents identified
the type of residence they live in
Right photo: Mechanic instructor shows
workshop participants the source of a
leak (Credit Justine Asohmbom)

Results28
“Peopleattendtheworkshop,becausetheywanttobeproactive,”saidJanosSzablya,WorkshopInstructor,ShorelineCommunityCollege.“Itisthefirststep.Ihavehadpeoplecomebackandsay,‘I’vegottheleaksfixed.’Itiseffective,it’sworking.”
Instructor InterviewsInterviews were conducted with four instructors from three of the workshop locations. All of the instructors said that the participant feedback was overwhelmingly positive. They felt that most participants probably found that the workshop exceeded their expectations. Instructors said that their participants left the workshop:
• Knowing about how their car runs,• Understanding the importance of checking fluids,• Intending to be more responsible with their car’s maintenance, and• Showing much more confidence in their ability to effectively communicate with a mechanic.
Instructors cited compelling information about environmental impacts, hands-on experience and interaction with other participants as the most effective elements of the program. The primary constructive criticism that instructors were aware of had to do with use of time. Some participants shared that they wanted more time with the instructor under their car.
When instructors were asked to comment on their own experience being a part of this program they were very positive. They felt like the program had been successful, that the participants were grateful and they liked being involved.
“Iboughtintothisprogram,becauseIbelievethemissioniscorrect.Itismakingadifference,carbycar,ownerbyowner.Weareontherightpath,”saidJackDevine,WorkshopInstructor,RentonTechnicalCollege.
Additional details on the Workshops evaluation is in Appendix 1.
Program Cost Analysis
Don’t Drip and Drive Phase II was supported by multiple funding sources, including grants from Washington State Department of Ecology ($299,920) and the Puget Sound Partnership ($40,000) and contributions from partner organizations, jurisdictions, businesses and volunteers. It is difficult to quantify total value of some of these donations, but the total Phase II program is estimated to be valued at almost $700,000.
This section summarizes expenditures funded by the grants from Ecology (Table 12) and Puget Sound Partnership (Table 13), as well as additional contributions by program partners (Table 14).
Task Title Budget Expended
1 Program Administration/Management $18,0032 Marketing Plan and Audience Research $6,4343 Campaign Advertising and Implementation Partnerships $78,9264 Organizational, Business and Corporate Partnerships $19,8905 Leak Check Events and Toolkit $109,7416 Program Evaluation and Long-term Funding Strategy $63,683
Total Ecology grant-funded amount $296,677
*Note: Additional contributions outside of the grant amount are documented in Table 14
Table 12. Grant of Regional or Statewide
Significance funded by Washington Department of Ecology, managed by Pierce County on behalf
of STORM
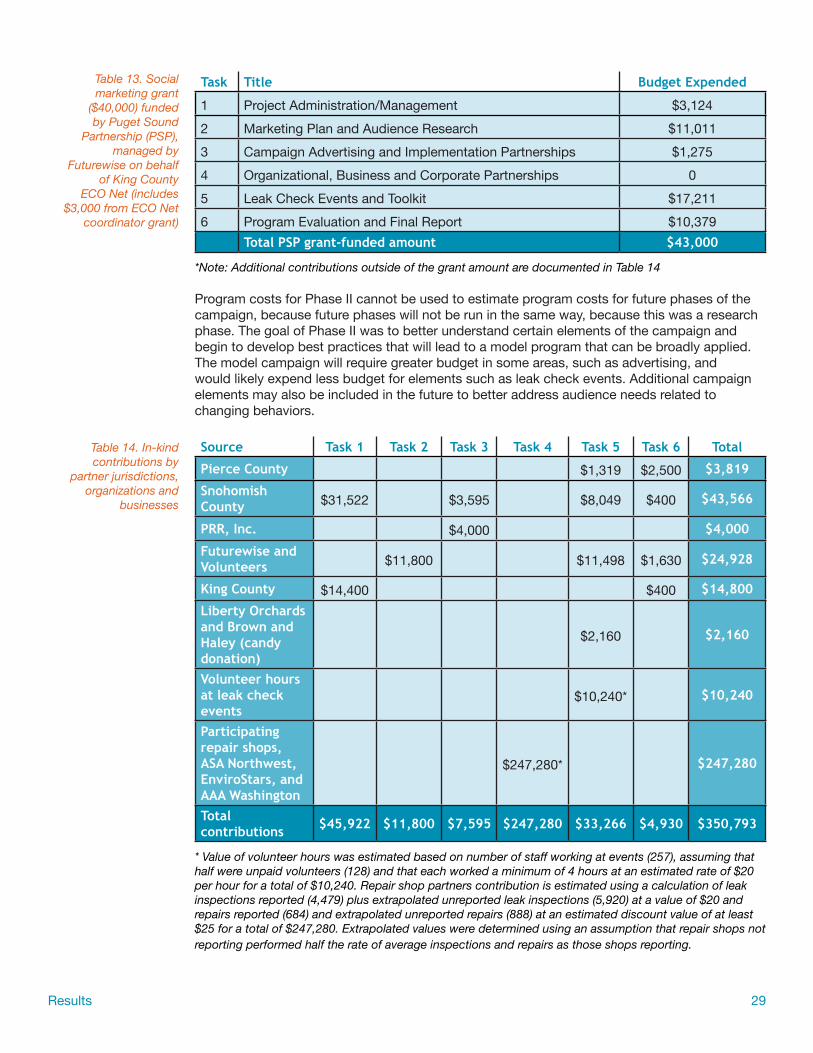
Results 29
Task Title Budget Expended
1 Project Administration/Management $3,1242 Marketing Plan and Audience Research $11,0113 Campaign Advertising and Implementation Partnerships $1,2754 Organizational, Business and Corporate Partnerships 05 Leak Check Events and Toolkit $17,2116 Program Evaluation and Final Report $10,379
Total PSP grant-funded amount $43,000
*Note: Additional contributions outside of the grant amount are documented in Table 14
Program costs for Phase II cannot be used to estimate program costs for future phases of the campaign, because future phases will not be run in the same way, because this was a research phase. The goal of Phase II was to better understand certain elements of the campaign and begin to develop best practices that will lead to a model program that can be broadly applied. The model campaign will require greater budget in some areas, such as advertising, and would likely expend less budget for elements such as leak check events. Additional campaign elements may also be included in the future to better address audience needs related to changing behaviors.
Source Task 1 Task 2 Task 3 Task 4 Task 5 Task 6 Total
Pierce County $1,319 $2,500 $3,819
Snohomish County $31,522 $3,595 $8,049 $400 $43,566
PRR, Inc. $4,000 $4,000
Futurewise and Volunteers $11,800 $11,498 $1,630 $24,928
King County $14,400 $400 $14,800
Liberty Orchards and Brown and Haley (candy donation)
$2,160 $2,160
Volunteer hours at leak check events
$10,240* $10,240
Participating repair shops, ASA Northwest, EnviroStars, and AAA Washington
$247,280* $247,280
Total contributions $45,922 $11,800 $7,595 $247,280 $33,266 $4,930 $350,793
* Value of volunteer hours was estimated based on number of staff working at events (257), assuming that half were unpaid volunteers (128) and that each worked a minimum of 4 hours at an estimated rate of $20 per hour for a total of $10,240. Repair shop partners contribution is estimated using a calculation of leak inspections reported (4,479) plus extrapolated unreported leak inspections (5,920) at a value of $20 and repairs reported (684) and extrapolated unreported repairs (888) at an estimated discount value of at least $25 for a total of $247,280. Extrapolated values were determined using an assumption that repair shops not reporting performed half the rate of average inspections and repairs as those shops reporting.
Table 13. Social marketing grant
($40,000) funded by Puget Sound
Partnership (PSP), managed by
Futurewise on behalf of King County
ECO Net (includes $3,000 from ECO Net
coordinator grant)
Table 14. In-kind contributions by
partner jurisdictions, organizations and
businesses

Results30
The ability of this program to meet the needs of so many diverse groups including non-profits, government and business is unique and provides an excellent opportunity to leverage funding resources to meet campaign needs. Over the course of both phases of the campaign, more than half of the program’s value has come from contributions in addition to grant funds received. Table 14 documents non-grant funded program contributions. Table 15 summarizes total program investment by grants and outside contributions.
Task Title Grant funds
Outside contributions
Total program value
1 Program Administration/Management $21,127 $45,922 $67,049
2 Marketing Plan and Audience Research $17,445 $11,800 $29,245
3 Campaign Advertising and Implementation Partnerships $80,201 $7,595* $87,796
4 Organizational, Business and Corporate Partnerships $19,890 $247,280 $267,170
5 Leak Check Events and Toolkit $126,952 $33,266 $160,218
6 Program Evaluation and Long-term Funding Strategy $74,062 $4,930 $78,992
Total Program Value $339,677 $350,793 $690,470*This number does not include estimated value of additional promotions conducted by jurisdiction and non-profit partners, or additional advertising purchased by participating repair shops.
Regional Survey Data Analysis
Over the past several years, multiple stormwater surveys have been fielded in the Puget Sound region that have begun to gauge vehicle owner attitudes, behaviors and beliefs related to stormwater pollution, many of which have included valuable data about vehicle owner attitudes and behaviors related to leaks. Although some of those surveys have not used the exact same metrics and cannot be directly compared to one another, results may show some trends. The following are results from a selection of recent surveys that can be used to begin to establish a baseline related to vehicle owner attitudes, behaviors and trends:
Stormwater Runoff: Awareness, Attitudes and Behavior (Cities of Bellevue, et al, 2012)This report summarizes a telephone survey to assess resident awareness, attitudes and behavior relative to stormwater runoff. This is a follow-up to a baseline survey conducted in 2005. Questions related to vehicle leaks were not consistently asked between 2005 and 2012 surveys, therefore cannot establish a trend. The survey was administered to 2,030 randomly-selected adults with a separate sample drawn for each of the six cities. Key findings related to vehicle leaks are as follows:
• 58% “make it a point” to regularly check for oil leaks under their vehicles ‐ Homeowners were more likely than renters to regularly check (60% vs. 45%) ‐ Car owners under the age of 35 were less regular checkers than their elders (44% vs.
60%) ‐ Regular checking generally rose with income, from 54% of those with incomes under
$50,000 to 61% of those over $125,000• 91% said they would get a leak checked “right away” if they noticed one.
‐ Of those who would “watch to see if it got worse,” 34% cited potential expense as the main reason to delay
‐ Another 35% said either that “a small leak doesn’t really hurt anything (18%) or, “it would be more trouble than it is worth” (16%)
Table 15. Total estimated
program value

Results 31
• A number of incentives show some promise in getting people to move quickly to repair oil leaks. Although the proportion of vehicle owners who wait to fix fluid leaks is small, some information appears to have potential to reduce the number even further. ‐ 62% said knowing that fixing the leak would extend the life of the vehicle would be
“very effective” in motivating them to fix the vehicle right away. ‐ 53% said the same of knowing how to fix the leak themselves. ‐ 47% said if they were told that oil leaks eventually drain into local creeks, lakes and
Puget Sound, that would be a very effective motivator. ‐ 36% said a discount on the repair work would be very effective. ‐ 34% said it would be effective to know that keeping fluid leaks off the streets will make
them safer to drive on. • Six potential behaviors were rated by most respondents as potentially “very effective”
at protecting water quality, 78% said repairing vehicle leaks would be very effective. Respondents were also asked about their perceptions of significant sources of pollution, and 69% identified oil leaks as a significant source.
Sound Behavior Index (Puget Sound Partnership, 2013)This study was developed to serve as an ongoing measure for public adoption of a variety of practices that affect water quality and aquatic habitat and for informing PSP program development to assess outcomes. The survey was conducted in 2012 and 2013, and this report compares results of both. The survey was fielded in late 2013 among a random sample of 3,131 residents of the twelve counties in the Puget Sound region, with a minimum sample of 250 respondents per county. Key findings related to vehicle leaks from the report are as follows:
• 74% reported that they always or usually check their vehicle for fluid leaks. There was not a significant change in these results between 2012 and 2013 surveys.
General Opinion Survey (Puget Sound Partnership, 2013)This survey was designed to measure the attitudes of Puget Sound residents about the health and condition of the waters in and around the Puget Sound. The survey also measured their knowledge related to vehicle maintenance in regard to leaks, among other focus items. The survey was administered via a telephone survey with a quota of 375 respondents for the 5 subregions of Puget Sound with a total of 1,877 respondents.
• When asked which of their household activities they thought had a negative effect on water quality, 92% identified oil and fluid leaks from their cars. This response was higher than all other activities.
• 77% reported that their vehicle is checked for leaks regularly. When asked how often the vehicle is checked, 92% report that is was checked at least every six months and 32% reported that it is checked at least once a month. Those who were most likely to have their vehicle inspected routinely were: ‐ Homeowners (82%) compared to renters (64%)
Left photo: Oil leak in Bellevue (Credit Laurie
Devereaux)
Right photo: Oil leak in Seattle (Credit Blair
Scott)

Results32
‐ Residents with an income of $35,000 of more (80%) compared to those with an income below $35,000 (62%)
• 44% of respondents reported that they or a family member checked for leaks, while 54% reported that a professional checked their car for leaks.
• 88% reported that they did not think their car was checked for leaks when it was taken to a quick lube shop, versus 7% who believed that it was and 5% who did not know.
Residential Stormwater Survey Public Attitudes, Awareness and Behavior (Kitsap County, et al, 2011)This survey was conducted to gain a better understanding of how local and regional stormwater outreach programs influence residential awareness, activities and behaviors and track changes since a 2008 benchmark survey. Survey sample size was 802 and was conducted in the sponsoring jurisdictions. The following findings relate to vehicle leaks:
• 37% reported that they regularly check for leaks under the vehicle, while 39% do not check for leaks but think they would notice if there was a leak. 6% do not check for leaks. Respondents who check for leaks more regularly are: ‐ Men ‐ Change their motor oil at home
King County Environmental Behavior Index Survey (Tarnai, 2011)This survey was conducted to establish an index of a range of behaviors related to the environment in King County. The majority of survey responses were by random telephone survey (12,441) with a smaller number in response to a request letter (607 email, 1,209 phone) for a total sample size of 21,782 respondents. This survey is a follow-up to surveys conducted in 2005, 2006 and 2008. 2011 is the first year vehicle leaks were a topic, and the following are the key findings:
• 15% reported they had noticed a vehicle leak, and of those 39% repaired their leak within one week, 39% reported they repaired their leak within a month and 14% repaired their leak within 2-3 months.
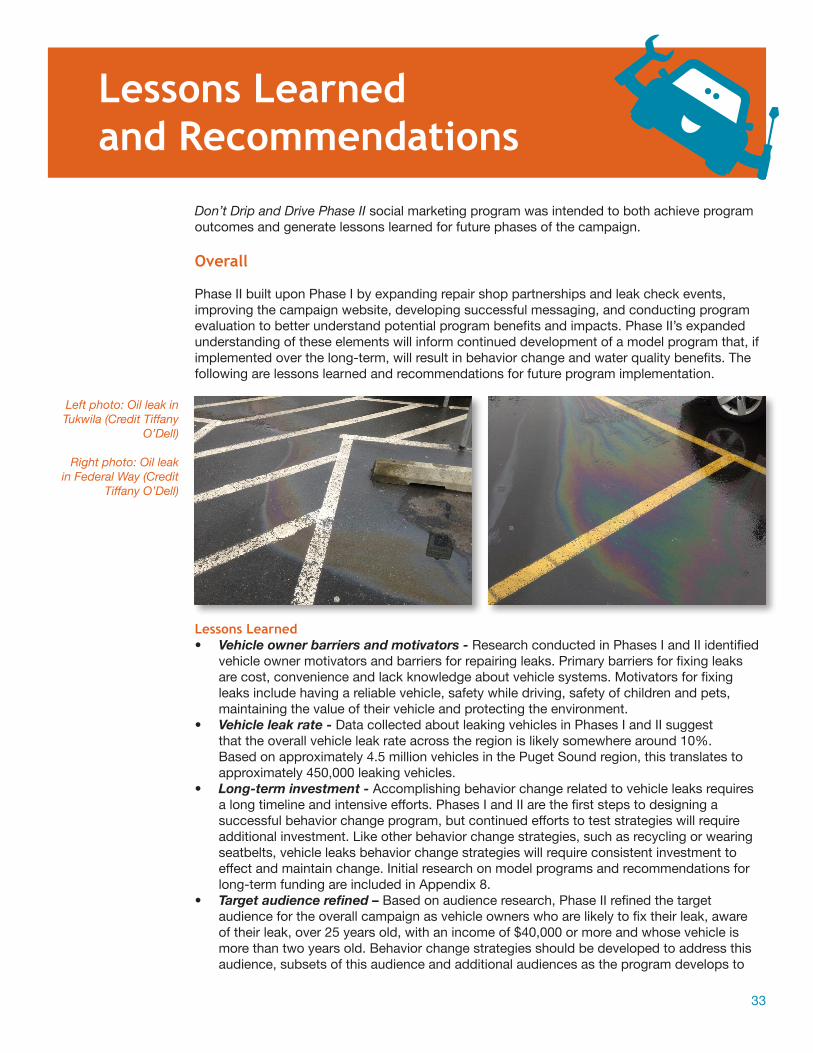
33
Lessons Learned and Recommendations
Don’t Drip and Drive Phase II social marketing program was intended to both achieve program outcomes and generate lessons learned for future phases of the campaign.
Overall
Phase II built upon Phase I by expanding repair shop partnerships and leak check events, improving the campaign website, developing successful messaging, and conducting program evaluation to better understand potential program benefits and impacts. Phase II’s expanded understanding of these elements will inform continued development of a model program that, if implemented over the long-term, will result in behavior change and water quality benefits. The following are lessons learned and recommendations for future program implementation.
Lessons Learned • Vehicleownerbarriersandmotivators-Research conducted in Phases I and II identified
vehicle owner motivators and barriers for repairing leaks. Primary barriers for fixing leaks are cost, convenience and lack knowledge about vehicle systems. Motivators for fixing leaks include having a reliable vehicle, safety while driving, safety of children and pets, maintaining the value of their vehicle and protecting the environment.
• Vehicleleakrate- Data collected about leaking vehicles in Phases I and II suggest that the overall vehicle leak rate across the region is likely somewhere around 10%. Based on approximately 4.5 million vehicles in the Puget Sound region, this translates to approximately 450,000 leaking vehicles.
• Long-terminvestment-Accomplishing behavior change related to vehicle leaks requires a long timeline and intensive efforts. Phases I and II are the first steps to designing a successful behavior change program, but continued efforts to test strategies will require additional investment. Like other behavior change strategies, such as recycling or wearing seatbelts, vehicle leaks behavior change strategies will require consistent investment to effect and maintain change. Initial research on model programs and recommendations for long-term funding are included in Appendix 8.
• Targetaudiencerefined–Based on audience research, Phase II refined the target audience for the overall campaign as vehicle owners who are likely to fix their leak, aware of their leak, over 25 years old, with an income of $40,000 or more and whose vehicle is more than two years old. Behavior change strategies should be developed to address this audience, subsets of this audience and additional audiences as the program develops to
Left photo: Oil leak in Tukwila (Credit Tiffany
O’Dell)
Right photo: Oil leak in Federal Way (Credit
Tiffany O’Dell)
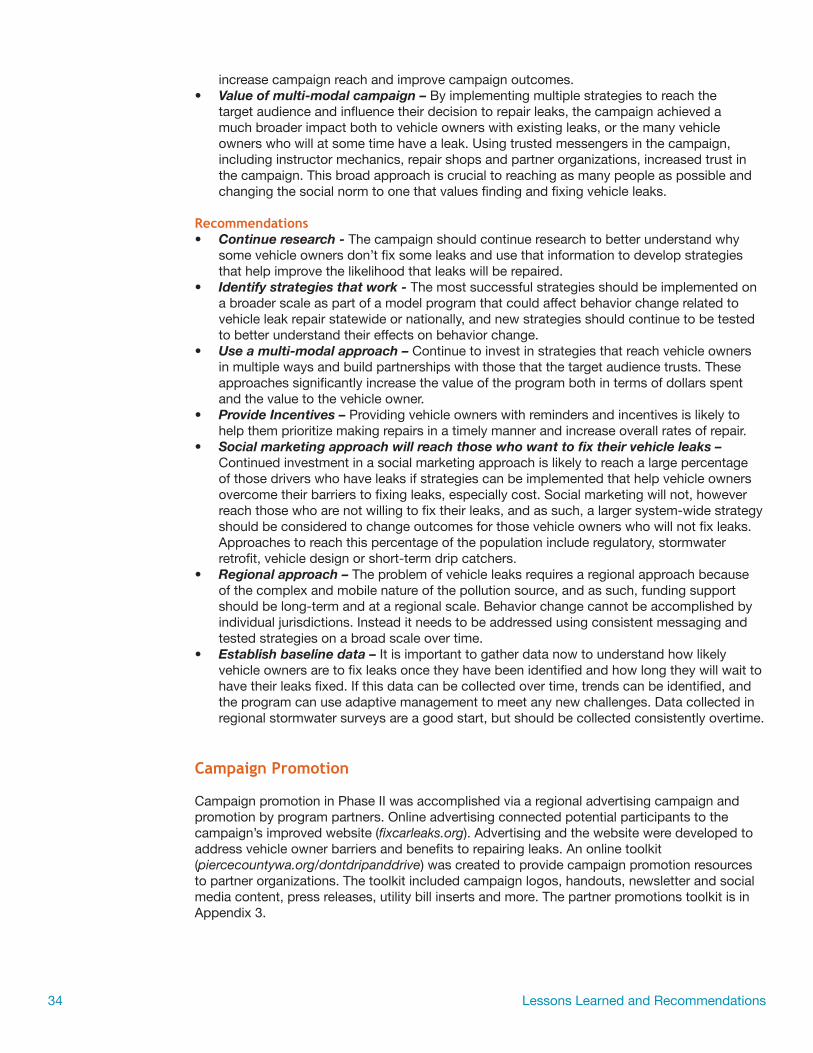
Lessons Learned and Recommendations34
increase campaign reach and improve campaign outcomes. • Valueofmulti-modalcampaign–By implementing multiple strategies to reach the
target audience and influence their decision to repair leaks, the campaign achieved a much broader impact both to vehicle owners with existing leaks, or the many vehicle owners who will at some time have a leak. Using trusted messengers in the campaign, including instructor mechanics, repair shops and partner organizations, increased trust in the campaign. This broad approach is crucial to reaching as many people as possible and changing the social norm to one that values finding and fixing vehicle leaks.
Recommendations• Continueresearch- The campaign should continue research to better understand why
some vehicle owners don’t fix some leaks and use that information to develop strategies that help improve the likelihood that leaks will be repaired.
• Identifystrategiesthatwork-The most successful strategies should be implemented on a broader scale as part of a model program that could affect behavior change related to vehicle leak repair statewide or nationally, and new strategies should continue to be tested to better understand their effects on behavior change.
• Useamulti-modalapproach–Continue to invest in strategies that reach vehicle owners in multiple ways and build partnerships with those that the target audience trusts. These approaches significantly increase the value of the program both in terms of dollars spent and the value to the vehicle owner.
• ProvideIncentives– Providing vehicle owners with reminders and incentives is likely to help them prioritize making repairs in a timely manner and increase overall rates of repair.
• Socialmarketingapproachwillreachthosewhowanttofixtheirvehicleleaks–Continued investment in a social marketing approach is likely to reach a large percentage of those drivers who have leaks if strategies can be implemented that help vehicle owners overcome their barriers to fixing leaks, especially cost. Social marketing will not, however reach those who are not willing to fix their leaks, and as such, a larger system-wide strategy should be considered to change outcomes for those vehicle owners who will not fix leaks. Approaches to reach this percentage of the population include regulatory, stormwater retrofit, vehicle design or short-term drip catchers.
• Regionalapproach–The problem of vehicle leaks requires a regional approach because of the complex and mobile nature of the pollution source, and as such, funding support should be long-term and at a regional scale. Behavior change cannot be accomplished by individual jurisdictions. Instead it needs to be addressed using consistent messaging and tested strategies on a broad scale over time.
• Establishbaselinedata– It is important to gather data now to understand how likely vehicle owners are to fix leaks once they have been identified and how long they will wait to have their leaks fixed. If this data can be collected over time, trends can be identified, and the program can use adaptive management to meet any new challenges. Data collected in regional stormwater surveys are a good start, but should be collected consistently overtime.
Campaign Promotion
Campaign promotion in Phase II was accomplished via a regional advertising campaign and promotion by program partners. Online advertising connected potential participants to the campaign’s improved website (fixcarleaks.org). Advertising and the website were developed to address vehicle owner barriers and benefits to repairing leaks. An online toolkit (piercecountywa.org/dontdripanddrive) was created to provide campaign promotion resources to partner organizations. The toolkit included campaign logos, handouts, newsletter and social media content, press releases, utility bill inserts and more. The partner promotions toolkit is in Appendix 3.

Lessons Learned and Recommendations 35
Lessons Learned • Websiteredesigntoaddressvehicleownerneedswassuccessful- Website
improvements in Phase II provided a significant value to users, as evidenced by users spending three to ten minutes on the website, which is higher than the norm.
• Usingascrollingpagehasplusesandminuses- An understanding of which elements had most value was not available due to the scrolling design of the website with most of the information on one page. The scrolling design works best on mobile devices, and we found that 80% of the usage of the site came from mobile devices.
• Onlineadvertisingwascosteffectiveandprovidedvaluableinformation- Online advertising helped us clarify and strengthen our messaging. We learned the most successful messages varied depending on the audience. Ads related to environmental ethic were most popular with people already searching for information related to vehicle leaks and maintenance and people from Seattle. Ads related to not missing out on summer vacation due to vehicle break-downs were also popular with people searching for information related to vehicle leaks and maintenance. The animated ad with the campaign logo and repair discount offer was most popular with a general audience. Facebook ad click-through-rate was low and Facebook ads did not use the same concepts as more successful online advertising purchased through other channels.
• Socialmediaisappealingforthissortofcampaign– Facebook page followers significantly increased during the campaign. Those followers will likely continue to receive campaign messaging over time.
• Onlineadvertisingismosteffectiveforconnectingpeoplewhoareactivelysearchingforspecificinformation- Online advertising can connect people directly to campaign resources available on the campaign website, whereas other advertising methods require consumers to do more work to seek out the campaign. As evidenced by the popularity of advertising on Google Display ads, this is especially useful for those vehicle owners already seeking out information about vehicle repairs. For those less actively interested in vehicle repairs or associated topics, online advertising may not be as effective as other methods.
• Advertisingiscritical- Advertising is key to driving visits to the campaign’s website. The day after advertising ended in Phase II, website traffic decreased by 74 percent and steadily declined thereafter.
• Messagingtiedtobarriersandmotivatorsworkedwell- Messaging used in Phase II was extremely successful, in part because it was developed based on vehicle owner identified barriers and motivations to repair leaks.
• Onlinetoolkitwasalowcostwaytoprovidesupportforpartners-Providing an online toolkit for partner promotions resulted in significant value added to the campaign at no additional cost.
Left photo: Summer vacation ad
Right photo: Hiker ad

Lessons Learned and Recommendations36
Recommendations• Increaseadvertising-Increased investment in campaign advertising is needed to build
region-wide program awareness. Investment in regional advertising will bolster behavior change efforts and improve overall program outcomes.
• Diversifyadvertising-Future advertising strategies should include a diverse range of advertising mediums designed to reach vehicle owners in as many places as possible.
• Advertisingshouldaddressbarriersandmotivators- Future advertising should incorporate and expand upon successful messaging used in Phase II with a focus on advertising that addresses vehicle owners’ barriers to and motivations for fixing their leaks.
• Improvewebsitetoobtainbetteranalytics- When funds for website improvement become available, the website design should be revised to incorporate multiple pages to allow assessment of the value of each of the topics presented. Results from that testing should be used to expand upon those topics shown to be most useful to website users.
• Addmoretopicsandtoolstothewebsite- The website should incorporate social media interaction elements, such as allowing customers to share their testimonial about the campaign of photos of leaks. The website should also incorporate a “how you can help” page with specific information about how to test vehicles for leaks and get involved in other elements of the campaign. The website should add data trackers that let people see the estimated number of leaks and campaign results related to how many leaks have been identified and repaired. The Ecology website for workshops should be integrated into the campaign website to ensure the two are easily identified as part of the same campaign.
• Capitalizeonaudienceinterestswhenselectingonlineadvertisingmodes- The campaign should continue to invest in online advertising targeting people already looking for information about auto leaks, such as the Google Display Network.
• Expandtoolkits- The campaign should continue to build upon the partner promotions toolkit and develop tools for campaign promotions by repair shops interested in doing additional promotions. The campaign should also actively engage with partners to encourage them to participate in promotional activities.
• Usesocialmedia– The campaign should continue its presence on social media outlets and purchase advertising, which can be very cost effective and increase followers receiving campaign messages over time. Advertising purchase on social media should always use tested messaging and themes to be more successful and cost-efficient.
Leak Check Events
Phase II included 34 leak check events implemented by seven partner organizations in Thurston, Pierce, King, Snohomish and Whatcom counties. 3,819 vehicles were tested at events and 271 leaks were identified. Leak check events were used to build overall campaign awareness among vehicle owners, measure vehicle owner likelihood of fixing leaks once a leak has been identified and test strategies that may influence leak repair: informational packet, window cling and third party mechanic consultation.
Left Photo: Volunteer leak testing team at
Boeing leak testing event (Credit
Stef Frenzl)
Right photo: Signage leading to Kirkland
parking garage leak testing event (Credit
Tiffany O’Dell)
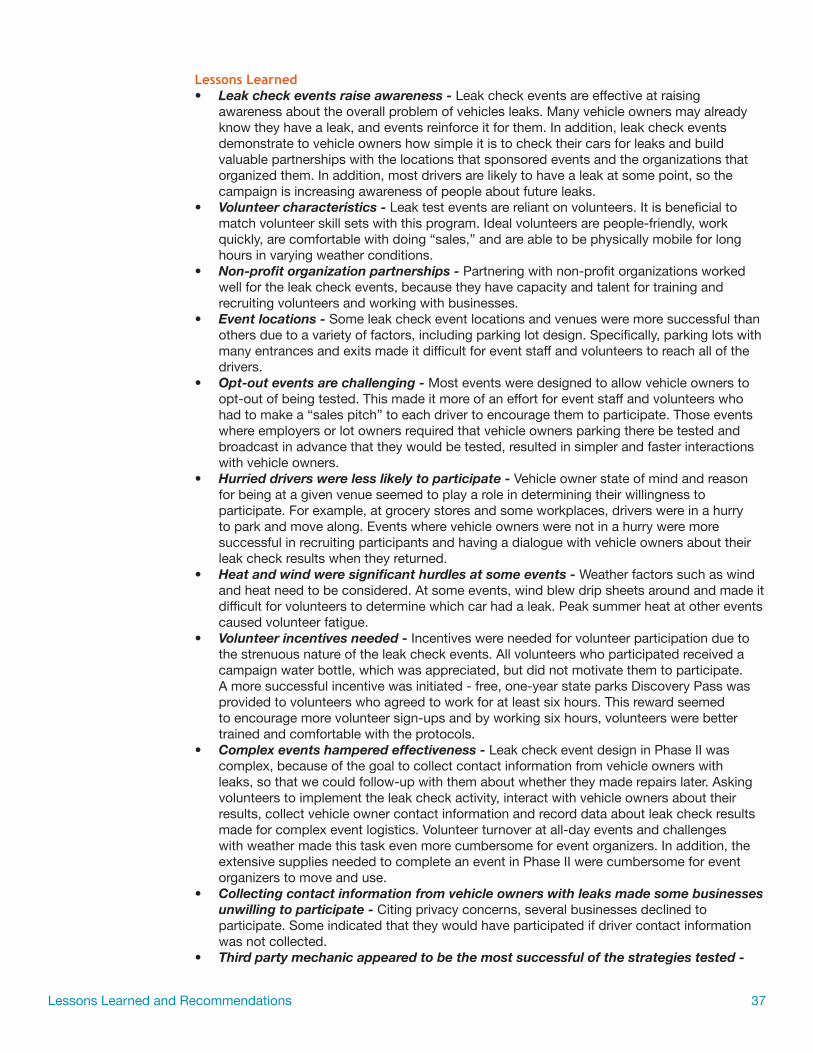
Lessons Learned and Recommendations 37
Lessons Learned • Leakcheckeventsraiseawareness-Leak check events are effective at raising
awareness about the overall problem of vehicles leaks. Many vehicle owners may already know they have a leak, and events reinforce it for them. In addition, leak check events demonstrate to vehicle owners how simple it is to check their cars for leaks and build valuable partnerships with the locations that sponsored events and the organizations that organized them. In addition, most drivers are likely to have a leak at some point, so the campaign is increasing awareness of people about future leaks.
• Volunteercharacteristics-Leak test events are reliant on volunteers. It is beneficial to match volunteer skill sets with this program. Ideal volunteers are people-friendly, work quickly, are comfortable with doing “sales,” and are able to be physically mobile for long hours in varying weather conditions.
• Non-profitorganizationpartnerships-Partnering with non-profit organizations worked well for the leak check events, because they have capacity and talent for training and recruiting volunteers and working with businesses.
• Eventlocations-Some leak check event locations and venues were more successful than others due to a variety of factors, including parking lot design. Specifically, parking lots with many entrances and exits made it difficult for event staff and volunteers to reach all of the drivers.
• Opt-outeventsarechallenging-Most events were designed to allow vehicle owners to opt-out of being tested. This made it more of an effort for event staff and volunteers who had to make a “sales pitch” to each driver to encourage them to participate. Those events where employers or lot owners required that vehicle owners parking there be tested and broadcast in advance that they would be tested, resulted in simpler and faster interactions with vehicle owners.
• Hurrieddriverswerelesslikelytoparticipate-Vehicle owner state of mind and reason for being at a given venue seemed to play a role in determining their willingness to participate. For example, at grocery stores and some workplaces, drivers were in a hurry to park and move along. Events where vehicle owners were not in a hurry were more successful in recruiting participants and having a dialogue with vehicle owners about their leak check results when they returned.
• Heatandwindweresignificanthurdlesatsomeevents-Weather factors such as wind and heat need to be considered. At some events, wind blew drip sheets around and made it difficult for volunteers to determine which car had a leak. Peak summer heat at other events caused volunteer fatigue.
• Volunteerincentivesneeded-Incentives were needed for volunteer participation due to the strenuous nature of the leak check events. All volunteers who participated received a campaign water bottle, which was appreciated, but did not motivate them to participate. A more successful incentive was initiated - free, one-year state parks Discovery Pass was provided to volunteers who agreed to work for at least six hours. This reward seemed to encourage more volunteer sign-ups and by working six hours, volunteers were better trained and comfortable with the protocols.
• Complexeventshamperedeffectiveness-Leak check event design in Phase II was complex, because of the goal to collect contact information from vehicle owners with leaks, so that we could follow-up with them about whether they made repairs later. Asking volunteers to implement the leak check activity, interact with vehicle owners about their results, collect vehicle owner contact information and record data about leak check results made for complex event logistics. Volunteer turnover at all-day events and challenges with weather made this task even more cumbersome for event organizers. In addition, the extensive supplies needed to complete an event in Phase II were cumbersome for event organizers to move and use.
• Collectingcontactinformationfromvehicleownerswithleaksmadesomebusinessesunwillingtoparticipate-Citing privacy concerns, several businesses declined to participate. Some indicated that they would have participated if driver contact information was not collected.
• Thirdpartymechanicappearedtobethemostsuccessfulofthestrategiestested-

Lessons Learned and Recommendations38
People reacted favorably to the third party mechanic providing information about their leak and probable cost of repair. The number of leaks identified at each event, however, made this option expensive relative to the number of drivers who received this strategy. The third-party mechanic adopted the program’s goals and served as an excellent messenger working with vehicle owners.
• Windowclingswerelesssuccessfulwhenimplementedatevents-Anecdotal feedback from event organizers told us that window clings were likely less effective, because volunteers were unable to place window clings on the vehicle windshield, as is done with oil change reminder window clings.
• Peoplereactedpositivelytothevehicleleakinformationpacket-People were interested and in some cases asked for additional copies of leak information packets.
Recommendations• Useleakdetectiontoraiseawarenessatalocalscale-Future implementation of leak
check events should focus on increasing awareness about the campaign, the problem with leaks and how easy it is to check for leaks. Non-profits and others interested in organizing events should be provided funding to support their efforts, because they are great campaign messengers who are able to significantly increase campaign reach at a relatively low cost.
• Thirdpartymechanicstrategyshouldbeexpanded–The campaign should use third party mechanic services whenever possible, especially in situations in which many drivers can interact with the third party mechanic. For example, if a special station is set up at a rest area along a highway, a ferry terminal or a large public parking lot, drivers could choose to interact with the third party mechanic to gain an objective opinion about their leak and potential cost to fix it.
• Simplifyevents-Future implementation of leak check events should include volunteers checking for leaks and placing leak results on vehicle windshield and continue using information packet to get greater participation by diverse audience and make participation less intimidating for drivers and volunteers.
• Createasimpleleakchecksupplykit-The campaign should develop a simple leak check supply kit that can be checked-out by organizations who want to implement their own leak check events. This toolkit could be marketed to schools, non-profit organizations, municipalities and businesses.
• Provideincentivesforvolunteers-Volunteers need to be motivated for this kind of rigorous event. State Parks Discovery Passes were a great motivator to attract volunteers and for volunteers to become better trained to implement events. These incentives could be used by organizations who work with volunteers on future leak check events and other volunteer-supported activities.
Participating Repair Shops
In Phase II, Don’t Drip and Drive partnered with 102 repair shops around the Puget Sound region along with the Automotive Services Association (ASA), AAA and EnviroStars. Participating repair shops provided vehicle owners with a free visual leak inspection and up to $50 off of repairs. Of the participating repair shops, 28 returned reports about their activities. Those reports documented inspection of 4,489 vehicles, identification of 1,303 leaking vehicles and repair of 692 vehicles.
Lessons Learned • Repairshopslikeparticipating-Repair shops were motivated to participate in the
campaign primarily because it was a good cause and most reported willingness to continue participating in future phases.
• Trackingrepairshopactivities–Collecting program tracking sheets from repair shops was a challenge and those reports that were turned in were not filled out consistently. Repair shops are not using consistent methods to track their customer transactions, so tracking across the program without a better incentive for repair shops is difficult.
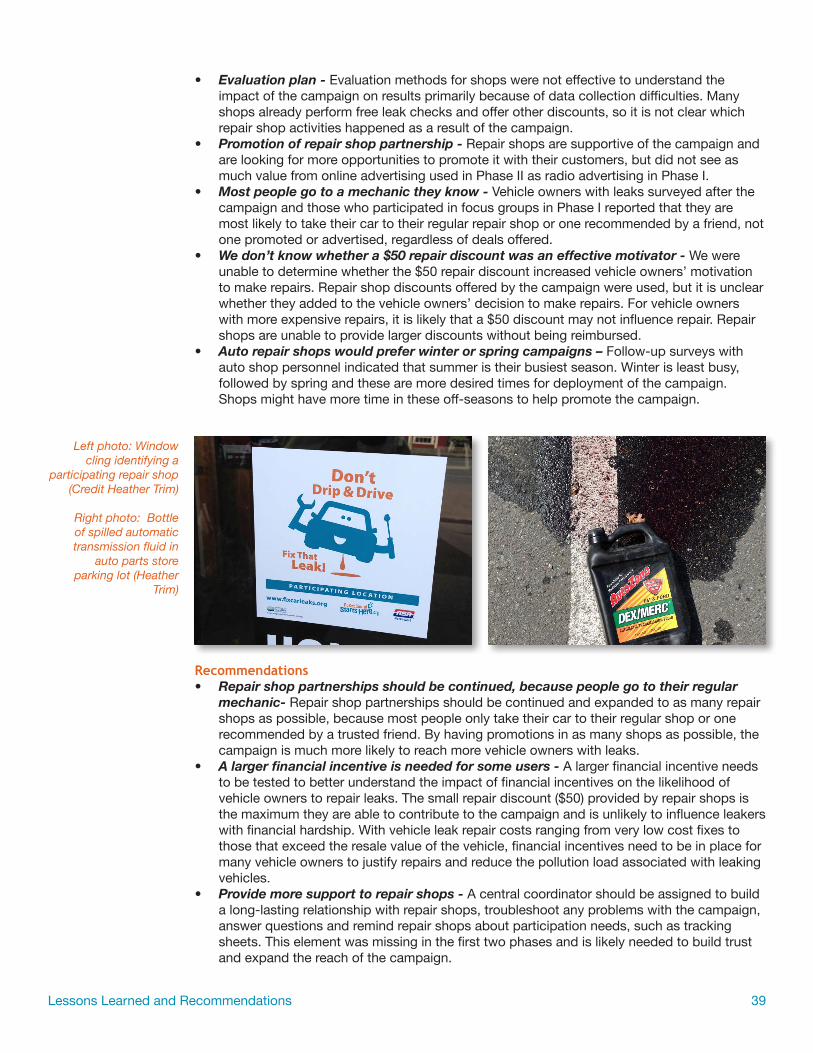
Lessons Learned and Recommendations 39
• Evaluationplan-Evaluation methods for shops were not effective to understand the impact of the campaign on results primarily because of data collection difficulties. Many shops already perform free leak checks and offer other discounts, so it is not clear which repair shop activities happened as a result of the campaign.
• Promotionofrepairshoppartnership-Repair shops are supportive of the campaign and are looking for more opportunities to promote it with their customers, but did not see as much value from online advertising used in Phase II as radio advertising in Phase I.
• Mostpeoplegotoamechanictheyknow-Vehicle owners with leaks surveyed after the campaign and those who participated in focus groups in Phase I reported that they are most likely to take their car to their regular repair shop or one recommended by a friend, not one promoted or advertised, regardless of deals offered.
• Wedon’tknowwhethera$50repairdiscountwasaneffectivemotivator-We were unable to determine whether the $50 repair discount increased vehicle owners’ motivation to make repairs. Repair shop discounts offered by the campaign were used, but it is unclear whether they added to the vehicle owners’ decision to make repairs. For vehicle owners with more expensive repairs, it is likely that a $50 discount may not influence repair. Repair shops are unable to provide larger discounts without being reimbursed.
• Autorepairshopswouldpreferwinterorspringcampaigns–Follow-up surveys with auto shop personnel indicated that summer is their busiest season. Winter is least busy, followed by spring and these are more desired times for deployment of the campaign. Shops might have more time in these off-seasons to help promote the campaign.
Recommendations• Repairshoppartnershipsshouldbecontinued,becausepeoplegototheirregular
mechanic-Repair shop partnerships should be continued and expanded to as many repair shops as possible, because most people only take their car to their regular shop or one recommended by a trusted friend. By having promotions in as many shops as possible, the campaign is much more likely to reach more vehicle owners with leaks.
• Alargerfinancialincentiveisneededforsomeusers- A larger financial incentive needs to be tested to better understand the impact of financial incentives on the likelihood of vehicle owners to repair leaks. The small repair discount ($50) provided by repair shops is the maximum they are able to contribute to the campaign and is unlikely to influence leakers with financial hardship. With vehicle leak repair costs ranging from very low cost fixes to those that exceed the resale value of the vehicle, financial incentives need to be in place for many vehicle owners to justify repairs and reduce the pollution load associated with leaking vehicles.
• Providemoresupporttorepairshops- A central coordinator should be assigned to build a long-lasting relationship with repair shops, troubleshoot any problems with the campaign, answer questions and remind repair shops about participation needs, such as tracking sheets. This element was missing in the first two phases and is likely needed to build trust and expand the reach of the campaign.
Left photo: Window cling identifying a
participating repair shop (Credit Heather Trim)
Right photo: Bottle of spilled automatic transmission fluid in
auto parts store parking lot (Heather
Trim)

Lessons Learned and Recommendations40
• Changethepromotiondateofthecampaign-The campaign should be moved to a less busy season for repair shops to increase perceived value to repair shops and participation. Recommended seasons for the campaign are winter, spring or fall.
• Designaneffectiveevaluationplan– Establish specific data needs for the repair shop partnership and a plan to collect data from repair shops that has value for the campaign, and ensure consistency of data collection. Possible data needs for future phases of the campaign include baseline information about the likelihood of vehicle repair by customers with leaks without the campaign and then data about customer repair of leaks during the campaign to understand whether the campaign influences repairs and how incentives can be used at the point-of-sale to influence completion of repairs.
• Customizedmaterials– The campaign should work with repair shops to develop leak testing reminders and campaign promotional materials that they can customize for their shop to build campaign pride and ownership in individual shops.
• Windowclingsshouldbeprovidedtocustomersbyrepairshops- Reminding vehicle owners that they need to have their leak repaired may be helpful for vehicle owners. Window clings were not successful at leak check events, but they could be provided to repair shop partners for use in future phases of the program.
Workshops
Leak repair workshops were implemented through a separate program which provided 95 workshops to 1,120 participants in the Seattle area over 13 months. Workshops were four hours in length and taught by auto repair instructors at local community and technical colleges. Workshops focused on auto maintenance and repair and featured time for the instructor to give a short evaluation of each of the participants’ vehicles. The evaluation report for workshops is in Appendix 1.
Lessons Learned• Workshopswereeffectiveinmotivatingvehiclerepairs–This program was effective at
enhancing car maintenance behaviors as evidenced by follow-up survey responses showing 76% of respondents had repaired at least some of the problems identified at the workshop and almost all respondents demonstrated higher confidence in their vehicle maintenance activities.
• Mechanicinstructorswerevaluedandsawvalueintheprogram–Feedback from workshop attendees demonstrated the value of the time spent with the instructors, and in some cases, they requested additional time be allotted with instructors. Instructors felt that their experience was positive and were interested in continued partnership.
• Evaluationsurveymayhavebeentoolateforsomeparticipants–There was lower follow-up survey participation from workshop participants who had attended the earliest workshops.
Left photo: Mechanic instructor talks to
workshop participants about vehicle
maintenance (Credit Heather Trim)
Right photo: Mechanic instructor demonstrates how to use a drip sheet
to a class of participants (Credit Heather Trim)

Lessons Learned and Recommendations 41
Recommendations• Expandtheprogram-With long-term funding, expanding the program to additional
locations, varying times of day and days of the week would increase access for more people. Having follow-up classes on special topics or special audiences could further engage a more diverse audience. Stronger advertising (presenting a clearer picture of what to expect) is also needed.
• Datacollection- Tracking a few key characteristics of each car inspected would provide clearer details on what kinds of vehicles that have leaks and associated problems with each type.
• Conductfollow-upevaluationsooner-Following up with workshop participants three months after their workshop could provide a stronger representation of all participants’ experiences, as well as more accurate tracking of repair behavior. The follow-up could also be an opportunity to provide additional incentives, such as a rebate for those who were unable to complete repairs due to cost. Putting an expiration date on the rebate could motivate those with less time to prioritize the repairs more effectively.

42
Next Steps
To develop a model program, Don’t Drip and Drive needs to continue to work toward understanding how strategies that address vehicle owner barriers and motivators can influence leak repair. The recommended next steps for the program include:
• Continueandexpandsuccessfulelements- Continue funding to expand and improve upon those elements of the campaign that have been most successful and build on the momentum of the campaign with partners, including: workshops, advertising, website, repair shop partnerships and leak check events.
• Testfinancialincentives- Identify a funding source that will allow testing of a financial incentive program, such as higher discounts as well as rebates or cost-shares to better understand the impact of cost on vehicle owner decisions to make repairs.
• Continuetogatherdata- Continue research to establish baseline data about vehicle owner behaviors, especially the likelihood of repairs once a vehicle is at a repair shop and research that will continue to help segment the target audience to identify strategies that will influence different groups of vehicle owners with leaks.
• Trynewthings- Pilot new strategies that may have success based on what we’ve learned so far, including standalone third party mechanic consultations, quick-lube shop partnership, special events advertised for those who suspect they might have a leak, and drip catching device installation for those who delay repairs.
• Identifylong-termfunding- Continue development of a long-term funding plan that will identify appropriate long-term funding and a location to house this program over the long-term, so that the program can be right-sized to the region or state to influence social norms resulting in improved water quality. Initial research into model programs and long-term funding plan recommendations are included in Appendix 8.

43
Conclusion
The long-term goal of the Don’t Drip and Drive program is to develop a model behavior change program that can be implemented on a broader scale to address a significant regional pollutant. Program effectiveness will be maximized with ongoing and continuous implementation and a focus on reinforcing correct actions, improving our understanding of why vehicle owners do and do not fix leaks, refining approaches to barriers and increasing the campaign’s ability to motivate owners to fix leaks. This strategy will enable us to develop a model that could yield significant and meaningful improvements to water quality over time.
Using social marketing strategies also brings other considerations. Fully developed programs require long term commitment (often a ten or more year period) to see large scale changes in social norms. Behavior change will require both regional and local coordination to reach residents. Similar to recycling and clean air campaigns, changing the tide on leaking vehicles will need a backdrop of regional messaging, local coordination and consistent financial investment over time. Regional or statewide approaches to this program are likely to be the most effective way to deliver a consistent and successful program, because the pollution source is widespread and highly mobile. Vehicles move throughout the region, as do the waterways that carry their pollution, thus a program is unlikely to be as successful if it is implemented only on a local scale. In addition, local engagement by community-based, non-profit organizations and municipalities have been an important element of the model program, as residents are more likely to adopt new social norms when messages come from both regional and locally-trusted messengers, and when residents understand that the issue is locally-relevant.
Based on the diffusion model presented in Figure 2, it is likely that the Don’t Drip and Drive program has begun to reach the early majority of adopters in the Puget Sound region - those already most likely to repair their leaks, or those with fewer barriers to repair, such as higher income or low-cost repairs. The model for vehicle leaks will likely be complex, because of the varying reasons people do or do not choose to make repairs and the broad spectrum of leak types and repair costs. Based on data collected in this phase, the current program model with a low financial incentive is likely most successful with those vehicle owners with a low cost leak repair or those that can more easily afford to fix their leak. These people will make the repair without a program or only need a small nudge. The diffusion curve in Figure 12 is a hypothesis of that for vehicle leaks.
Data collected in the first two phases of the campaign indicate the number of leaking vehicles on the road at one time is approximately ten percent. The Puget Sound region has 4.5 million registered vehicles, which means about 450,000 leaking vehicles have leaks. Judging by these numbers, continued investment in the Don’t Drip & Drive campaign will be needed to effect a meaningful improvement to water quality.

Conclusion44
To date, the program team has not been able to identify a funding source that allows testing of financial incentives to repair vehicle leaks. Survey data suggest that for some leak repairs, a financial incentive of at least $200 may be necessary to influence owners to repair leaks. The campaign has shown some impact on less-expensive repairs and with early adopters, but is unlikely to be able to influence wide-spread repair of higher cost leaks without financial incentives. Identifying future funding sources for financial incentives will be key to better understanding their impact on behavior change.
Addressing the impact of vehicle leaks on the environment requires a strong behavior change campaign as well as consideration of other factors. By looking at system-wide approaches to solving the problem, significant reduction in this major pollution source may be possible. Other factors related to vehicle leaks include:
• Stormwaterretrofits– Reducing the impact of leaks on waterways by retrofitting the built environment in areas with high vehicle traffic with drainage systems that direct stormwater runoff to waterways without treatment.
• Regulation-Reducing the total number of leaking vehicles through regulatory changes addressing condition of vehicles when they are bought, sold and driven throughout the region, similar to the steps that have been taken to reduce vehicle emissions pollution.
• Vehicledesign–Reducing leaks or impacts of leaks by encouraging automotive manufacturers to search for solutions by designing vehicles differently, or developing vehicle fluids that have less environmental impact.
• Short-termprevention– Reducing impacts of leaks by using technologies or tools to contain leaks and limit damage until vehicles can be repaired.
Vehicle leaks are a multifaceted issue causing significant pollution in the Puget Sound watershed. This complexity is magnified by the mobile nature of the pollution source. A strong Don’t Drip and Drive campaign that supports behavioral change and a shift in regional norm to heighten the value of car care and the environment creates the foundation for addressing a problem of this complexity.
Figure 12. A model diffusion curve related
to vehicle leaks, modeled after the
Diffusion of Innovation Model referenced in
Figure 1Show me (15%)
Awareness, recognition
and education approaches are most effective.
67,500 people
Help me (70%)
Social marketing and incentives strategies are most effective.
315,000 people
Make me (15%)
Regulations, disincentives and enforcement are most effective.
67,500 people
Don’tDripandDrivePhaseIIreachedmorethan28,000people

45
Please use the following citation when referencing this document:
Stormwater Outreach for Regional Municipalities (STORM) and King County Education, Communication and Outreach Network. 2015. Don’t Drip and Drive: A Social Marketing Program to Address Vehicle Leaks Phase II Report. Prepared By The Don’t Drip and Drive Steering Committee. Available at piercecountywa.org/dontdripanddrive
Reference list:
Chaffey, Dave. “Marketing Models That Have Stood the Test of Time - Smart Insights Digital Marketing Advice.” Smart Insights. 19 Sept. 2013. Web. 27 Apr. 2015.
Cities of Bellevue, Bothell, Kenmore, Kirkland, Redmond and Shoreline. “Stormwater Runoff: Awareness, Attitudes and Behavior.” By Elway Research, Inc., 2012. Print.
Colton, J., Jack, R., Lester, D. and Norton, D. “Control of Toxic Chemicals in Puget Sound: Assessment of Selected Toxic Chemicals in the Puget Sound Basin, 2007-2011.” Washington State Department of Ecology, Publication No. 11-03-055. 2011. Print.
Double Click by Google. “2009 Year-in-Review Benchmarks.” Double Click by Google, 2010. Web. 27 Apr. 2015. <http://static.googleusercontent.com/media/www.google.com/en/us/doubleclick/pdfs/DoubleClick-07-2010-DoubleClick-Benchmarks-Report-2009-Year-in-Review-US.pdf>.
Overton, E., Sharp, W., and Roberts, P. “Toxicity of Petroleum,” in Basic Environmental Toxicology, ed. L.G. Cockerham and B.S. Shanes, (CRC Press: Boca Raton, FL, 1994), 133-156 (Overton 1994).
Haile, Tony. “What You Think You Know About the Web Is Wrong.” Time. Time, 9 Mar. 2014. Web. 27 Apr. 2015.
Herrera Environmental Consultants, Inc. “Toxics in Surface Runoff to Puget Sound: Phase 3 Data and Load Estimates.” Washington State Department of Ecology. Publication No. 11-03-010. 2011. Web 27 Apr. 2015. < http://www.ecy.wa.gov/programs/wq/pstoxics/index.html>
EnviroVision Corporation and Herrera Environmental Consultants, Inc. “Control of Toxic Chemicals in Puget Sound—Phase 2: Improved Estimates of Loadings from Surface Runoff and Roadways.” Washington State Department of Ecology, Publication No. 08-10-084. 2008. Web. 27 Apr. 2015 <http://www.ecy.wa.gov/programs/wq/pstoxics/phase2.html>
Kitsap County, Bainbridge Island, Gig Harbor, Port Orchard and Pouslbo. “Residential Stormwater Survey Public Attitudes, Awareness and Behavior .” By Cunningham Environmental Consulting, 2011. Print.
McDermott, A. “What is a good CTR for a Facebook ad?” (Sept. 2014) Quora. Web. 28 Apr. 2015. < http://www.quora.com/What-is-a-good-CTR-for-a-Facebook-ad>
Bibliography
Bibliography 46
McDonald, T. and McDonald, P. 2010. “Guide to Pavement Maintenance.” Universe, Bloomington, Ind
Nielson, Jakob. “How Long Do Users Stay on Webpages?” Nielsen Norman Group, 12 Sept. 2011. Web. 27 Apr. 2015.
“Psychographic.” Wikipedia. Wikimedia Foundation, Web. 27 Apr. 2015.
Puget Sound Partnership. “General Opinion Survey.” By PRR, Inc. and Puget Sound Partnership, 2013. Print.
Puget Sound Partnership. “Sound Behavior Index.” By PRR, Inc. and Puget Sound Partnership, 2013. Print.
“Social Marketing.” Wikipedia. Wikimedia Foundation, Web. 27 Apr. 2015.
Tarnai, John, Ph.D. “Report 11-030: King County Environmental Behavior Index Survey.” Ed. Social & Economic Sciences Research Center, Washington State University and King County Department of Natural Resources and Parks, June 2011. Web. 27 Apr. 2015. <http://your.kingcounty.gov/dnrp/measures/2012/documents/pdf/King-County-Environmental-Survey-07-25-11.pdf>.


