EUR 23305 EN - 2007 DONA detector: further improvements and evaluation for field applications G. Lövestam, A. Fessler, J. Gasparro, M. Hult, P. Kockerols, G. Marissens, K. Okkinga and J.S.E. Wieslander
Transcript
EUR 23305 EN - 2007
DONA detector: further improvements and evaluation for field applications
G. Lövestam, A. Fessler, J. Gasparro, M. Hult, P. Kockerols, G. Marissens, K. Okkinga and J.S.E. Wieslander
With the increasing number of nuclear installations it is essential to ensure that adequate techniques to monitor environmental neutron radiation and doses are available. Issues like environmental and personal safety, safety at work, benchmarking of existing monitoring techniques and unveiling of terrorist threats may be directly linked to whether neutron spectrometry is feasible. Today, practically only two techniques are used for measurement of environmental neutron energy spectra, Bonner sphere spectrometry [BR-60] which is rather accurate but bulky and time consuming to carry out, and bubble detectors [RO-87] which suffers from high uncertainties. Of the two, the Bonner sphere spectrometer is the by far most often used. In this study, an alternative approach – the DONA detector, described in the IRMM exploratory research report [KO-05], is further tested. The technique used here is based on measuring the neutron activity induced in a series of metal disks, with different neutron excitation functions, followed by spectrum unfolding to obtain a complete neutron energy spectrum from the measurement site. A similar technique, usually referred to as the foil activation technique, is widely used to characterize high neutron fluence rates, for example inside nuclear reactors, see for example [NE-05]. The detector discussed here, however, is aimed for the measurement of much lower fluence rates which is facilitated by using thicker disks and low-background gamma-ray detectors for measuring the activation products. For applications there are many situations where a better knowledge of the neutron spectrum would give a better understanding of the origin of the neutrons, scattering effects, possible shielding effects, etc. A few examples are the monitoring of neutron fluence at:
• containers and barrels containing unknown materials, for example in harbours and customs control stations,
• neutron and nuclear physics laboratories,
• nuclear accelerators,
• neutron reactors,
• fusion research installations,
• medical installations for treatments using neutrons,
• flights and satellites,
• accidents involving nuclear materials.
2. DONA detector, principle of operation
As the principle of the DONA detector already has been discussed in the previous report [KO-05] only a brief description is given here. The DONA detector system consists of three parts; 1) the neutron sensitive device consisting of a series of metal disks, 2) a gamma-ray measurement station, and 3) the data evaluation station. As the neutron sensitive device does not require any electronics or data acquisition system on the measurement site, this arrangement constitutes a great advantage as no delicate equipment has to be brought out in the field. On the contrary, the precise activation measurements can be done in an established gamma measurement laboratory. A neutron spectrometry field measurement is consequently done in three steps as illustrated in figure 1. In the first step the detector device is positioned at the site of measurement. Either a "static measurement programme" is followed, i.e. detectors are always positioned at locations where possible neutron radiation could occur, for example following an accident event, and the detectors are collected for measurements only when a neutron irradiation is suspected, or a "dynamic measurement programme" is used where the detectors are positioned in a suspected neutron field only at a certain occasion and for a certain pre-defined time. Typical irradiation times are, naturally, dependent on the neutron fluence rate, but for fluence rates of ~100 neutrons/(cm2 s) about 24 h should be foreseen.
2 (28)
The choice of measurement programme is, of course, dependent on the activities at the measurement sites and the character of the expected neutron fields, but a dynamic measurement programme is generally easier to evaluate as the time information for the irradiation and possible fluence rate variations is normally better known. In the second step, the detector device is transported to the gamma measurement laboratory where the neutron induced activity of every disk and isotope is measured. The transportation is critical as it should be done within one or two half life periods of the isotope with the shortest half life. In the third step, the data from the gamma measurements is evaluated using a few channel spectrum unfolding technique to obtain the measured neutron energy spectrum.
Figure 1. Schematic representation of a neutron fluence spectrum measurement sequence using the DONA detector.
Discs of various pure metals sitting
on the holder
Discs of various pure metals sitting
on the holder
Low-background HPGe-detector
Ge-crystal
Low-background lead shield
Metal disc that is being measured
Conventional Electronics and data acquisition system
Radionuclide
Saturation
activity
(mBq)
56Co 50
55Mn 23
60Co 40
64Cu 112
etc. ...
... ...
... ...
The final result: A
neutron energy
intensity spectrum
Input to the unfolding: “Disc
activities”Spectrum unfolding
Step 1, Irradiation at measurement site
Step 2. Gamma measurements in laboratory
Step 3. Spectrum unfolding
3 (28)
3. Materials and Methods
In summery, the following results were obtained from the first DONA exploratory research project [KO-05]:
• From the study of 260 different nuclear reactions, 8 materials were selected as optimal for the detector.
• Five neutron test irradiations were performed in quasi mono-energetic neutron fields of 5, 7, 8, 8.7 and 17 MeV at the IRMM Van de Graaff accelerator laboratory and one irradiation with an AmBe source (broad neutron spectrum) at the Belgian nuclear research centre SCK•CEN in Mol.
• The spectra obtained from the disk activations and the following unfolding showed good agreement with spectra simulated using Monte Carlo and neutron kinematics calculations, and as measured using a Bonner Sphere system.
• Low-level (LGS) and ultra-low level gamma spectrometry (ULGS) of the activated disks facilitated measurements of very low neutron fluences with detection limits for fast neutrons in the order of 10 neutrons/(s�cm2) (ULGS) and 250 neutrons/(s�cm2) (LGS), respectively.
These results were used for this study to further:
• fine tune and improve the technique, also for neutrons below 500 keV, and
• evaluate and test its performance in real field applications.
3.1 Improving the technique
For the fine tuning of the DONA detector performance the following improvements have been made:
• Au has been included and evaluated as monitor for neutrons with energies < 500 keV.
• Several excitation functions have been added to the response function data file.
• The cross section data file has been changed from RNAL (IAEA) to the International reactor dosimetry file, IRDF-2002 (http://www-nds.iaea.or.at/irdf2002/) (IAEA), when data has been available in this file.
• The software routine, WinDONA, for the unfolding of neutron spectra has been considerably improved.
• A library of IAEA environmental neutron spectra are now included as default spectra for unfolding [IA-01].
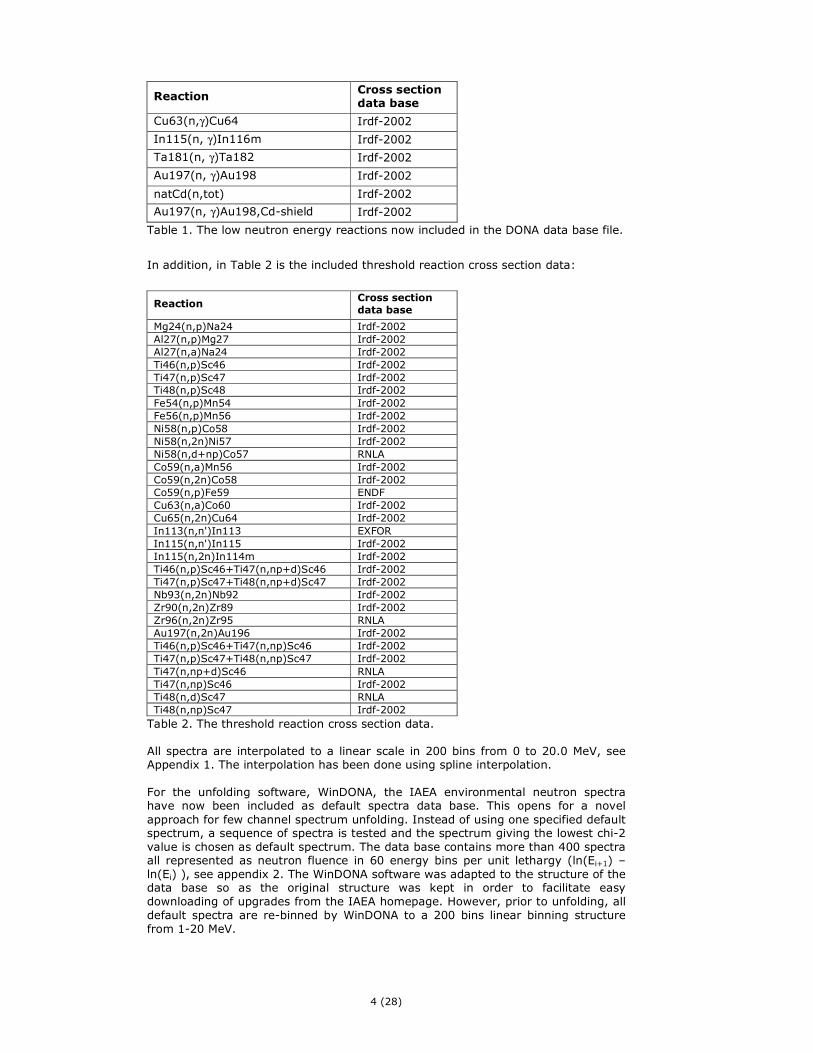
In the first study the 115In(n,γ)116mIn reaction was used to monitor neutrons in the energy region < 500 keV. Since the excitation function contains a resonance area in the low energy region, the cross section data in the lowest energy bin had to be averaged to a mean value. This approximation was believed not being very accurate and alternative reactions in the energy region were tested. Also, a stack of disks (1 mm/disk) arranged as Au-Cd-Au-Cd in the centre of the detector, has been tested so as to make use of the Cd-difference technique. Cd has a rather sharp increasing cross section for neutrons < 1 eV. In total, the low neutron energy reactions in Table 1 are now included in the DONA data base file:
4 (28)
Reaction Cross section data base
Cu63(n,γ)Cu64 Irdf-2002
In115(n, γ)In116m Irdf-2002
Ta181(n, γ)Ta182 Irdf-2002
Au197(n, γ)Au198 Irdf-2002
natCd(n,tot) Irdf-2002
Au197(n, γ)Au198,Cd-shield Irdf-2002
Table 1. The low neutron energy reactions now included in the DONA data base file.
In addition, in Table 2 is the included threshold reaction cross section data:
Table 2. The threshold reaction cross section data. All spectra are interpolated to a linear scale in 200 bins from 0 to 20.0 MeV, see Appendix 1. The interpolation has been done using spline interpolation. For the unfolding software, WinDONA, the IAEA environmental neutron spectra have now been included as default spectra data base. This opens for a novel approach for few channel spectrum unfolding. Instead of using one specified default spectrum, a sequence of spectra is tested and the spectrum giving the lowest chi-2 value is chosen as default spectrum. The data base contains more than 400 spectra all represented as neutron fluence in 60 energy bins per unit lethargy (ln(Ei+1) – ln(Ei) ), see appendix 2. The WinDONA software was adapted to the structure of the data base so as the original structure was kept in order to facilitate easy downloading of upgrades from the IAEA homepage. However, prior to unfolding, all default spectra are re-binned by WinDONA to a 200 bins linear binning structure from 1-20 MeV.
5 (28)
3.2 Test at calibrated neutron source and field application
DONA detectors were tested at two occasions 1) in a calibrated and certified 252Cf neutron field at Physicalish Technische Bundesanstalt, PTB, in Brauncshweig and at the Belgonucleaire MOX fuel manufacturing site in Dessel, Belgium. For the calibration at PTB the DONA detector was positioned at a distance of 500 mm from the central disk of the detector to the centre of the source, in 0 degrees angle. The irradiation time was 86,400 s with a direct fluence field of 7791±99 neutrons/(cm2 s) and an in-scattering field of 633±43 (7.51±0.46 %). MOX is the abbreviation for Mixed Oxide, a fuel for nuclear power plants that consists of a mixture of depleted uranium oxide and plutonium oxide. MOX fuel recovers plutonium produced in all reactors and uses depleted uranium which is a sub-product of the uranium enrichment process. The recovering of plutonium in MOX elements reduces the quantity of plutonium produced in nuclear power plants and economizes uranium ore needs. Belgonucleaire's plant produced till 2006 yearly about 35 to 38 tons of MOX fuel rods. The fuel rods are stored in metal fuel container boxes which in turn are positioned in a concrete bunker. The neutron radiation of the MOX fuel is generated by spontaneous fissions of some plutonium nuclides and by (α, n) reactions with the oxygen nuclei. For this study, one box was taken out of the bunker and two detectors were positioned at the top of the container box; one on top and at the centre of the box and the other on top and the side of the box. The detectors were irradiated for 48 h.
3.3 Activation measurements
The activity induced in the pure metal disks for all detectors was measured using low-level and ultra low-level gamma-ray spectrometry. A low-level gamma spectrometry includes an HPGe-detector made from selected radio pure materials and installed in a specially designed radio pure lead shield. In ultra low-level gamma spectrometry additional measures such as using a muon shield or an underground laboratory are taken. The main principles governing the choice of materials were discussed in the first DONA report, where it was concluded that to obtain low detection limits for fast neutrons it is essential that relatively large amounts of the material is activated. This implies the use of thick foils or disks instead of the thin foils that are commonly used for thermal neutrons. For thicker disks, it is not useful to measure the beta-particles in a beta-gamma spectrometer since only the beta particles from the outer part of the disk will enter the beta-counter. Dissolving disks and measure using liquid scintillation counting or other methods is not an option since DONA requires a method with very simple sample preparation. Gamma-ray spectrometry has the advantages of normally requiring very little sample preparation and the actual measurement is easy to carry out. In case special low-background or ultra low-background gamma detection systems are used, the detection limits can be very low (µBq/kg). In recent years there has been a significant improvement of HPGe-detector performance [HU-05], which in combination with the use of underground laboratories has triggered new fields of gamma spectrometry. Figure 2 shows the background spectrum in the underground laboratory HADES in comparison with a state-of-the-art detector above ground.
6 (28)
0.001
0.01
0.1
1
10
100
1000
0 500 1000 1500 2000 2500
HADES detector 100% coaxial
IRMM above ground coaxial 20%
10-3
10-2
10-1
100
101
103
102
0 500 1000 1500 2000 2500
Norm
alis
ed
co
untr
ate
(keV
-1kg
-1d
-1)
Energy (keV)
0.001
0.01
0.1
1
10
100
1000
0 500 1000 1500 2000 2500
HADES detector 100% coaxial
IRMM above ground coaxial 20%
10-3
10-2
10-1
100
101
103
102
0 500 1000 1500 2000 2500
0.001
0.01
0.1
1
10
100
1000
0 500 1000 1500 2000 2500
HADES detector 100% coaxial
IRMM above ground coaxial 20%
0.001
0.01
0.1
1
10
100
1000
0 500 1000 1500 2000 2500
HADES detector 100% coaxial
IRMM above ground coaxial 20%
10-3
10-2
10-1
100
101
103
102
0 500 1000 1500 2000 2500
Norm
alis
ed
co
untr
ate
(keV
-1kg
-1d
-1)
Energy (keV)
Figure 2. The background spectra for one HPGe-detector located in HADES and another above ground. The count rate is normalised to the mass of the Ge-crystal.
All disks used in this study were already available at IRMM, in the Van de Graaff building and in the radionuclide metrology laboratory. As tritium is a plausible contaminant in the Van de Graaff building disks were checked for possible contamination but no tritium was detected. Also, disks were measured using low-level gamma spectrometry prior to activation. The only activity measured was from small amounts of 60Co (250 mBq/kg) in the copper disks. Hence, it was decided not to use 60Co in copper disks in the DONA data evaluation. Table 3 gives details of the HPGe-detectors used for the measurements. All measurements were carried out either in the underground laboratory HADES or above ground at IRMM.
Detector Relative
efficiency (%)
Crystal mass (kg)
Crystal configuration
Dead layer thickness (mm)
Window material and thickness (mm)
Location
Ge-2 8 0.209 Semi-planar 0.0005 0.7 mm, Al HADES
Ge-3 60 1.337 Coaxial 1 0.7 mm, Al HADES
Ge-4 106 2.195 Coaxial 0.0005 0.5 mm, Al HADES
Ge-5 50 0.803 Planar 0.002 1.0 mm, Al HADES
Ge-6 80 2.106 Coaxial 0.7 1.0 mm, Cu HADES
Ge-7 80 2.106 Coaxial 0.0005 1.5 mm, Al HADES
Ge-8 19 0.385 Coaxial 0.7 1.5 mm, Al HADES
Ge-T2 20 0.423 Coaxial 0.7 1.5 mm, Al IRMM
Table 3. Data for the HPGe-detectors used for the gamma measurements.
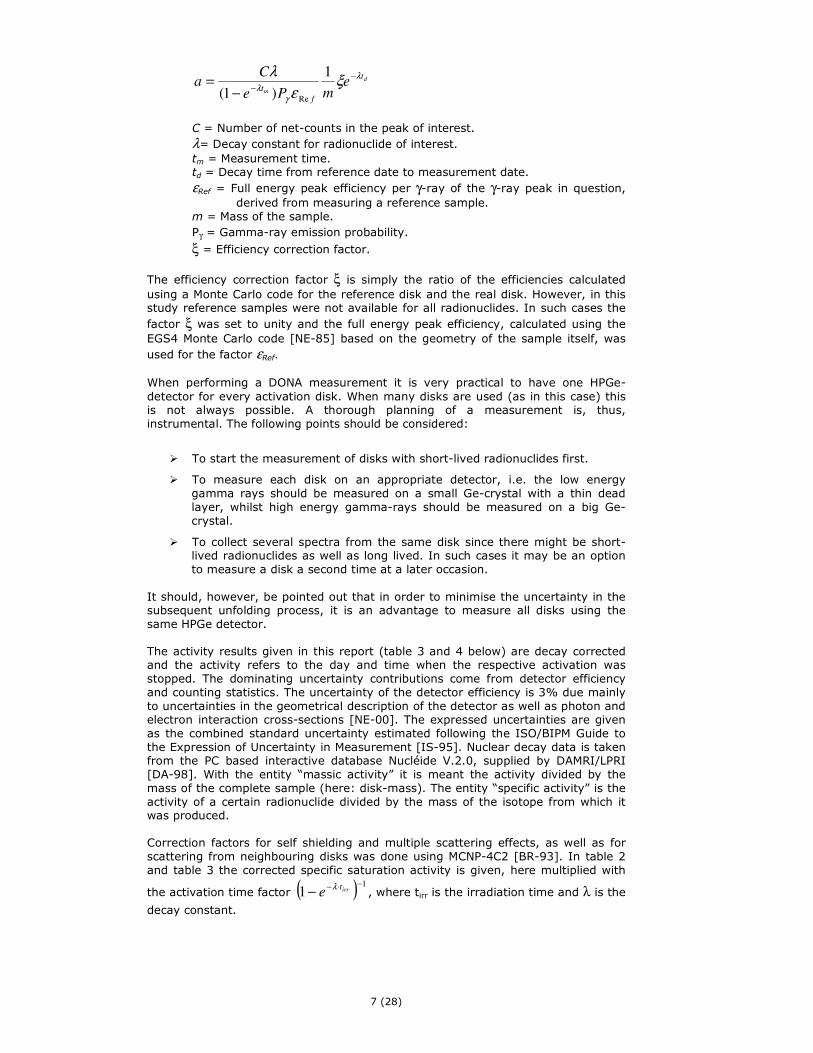
After collecting the detectors at the respective activation site, the disks were placed in Teflon containers. The Teflon containers used for HADES measurement have been specially designed for underground low-level measurements. The containers can be closed with a lid and an O-ring seal. In this study it was not essential to have equilibrium between radon-daughters coming from the sample so in most cases the lid was not used. The Teflon containers were placed directly on the end cap of an HPGe-detector or in some cases on a so called centring ring in order to have the container and the disk centred on the detector. The gamma spectra net peak areas, C, were determined using manual subtraction of the background, calculated from a region of interest around the respective peak. The massic activity, a, was calculated using the formula:
7 (28)
d
m
t
f
te
mPe
Ca
λ
γλ
ξε
λ −
−−=
1
)1( Re
C = Number of net-counts in the peak of interest.
λ= Decay constant for radionuclide of interest.
tm = Measurement time. td = Decay time from reference date to measurement date.
εRef = Full energy peak efficiency per γ-ray of the γ-ray peak in question,
derived from measuring a reference sample. m = Mass of the sample.
Pγ = Gamma-ray emission probability.
ξ = Efficiency correction factor.
The efficiency correction factor ξ is simply the ratio of the efficiencies calculated
using a Monte Carlo code for the reference disk and the real disk. However, in this study reference samples were not available for all radionuclides. In such cases the
factor ξ was set to unity and the full energy peak efficiency, calculated using the
EGS4 Monte Carlo code [NE-85] based on the geometry of the sample itself, was
used for the factor εRef. When performing a DONA measurement it is very practical to have one HPGe-detector for every activation disk. When many disks are used (as in this case) this is not always possible. A thorough planning of a measurement is, thus, instrumental. The following points should be considered:
� To start the measurement of disks with short-lived radionuclides first.
� To measure each disk on an appropriate detector, i.e. the low energy gamma rays should be measured on a small Ge-crystal with a thin dead layer, whilst high energy gamma-rays should be measured on a big Ge-crystal.
� To collect several spectra from the same disk since there might be short-lived radionuclides as well as long lived. In such cases it may be an option to measure a disk a second time at a later occasion.
It should, however, be pointed out that in order to minimise the uncertainty in the subsequent unfolding process, it is an advantage to measure all disks using the same HPGe detector. The activity results given in this report (table 3 and 4 below) are decay corrected and the activity refers to the day and time when the respective activation was stopped. The dominating uncertainty contributions come from detector efficiency and counting statistics. The uncertainty of the detector efficiency is 3% due mainly to uncertainties in the geometrical description of the detector as well as photon and electron interaction cross-sections [NE-00]. The expressed uncertainties are given as the combined standard uncertainty estimated following the ISO/BIPM Guide to the Expression of Uncertainty in Measurement [IS-95]. Nuclear decay data is taken from the PC based interactive database Nucléide V.2.0, supplied by DAMRI/LPRI [DA-98]. With the entity “massic activity” it is meant the activity divided by the mass of the complete sample (here: disk-mass). The entity “specific activity” is the activity of a certain radionuclide divided by the mass of the isotope from which it was produced. Correction factors for self shielding and multiple scattering effects, as well as for scattering from neighbouring disks was done using MCNP-4C2 [BR-93]. In table 2 and table 3 the corrected specific saturation activity is given, here multiplied with
the activation time factor ( ) 11
−⋅−− irrte
λ, where tirr is the irradiation time and λ is the
decay constant.
8 (28)
3.4 Spectrum unfolding
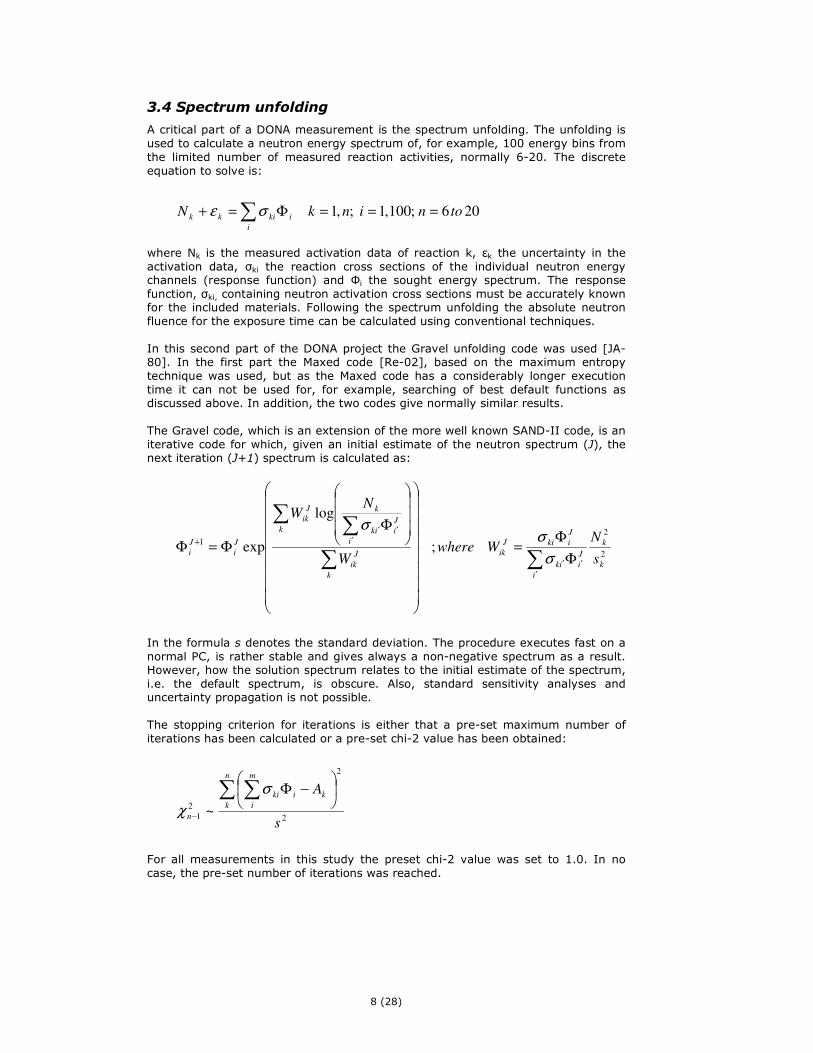
A critical part of a DONA measurement is the spectrum unfolding. The unfolding is used to calculate a neutron energy spectrum of, for example, 100 energy bins from the limited number of measured reaction activities, normally 6-20. The discrete equation to solve is:
where Nk is the measured activation data of reaction k, εk the uncertainty in the activation data, σki the reaction cross sections of the individual neutron energy channels (response function) and Φi the sought energy spectrum. The response function, σki, containing neutron activation cross sections must be accurately known for the included materials. Following the spectrum unfolding the absolute neutron fluence for the exposure time can be calculated using conventional techniques. In this second part of the DONA project the Gravel unfolding code was used [JA-80]. In the first part the Maxed code [Re-02], based on the maximum entropy technique was used, but as the Maxed code has a considerably longer execution time it can not be used for, for example, searching of best default functions as discussed above. In addition, the two codes give normally similar results. The Gravel code, which is an extension of the more well known SAND-II code, is an iterative code for which, given an initial estimate of the neutron spectrum (J), the next iteration (J+1) spectrum is calculated as:
2
21 ;
log
expk
k
i
J
iik
J
ikiJ
ik
k
J
ik
k
i
J
iik
kJ
ik
J
i
J
is
NWwhere
W
NW
∑∑
∑∑
′′′
′′′
+
Φ
Φ=
Φ
Φ=Φσ
σσ
In the formula s denotes the standard deviation. The procedure executes fast on a normal PC, is rather stable and gives always a non-negative spectrum as a result. However, how the solution spectrum relates to the initial estimate of the spectrum, i.e. the default spectrum, is obscure. Also, standard sensitivity analyses and uncertainty propagation is not possible. The stopping criterion for iterations is either that a pre-set maximum number of iterations has been calculated or a pre-set chi-2 value has been obtained:
For all measurements in this study the preset chi-2 value was set to 1.0. In no case, the pre-set number of iterations was reached.
206;100,1;,1 toninkNi
ikikk ===Φ=+ ∑σε
2
2
21 ~
s
An
k
k
m
i
iki
n
∑ ∑
−Φ
−
σ
χ
9 (28)
4. Results and Discussion
Table 4 gives the measured gamma data for the test irradiation at the PTB 252Cf source.
Table 4. Measured gamma data from the irradiation in the PTB 252Cf neutron calibration facility. The specific activity is given in Bq per atom at the end of irradiation. Grayed reactions are not used in the unfolding.
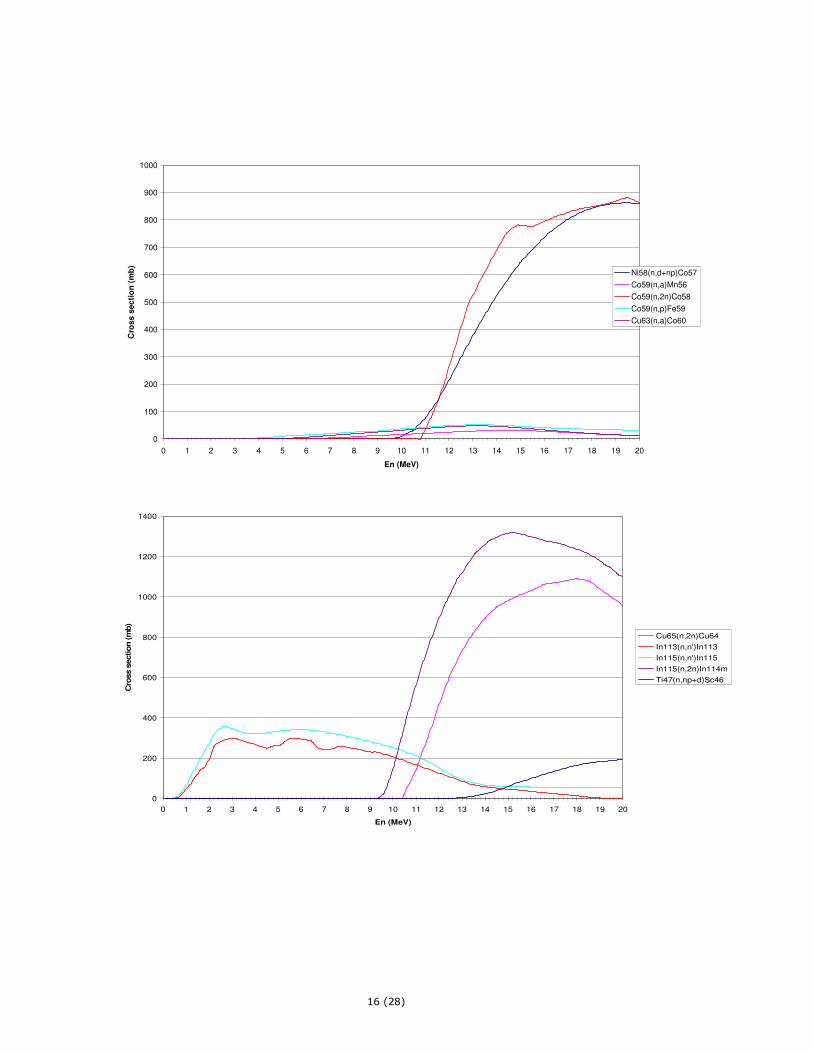
Data from in total 20 reactions were measured. The result from the unfolding when including all data, and using the PTB 252Cf model spectrum as default spectrum, gives a final chi-2 value of 352.0 indicating that some data or cross sections are obscure. The corresponding chi-2 value for the default spectrum is 560.4. The WinDONA function "optimize" tests all data to find those that contribute most to the chi-2 value. When the data indicated with grey text in table 2 are excluded from the input data set, a chi-2 value of 0.943 is obtained, below the pre-set value of 1.0. The corresponding chi-2 value for the default spectrum is 502.4. The reason why some data have to be excluded is not known but a plausible explanation is that the used excitation function data is not correct. Nevertheless, by including 13 reactions a very low chi-2 value is obtained. Figure 3 displays the 13 included excitation functions and figure 4 the unfolded spectrum together with the 252Cf model spectrum from PTB. As can be seen from figure 4, the model spectrum is very well represented by the results from the DONA detector measurement.
10 (28)
0.01
0.10
1.00
10.00
100.00
1000.00
10000.00
0.0 5.0 10.0 15.0 20.0
Neutron energy (MeV)
Cro
ss s
ec
tio
n (
mb
)
Al27(n,a)Na24
In115(n,n')In115
In115(n,g)In116m
In113(n,n')In113
Co59(n,a)Mn56
Co59(n,2n)Co58
Co59(n,p)Fe59
Fe56(n,p)Mn56
Mg24(n,p)Na24
Ti47(n,p)Sc47
Ni58(n,p)Co58
Zr96(n,2n)Zr95
Au197(n,2n)Au196
Figure 3. The excitation functions included in the measurement at the PTB 252Cf source.
0 5 10 15 20
0.0
0.5
1.0
1.5
2.0
2.5
Ne
utr
on
in
ten
sity (
arb
itra
ry u
nit)
Neutron energy (MeV)
PTB mode spectrum
DONA measured spectrum
Figure 4. Unfolded spectrum (red curve) measured with the DONA detector at the PTB 252Cf source. The black spectrum is the PTB model spectrum for a 252Cf source.
11 (28)
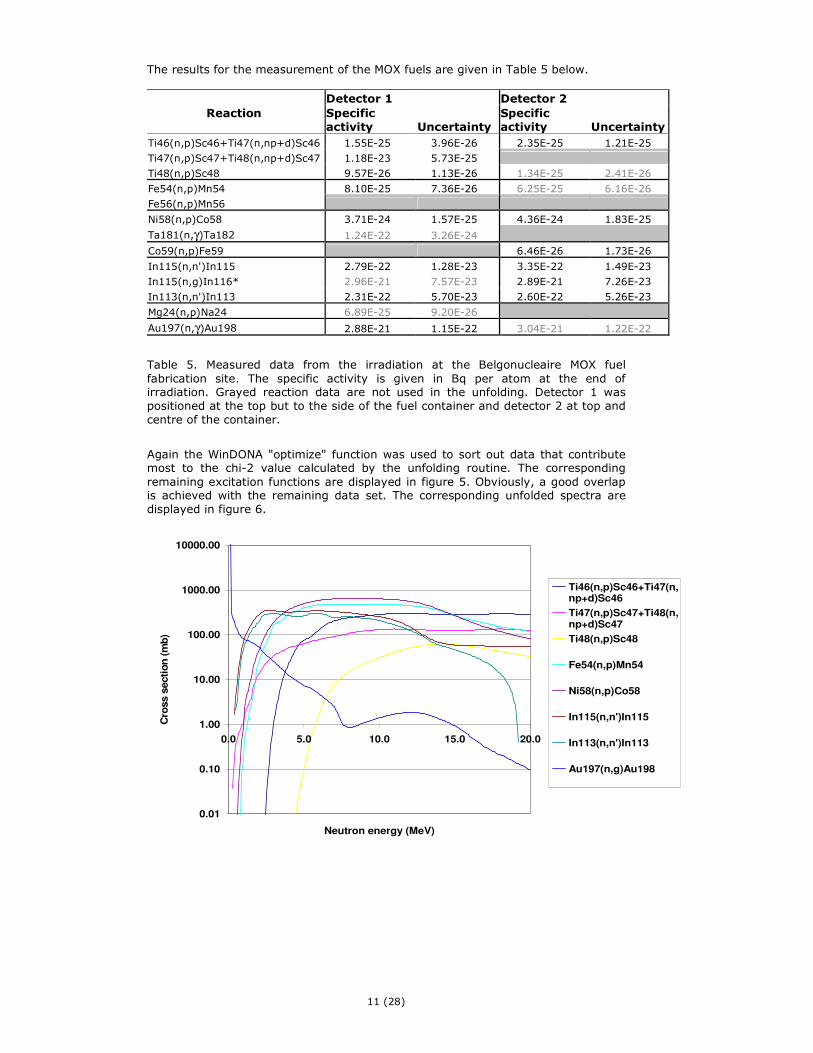
The results for the measurement of the MOX fuels are given in Table 5 below.
Table 5. Measured data from the irradiation at the Belgonucleaire MOX fuel fabrication site. The specific activity is given in Bq per atom at the end of irradiation. Grayed reaction data are not used in the unfolding. Detector 1 was positioned at the top but to the side of the fuel container and detector 2 at top and centre of the container.
Again the WinDONA "optimize" function was used to sort out data that contribute most to the chi-2 value calculated by the unfolding routine. The corresponding remaining excitation functions are displayed in figure 5. Obviously, a good overlap is achieved with the remaining data set. The corresponding unfolded spectra are displayed in figure 6.
0.01
0.10
1.00
10.00
100.00
1000.00
10000.00
0.0 5.0 10.0 15.0 20.0
Neutron energy (MeV)
Cro
ss s
ecti
on
(m
b)
Ti46(n,p)Sc46+Ti47(n,np+d)Sc46
Ti47(n,p)Sc47+Ti48(n,np+d)Sc47
Ti48(n,p)Sc48
Fe54(n,p)Mn54
Ni58(n,p)Co58
In115(n,n')In115
In113(n,n')In113
Au197(n,g)Au198
12 (28)
0.01
0.10
1.00
10.00
100.00
1000.00
10000.00
0.0 5.0 10.0 15.0 20.0
Neutron energy (MeV)
Cro
ss s
ecti
on
(m
b)
Ti46(n,p)Sc46+Ti47(n,np+d)Sc46
Ni58(n,p)Co58
Co59(n,p)Fe59
In115(n,n')In115
In115(n,g)In116m
In113(n,n')In113
Figure 5. The excitation functions included in the DONA measurement of the MOX fuel container position 1 (upper) and position 2 (lower). Figure 6. Unfolded spectra from the measurements at the MOX fuel fabrication site Belgonucleaire (upper) and MOX fuel spectra from the IAEA operational neutron fluence spectra library (lower). Position 1 is at the top of the container but close to the left short side edge while position 2 is at the top of the container in the centre.
0 1 2 3 4 5
Flu
ence
pe
r u
nit lo
g e
ne
rgy (
leth
arg
y)
Neutron energy (MeV)
0 1 2 3 4 5
Flu
en
ce
pe
r u
nit lo
g e
ne
rgy (
leth
arg
y)
Neutron energy (MeV)
0 1 2 3 4 5
bare MOX fuel, at 20 cm
Flu
en
ce
pe
r u
nit lo
g e
ne
rgy (
leth
arg
y)
Neutron energy (MeV)
0 1 2 3 4 5
MOX fuel, at storage place
Flu
en
ce
pe
r u
nit lo
g e
ne
rgy (
leth
arg
y)
Neutron energy (MeV)
MOX pos. 1 MOX pos. 2
13 (28)
Figure 6 shows that the measured spectra correspond well with the MOX fuel spectrum from the storage place but less with the bare MOX fuel spectrum. This is expected as the fuel container is shielded. For the measurement at position 1 (short side of the container) no spectral component is measured above 1.5 MeV while this can be clearly seen for the measurement at the centre of the container (position 2), although less intense than for the IAEA MOX fuel at storage place spectrum. This spectrum has also a considerable low energy component which is, again, believed to be an effect of shielding.
5. Conclusions and future prospects
The measurement in environmental neutron fluence fields presented here show that the DONA detector can be used also in low fluence rate environment. As such, it is a good candidate for being an attractive alternative to the considerably more bulky Bonner sphere spectrometer. Indeed, as an environmental neutron-fluence detector, the detector possesses a number of distinct advantages. The detector • is only sensitive to neutron radiation,
• is small and robust,
• requires no electrical power at the neutron fluence measurement site,
• can be placed at remote locations or locations with difficult access and/or in hazardous environments,
• sensitivity can be increased by using more and bigger disks and by using underground gamma-ray detectors for measuring the activity in the disks,
• is energy sensitive over a large neutron energy interval, and
• is of relative low cost.
A few limitations may, however, also be noted:
• The measurement of the activation products can be time-consuming, especially if low detection limits are sought.
• The necessary time between the end of the activation and the start of the gamma-ray measurements limits the possible disk materials to isotopes with long half-lives relative to the transport time.
• Only constant neutron fields can be accurately measured, no information is obtained about fluence rate-changes in the spectrum during the irradiation time.
The DONA detector system will be further exploited and developed to a commercial prototype. The project was granted 55,000 € following an application for the JRC-TTSC Innovation Project Competition 2007. This project includes the following tasks: 1. Design and realisation of a detector holder industrial prototype.
2. Design and realisation of a dedicated gamma measurement station industrial prototype.
3. Adoption and testing of developed software to a user friendly programme package.
4. Definition of a complete detector concept device for commercialisation.
5. Definition of way of commercialisation and market research.
14 (28)
Acknowledgements
The HADES personnel of SCK•CEN are gratefully acknowledged for their assistance. Maurice Vanuytven assisted at the irradiations at Belgonucleaire. Hamid Tagziria (EC-JRC-IPSC) made the Monte Carlo calculations of neutron transport using the MCNP-4C2 code.
References
[BR-60] R.L. Bramblett, R.I. Ewing and T.W. Bonner, A new type of neutron spectrometer. Nucl. Instr. and Meth. 9, 1-12, 1960. [BR-93] Briesmeister J.F., editor. (1993) MCNP - A General Monte Carlo N-Particle Transport Code, Version 4A. LA-12625, Los Alamos, USA. [DA-98] DAMRI/LPRI (1998) Nuclear Decay Data - Nucléide Version 2.0. B019 Gif-sur-Yvette, France. [HU-05] Hult M, Preusse W. and Gasparro J “Underground Gamma-ray Spectrometry” Submitted for publication to Acta Chimica Slovenica. [IA-01] IAEA – Compendium of Neutron Spectra and Detector Responses for Radiation Protection Purposes, Technical Report Series 403 (2001). [IS-95] ISO (1995) Guide to the Expression of Uncertainty in Measurement. 1st
edition corrected version. ISBN 92-67-10188-9. International Organization for Standardization, Geneva, Switzerland. [JA-80] G. Jacobs and R. van den Bosch, Calibration measurements with the multisphere and neutron spectrum analyses using the SAND-II program, Nucl. Instr. And Meth. 175 (1980) 483-489. [KO-05] P.Kockerols, A.Fessler, J.Gasparro, M.Hult, G.Lövestam, K.Okkinga, Neutron spectrometry and dosimetry using the activation technique (DONA) - a feasibility study, IRMM internal report, RS/51/05, 2005. [NE-85] Nelson, W.R., Hirayama, H., Rogers, D.W.O. (1985) The EGS4 code system. SLAC Report 265. [NE-00] Nelson, W.R (2000) Private communication. [NE-05] C. Negoita, Measurement of Neutron Flux Spectra in a Tungsten Benchmark by Neutron Foil Activation Method, Theses, Shaker Verlag, Aachen Germany, ISBN 3-8322-3519-1, 2004. [RE-02] M. Reginatto, P. Goldhagen, S. Neumann, Spectrum unfolding, sensitivity analysis and propagation of uncertainties with the maximum entropy code MAXED, Nucl. Instr. And Meth. A 476 (2002) 242-246. [RO-87] S.C. Roy, R.E. Apfel, Y.-C. Lo, Superheated drop detector: A potential tool in neutron research. Nucl. Inst. and Meth. A255, 199, 1987.
15 (28)
Appendix 1
Excitation functions included in WinDONA for spectrum unfolding.
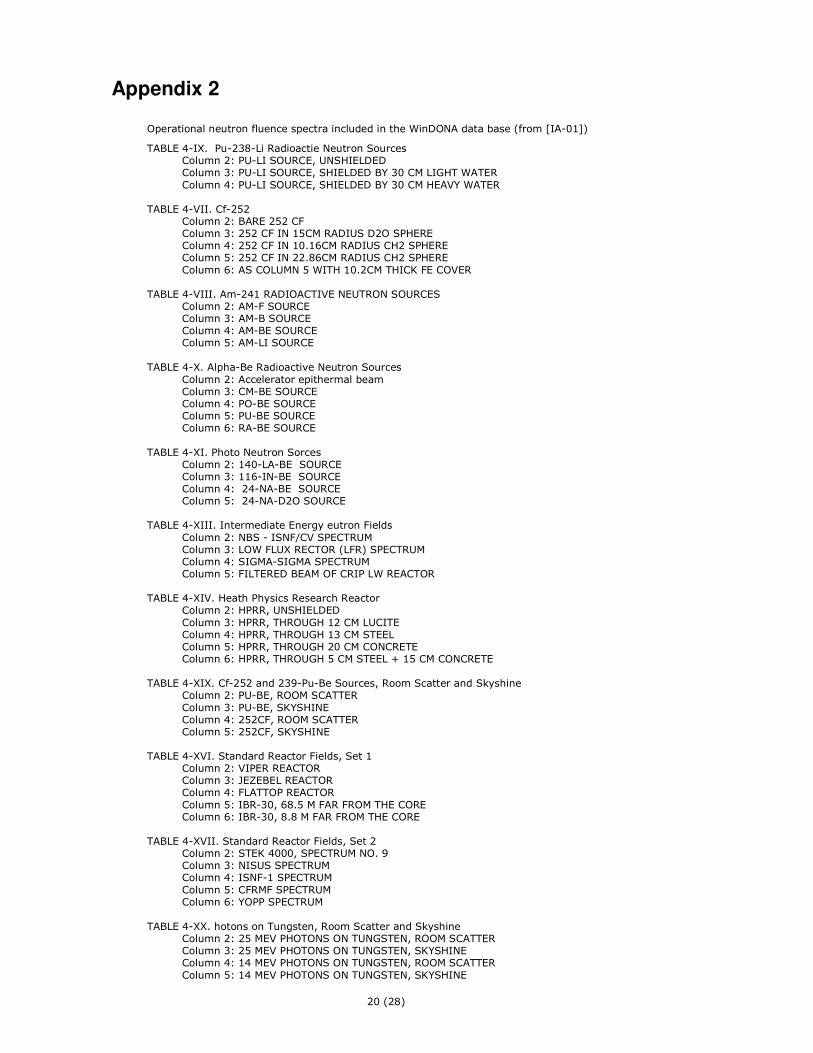
Operational neutron fluence spectra included in the WinDONA data base (from [IA-01])
TABLE 4-IX. Pu-238-Li Radioactie Neutron Sources Column 2: PU-LI SOURCE, UNSHIELDED Column 3: PU-LI SOURCE, SHIELDED BY 30 CM LIGHT WATER Column 4: PU-LI SOURCE, SHIELDED BY 30 CM HEAVY WATER TABLE 4-VII. Cf-252 Column 2: BARE 252 CF Column 3: 252 CF IN 15CM RADIUS D2O SPHERE Column 4: 252 CF IN 10.16CM RADIUS CH2 SPHERE Column 5: 252 CF IN 22.86CM RADIUS CH2 SPHERE Column 6: AS COLUMN 5 WITH 10.2CM THICK FE COVER TABLE 4-VIII. Am-241 RADIOACTIVE NEUTRON SOURCES Column 2: AM-F SOURCE Column 3: AM-B SOURCE Column 4: AM-BE SOURCE Column 5: AM-LI SOURCE TABLE 4-X. Alpha-Be Radioactive Neutron Sources Column 2: Accelerator epithermal beam Column 3: CM-BE SOURCE Column 4: PO-BE SOURCE Column 5: PU-BE SOURCE Column 6: RA-BE SOURCE TABLE 4-XI. Photo Neutron Sorces Column 2: 140-LA-BE SOURCE Column 3: 116-IN-BE SOURCE Column 4: 24-NA-BE SOURCE Column 5: 24-NA-D2O SOURCE TABLE 4-XIII. Intermediate Energy eutron Fields Column 2: NBS - ISNF/CV SPECTRUM Column 3: LOW FLUX RECTOR (LFR) SPECTRUM Column 4: SIGMA-SIGMA SPECTRUM Column 5: FILTERED BEAM OF CRIP LW REACTOR TABLE 4-XIV. Heath Physics Research Reactor Column 2: HPRR, UNSHIELDED Column 3: HPRR, THROUGH 12 CM LUCITE Column 4: HPRR, THROUGH 13 CM STEEL Column 5: HPRR, THROUGH 20 CM CONCRETE Column 6: HPRR, THROUGH 5 CM STEEL + 15 CM CONCRETE TABLE 4-XIX. Cf-252 and 239-Pu-Be Sources, Room Scatter and Skyshine Column 2: PU-BE, ROOM SCATTER Column 3: PU-BE, SKYSHINE Column 4: 252CF, ROOM SCATTER Column 5: 252CF, SKYSHINE TABLE 4-XVI. Standard Reactor Fields, Set 1 Column 2: VIPER REACTOR Column 3: JEZEBEL REACTOR Column 4: FLATTOP REACTOR Column 5: IBR-30, 68.5 M FAR FROM THE CORE Column 6: IBR-30, 8.8 M FAR FROM THE CORE TABLE 4-XVII. Standard Reactor Fields, Set 2 Column 2: STEK 4000, SPECTRUM NO. 9 Column 3: NISUS SPECTRUM Column 4: ISNF-1 SPECTRUM Column 5: CFRMF SPECTRUM Column 6: YOPP SPECTRUM TABLE 4-XX. hotons on Tungsten, Room Scatter and Skyshine Column 2: 25 MEV PHOTONS ON TUNGSTEN, ROOM SCATTER Column 3: 25 MEV PHOTONS ON TUNGSTEN, SKYSHINE Column 4: 14 MEV PHOTONS ON TUNGSTEN, ROOM SCATTER Column 5: 14 MEV PHOTONS ON TUNGSTEN, SKYSHINE
21 (28)
TABLE 4-XXI. Skyshine Column 2: 650 MEV ELECTRON SYNCHROTRON SKYSHINE AT 24 Column 3: 650 MEV ELECTRON SYNCHROTRON SKYSHINE AT 110 Column 4: 650 MEV ELECTRON SYNCHROTRON SKYSHINE AT 300 Column 5: 14 MEV SKYSHINE THROUGH 1176 M AIR Column 6: YAYOI SKYSHINE TABLE 4-XXVII. Standard Reactor Fields, Set 3 Column 2: PURE FISSION SPECTRUM Column 3: GODIVA SPECTRUM Column 4: BIG-TEN SPECTRUM Column 5: YAYOI SPECTRUM Column 6: TAPIRO SPECTRUM TABLE 5-IX. PWRs, Set 2 (old Compendium) Column 2: P.W.R. LOCATION 6/R-2 Column 3: P.W.R. LOCATION 2/E-1 Column 4: P.W.R. LOCATION 3/E-2 Column 5: P.W.R. LOCATION 4/E-3 Column 6: P.W.R. LOCATION 6/R-3 TABLE 5-VII.BWR und PWRs (old Compendium) Column 2: B.W.R. LOCATION E/3-X29 Column 3: P.W.R. LOCATION F/5 Column 4: P.W.R. LOCATION G/3 Column 5: P.W.R. LOCATION H/12 TABLE 5-VIII. PWRs, SET 1 (old Compendium) Column 2: P.W.R. LOCATION I/1-I.V. Column 3: P.W.R. LOCATION I/1-R.V. Column 4: P.W.R. LOCATION J/3 Column 5: P.W.R. LOCATION 2/E-2 Column 6: P.W.R. LOCATION 3/E-3 TABLE 5-X. PWRs, Set 3 (old Compendium) Column 2: P.W.R. LOCATION 2/L-2 Column 3: P.W.R. LOCATION 1/L-1 Column 4: P.W.R. LOCATION 3/L-3 Column 5: P.W.R. LOCATION 3/R-3 TABLE 5-XI. PWRs, Set 4 (old Compendium) Column 2: P.W.R. LOCATION C' Column 3: P.W.R. LOCATION 81 Column 4: P.W.R. LOCATION ORVCB Column 5: P.W.R. LOCATION 9 Column 6: P.W.R. AT PAKS TABLE 5-XII. PHWRs, (old Compendium) Column 2: P.H.W.R. LOCATION REACTOR VAULT Column 3: P.H.W.R. LOCATION 1 Column 4: P.H.W.R. LOCATION 4 Column 5: P.H.W.R. LOCATION FM S RM TABLE 5-XIII. Medical Accelerators, Set 1 (old Compendium) Column 2: 14 MEV PHOTONS ON TUNGSTEN Column 3: 14 MEV PHOTONS ON TUNGSTEN THROUGH 90 CM CON Column 4: 15 MEV PHOTONS ON TUNGSTEN Column 5: 15 MEV PHOTONS ON TUNGSTEN THROUGH 90 CM CON TABLE 5-XIV. Medical Accelerators, Set 2 (old Compendium) Column 2: 18 MEV PHOTONS ON TUNGSTEN Column 3: 18 MEV PHOTONS ON TUNGSTEN THROUGH 90 CM CON Column 4: 25 MEV PHOTONS ON LEAD Column 5: 25 MEV PHOTONS ON TUNGSTEN TABLE 5-XIX. Synchrotrons (old Compendium) Column 2: 650 MEV ELECTRON SYNCHROTRON Column 3: SYNCHROPHASOTRON, LOCATION T.1 Column 4: SYNCHROCYCLOTRON, LOCATION T.1 Column 5: SYNCHROPHASOTRON, LOCATION T.2 TABLE 5-XV. Medical Accelerators, Set 3 (old Compendium) Column 2: THERAC 40/SAGITTAIRE, INSIDE DOOR Column 3: THERAC 40/SAGITTAIRE, OUTSIDE DOOR 1 Column 4: THERAC 40/SAGITTAIRE, OUTSIDE DOOR 2 Column 5: THERAC 40/SAGITTAIRE, LOCATION A
22 (28)
TABLE 5-XVI. Medical Accelerators, Set 4 (old Compendium) Column 2: THERAC 40/SAGITTAIRE, LOCATION B Column 3: THERAC 40/SAGITTAIRE, LOCATION C Column 4: THERAC 40/SAGITTAIRE, LOCATION D Column 5: THERAC 40/SAGITTAIRE, LOCATION E TABLE 5-XVII. Medical Accelerators, Set 5 (old Compendium) Column 2: U-120 CYCLOTRON, UNSHIELDED Column 3: U-120 CYCLOTRON, SPECTRUM THROUGH 10 CM H2O Column 4: U-120 CYCLOTRON, SPECTRUM THROUGH 10 CM CH2 Column 5: U-120 CYCLOTRON, SPECTRUM THROUGH 10 CM FE TABLE 5-XX. MP Tandem Van De Graaff Stray Neutron, SET 1 Column 2: SITE 2 Column 3: SITE 4 Column 4: SITE 6 Column 5: SITE 8-V TABLE 5-XXI. MP Tandem Van De Graaff Stray Neutron, SET 2 Column 2: SITE 11 Column 3: SITE 11-V Column 4: SITE 12-V Column 5: SITE 14 TABLE 5-XXII. High Energy Accelerators SET 1 (Old Compendium) Column 2: ALTERNATING GRADIENT SYNCHROTRON Column 3: STANFORD MARK III. Column 4: COSMOTRON Column 5: COSMOTRON (EXTENDED) Column 6: CAL. TECH. SYNCHROTRON TABLE 5-XXIV. High Energy Accelerators SET 3 (Old Compendium) Column 2: NIMROD, LOCATION X2 Column 3: NIMROD, LOCATION P1 Column 4: 50 MEV LINAC PLA Column 5: BROOKHAVEN LINAC, BLIP-I Column 6: BROOKHAVEN LINAC, BLIP-II TABLE 5-XXIX. Leakages (Old Compendium) Column 2: STANFORD MARK III Column 3: 1 GEV ELECTRON SYNCHROTRON Column 4: BROOKHAVEN 3 GEV COSMOTRON TABLE 5-XXV. High Energy Accelerators SET 4 (Old Compendium) Column 2: AGS SOIL SHIELDED RING TOP Column 3: WATER SHIELD FROM 200 MEV PROTON INTERECTION Column 4: AGS RING TOP Column 5: CYCLOTRON D-A1 TABLE 5-XXVI. Bevatrons, SET 1 (Old Compendium) Column 2: LOCATION B-25/D Column 3: LOCATION B-27/D Column 4: LOCATION B-28/D Column 5: LOCATION B-31/D TABLE 5-XXX. Accelerator Shielded by Earth and Fe (Old Compendi Column 2: 100 G/CM2 EARTH + H2O Column 3: 1000 G/CM2 EARTH + H2O Column 4: 2000 G/CM2 EARTH + H2O Column 5: 2000 G/CM2 FE TABLE 5-XXXI. Nuclear Materials Processing Facilitis (Old Compe Column 2: 5 TON NATURAL URANIUM PILE Column 3: CM203 POWER SOURCE Column 4: PUF4 SOURCE Column 5: TURKEY POINT, FUEL ELEMENT AT 14 INCHES Column 6: TURKEY POINT, FUEL ELEMENT AT 26 INCHES TABLE 5-XVIII. Fusion Reactors (old Compendium) Column 2: TOKAMAK FUSION TEST REACTOR, ROOF Column 3: TOKAMAK FUSION TEST REACTOR, WALL Column 4: ORNL EXP. POWER REACTOR, FIRST WALL Column 5: TOKAMAK, FIRST WALL Column 6: 14 MEV STREAMING, LOCATION 4
23 (28)
TABLE 5-XXIII. High Energy Accelerators SET 2 (Old Compendium) Column 2: CERN RING TOP Column 3: CERN SYNCHROTRON BRIDGE Column 4: LBL BEVATRON TABLE 5-XXVII. Bevatrons, SET 2 (Old Compendium) Column 2: LOCATION B-39/D Column 3: LOCATION B-40/D Column 4: LOCATION B-41/D Column 5: LOCATION B-43/D TABLE 5-XXXII. Bare and Moderated 238-Pu -1 8-O-2 (Old Compendi Column 2: BARE 238-PU - 18-O-2 SOURCE Column 3: MODERATED BY 7.6 CM DIAM. CH2 SPHERE Column 4: MODERATED BY 12.7 CM DIAM. CH2 SPHERE Column 5: MODERATED BY 20.3 CM DIAM. CH2 SPHERE Column 6: MODERATED BY 25.4 CM DIAM. CH2 SPHERE TABLE 5-XXXIV. Cosmic Rays, Set 2 (Old Compendium) Column 2: COSMIC RAY SPEC Column 3: COSMIC RAY SPECT Column 4: COSMIC RAY SPECTRUM AT TOP Column 5: COSMIC RAY SPECT TABLE 4-IX. Am-Be SPECTRA AVAILABLE AT PTB Column 2: The Difference Column 3: Measured with shadow cone Column 4: Measured without shadow cone TABLE 4-V. REFERENCE SPECTRA, RECOMMENDED BY ISO-8529 Column 2: CF252, ISO Column 3: D2O MOD. CF, ISO Column 4: AMBE, ISO Column 5: AMB, ISO TABLE 4-VI. BARE CF SPECTRA AVAILABLE AT PTB Column 2: Measured without shadow cone Column 3: Measured with shadow cone Column 4: The difference TABLE 4-VII. HEAVY WATER MODERATED CF SPECTRA AVAILABLE AT PT Column 2: Measured without shadow cone Column 3: Measured with shadow cone Column 4: The difference TABLE 4-VIII. MODERATED CF SPECTRA AT TOHOTO UNIV. AND DUBNA Column 2: Iron moderated Cf Column 3: Carbon moderated Cf Column 4: Polyethylene moderated Cf Column 5: Polyethylene moderated Cf, D=29.2 cm Column 6: Polyethylene moderated Cf, D=12.7 cm TABLE 4-X. Pu-Be CALIBRATION SPECTRA AVAILABLE AT CERN Column 2: In 1 m distance Column 3: In 2 m distance Column 4: In 3 m distance Column 5: Shielded by PE, in 1 m distance Column 6: Shielded by PE, in 2 m distance TABLE 4-XI. PLUTONIUM SPECTRA AVAILABLE AT LLL AND PNL, RICHLAND Column 2: Bare Pu-Be source, room scatter Column 3: H2O moderated Pu-Be, R=25 cm, room scatter Column 4: D2O moderated Pu-Be, R=25 cm, room scatter Column 5: Bare PuO2 at 100 cm Column 6: Bare Pu metal at 50 cm TABLE 4-XII. PLUTONIUM-FLUORID SPECTRA AVAILABLE AT PNL, RICHLAN Column 2: Bare at 50 cm Column 3: 1" Acrylic moderated at 50 cm Column 4: 2" Acrylic moderated at 50 cm Column 5: Bare at 100 cm Column 6: 2" Acrylic moderated at 100 cm TABLE 4-XIII. MODERATED CF SPECTRA AVAILABLE AT NRI, REZ Column 2: Cf + 5 cm Fe, 10 cm PE Column 3: Cf + 25 cm Fe, 10 cm PE
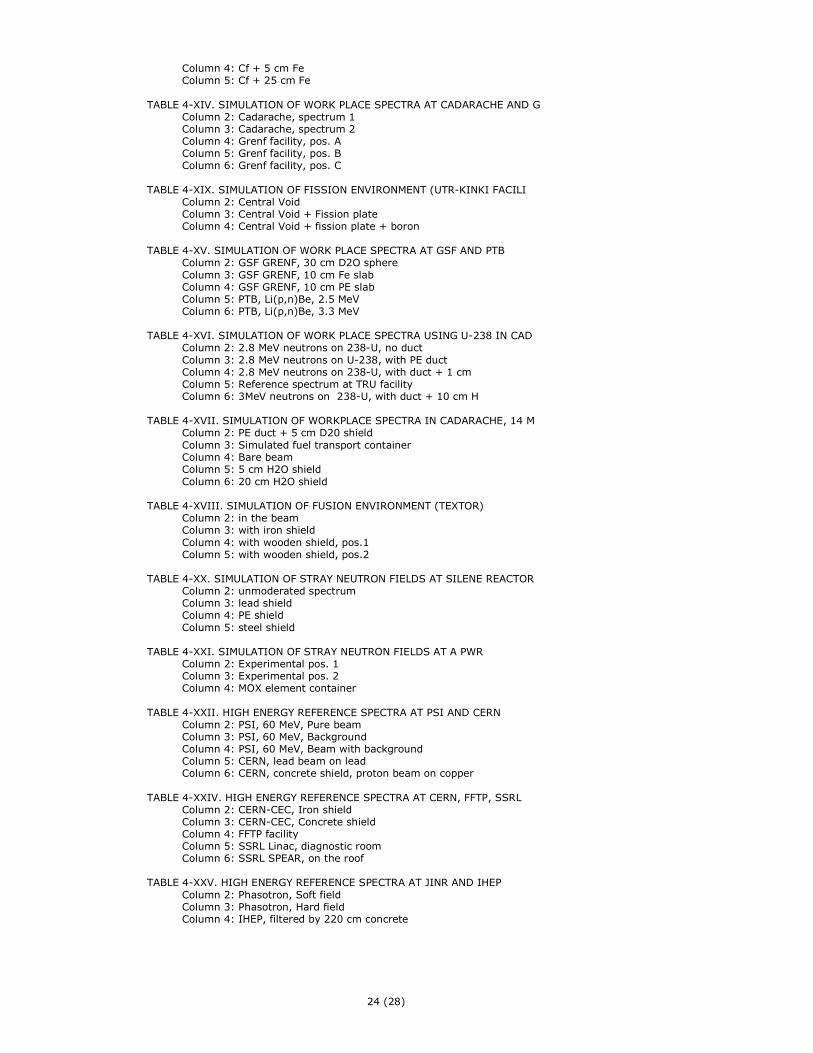
24 (28)
Column 4: Cf + 5 cm Fe Column 5: Cf + 25 cm Fe TABLE 4-XIV. SIMULATION OF WORK PLACE SPECTRA AT CADARACHE AND G Column 2: Cadarache, spectrum 1 Column 3: Cadarache, spectrum 2 Column 4: Grenf facility, pos. A Column 5: Grenf facility, pos. B Column 6: Grenf facility, pos. C TABLE 4-XIX. SIMULATION OF FISSION ENVIRONMENT (UTR-KINKI FACILI Column 2: Central Void Column 3: Central Void + Fission plate Column 4: Central Void + fission plate + boron TABLE 4-XV. SIMULATION OF WORK PLACE SPECTRA AT GSF AND PTB Column 2: GSF GRENF, 30 cm D2O sphere Column 3: GSF GRENF, 10 cm Fe slab Column 4: GSF GRENF, 10 cm PE slab Column 5: PTB, Li(p,n)Be, 2.5 MeV Column 6: PTB, Li(p,n)Be, 3.3 MeV TABLE 4-XVI. SIMULATION OF WORK PLACE SPECTRA USING U-238 IN CAD Column 2: 2.8 MeV neutrons on 238-U, no duct Column 3: 2.8 MeV neutrons on U-238, with PE duct Column 4: 2.8 MeV neutrons on 238-U, with duct + 1 cm Column 5: Reference spectrum at TRU facility Column 6: 3MeV neutrons on 238-U, with duct + 10 cm H TABLE 4-XVII. SIMULATION OF WORKPLACE SPECTRA IN CADARACHE, 14 M Column 2: PE duct + 5 cm D20 shield Column 3: Simulated fuel transport container Column 4: Bare beam Column 5: 5 cm H2O shield Column 6: 20 cm H2O shield TABLE 4-XVIII. SIMULATION OF FUSION ENVIRONMENT (TEXTOR) Column 2: in the beam Column 3: with iron shield Column 4: with wooden shield, pos.1 Column 5: with wooden shield, pos.2 TABLE 4-XX. SIMULATION OF STRAY NEUTRON FIELDS AT SILENE REACTOR Column 2: unmoderated spectrum Column 3: lead shield Column 4: PE shield Column 5: steel shield TABLE 4-XXI. SIMULATION OF STRAY NEUTRON FIELDS AT A PWR Column 2: Experimental pos. 1 Column 3: Experimental pos. 2 Column 4: MOX element container TABLE 4-XXII. HIGH ENERGY REFERENCE SPECTRA AT PSI AND CERN Column 2: PSI, 60 MeV, Pure beam Column 3: PSI, 60 MeV, Background Column 4: PSI, 60 MeV, Beam with background Column 5: CERN, lead beam on lead Column 6: CERN, concrete shield, proton beam on copper TABLE 4-XXIV. HIGH ENERGY REFERENCE SPECTRA AT CERN, FFTP, SSRL Column 2: CERN-CEC, Iron shield Column 3: CERN-CEC, Concrete shield Column 4: FFTP facility Column 5: SSRL Linac, diagnostic room Column 6: SSRL SPEAR, on the roof TABLE 4-XXV. HIGH ENERGY REFERENCE SPECTRA AT JINR AND IHEP Column 2: Phasotron, Soft field Column 3: Phasotron, Hard field Column 4: IHEP, filtered by 220 cm concrete
25 (28)
TABLE 4-XXIII. HIGH ENERGY REFERENCE SPECTRA AT CERN Column 2: Concrete top Column 3: Concrete side Column 4: Iron top Column 5: Iron side TABLE 5-IX. CAORSO, BWR, CALCULATED Column 2: Position 1 Column 3: Position 2 Column 4: Position 3 Column 5: Position 4 TABLE 5-VIII. CAORSO, BWR, MEASURED Column 2: Position 1 Column 3: Position 2 Column 4: Position 3 Column 5: Position 4 TABLE 5-X. MEASURED BWR AND PWR SPECTRA (U.K.) Column 2: DUNGBCFL, in Boiler Cell Column 3: DUNGRFFL, Roof Column 4: DUNGWWFL, Walkway Column 5: PWR1GOFL, Position 1 Column 6: PWR2GOFL, Position 2 TABLE 5-XI. MEASURED PWR SPECTRA (U.K.) Column 2: TRAWSFYNYDD, Filter galery Column 3: HINKLEY POINT, Pile cap Column 4: HINKLEY POINT, Filter galery TABLE 5-XII. MEASURED PWR SPECTRA (WOLF CREEK) Column 2: Power 50%, PH 2047'Level Column 3: Power 50%, PH 2047' Column 4: Power 50%, 2026' Level by Valves Column 5: Power 100%, PH Column 6: Power 100%, 2026' A Loop Penetration TABLE 5-XIII. CZECH PWR, PUMPS' ROOM Column 2: near cold side Column 3: between pump & cold side Column 4: hot side Column 5: near entrance door Column 6: between pumps 3 & 4 TABLE 5-XIV. CZECH PWR, VESSEL TEST ROOM Column 2: under reactor, pos.1 Column 3: middle of room Column 4: under reactor, pos.2 Column 5: corridor outside room TABLE 5-XIX. SWISS BWR, MARK I, 1 Column 2: Maze entrance Column 3: 1st bend of maze Column 4: Entrance of drywell Column 5: Under access opening Column 6: Btw. drywell & stairwell TABLE 5-XL. REACTOR FUEL TREATMENT, Pu REPROCESSING PLANT (USA) Column 2: Lightly shielded Column 3: Heavily shielded Column 4: Operator desk Column 5: At conduit exit Column 6: At glove box TABLE 5-XLI. ISOTOPIC SOURCE PRODUCTION Column 2: AmO2 in container Column 3: Cm244 bare, in glove box Column 4: Am-Be bare, in glove box Column 5: Am ceramic discs TABLE 5-XLII. BORON THERAPY, 1 Column 2: Petten HB11 filtered beam Column 3: Accelerator based spectrum Column 4: Gantry, cell 55 Column 5: LVR-15 epithermal beam, BS meas.
26 (28)
TABLE 5-XLIV. BORON THERAPY SPECTRA, 3 Column 2: Accelerator epithermal beam Column 3: BMRR beam Column 4: Accelerator, filtered by AL/ALF3 Column 5: Accelerator, filtered by 7LiF Column 6 :Accelerator, filtered by D2O TABLE 5-XLIII. BORON THERAPY SPECTRA, 2 Column 2: Spallation source Column 3: RENT I beam Column 4: FRM II unfiltered Column 5: FRM II filtered TABLE 5-XV. CZECH PWR, REACTOR HALL Column 2: above reactor cap Column 3: above isolation valve Column 4: above steam generator Column 5: platform of reactor cap TABLE 5-XVI. PWR, IN CONTAINMENT (USA) Column 2: Site 5 Column 3: Site 6 (SPUNIT code) Column 4: Site 4 (SPUNIT code) Column 5: Site 4 (YOGI code) TABLE 5-XVII. RINGHALS, SWEDEN Column 2: CLAB at point D Column 3: CLAB at point E Column 4: CLAB at point P Column 5: B4 at point L Column 6: B2 at point G TABLE 5-XVIII. GAS COOLED (U.K.) Column 2: Position CH1 Column 3: Position CH2 Column 4: Filter galery pos. S3 Column 5: Filter galery pos. S4 TABLE 5-XX. SWISS BWR, MARK I, 2 Column 2: 16m level, near pump Column 3: 16 m level, near sprinkler tap Column 4: Containment lock, door closed Column 5: Containment lock, door open TABLE 5-XXI. SWISS PWR, WESTINGHOUSE Column 2: 1m from metal door into containment Column 3: In containment, 1m from platform Column 4: In containment, 3m from platfrom Column 5: behind steam generator TABLE 5-XXII. SWISS PWR, SIEMENS KWU Column 2: 18.4 m level, reactor axis Column 3: reactor level, 40 cm behind metal door Column 4: reactor level, 33 cm behind metal door TABLE 5-XXIV. MICROTRON STRAY FIELD, 2 Column 2: Site E, door 2 open Column 3: Site E, door 2 closed Column 4: Site D, with backing, door 2 closed Column 5: Site D, without backing, door 2 closed Column 6: Site D, door 2 open TABLE 5-XXVIX. TOKYO UNIV. 1 GEV SYNCHROTRON Column 2: Skyshine at 111m, calculated Column 3: Skyshine at 111m, measured Column 4: On concrete roof, calculated Column 5: On concrete roof, measured Column 6: Model spectrum for skyshine calculation TABLE 5-XXV. AVF, TOHOKO UNIV. 35 MEV CYCLOTRON, 1 Column 2: Cyclotron room Column 3: 1st leg of labyrinth Column 4: 2nd leg of labyrinth, pos. 1 Column 5: 2nd leg of labyrinth, pos. 2 Column 6: 2nd leg of labyrinth, coupling interface
27 (28)
TABLE 5-XXVI. AVF, TOHOT UNIV. 35 MEV CYCLOTRON, 2 Column 2: 2nd leg of labyrinth, pos. 4 Column 3: 3rd leg of labyrinth, in front of iron door Column 4: 3rd leg of labyrinth, behind iron door Column 5: Underpath for room TABLE 5-XXX. DESY LEAKAGE NEUTRON SPECTRA, 1 Column 2: Concrete shielding Column 3: Heavy concrete shielding Column 4: Iron shielding Column 5: Iron and concrete shielding TABLE 5-XXXI. DESY LEAKAGE NEURON SPECTRA, 2 Column 2: Sand + concrete Column 3: Heavy concrete Column 4: Heavy concrete, thin target Column 5: Concrete, thick target TABLE 5-XXXV. REACTOR FUEL TREATMENT, CASK 2 Column 2: NTL111 container, at 115 cm Column 3: NTL111 container, at 367 cm Column 4: 1392/1 Column 5: 1393/2 TABLE 5-XXIII. MICTROTRON STRAY FIELD, 1 Column 2: 1m from Au target Column 3: Site B, measured Column 4: Site C, measured Column 5: Site D, door 2 open Column 6: Site D, door 2 closed TABLE 5-XXVII. TRIUMF, 500 MEV CYCLOTRON Column 2: Vault door Column 3: TNF door Column 4: South of LD2 target Column 5: M8 channel Column 6: Top of TNF TABLE 5-XXVIII. KEK, 12 GEV SYNCHROTRON Column 2: Location 11 Column 3: Location 1 Column 4: Location 2 Column 5: Location 5 Column 6: Location 4 TABLE 5-XXXII. 46 MEV CYCLOTRON STRAY NEUTRON SPECTRA Column 2: Variable energy port, START1 start sp. Column 3: Variable energy port, FLAT start sp. Column 4: Variable energy port, GRAVES start sp. Column 5: Variable energy port, Maxwellian start sp. Column 6: Switching magnet, Maxwellian start sp. TABLE 5-XXXIII. COSMIC RAY SPECTRA, MEASURED AND CALCULATED Column 2: PTB, Free in air Column 3: PTB, in basement Column 4: At 5000 m above ROME, Luin code Column 5: Zugspitze by FLUKA code Column 6: Zugspitze measured TABLE 5-XXXIV. REACTOR FUEL TREATMENT, CASK 1 Column 2: LK100 container, location 1 Column 3: TN12 container Column 4: LK100 container, location 2 Column 5: PuF4 workstation in Valduc TABLE 5-XXXIX. REACTOR FUEL TREATMENT, Pu REPROCESSING PLANT (U. Column 2: Location 1 Column 3: Location 2 Column 4: Location 3 Column 5: Location 4 Column 6: Location 5
28 (28)
TABLE 5-XXXVI. REACTOR FUEL TREATMENT, CASK 3 (WWR) Column 2: Storage hall, at 0.45 m Column 3: Storage hall, at 2 m Column 4: Transport wagon, corridor, at 0.45 m Column 5: Transport wagon, corridor, at 2 m TABLE 5-XXXVII. REACTOR FUEL TREATMENT, MOX Column 2: bare MOX fuel, at 20 cm Column 3: MOX fuel in borated water Column 4: MOX fuel, at storage place Column 5: GSF MOX fuel cask, pos. 2 Column 6: GSF MOX fuel cask, pos. 3 TABLE 5-XXXVIII. REACTOR FUEL TREATMENT, FUEL STORAGE Column 2: Hanau fuel storage, Bonner sphere Column 3: Hanau fuel storage, NE213 spectrometer Column 4: POLLUX container simulation, above ground Column 5: POLLUX container simulation, underground
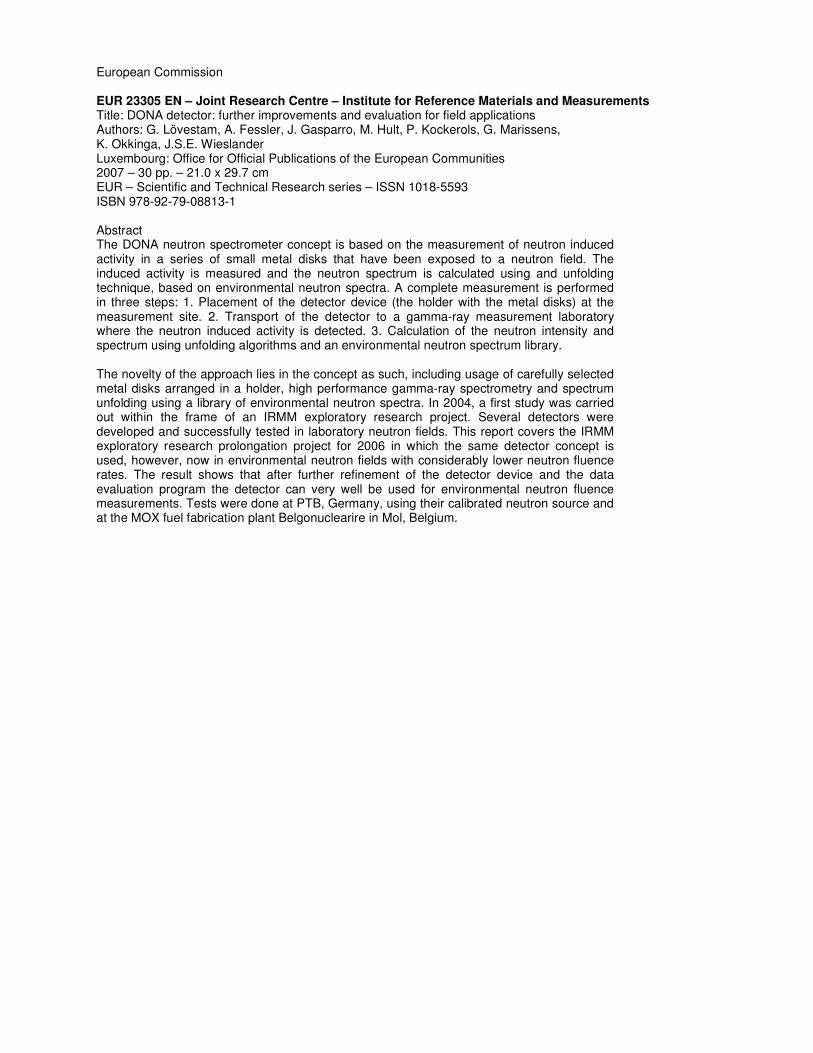
European Commission EUR 23305 EN – Joint Research Centre – Institute for Reference Materials and Measurements Title: DONA detector: further improvements and evaluation for field applications Authors: G. Lövestam, A. Fessler, J. Gasparro, M. Hult, P. Kockerols, G. Marissens, K. Okkinga, J.S.E. Wieslander Luxembourg: Office for Official Publications of the European Communities 2007 – 30 pp. – 21.0 x 29.7 cm EUR – Scientific and Technical Research series – ISSN 1018-5593 ISBN 978-92-79-08813-1 Abstract The DONA neutron spectrometer concept is based on the measurement of neutron induced activity in a series of small metal disks that have been exposed to a neutron field. The induced activity is measured and the neutron spectrum is calculated using and unfolding technique, based on environmental neutron spectra. A complete measurement is performed in three steps: 1. Placement of the detector device (the holder with the metal disks) at the measurement site. 2. Transport of the detector to a gamma-ray measurement laboratory where the neutron induced activity is detected. 3. Calculation of the neutron intensity and spectrum using unfolding algorithms and an environmental neutron spectrum library. The novelty of the approach lies in the concept as such, including usage of carefully selected metal disks arranged in a holder, high performance gamma-ray spectrometry and spectrum unfolding using a library of environmental neutron spectra. In 2004, a first study was carried out within the frame of an IRMM exploratory research project. Several detectors were developed and successfully tested in laboratory neutron fields. This report covers the IRMM exploratory research prolongation project for 2006 in which the same detector concept is used, however, now in environmental neutron fields with considerably lower neutron fluence rates. The result shows that after further refinement of the detector device and the data evaluation program the detector can very well be used for environmental neutron fluence measurements. Tests were done at PTB, Germany, using their calibrated neutron source and at the MOX fuel fabrication plant Belgonuclearire in Mol, Belgium.
How to obtain EU publications Our priced publications are available from EU Bookshop (http://bookshop.europa.eu), where you can place an order with the sales agent of your choice. The Publications Office has a worldwide network of sales agents. You can obtain their contact details by sending a fax to (352) 29 29-42758.
The mission of the JRC is to provide customer-driven scientific and technical support for the conception, development, implementation and monitoring of EU policies. As a service of the European Commission, the JRC functions as a reference centre of science and technology for the Union. Close to the policy-making process, it serves the common interest of the Member States, while being independent of special interests, whether private or national.