Page 1
© February 2015 | 10128T 800.443.9441 E [email protected] W www.blackbaud.com
donorCentrics™ Annual Report on Higher Education Alumni Giving
Summary of Annual Fund Key Performance IndicatorsJULY 2013–JUNE 2014
Page 2
3© February 2015 T 800.443.9441 E [email protected] W www.blackbaud.com
donorCentrics™
Annual Report on Higher Education Alumni Giving
2014: A BANNER YEAR FOR HIGHER EDUCATION A strong economy, coupled with new techniques that appear to be taking hold, helped lead higher education annual giving programs to higher levels
of revenue in 2014 compared to 2013. In fact, the revenue growth across the board, and in nearly every key metric, speaks to the ability of annual
giving programs to secure multiple gifts from donors during the year, upgrade donors, and grow revenue. Of course the long term benefit of such
tactics is the building of a major gift pipeline. This past year stands in stark contrast to just five years ago, when in 2009, annual giving programs saw
revenue decline for the first time in history. Not only have these programs recovered, but they are also thriving in their ability to secure more and more
dollars for the private and public institutions using them in their programs.
This past year was even a good year for donors to annual giving programs. While donor counts have been down over the past few years, 2014
experienced stabilization among donors to the degree that participation rates and donors counts were flat but stable. Believe it or not, this is good news
considering the declines most programs have posted over the past several years. In 2014, retention rates were flat but steady, reactivation rates were flat
or slightly up (perhaps the most noteworthy trend in the 2014 data), and acquisition efforts generated stronger results than any year in recent memory.
And while many institutions continue to discuss moving toward new models such as recurring gift programs, a few have done so with good to strong
results within the first year of implementation. The advent of “giving day” efforts, for those institutions doing them, appears to be a welcomed boost to
donors and dollars. These new (at least to higher education) strategies are beginning to move the needle for many programs.
In all, with key metrics stabilizing or moving in a positive direction, it is hard not to look at 2014 as a strong year for higher education annual giving
programs, if not a banner year!
ALUMNI PARTICIPATION
Median Participation RatesParticipation rates, after a steady decline over the past several years, have appeared to stabilize with private institutions medians holding at 19% and
public institutions holding at
6%. The increased activity
among student giving programs,
particularly senior class gifts, has
allowed some institutions to at
least keep pace with alumni donor
counts and thus participation rates.
While still only a few programs
have implemented aggressive
(and successful) sustainer giving
programs, this too can have an
impact on long-term participation
rates if the success of signing up
large numbers of alumni for such
programs grows overtime.
2012 2013 201420%
19% 19%
7%
6% 6%
Private Public Overall
11%
10% 9%
Page 3
4© February 2015 T 800.443.9441 E [email protected] W www.blackbaud.com
donorCentrics™
Annual Report on Higher Education Alumni Giving
DONOR RETENTION
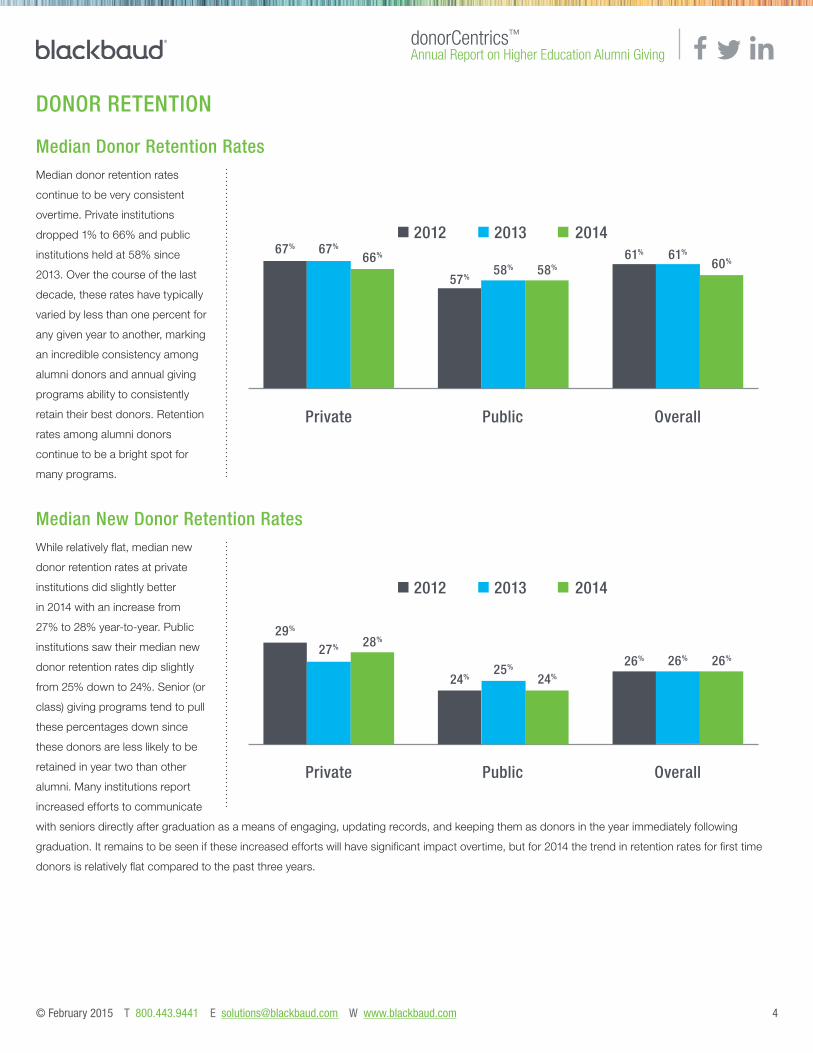
Median Donor Retention RatesMedian donor retention rates
continue to be very consistent
overtime. Private institutions
dropped 1% to 66% and public
institutions held at 58% since
2013. Over the course of the last
decade, these rates have typically
varied by less than one percent for
any given year to another, marking
an incredible consistency among
alumni donors and annual giving
programs ability to consistently
retain their best donors. Retention
rates among alumni donors
continue to be a bright spot for
many programs.
Median New Donor Retention RatesWhile relatively flat, median new
donor retention rates at private
institutions did slightly better
in 2014 with an increase from
27% to 28% year-to-year. Public
institutions saw their median new
donor retention rates dip slightly
from 25% down to 24%. Senior (or
class) giving programs tend to pull
these percentages down since
these donors are less likely to be
retained in year two than other
alumni. Many institutions report
increased efforts to communicate
with seniors directly after graduation as a means of engaging, updating records, and keeping them as donors in the year immediately following
graduation. It remains to be seen if these increased efforts will have significant impact overtime, but for 2014 the trend in retention rates for first time
donors is relatively flat compared to the past three years.
2012 2013 201467% 67%
66%
57%58% 58%
Private Public Overall
61% 61%
60%
2012 2013 2014
29%
27% 28%
24%25%
24%
Private Public Overall
26% 26% 26%
Page 4
5© February 2015 T 800.443.9441 E [email protected] W www.blackbaud.com
donorCentrics™
Annual Report on Higher Education Alumni Giving
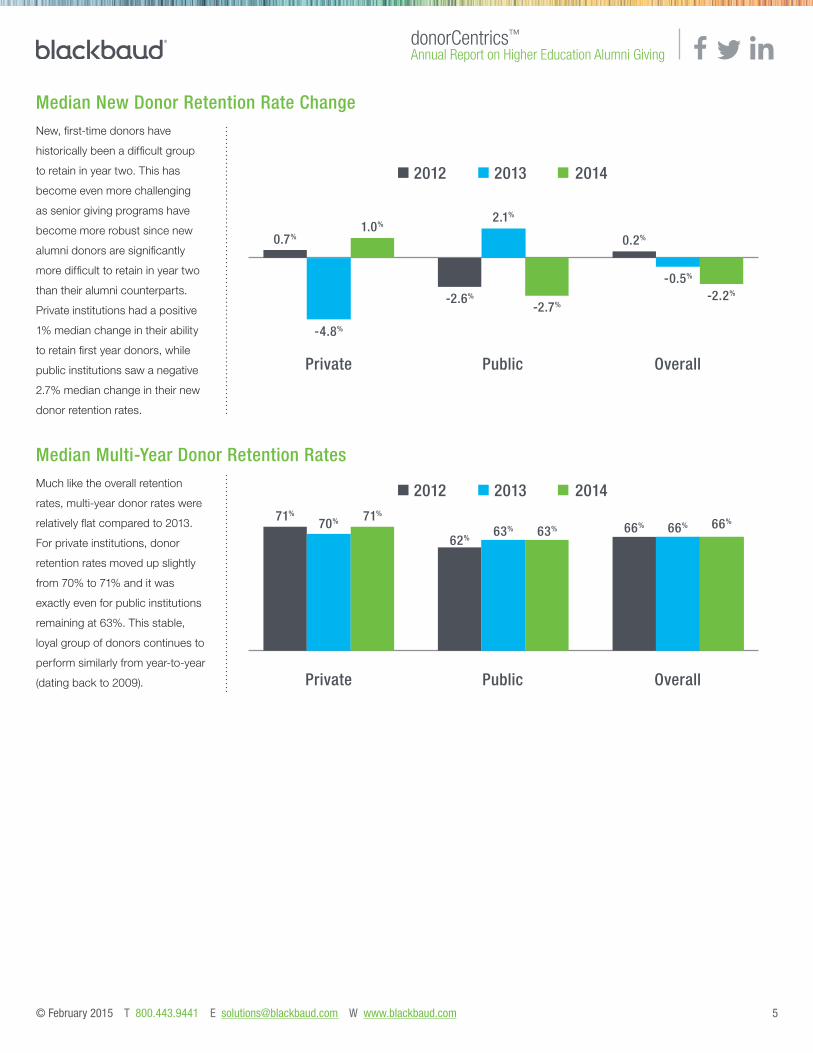
Median New Donor Retention Rate ChangeNew, first-time donors have
historically been a difficult group
to retain in year two. This has
become even more challenging
as senior giving programs have
become more robust since new
alumni donors are significantly
more difficult to retain in year two
than their alumni counterparts.
Private institutions had a positive
1% median change in their ability
to retain first year donors, while
public institutions saw a negative
2.7% median change in their new
donor retention rates.
Median Multi-Year Donor Retention RatesMuch like the overall retention
rates, multi-year donor rates were
relatively flat compared to 2013.
For private institutions, donor
retention rates moved up slightly
from 70% to 71% and it was
exactly even for public institutions
remaining at 63%. This stable,
loyal group of donors continues to
perform similarly from year-to-year
(dating back to 2009).
2012 2013 2014
Private Public Overall
0.7%
-4.8%
2.1%
0.2%1.0%
-2.6%
-2.7%
-0.5%
-2.2%
2012 2013 2014
71%
70% 71%
62%63% 63%
Private Public Overall
66% 66% 66%
Page 5
6© February 2015 T 800.443.9441 E [email protected] W www.blackbaud.com
donorCentrics™
Annual Report on Higher Education Alumni Giving
Median Revenue per Retained DonorWhile retention rates held
steady, donors that were
retained gave significantly more
in 2014 compared to 2013. For
private institutions, the median
revenue moved from $870 in
2013 to a strong $938 in 2014.
Likewise, public institutions saw
a significant jump from $535
to $597. A strong economy,
aggressive second (or multiple)
ask programs, and specific
upgrade strategies have all paved
the way for this significant growth.
DONOR REACTIVATION
Median Donor Reactivation RatesReactivation rates may have finally
stabilized. After an extended
period of steady decline, it appears
reactivation of lapsed donors
(one to five years) appears to
have evened out among public
and private institutions. Private
institutions held steady with a
median reactivation rate of 17%
while public institutions climbed
1% to 13% overall. The three
year trends now demonstrate
consistency with less than one
percent fluctuations between the
three years. Sustainer programs can also significantly influence this group of donors overtime, as more programs implement recurring giving as a
standard practice. Young alumni, and more specifically senior giving programs, have created more instability overtime among reactivation rates, but
this seems to be leveling off.
2012 2013 2014
$829$870
$938
$510 $535$597
Private Public Overall
$651$708 $763
(1-5 years lapsed)
2012 2013 2014
17% 17% 17%
14%
12%13%
Private Public Overall
15%
14% 15%
Page 6
7© February 2015 T 800.443.9441 E [email protected] W www.blackbaud.com
donorCentrics™
Annual Report on Higher Education Alumni Giving
Median Revenue per Reactivated DonorThe median revenue per
reactivated donor moved in
different directions for public
and private institutions in 2014.
For private institutions, median
revenue was down from $467
to $441. For public institutions,
median revenue rose from $292
to $322. Given the stronger
economy and general upward
trends in giving over the past
several years, it is unusual that
the median revenue per donor
would actually decline, even from
reactivated donors.
DONOR ACQUISITION
Median Change in New DonorsLast year was a strong year for
donor acquisition, with private
institutions improving .3% and
public institutions a whopping
6.4%. This resulted in an overall
growth in new donors of 4.9%
(surpassing the 2.4% growth rate
we saw in 2013). The stronger
economy, increased focus on
younger alumni, recurring gift
programs, and likely the increase
in “giving day” efforts have helped
breathe new life into acquisition.
This positive growth was one
key factor in allowing institutions
to remain relatively flat in their
participation rates last year.
2012 2013 2014
Private Public Overall
$412
$467
$259 $292$322
$441
$315$344
$372
2012 2013 2014
-2.5%
3.8%
0.3%
3.5%
2.4%
6.4%
Private Public Overall
1.2%2.4%
4.9%
Page 7
8© February 2015 T 800.443.9441 E [email protected] W www.blackbaud.com
donorCentrics™
Annual Report on Higher Education Alumni Giving
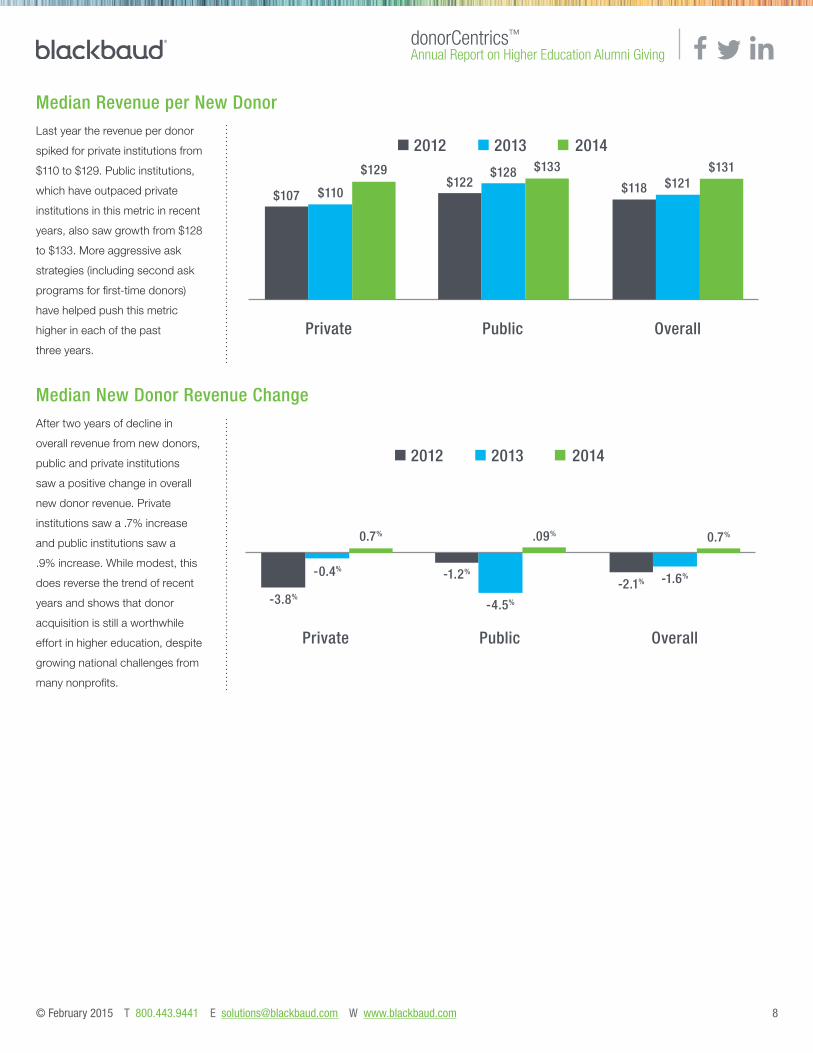
Median Revenue per New DonorLast year the revenue per donor
spiked for private institutions from
$110 to $129. Public institutions,
which have outpaced private
institutions in this metric in recent
years, also saw growth from $128
to $133. More aggressive ask
strategies (including second ask
programs for first-time donors)
have helped push this metric
higher in each of the past
three years.
Median New Donor Revenue ChangeAfter two years of decline in
overall revenue from new donors,
public and private institutions
saw a positive change in overall
new donor revenue. Private
institutions saw a .7% increase
and public institutions saw a
.9% increase. While modest, this
does reverse the trend of recent
years and shows that donor
acquisition is still a worthwhile
effort in higher education, despite
growing national challenges from
many nonprofits.
2012 2013 2014
$107 $110
$129$122
$128 $133
Private Public Overall
$118 $121$131
2012 2013 2014
Private Public Overall
-3.8%
-0.4%
0.7%
-1.2%
-4.5%
.09%
-2.1% -1.6%
0.7%
Page 8
9© February 2015 T 800.443.9441 E [email protected] W www.blackbaud.com
donorCentrics™
Annual Report on Higher Education Alumni Giving
CONCLUSIONS: PERFORMANCE OVERALL
Median Change in RevenueWith a stronger economy the
overall revenue for programs,
public and private, continues
to move in a positive direction.
The median percent change in
revenue for public institutions
was 5.4% and 5.1% for private
institutions. For many institutions,
revenue growth of 10% or more
was not unusual in 2014.
Median Revenue per DonorWhile the overall revenue was up
last year for the vast majority of
institutions, the same then can
be said for the overall median
revenue per donor which climbed
from $730 to $746 for private
institutions and from $421 to
$451 for public institutions.
Median Change in Donor CountsThe median change in overall
donor counts was up modestly
(though less than one percent)
for private institutions and slightly
down for public institutions (by
one percent). The overall median
change in donor counts was
precisely flat when combining
public and private institutions.
This is, in essence, a positive
development since alumni
donor counts in general have
been decreasing over the past
several years.
2012 2013 2014
Private Public Overall
3.5%
5.7%
5.1%4.5% 4.3% 4.3%
5.3% 5.4%6.0%
2012 2013 2014
$662 $730$746
$510 $535$597
Private Public Overall
$651$708 $763
2012 2013 2014
Private Public Overall
-0.7%
0.3% 0.9%
-1.8%-2.2%
-1.1% -1.0% -1.0%
0.0%
Page 9
10© February 2015 T 800.443.9441 E [email protected] W www.blackbaud.com
donorCentrics™
Annual Report on Higher Education Alumni Giving
Median Change in Gifts per Donor*As more institutions adopt and
promote aggressive second
ask programs (and for some
institutions multiple asks during
the year), the median change in
gifts per donors continues to rise
with a positive 1.3% change for
private institutions and a 1.4%
change for public institutions.
This movement demonstrates the
ongoing willingness of donors to
make multiple gifts during the year.
*Pledge payments, recurring gifts, and payroll deduction are rolled up and counted as one gift for this analysis.
Median Change in Gifts*The number of gifts continues
to increase due in part to more
donors making multiple gifts
during the year. For private
institutions, the median change
was 2.3% and public institutions
saw a positive median change
of 1.1%. Despite challenges in
recent years relative to number
of donors, the number of gifts to
institutions continues to rise.
*Pledge payments, recurring gifts, and payroll deduction are rolled up and counted as one gift for this analysis.
2012 2013 2014
Private Public Overall
0.6% 0.4%1.1%
0.4%1.3% 1.4%
0.5% 0.7% 1.4%
2012 2013 2014
Private Public Overall
0.8%0.1%1.0%
-0.6%
2.3%
1.1%0.6% 0.2%
1.6%
Page 10
11© February 2015 T 800.443.9441 E [email protected] W www.blackbaud.com
donorCentrics™
Annual Report on Higher Education Alumni Giving
FURTHER INFORMATIONParticipation:
For more information about participating in the donorCentrics™ Annual Report on Higher Education Alumni Giving, contact Jenny Cooke Smith at
[email protected] or 843.654.3762.
Media Contact:
For press inquiries or permission to reproduce, contact Nicole McGougan at [email protected] or 843.654.3307.
Findings from recent and future reports can be found at https://www.blackbaud.com/nonprofit-resources/industry-research.aspx
ANNUAL REPORT METHODOLOGYTarget Analytics applied the following rules to standardize data from each of the institutions participating in the 2014 donorCentrics Annual Report on
Higher Education Alumni Giving:
Soft credits and matching gift payments are excluded. Direct mail, telemarketing, and digital giving are by far the dominant revenue sources for most
institutions; however events, personal solicitation, and other sources are included. Indicators are calculated on a cash payment basis, as opposed to
a pledge basis. Gifts or donors are defined as new, retained, or reactivated according to relative gift dates rather than organization-specific business
rules or source codes. Retention rates are calculated by dividing the number of donors giving in the current year who also gave during the previous
year by the total number of donors who gave in the previous year. Revenue per donor refers to the cumulative giving per donor per year.
The donorCentrics Annual Report on Higher Education Alumni Giving utilizes medians, the middle values in a ranked order of numbers, to measure
trends because it minimizes distortion caused by the wide range of organizations’ file size or extreme changes at a few organizations.
Page 11
12© February 2015 T 800.443.9441 E [email protected] W www.blackbaud.com
donorCentrics™
Annual Report on Higher Education Alumni Giving
PARTICIPATING PRIVATE INSTITUTIONSAlfred University
Barnard College
Benedictine College
Boston College
Boston College Law School
Boston University
Boston University Law School
Boston University Medical School
Brandeis University
Buena Vista University
Carroll College
Carnegie Mellon University Tepper School of Business
College of St. Benedict
College of Wooster
Columbia University
Columbia University College of Medicine
Concordia College
Cornell University
Cornell University School of Law
Cornell University Johnson Graduate School of Management
Dartmouth College
Eastern University
Emma Willard School
Emory University
Episcopal High School
Fairleigh-Dickinson University
Furman University
Gettysburg College
George Washington University
Grinnell College
Harvard Law School
Harvard Medical School
Holderness School
Johns Hopkins University
LaSalle University
Lewis and Clark College
Luther College
Marquette University
Massachusetts Institute of Technology
MIT Sloan School of Management
Mount St. Mary’s College
Muhlenberg College
Northeastern University
Northwestern University
Northwestern University Kellogg School of Management
New York University
New York University Law School
New York University Stern School of Business
Ohio Wesleyan University
Oral Roberts University
Point Loma Nazarene University
Presbyterian College
Rensselaer Polytechnic Institute
Rice University
Page 12
13© February 2015 T 800.443.9441 E [email protected] W www.blackbaud.com
donorCentrics™
Annual Report on Higher Education Alumni Giving
Rice University Jones School of Business
Saint Louis University
Saint Mary’s College of California
Sarah Lawrence College
Smith College
Southern Methodist University
St. John’s University
St. Joseph’s University
St. Mark’s School
Syracuse University
Texas Christian University
Thacher School
The Principia
Union College
University of Chicago
University of Chicago Booth School of Business
University of Chicago School of Medicine
University of Miami
University of Pennsylvania
University of Pennsylvania Law School
University of Redlands
University of San Francisco
University of San Diego Law School
Wake Forest University
Webb Schools
Wentworth Institute of Technology
Whitman College
Wofford College
Yale Law School
Page 13
14© February 2015 T 800.443.9441 E [email protected] W www.blackbaud.com
donorCentrics™
Annual Report on Higher Education Alumni Giving
PARTICIPATING PUBLIC INSTITUTIONSArizona State University
Auburn University
Bemidji State University
Bowling Green State University
Cal Poly Pomona
California State University Bakersfield
California State University Fresno
California State University Fullerton
California State University Los Angeles
California State University Northridge
California State University Sacramento
California State University Stanislaus
Carleton University
Colorado State University
College of William and Mary
Concordia University
Dalhousie University
Darden School of Business
East Carolina University
Ferris State University
Georgia Regents University
Georgia Regents University Medical School
Humboldt State University
Iowa State University
Indiana University
Indiana University of Pennsylvania
James Madison University
Kansas University
Kennesaw State University
McMaster University
Michigan State University
Montclair State University
North Carolina State University
New Jersey Institute of Technology
Ohio University
Oregon State University
Pennsylvania State University
Queens University
Rutgers University
San Francisco State University
San Jose State University
Stony Brook University
Southern Alberta Institute of Technology
Texas A&M University
Texas State University
The Ohio State University
University of Arizona
University of California, Berkeley
University of California, Berkeley Haas School of Business
University of California, Davis
University of California, LA Anderson School of Management
University of California, LA School of Law
University of California, Riverside
University of California, Santa Barbara
Page 14
15© February 2015 T 800.443.9441 E [email protected] W www.blackbaud.com
© April 2015 Blackbaud, Inc.
This white paper is for informational purposes only.
Blackbaud makes no warranties, expressed or
implied, in this summary. The information contained
in this document represents the current view of
Blackbaud, Inc., on the items discussed as of the
date of this publication.
All Blackbaud product names appearing herein are
trademarks or registered trademarks of Blackbaud,
Inc. The names of actual companies and products
mentioned herein may be the trademarks of their
respective owners.
About Blackbaud
Serving the nonprofit, charitable giving and education communities for more than 30 years, Blackbaud (NASDAQ:BLKB) combines technology
solutions and expertise to help organizations achieve their missions. Blackbaud works in over 60 countries to support more than 30,000
customers, including nonprofits, K12 private and higher education institutions, healthcare organizations, foundations and other charitable
giving entities, and corporations. The company offers a full spectrum of cloud and on-premise solutions, and related services for organizations
of all sizes, including nonprofit fundraising and relationship management, eMarketing, advocacy, accounting, payment and analytics, as well
as grant management, corporate social responsibility, education and other solutions. Using Blackbaud technology, these organizations raise,
invest, manage and award more than $100 billion each year. Recognized as a top company, Blackbaud is headquartered in Charleston, South
Carolina and has operations in the United States, Australia, Canada, the Netherlands, Ireland and the United Kingdom. For more information,
visit www.blackbaud.com.
donorCentrics™
Annual Report on Higher Education Alumni Giving
University of California, Santa Cruz
University of California, San Diego
University of Cincinnati
University of Delaware
University of Florida
University of Georgia
University of Georgia School of Law
University of Guelph
University of Houston
University of Kentucky
University of Maine
University of Maryland
University of Michigan
University of Minnesota
University of Nebraska
University of North Carolina, Chapel Hill
University of North Carolina, Greensboro
University of North Carolina, Wilmington
University of Northern Colorado
University of Oregon
University of Saskatchewan
University of Tennessee
Washington State University
York University