63
Don’t Throw in the Towel, Throw in Trade Credit! Banu Demir Bilkent U. and CEPR Beata Javorcik Oxford, ESOP and CEPR June 2017

Don’t Throw in the Towel,
Throw in Trade Credit!
Banu DemirBilkent U. and CEPR
Beata JavorcikOxford, ESOP and CEPR
June 2017

Motivation
How do firms adjust to increased competition resulting fromglobalization?
exit of the least productive firms and reallocation of market sharestowards more productive ones (Pavcnik (2002,REStud); Melitz(2003,Ec))
dropping the least performing products and expanding the bestperforming ones (Bernard, Redding, and Schott (2010,AER; 2011,QJE ); Eckel and Neary (2010,REStud); Mayer, Melitz, andOttaviano (2014,AER).
This paper points out another margin of adjustment:
provision of trade credit

Research question
Do firms respond to increased competitivepressures by providing trade credit?
Anecdotal evidence
Advice given to exporters by the US Department of Commerce:
“Insisting on cash-in-advance could, ultimately, cause exporters tolose customers to competitors who are willing to offer morefavorable payment terms to foreign buyers”
“Open account terms (i.e. providing trade credit) may help wincustomers in competitive markets”

Preview of the findings
We exploit an exogenous shock to competition in export markets
And find that increased competition leads exporters to providetrade credit and drop prices
The evidence suggests substitution between the two margins ofadjustment
Related literature
Access to finance and exporting (broader perspective): e.g.Manova (2008, JIE ); Amiti and Weinstein (2011, QJE ); Paravisiniet al. (2015, RStud); Chaney (2016, JEDC )
Domestic trade credit: e.g. Petersen and Rajan (1997,RFS );McMillan and Woodruff (1999,QJE ); Fisman and Raturi(2004,ReStat); Fabbri and Klapper (2016,JCF )
Financing terms in international trade: Eck et al. (2012, RWE );Schmidt-Eisenlohr (2013, JIE ); Eck et al. (2014, WE ); Antrasand Foley (2015, JPE ); Hoefele et al. (2016, CJE )
Impact of abolishing the MFA: e.g. Harrigan and Barrows(2009,ReStat); Khandelwal, Schott, and Wei (2013,AER))

Institutional Context and Data

A large shock to competition:The End of the Multi-Fibre Agreement
The MFA, a system of bilateral quotas governing the global tradein textiles and clothing since 1974, was dismantled in 2005. Thedecision was taken during the Uruguay Round which finished in1994.
During 1993-2003, Turkey and China were the leading exporters oftextiles and clothing into the EU market (together accounting for30% of imports to the EU).
Turkish exports have not been subject to any quota restrictionssince 1996 (when Turkey formed a customs union with the EU).
Chinese exports were subject to MFA quotas which were abolished(with some exceptions) on 1 January 2005.
Quota fill rates varied from below 10% to 100% in 2004, higherrates indicating greater constraint on Chinese exporters =⇒ agreater increase in competitive pressures after the quota removal.
Fill rates

Data
Universe of Turkey’s exports of T&C to EU15 for 2003-2005.
Data disaggregated by firm, product (6-digit HS product code),destination country, and year.
For each observation, dataset reports
Value (free-on-board),
Quantity (measured in specified units, e.g. number, pair, etc.),
Breakdown of financing: cash in advance, open account, letterof credit, and documentary collection.
Data on quota fill rates comes from Systeme Integre de Gestion deLicenses.

Financing terms
Cash in advance (CIA): importer pre-pays and receives thegoods later.
Open account (OA): payment is due after goods are deliveredin the destination (usually 30 to 90 days)—closest category totrade credit in domestic transactions.
Letter of credit (LC): payment is guaranteed by the importer’sbank provided that delivery conditions specified in the contracthave been met.
Documentary collection (DC): involves bank intermediationwithout payment guarantee—still more secure than OA and CIA.

Financing breakdown of Turkey’s T&Cexports
2002
EU Non-EU
Share of OA exports 0.60 0.58Share of CIA exports 0.01 0.03Share of LC exports 0.07 0.21Share of DC exports 0.32 0.18

Share of OA Exports before and after theEnd of the MFA
.2.4
.6.8
1S
hare
of O
A E
xport
s
0 .2 .4 .6 .8 1Quota fill rate
Year=2003 Year=2004 Year=2005
Year=2003 Year=2004 Year=2005
Notes: A marker represents the average share of OA exports over firms, products and destinationcountries for a given quota-fill rate and year. Lines represent fitted values of (uncond.) linear predictions.

Theoretical Motivation

Setup
A simplified version of Schmidt-Eisenlohr (2013) and Antras andFoley (2015) with heterogenous buyer valuations.
A Turkish exporter of an intermediate product meets a randomlymatched set of foreign buyers, indexed by k.
Each foreign buyer has a unit demand for the product, which shevalues at sk.
Buyer valuations are drawn from a common and knowndistribution g(sk) with positive support on the interval (s,∞) anda continuous cumulative distribution G(sk).
Exporter incurs a constant marginal cost that is normalized tozero.
All agents are risk neutral and have complete information abouteach others’ costs and preferences.

Exporter has the full bargaining power and makestake-it-or-leave-it offers to independent buyers.
If the offer is rejected, the buyer reverts to its outside option: u0,b.
We assume contractual frictions: contract negotiated at time t = 0is enforced with some probability λ which increases with rule oflaw in the relevant country.
Timing:
Under OA: exporter produces and ships the goods at t = 0→importer pays after one period.
Under CIA: importer pays at t = 0 →goods arrive at destination dafter one period
Under LC: importer’s bank guarantees payment to the exporterafter the arrival of goods at the destination.

Open account
With probability 1− λd, rule of law in destination country dbreaks down.
Turkish exporter can recover only a fraction γ ∈ (0, 1) of theagreed payment, pOA
k .
Participation constraint of the foreign buyer k:
E[ΠOAb,k ] =
sk − pOAk
1 + rd≥ u0,b
Expected profit of the Turkish exporter:
E[ΠOAe,k ] =
λdpOAk + (1− λd)γpOA
k
1 + r
rd and r denote cost of financing in destination d and in Turkey,respectively.

Cash in advance
With probability 1− λTUR, rule of law in Turkey breaks down.
Foreign buyer can recover only a fraction δ ∈ (0, 1) of theshipment value.
Participation constraint of the foreign buyer k:
E[ΠCIAb,k ] =
λTUR + (1− λTUR)δ
1 + rdsk − pCIA
k ≥ u0,b
Expected profits of the exporter and the importer:
E[ΠCIAe,k ] = pCIA
k

Letter of credit
Exporter receives payment with certainty.
The importer has to pay its bank an ad-valorem fee f > 1 whichincreases the cost of financing to f(1 + rd) > (1 + rd), and a fixedfee F > 0 to cover document handling and monitoring costs.
Expected profits of the exporter and the importer:
E[ΠLCb,k ] =
sk − pLCk1 + rd
− fpLCk − F ≥ u0,b
Expected profits of the exporter and the importer:
E[ΠLCe,k ] =
pLCk1 + r

Prices
The exporter sets price under each financing term such that thebuyer’s participation constraint binds:
pCIAk =
λTUR + (1− λTUR)δ
1 + rksk − u0,b,
pOAk = sk − (1 + rd)u0,b,
pLCk =sk − (1 + rd)(u0,b + F )
1 + f(1 + rd)

Choice of financing term
The exporter chooses the financing term that gives the highestexpected profits:
E[ΠCIAe,k ] =
λTUR + (1− λTUR)δ
1 + rdsk − u0,b,
E[ΠOAe,k ] =
λd + (1− λd)γ
1 + r(sk − (1 + rd)u0,b),
E[ΠLCe,k ] =
1
1 + r
sk − (1 + rd)(u0,b + F )
1 + f(1 + rd)
Compare OA (trade credit) to LC (bank) financing.
Consistent with negligible share of CIA financing in the data.
Also consistent with quality of institutions (λ) being weaker inTurkey than in EU15.

Share of OA financing
s∗: valuation of the marginal buyer—the exporter is indifferentbetween offering trade credit (OA) and asking for bank financing(LC)
E[ΠOAe (s∗)] = E[ΠLC
e (s∗)]
=⇒ s∗ = (1 + rd)u0,b +(1 + rd)F
1− λd(1 + f(1 + rd)),
where λd = λd + (1− λd)γ ∈ (0, 1).
For any sk s.t. sk < s∗, offering trade credit is more profitablethan asking for bank credit.
Share of export sales on trade credit:
µ(s∗) =
∫ s∗
sdG(sk)

Predictions: Response to increase incompetition (∆u0,b)
The share of export sales on trade credit increases with the outsideoption of foreign buyers, u0,b.
Proof

Average prices
Define the average price as
pd =
∫ s∗
s[sk − (1 + rd)u0,b]dG(sk) +
∫ ∞s∗
sk − (1 + rd)(u0,b + F )
1 + f(1 + rd)dG(sk)
Effect of u0,b on prices
dpedu0,b
= −(1 + rd)
[∫ s∗
sdG(sk) +
1
1 + f(1 + rd)
∫ ∞s∗
dG(sk)
]︸ ︷︷ ︸
Direct effect
+[pOA(s∗)− pLC(s∗)
]g(s∗)
ds∗
du0,b︸ ︷︷ ︸Indirect effect

Predictions: Response to increase incompetition (∆u0,b)
The effect of a change in the outside option of foreign buyers onthe average price of the exporter is twofold. It has a negative directeffect, which arises from a fall in the optimal price under eachfinancing term. It also has a positive indirect effect through thechange in the fraction of buyers sold on trade credit. The overalleffect depends on the relative magnitudes of the two effects.

Numerical example: price and trade creditadjustment
.2.4
.6.8
11.2
Avera
ge p
rices
0.2
.4.6
.8S
hare
of sale
s o
n tra
de c
redit (
µ)
.8 1 1.2 1.4 1.6u0,b
Share of sales on trade credit (left)
Average prices p (right)
Notes: The figure plots the average prices and the share of sales on trade credit against increasing valuesof u0,b.
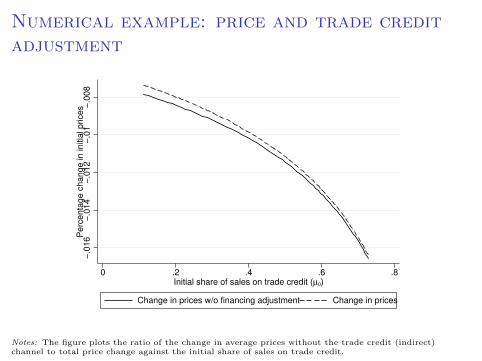
Numerical example: price and trade creditadjustment
−.0
16
−.0
14
−.0
12
−.0
1−
.008
Perc
enta
ge c
hange in initia
l prices
0 .2 .4 .6 .8Initial share of sales on trade credit (µ0)
Change in prices w/o financing adjustment Change in prices
Notes: The figure plots the ratio of the change in average prices without the trade credit (indirect)channel to total price change against the initial share of sales on trade credit.

Empirical Strategy and Results
Difference-in-differences approach
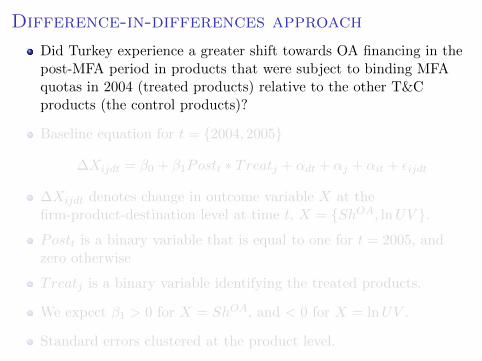
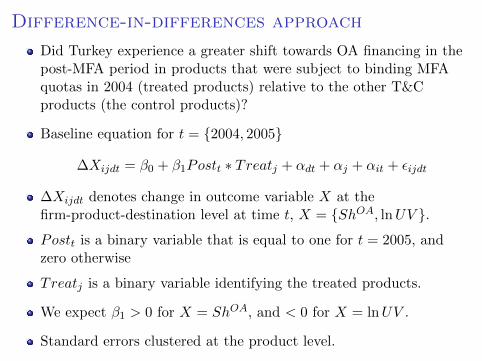
Did Turkey experience a greater shift towards OA financing in thepost-MFA period in products that were subject to binding MFAquotas in 2004 (treated products) relative to the other T&Cproducts (the control products)?
Baseline equation for t = {2004, 2005}
∆Xijdt = β0 + β1Postt ∗ Treatj + αdt + αj + αit + εijdt
∆Xijdt denotes change in outcome variable X at thefirm-product-destination level at time t, X = {ShOA, lnUV }.
Postt is a binary variable that is equal to one for t = 2005, andzero otherwise
Treatj is a binary variable identifying the treated products.
We expect β1 > 0 for X = ShOA, and < 0 for X = lnUV .
Standard errors clustered at the product level.
Difference-in-differences approach
Did Turkey experience a greater shift towards OA financing in thepost-MFA period in products that were subject to binding MFAquotas in 2004 (treated products) relative to the other T&Cproducts (the control products)?
Baseline equation for t = {2004, 2005}
∆Xijdt = β0 + β1Postt ∗ Treatj + αdt + αj + αit + εijdt
∆Xijdt denotes change in outcome variable X at thefirm-product-destination level at time t, X = {ShOA, lnUV }.
Postt is a binary variable that is equal to one for t = 2005, andzero otherwise
Treatj is a binary variable identifying the treated products.
We expect β1 > 0 for X = ShOA, and < 0 for X = lnUV .
Standard errors clustered at the product level.

Defining treatment
1 Binary treatment:
Treatj = 1 , if Quota fill ratej,t=2004 > 0.5
Treatj = 0 , Otherwise
2 Product-specific quota fill rate in 2004: Quota fill ratej,t=2004

Change in share of OA exports before theend of the MFA (t = 2004)
−.3
−.2
−.1
0.1
.2.3
∆S
hO
A
0 .2 .4 .6 .8 1
Quota fill rate
Notes: ∆ShOA denotes annual change in the share of exports on OA terms. A marker represents average
∆ShOA over firms, products and destination countries for a given quota-fill rate and year. Linesrepresent fitted values of (unconditional) linear predictions. The vertical line represents the quota fill rateof 0.5 as of 2004.

Change in share of OA exports before andafter the end of the MFA
−.3
−.2
−.1
0.1
.2.3
∆S
hO
A
0 .2 .4 .6 .8 1
Quota fill rate
Year=2004 Year=2005 Year=2004 Year=2005
Notes: ∆ShOA denotes annual change in the share of exports on OA terms. A marker represents average
∆ShOA over firms, products and destination countries for a given quota-fill rate and year. Linesrepresent fitted values of (unconditional) linear predictions. The vertical line represents the quota fill rateof 0.5 as of 2004.

Change in average prices before the end ofthe MFA (t = 2004)
−.2
0.2
.4.6
∆ln
UV
0 .2 .4 .6 .8 1
Quota fill rate
Notes: ∆ ln UV denotes annual change in the logarithm of unit values. A marker represents average∆ ln UV over firms, products and destination countries for a given quota-fill rate and year. Linesrepresent fitted values of (unconditional) linear predictions. The vertical line represents the quota fill rateof 0.5 as of 2004.

Change in average prices before and afterthe end of the MFA
−.2
0.2
.4.6
∆ln
UV
0 .2 .4 .6 .8 1
Quota fill rate
Year=2004 Year=2005 Year=2004 Year=2005
Notes: ∆ ln UV denotes annual change in the logarithm of unit values. A marker represents average∆ ln UV over firms, products and destination countries for a given quota-fill rate and year. Linesrepresent fitted values of (unconditional) linear predictions. The vertical line represents the quota fill rateof 0.5 as of 2004.

Summary statistics
2004 2005
Avg product per firm 8.620 8.940(10.548) (11.223)
Avg destination per firm 5.755 5.748(4.093) (4.046)
Avg product per firm-destination 4.520 4.682(5.109) (5.302)
Avg value per firm-product-dest (USD) 279,866 262,621(1,226,811) (1,153,157)
Treat Untreat Treat Untreat
Number of firms 338 1652 372 1780Number of products 95 313 95 316
Share of OA exports 0.697 0.658 0.771 0.691(0.422) (0.437) (0.388) (0.426)
Log of unit value 1.171 1.810 1.108 1.829(0.542) (1.163) (0.535) (1.168)
Log of value 10.324 10.322 10.226 10.281(2.007) (2.296) (1.961) (2.262)

Baseline results: Trade credit
∆ShOAijdt = β0 + β1Postt ∗ Treatj + αdt + αj + αit + εijdt
(1) (2) (3) (4)
Postt ∗ Treatj 0.0489∗∗∗ 0.0375∗
(0.0149) (0.0195)
Postt∗ Quota fill ratej,t=2004 0.0631∗∗∗ 0.0467∗
(0.0174) (0.0239)
N 17852 17852 17852 17852R2 0.0258 0.234 0.0259 0.234Country-year FE + + + +Product FE + + + +Firm-year FE + +

Baseline results: Prices
∆ lnUVijdt = β0 + β1Postt ∗ Treatj + αdt + αj + αit + εijdt
(1) (2) (3) (4)
Postt ∗ Treatj -0.0669∗∗∗ -0.0745∗∗∗
(0.0236) (0.0284)
Postt∗ Quota fill ratej,t=2004 -0.0985∗∗∗ -0.0839∗∗
(0.0279) (0.0370)
N 17852 17852 17852 17852R2 0.0511 0.271 0.0513 0.271Country-year FE + + + +Product FE + + + +Firm-year FE + +

Robustness checks
Placebo test Table
Longer time period Table
Controlling for survival Table

Substitution between providing tradecredit and offering price discount
Testing substitution
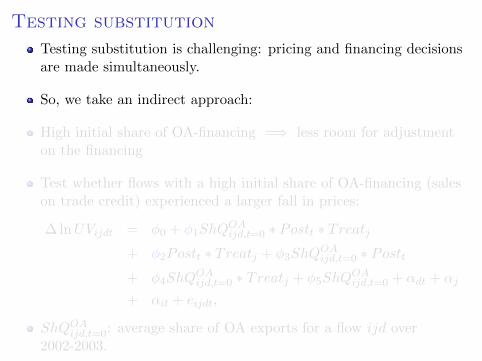
Testing substitution is challenging: pricing and financing decisionsare made simultaneously.
So, we take an indirect approach:
High initial share of OA-financing =⇒ less room for adjustmenton the financing
Test whether flows with a high initial share of OA-financing (saleson trade credit) experienced a larger fall in prices:
∆ lnUVijdt = φ0 + φ1ShQOAijd,t=0 ∗ Postt ∗ Treatj
+ φ2Postt ∗ Treatj + φ3ShQOAijd,t=0 ∗ Postt
+ φ4ShQOAijd,t=0 ∗ Treatj + φ5ShQ
OAijd,t=0 + αdt + αj
+ αit + eijdt,
ShQOAijd,t=0: average share of OA exports for a flow ijd over
2002-2003.

Testing substitution
Testing substitution is challenging: pricing and financing decisionsare made simultaneously.
So, we take an indirect approach:
High initial share of OA-financing =⇒ less room for adjustmenton the financing
Test whether flows with a high initial share of OA-financing (saleson trade credit) experienced a larger fall in prices:
∆ lnUVijdt = φ0 + φ1ShQOAijd,t=0 ∗ Postt ∗ Treatj
+ φ2Postt ∗ Treatj + φ3ShQOAijd,t=0 ∗ Postt
+ φ4ShQOAijd,t=0 ∗ Treatj + φ5ShQ
OAijd,t=0 + αdt + αj
+ αit + eijdt,
ShQOAijd,t=0: average share of OA exports for a flow ijd over
2002-2003.

Dependent variable: ∆ShOAijdt ∆ShOA
ijdt ∆ lnUVijdt ∆ lnUVijdtShQOA
ijd,t=0 ∗ Postt ∗ Treatj -0.0688∗ -0.119∗∗∗ -0.111∗ -0.122∗
(0.0408) (0.0442) (0.0589) (0.0730)
Postt ∗ Treatj 0.0778∗ 0.0921∗∗ 0.00275 -0.0301(0.0405) (0.0432) (0.0470) (0.0518)
ShQOAijd,t=0 ∗ Postt 0.178∗∗∗ 0.359∗∗∗ 0.0458 0.00157
(0.0151) (0.0323) (0.0325) (0.0436)
ShQOAijd,t=0 ∗ Treatt -0.0193 0.0403 0.0205 -0.00206
(0.0208) (0.0246) (0.0328) (0.0438)
ShQOAijd,t=0 -0.289∗∗∗ -0.474∗∗∗ 0.00848 0.0226
(0.0114) (0.0190) (0.0178) (0.0253)
N 13790 13790 13790 13790R2 0.121 0.341 0.0538 0.276Country-year FE + + + +Product FE + + + +Firm-year FE + +
Conclusions
Provision of trade credit is another margin of adjustment toheightened competition in export markets.
Increase in competition after the end of the MFA forced Turkishexporters of quota-bound T&C products to provide more tradecredit.
The shock also forced Turkish exporters to lower prices.
There is some evidence of substitution between adjustmentthrough extending trade credit and lowering prices.

Conclusions
Price responses to competitive shocks may be underestimatedunless the trade credit channel is accounted for.
Policy implication: ability to provide financing can give producers,particularly emerging market producers that are viewed as riskybusiness partners, a competitive edge in foreign markets.

Distribution of Quota Fill Rates as of 2004
0.1
.2.3
.4.5
Fra
ction
0 .2 .4 .6 .8 1
Quota fill rate
Notes: The figure shows the distribution of quota fill rates (as of 2004) in our data. Observations wherequota fill rates are equal to zero are excluded for visibility as they account for about 70% of the sample.
Back

Placebo date
Assign January 2004 as the placebo date of the MFA quota removaland restrict the sample to the 2003-2004 period:
Dependent variable: ∆ShOAijdt ∆ lnUVijdt
D2004t ∗ Treatj 0.0242 0.00837(0.0293) (0.0618)
N 7717 7717R2 0.251 0.281Country-year FE + +Product FE + +Firm-year FE + +
Back

Long-term effectsDY eart is a dummy variable that takes on the value one for t = Y ear,and zero otherwise.
Dependent variable: ∆ShOAijdt ∆ lnUVijdt
D2004t ∗ Treatj 0.0209 -0.0128(0.0319) (0.0577)
D2005t ∗ Treatj 0.0491∗ -0.0837∗
(0.0297) (0.0444)
D2006t ∗ Treatj 0.0124 -0.0849(0.0341) (0.0528)
D2007t ∗ Treatj 0.0187 -0.0577(0.0282) (0.0511)
N 25062 25062R2 0.236 0.268Country-year FE + +Product FE + +Firm-year FE + +
Back

Controlling for survival
Selection bias if exports on OA terms in 2004 were more likely tosurvive in the post-MFA period.
Follow Mulligan and Rubinstein (2008, QJE ) and Paravasini etal.(2015, RStud) to address the possible selection bias.
Estimate the probability that a given export flow (ijd, 2004)continued in 2005.
Estimate the baseline specification in first differences for the wholesample and for 40th percentile of the estimated continuationprobability.

Probit OLS
Dependent variable: Survival probability ∆ShOAijdt ∆ShOA
ijdt ∆ lnUVijdt ∆ lnUVijdtAll All > 40th pctl All > 40th pctl
Postt ∗ Treatj 0.0380∗∗ 0.0333 -0.0654∗∗ -0.0926∗∗∗
(0.0158) (0.0223) (0.0266) (0.0358)
lnXijd,2003 0.194∗∗∗
(0.0104)
ShQOAijd,t=0 -0.00001
(0.0590)
Treat -0.0261(0.0614)
N 8454 17852 7909 17852 7909R2 0.156 0.147 0.175 0.178Country FE +Firm FE + + + + +Country-year FE + + + +Product FE + + + +
Back
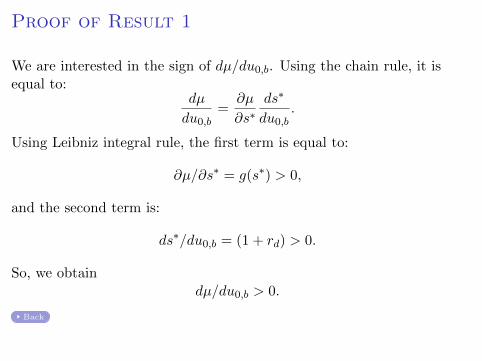
Proof of Result 1
We are interested in the sign of dµ/du0,b. Using the chain rule, it isequal to:
dµ
du0,b=
∂µ
∂s∗ds∗
du0,b.
Using Leibniz integral rule, the first term is equal to:
∂µ/∂s∗ = g(s∗) > 0,
and the second term is:
ds∗/du0,b = (1 + rd) > 0.
So, we obtaindµ/du0,b > 0.
Back


