18
Doosan Corporation Quarterly Business Review 1Q 2015 2015. 4
Doosan Corporation Quarterly Business Review 1Q 2015
2015. 4

1
The information herein is provided for your information purposes only and contains
preliminary figures which may be materially different from the final figures.
Forecasts and projections contained in this material are based on current business environments and management strategies, and they may differ from the actual results upon changes and unaccounted variables. We make no guarantees and assume no responsibility for the use of information provided. We trust your decisions will be based on your own independent judgement.
Financial data in this presentation is on a IFRS consolidated and IFRS parent basis.
Disclaimer

Table of Contents
I. 1Q15 Results
II. 2015 Business Plan
III. In-house Business Results & Outlook
IV. Appendix
2
2분기 실적 (별도 기준)
(Unit : KRW bn, %)
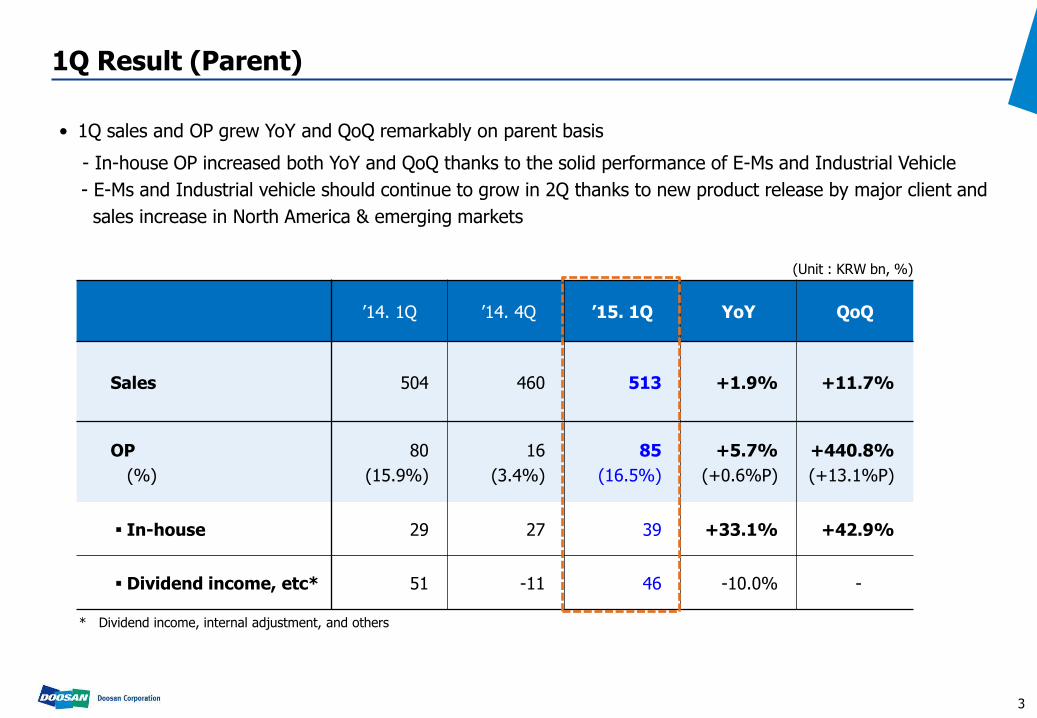
• 1Q sales and OP grew YoY and QoQ remarkably on parent basis
- In-house OP increased both YoY and QoQ thanks to the solid performance of E-Ms and Industrial Vehicle
- E-Ms and Industrial vehicle should continue to grow in 2Q thanks to new product release by major client and
sales increase in North America & emerging markets
* Dividend income, internal adjustment, and others
1Q Result (Parent)
3
’14. 1Q ’14. 4Q ’15. 1Q YoY QoQ
Sales 504 460 513 +1.9% +11.7%
OP
(%)
80
(15.9%)
16
(3.4%)
85
(16.5%)
+5.7%
(+0.6%P)
+440.8%
(+13.1%P)
▪ In-house 29 27 39 +33.1% +42.9%
▪ Dividend income, etc* 51 -11 46 -10.0% -

2분기 실적 (연결 기준)
• Despite strong performance of in-house business, consolidated sales and OP slightly declined due to
lower earnings from subsidiaries
- 1Q subsidiaries results fell due to sales decrease of Doosan Heavy as large-scale overseas EPC projects
neared completion and one-off restructuring cost from Doosan Infracore
- 2Q earnings to improve significantly from large-scale order recognition of Doosan Heavy, continuing
sales expansion of Doosan Infracore, and resuming housing business of E&C
(unit : KRW bn, %)
2014. 1Q 2014. 4Q 2015. 1Q YoY QoQ
▪ Sales 4,688 5,641 4,600 -1.9% -18.5%
- In-house 449 453 455 +1.3% +0.3%
- Subsidiaries 4,239 5,188 4,146 -2.2% -20.1%
▪ OP
(%)
241
(5.1%)
225
(4.0%)
187
(4.1%)
-22.5%
(-1.1%P)
-16.9% (+0.1%P)
- In-house 29 27 39 +33.1% +42.9%
- Subsidiaries 212 198 148 -30.2% -25.2%
1Q15 Results (Consolidated)
4

Table of Contents
I. 1Q15 Results
II. 2015 Business Plan
III. In-house Business Results & Outlook
IV. Appendix
5

2분기 실적 (별도 기준)
(unit : KRW bn, %)
• 2015 business plan for the parent company is
- Sales to increase 6.3% YoY to KRW 2.15 tn
- OP to grow 58.4% YoY to KRW 248 bn (excluding one-off dividend income from disposing KFC)
due to 1) growing in-house business thanks to product mix improvement of E-Ms, 2) sales increase from
domestic and North America markets for industrial vehicle divisions
2015 Business Plan (Parent)
* ’14 Sales and OP are excluding one-off dividend income from disposing KFC ** Dividend, internal adjustment, and others
2014* 2015(P) YoY
Sales 1,895 2,015 +6.3%
OP
(%)
156
(8.3%)
248
(12.3%)
+58.4%
(+4.0%P)
▪ In-house 113 152 +35.0%
▪ Dividend, etc. * 44 95 +119.3%
6

2분기 실적 (연결 기준)
• 2015 consolidated business plan is
- Sales to grow 2.8% to KRW 21 tn
- OP to increase 22.0% to KRW 1.23 tn
Subsidiaries’ OP to grow from 1) increase in new orders of Doosan Heavy, 2) continued growth of
Infracore’s North America business, 3) order increase of E&C’s engineering business, and 4) growing
new engine orders for LNG ship (unit : KRW bn, %)
2014 2015(P) YoY
▪ Sales 20,434 21,015 +2.8%
- In-house 1,793 1,869 +4.3%
- Subsidiaries 18,641 19,146 +2.7%
▪ OP
(%)
1,008
(4.9%)
1,230
(5.9%)
+22.0%
(+1.0%P)
- In-house 113 152 +35.0%
- Subsidiaries 895 1,078 +20.4%
7
2분기 실적 (별도 기준) 2015 Business Plan (Consolidated)

Table of Contents
I. 1Q15 Results
II. 2015 Business Plan
III. In-house Business Results & Outlook
IV. Appendix
8

• 1Q sales increased KRW 17bn to KRW 154 bn, and OP grew to KRW 13 bn on both YoY and QoQ basis
• OPM grew YoY on the back of increasing sales of high-end products thanks to new smart phone launches and
client diversification
Quarterly sales and OP of E-Ms
(unit : KRW bn)
1Q15 Highlights
’15.1Q
154
4Q
136
3Q
164
2Q
138
’14.1Q
156
Strengthened Overseas Business
• Improved margin by streaming the production process
of low-end product and integrating production lines
• Reduced lines to increase productivity
• Saved cost via adjusting personnels
Cost Structure Innovation
E-Ms ― 1Q Results (Parent)
Sales
2
1
• Enhanced profitability of China plant via expanding
sales to Chinese clients
- Sales to China: 1Q14 KRW 17 bn → 1Q15 KRW 30 bn
(Increased 78.3% YoY)
• Stabilized Circuit Foil Luxembourg business by
improving production yield
- OP 1Q14 KRW -0.2bn → 1Q15 KRW 2.1 bn
9

• Expand overseas business and increase M/S of High-end CCL1)
– FCCL: Maintain M/S of flagship models and expand business to low-end smart phone market
– PKG : Expand M/S within mobile memory market (85%) and increase sales in non-memory market (AP, Camera Module)
– Overseas: Diversify sales channel to Chinese set makers
• OP to grow from increasing sales of high-end products, especially PKG CCL
– High-end CCL contribution : 45% in 2Q14 → 51% in 2Q15
• Reduce cost via local sourcing and improving production efficiency
– Enhance production efficiency in domestic/China plants
• Expand line-up to related industries
– Automobile CCL and Mobile Film
• Developing new core technology to enter new business areas
– Automobile, Energy, Infrastructure
Continuing Growth
Improving Profitability
Growth Driver
전자 – 2분기 전망 및 추진전략_ 실적간담회 배포용
1) FCCL, PKG CCL, Network Board CCL
E-Ms ― 2Q Outlook and Strategy
10

• 1Q Sales and OP grew both YoY and QoQ basis thanks to sales increase in US and emerging market
Quarterly Sales & OP Trends 1Q Results
Strengthened Domestic Leadership
Enhanced Overseas Market Position
• Maintained domestic market shares 52%
• Secured additional growth driver
- Prepared to launch Tier-4 model
- Expanded Class III line-ups
•Continued to receive large sized fleet orders
• Participated in Chicago ProMat 2015
• Official dealer meeting in North American dealers
• Increase sales to rental companies in US
• Received fleet orders from emerging markets
(unit : KRW bn)
143
159 153
146 151
'14.1Q 2Q 3Q 4Q '15.1Q
Sales
OP 12 12 10
8
13
'14.1Q 2Q 3Q 4Q '15.1Q
Industrial Vehicle ― 1Q Results(Parent)
2
1
11

• Expect sales to grow 17% as the US and European markets continue to grow
• As Tier-3 production will discountue in 1H, sales volume from pre-order in the domestic market should
grow in 2Q
• Accelerate growth in UK by acquiring a forklift rental company
• Secure new orders from emerging countries and diversify client base
Domestic
US
EU
Emerging Countries
2,585
883
720
1,472
’15. 1Q 2Q(F)
4,757
5,660
(unit: unit, %)
2Q Sales Outlook (Unit base)
YoY
Total 5,660
+14.4%
+38.6%
+12.0%
+8.0%
+15.4%
Industrial Vehicle ― 2Q Outlook
(unit: unit)
2Q Sales breakdown
+19%
12

Industrial Vehicle ― Rushlift acqusition
13
Back Ground Synergy & Outlook
1 Overview
• Established in 1980 based in Wibtoft, UK
• Sales GBP 29.5M, EBIT 3.2M(10.9%) in 2013
• Owns 4,500 units of forklifts
• Sales network (5 branches in UK)
2 Purpose of M&A
• Expand to downstream business to improve
profitability
• Secure top-tier competitiveness by expanding
business portfolio (Finished goods + Downstream)
• Nationwide network
(6 direct Offices/depots + 19 Regional dealers)
• Secure new national accounts in UK
• Increase sales of parts/service business
1 Additional Growth Momentum
• Strengthen business capability through experiencing
downstream businesses
• Business model enhancement
(finished goods sales, parts, Rental etc.)
2 Downstream Business
* Company Owned Store

• 1Q sales increased QoQ in spite of sluggish market in China while OP grew both YoY and QoQ thanks to cost
reduction from restructuring
Quarterly Sales Trends 1Q Results & 2Q Outlook
(unit : KRW bn)
Sales
OP
88 79
73 83 83
4Q 3Q ’15.1Q 2Q ’14.1Q
-2
0 0 2
4
’14.1Q 4Q ’15.1Q 3Q 2Q
1Q – Diversified Clients & product / Improved profitability
• Supplied travelling / swing/ pumps to Chinese local
clients
–1Q M/S in China 17.6% (YoY 2.4%P ↑)
• Increased sales to advanced markets
– Supplied Pilot model(travelling device) & began
mass-production to advanced makers
• Continue to expand sales to advanced makers
– Supply mid-sized travelling device to advanced makers
– Supply to Bobcat in 4Q with customized travelling device
• Enter non-excavator markets
– Expand A/M business through developing popular model
Mottrol ― 1Q Results and 2Q Outlook (Parent)
1
2Q – Expansion of non-excavator components 2
14

• Normalized operation including SCM and secured order pool in domestic and the US markets
• Considering to build a plant in South Korea to strengthen competitiveness in domestic market
15
• Enhanced marketing in the US and Korea market
• Established global sourcing channels
• Normalized service operation in Korea
• Secured price competitiveness for M400 product
• Achieved 100% of M/S in domestic PEMFC market
(excluding transportation FCs)
• Strengthen marketing to receive new orders
• Establish plan to improve quality and productivity
• Reorganize R&D divisions
• Review validity of establishing plant in Korea
• Expand production capacity of the US plant
• Target 80% of M/S in domestic PEMFC market
Fuel Cell ― 1Q Results & 2Q Outlook
1Q Results and 2Q Strategy
1Q – Normalize Operation
2Q – Expand Capacity / Enhance Sales 2
1
Plan Acutal
17
1Q and 2015 sales outlook
(unit : KRW bn)
1Q Sales
19
2015 Sales
Plan Forecast
156
181 +16%
+9%

Table of Contents
I. 1Q15 Results
II. 2015 Business Plan
III. In-house Business Results & Outlook
IV. Appendix
16
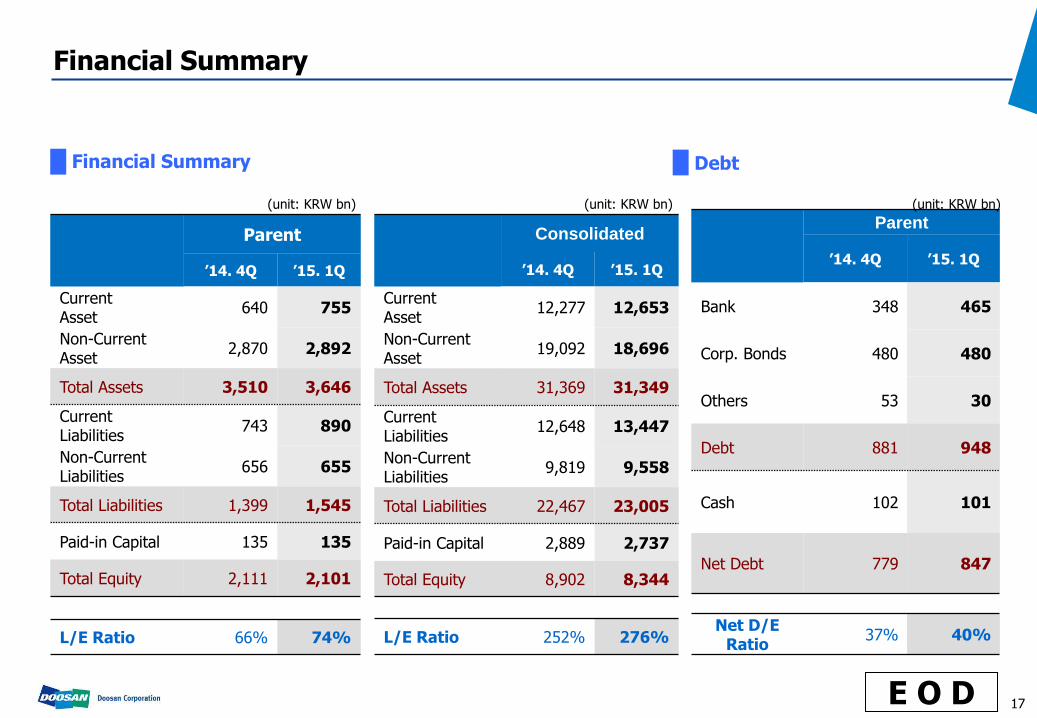
Financial Summary
E O D
Financial Summary
Parent
’14. 4Q ’15. 1Q
Current Asset
640 755
Non-Current Asset
2,870 2,892
Total Assets 3,510 3,646
Current Liabilities
743 890
Non-Current Liabilities
656 655
Total Liabilities 1,399 1,545
Paid-in Capital 135 135
Total Equity 2,111 2,101
L/E Ratio 66% 74%
(unit: KRW bn)
Consolidated
’14. 4Q ’15. 1Q
Current Asset
12,277 12,653
Non-Current Asset
19,092 18,696
Total Assets 31,369 31,349
Current Liabilities
12,648 13,447
Non-Current Liabilities
9,819 9,558
Total Liabilities 22,467 23,005
Paid-in Capital 2,889 2,737
Total Equity 8,902 8,344
L/E Ratio 252% 276%
Debt
Parent
’14. 4Q ’15. 1Q
Bank 348 465
Corp. Bonds 480 480
Others 53 30
Debt 881 948
Cash 102 101
Net Debt 779 847
Net D/E Ratio
37% 40%
17
(unit: KRW bn) (unit: KRW bn)


