The Implementation of Effective Key Performance Indicators to Manage Major Hazard Risks Euan Fenelon – Global Operational Integrity and RD&I Manager Doreen Gray – Operational Integrity Project Manager 18 June 2013
Transcript
The Implementation of Effective Key
Performance Indicators to Manage
Major Hazard Risks
Euan Fenelon – Global Operational Integrity and RD&I Manager
Safety Contact August 2009 Sayano-Shushenskaya Hydro Plant, Russia – turbine top cover failed, resulting flood killed 76 workers. Investigation found lack of maintenance, flawed plant modifications and a culture of risk taking.
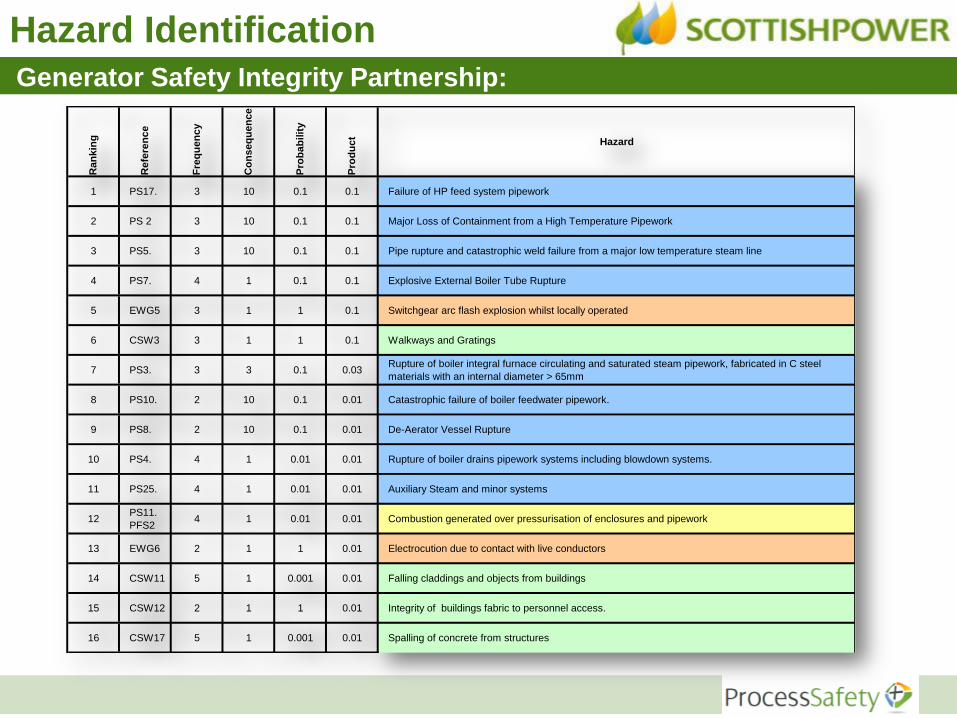
10 PS4. 4 1 0.01 0.01 Rupture of boiler drains pipework systems including blowdown systems.
11 PS25. 4 1 0.01 0.01 Auxiliary Steam and minor systems
12PS11.
PFS2 4 1 0.01 0.01 Combustion generated over pressurisation of enclosures and pipework
13 EWG6 2 1 1 0.01 Electrocution due to contact with live conductors
14 CSW11 5 1 0.001 0.01 Falling claddings and objects from buildings
15 CSW12 2 1 1 0.01 Integrity of buildings fabric to personnel access.
16 CSW17 5 1 0.001 0.01 Spalling of concrete from structures
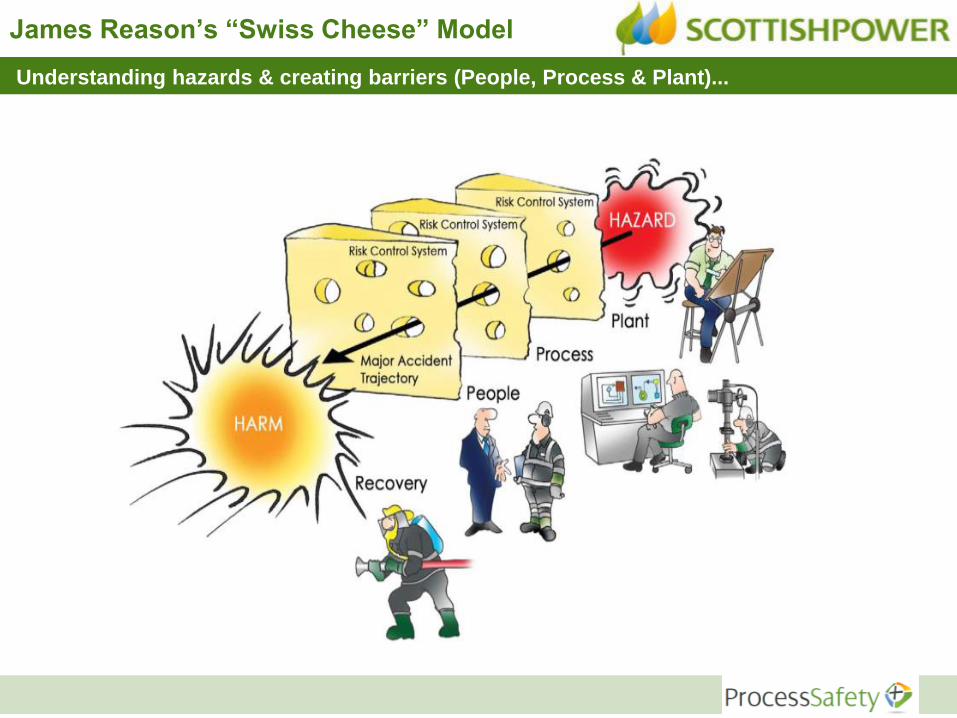
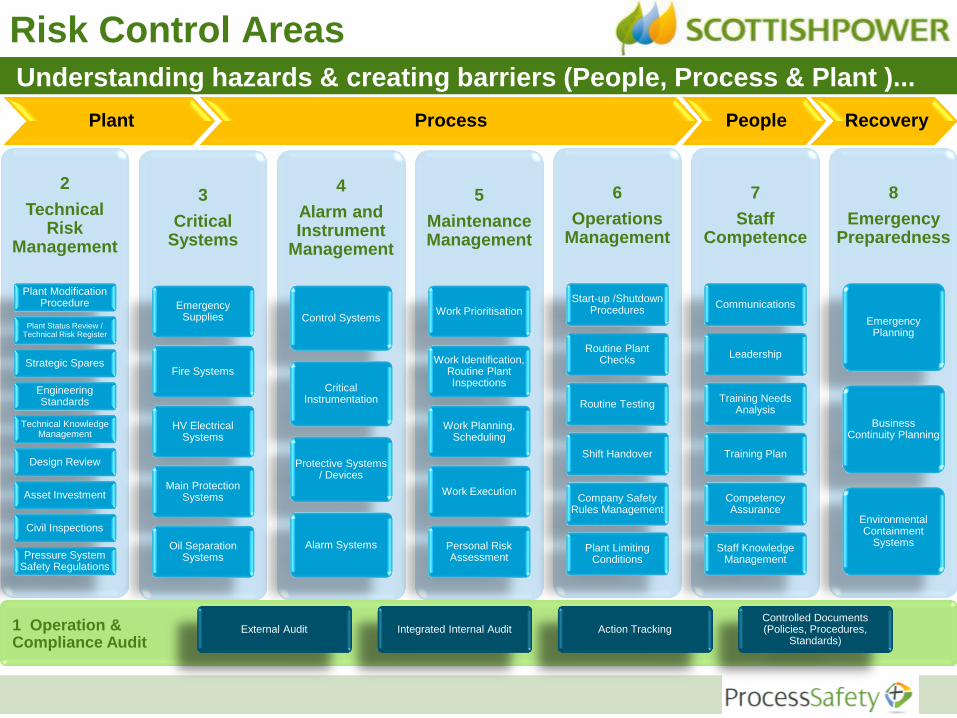
Understanding hazards & creating barriers (People, Process & Plant )...
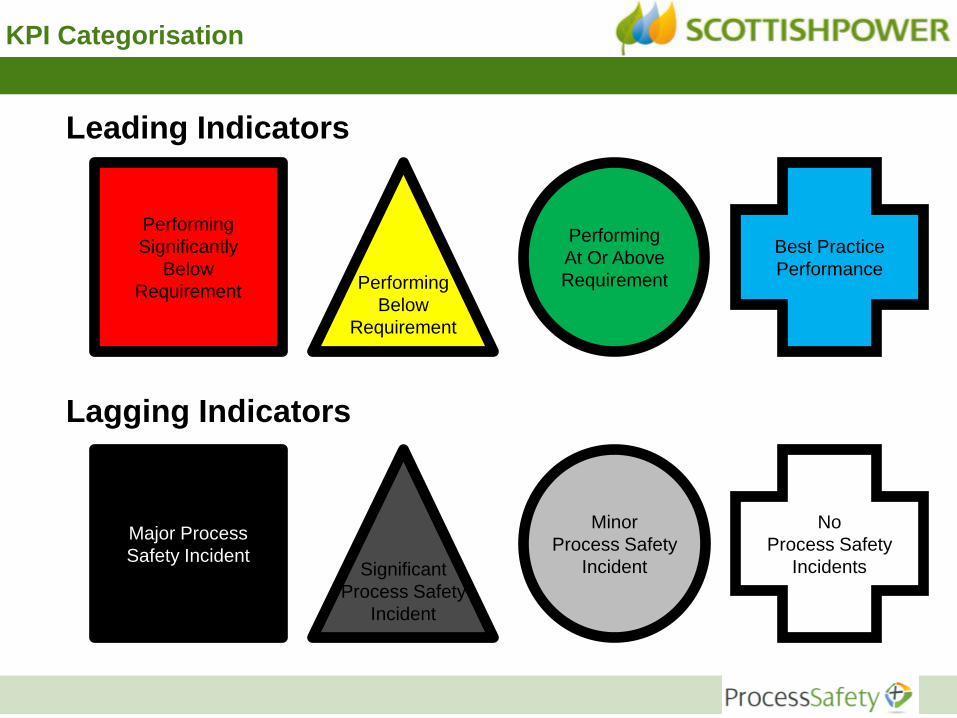
Applying the KPIs
Further Guidance Not All Indicators are of Equal Importance...
Operational Control Indicators
Lagging Indicators
• Active Monitoring and Logging:
• Breaches Of Plant Limiting Conditions (eg overpressure, overspeed, overtemp)
• Control Loops Out Of Control
• Equipment In Manual
• Operation of protection systems
• Failure of protection systems
Leading Indicators
• Inspection and Maintenance of Control Systems and Critical Systems
• Alarm Management
• Control Loop Performance
• Completion Of Operational Routine Checks / Testing
• Shift Logging & Handover
• Plant Overrides and Defeat of interlock
• Safety Critical Systems not available
Generic
Lagging Indicators
• Incident Reporting and Investigation:
• Near Misses (eg demand on safety system)
• Loss Of Containment (eg release of high pressure steam)
• Process Safety Incident (eg major equipment damage)
Leading Indicators
• Critical processes undertaken correctly
• Operations
• Maintenance
• Engineering
Programme Indicators
Leading Indicators
• Statutory Inspections Completed (eg PSSR)
• Audits To Programme
• Action Closure
• Training and Competence
• Procedures Up To Date
• Improvement programmes
High Low
Predictive of Incident
KPI Development
Based on Key Concepts in HSG 254...
Measuring the Gaps
Overall Site Matrix
Measuring the Gaps
Risk Control Area status
Measuring the Gaps
Monthly Reports for Governance
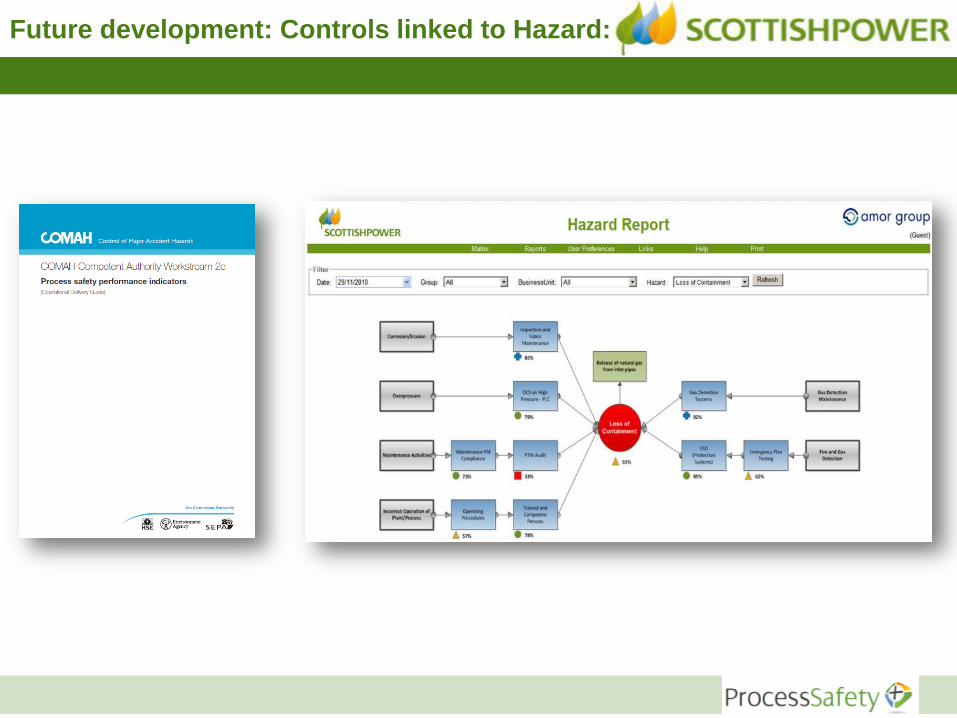
Future development: Controls linked to Hazard:
Review Level
Scottish Power
Generation
Generation Groups
Power Stations
Governance Body
Health and Safety Steering Group
Generation Risk Review Meeting
Coal RRM
LN
Gas RRM
RH , DC, SH, BB, COGEN
Hydro RRM
CN, GW, LK
Review Guidance
Consolidated Indicators
Major or Key Incidents
Business Wide Indicators
Significant Incidents
Trends
Group Indicators
Significant & Moderate Incidents
Close-out rates
Local Indicators
All Incidents
Frequency
Monthly
Monthly
Monthly
Daily
Group Governance Process Cascade up approach...
21
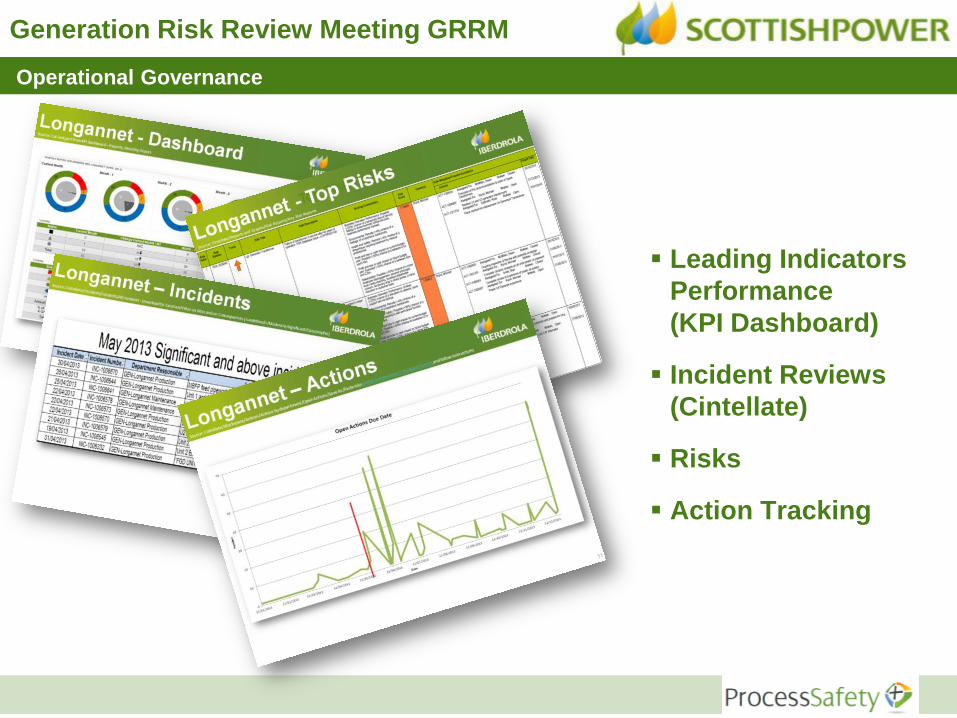
Generation Risk Review Meeting GRRM
Leading Indicators
Performance
(KPI Dashboard)
Incident Reviews
(Cintellate)
Risks
Action Tracking
Operational Governance
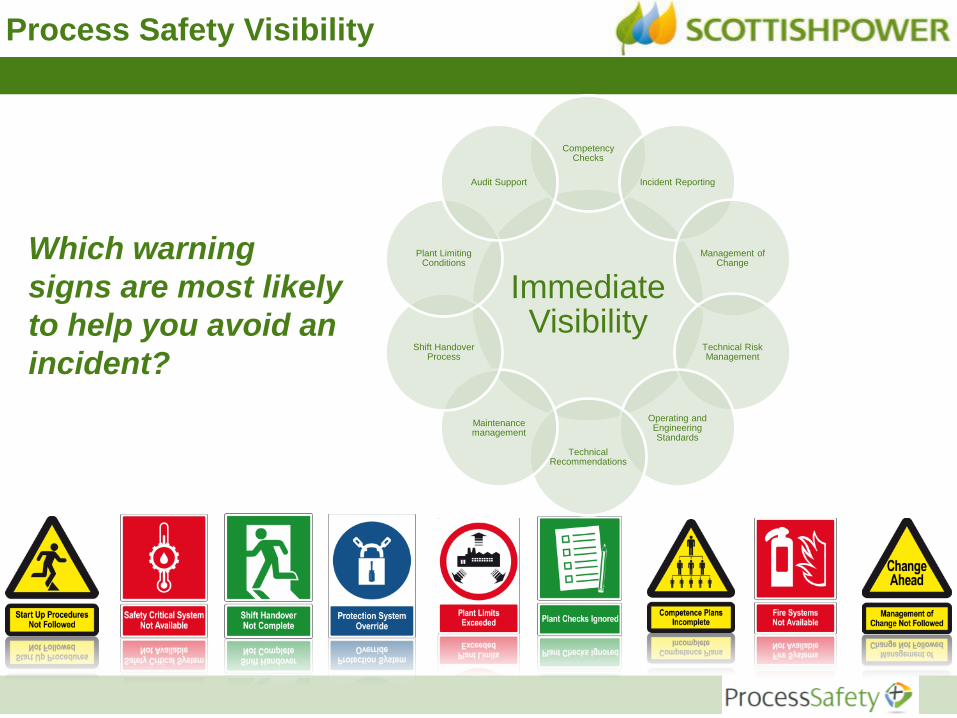
Process Visibility
Immediate Visibility
Quality
Plant Limiting Conditions
Incident Reporting
Management of Change
Technical Risk Management
Operating and Engineering Standards
Technical Recommendations
Maintenance management
Staff Competency
Operations Management
Shift Handover Process
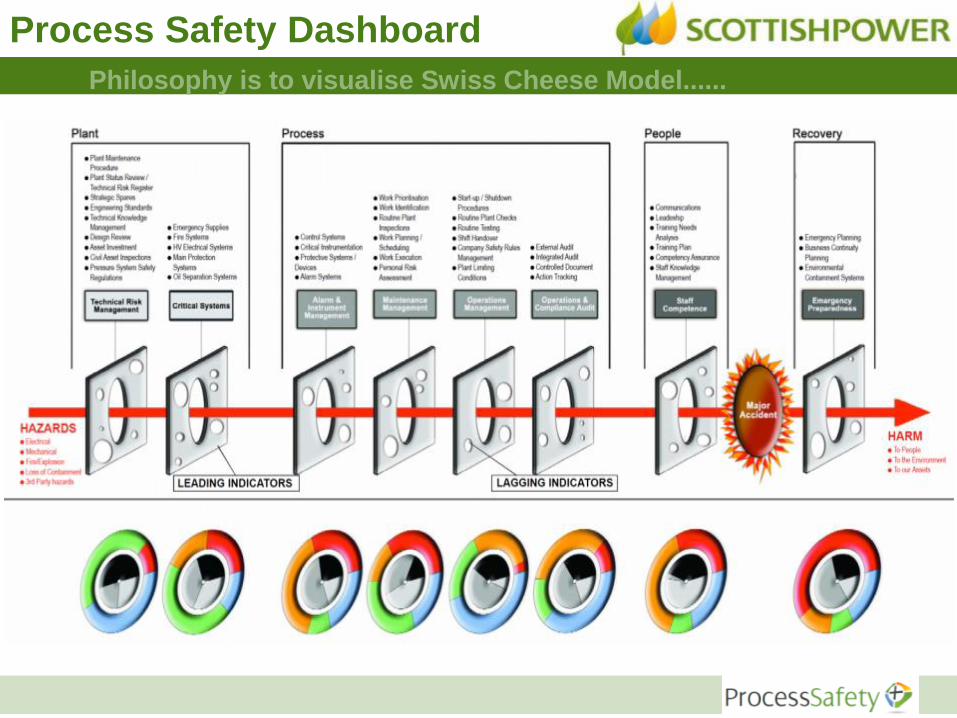
Near real-time measurement of business processess ...
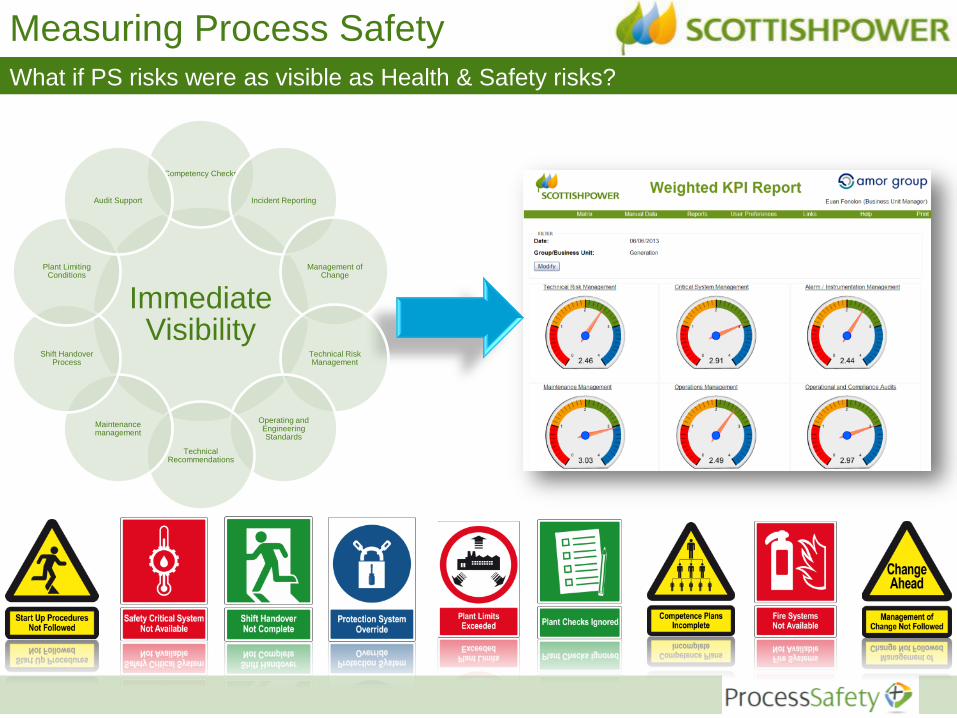
What if PS risks were as visible as Health & Safety risks?
Measuring Process Safety
Immediate Visibility
Competency Checks
Incident Reporting
Management of Change
Technical Risk Management
Operating and Engineering Standards
Technical Recommendations
Maintenance management
Shift Handover Process
Plant Limiting Conditions
Audit Support
Near-time visibility of leading indicators for key risk control systems across all power stations – providing ‘at a glance’” assessment of plant condition and the performance of key processes;
Risk Ranking of KPIs based on risk and Alarp principles
Improved reporting of incidents and near misses, enabling information to be shared more widely and repeat incidents to be prevented;
Provision of timely, accurate and comprehensive information to support the governance of process safety through early identification and proactive management of risks;
A governance framework to ensure that performance and actions are reviewed on a monthly basis.
Delivering Operational Capability
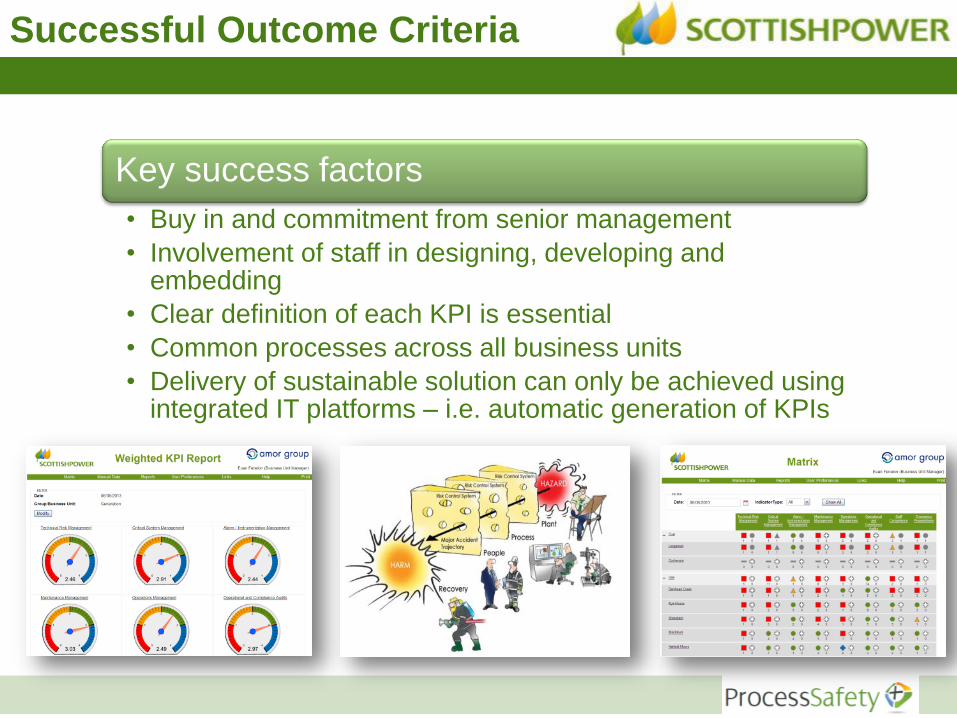
Successful Outcome Criteria
Key success factors
• Buy in and commitment from senior management
• Involvement of staff in designing, developing and embedding
• Clear definition of each KPI is essential
• Common processes across all business units
• Delivery of sustainable solution can only be achieved using integrated IT platforms – i.e. automatic generation of KPIs


![[Doreen Virtue] Angel Medicine](https://static.documents.pub/doc/80x56/577ccf351a28ab9e788f2842/doreen-virtue-angel-medicine.jpg)