127
June 2010 | Argonne National Laboratory, USA Dose and Risk Assessment Dr. Charley Yu Dr. David LePoire Argonne National Laboratory
June 2010 | Argonne National Laboratory, USA
Dose and Risk Assessment
Dr. Charley YuDr. David LePoireArgonne National Laboratory

June 2010 | Argonne National Laboratory, USA
ENVIRONET Environmental Remediation Training Course
Dose and Risk Assessment
Introduction to dose and risk assessment and radionuclide transport in the environment
Overview of pathway analyses and data requirements
Dose conversion coefficients and risk coefficients (slope factors)
Developing dose- and risk-based cleanup criteria
Overview of selected dose and risk assessment codes and models– Presentation of different codes and models and their applicability– Demonstration of NNL ReCLAIM screening assessment tool – Demonstration of RESRAD family of codes
2

June 2010 | Argonne National Laboratory, USA
ENVIRONET Environmental Remediation Training Course
3
Dose Assessment for the Derivation of Site-Specific Cleanup Guidelines
Determine exposure scenario(s)
Determine exposure pathway(s)
Gather data
Understand calculations
Calculate guidelines
Conduct cleanup
June 2010 | Argonne National Laboratory, USA
ENVIRONET Environmental Remediation Training Course
4
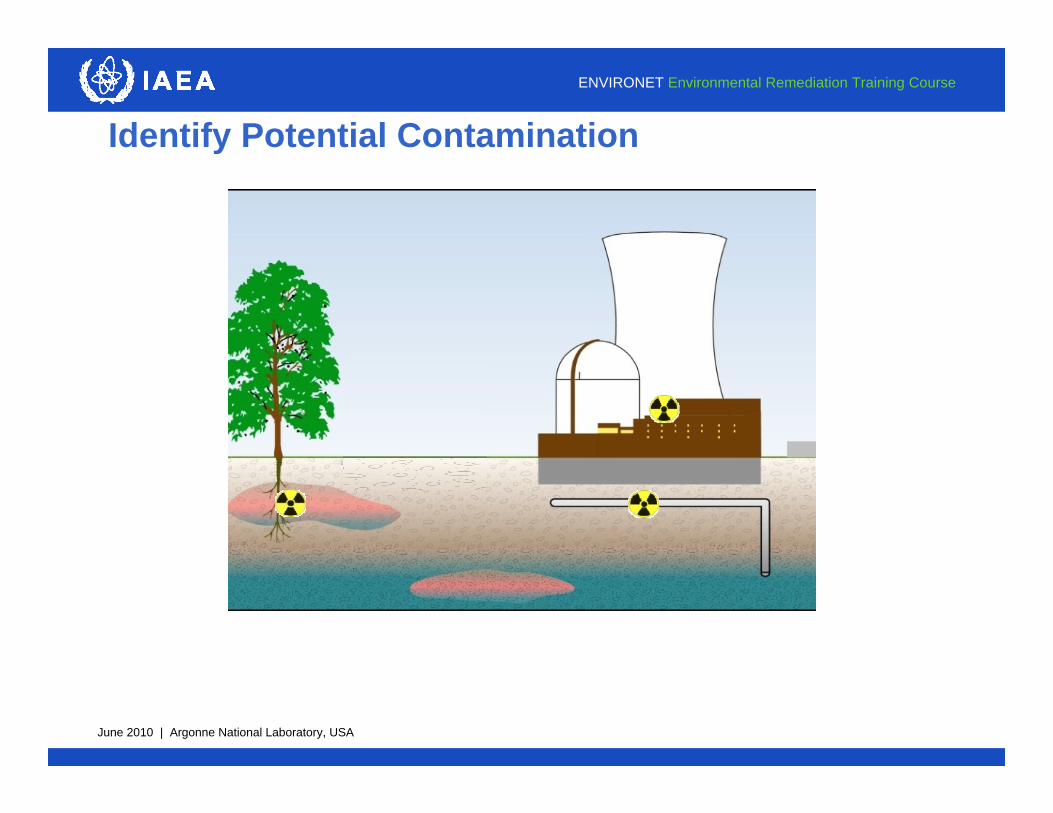
Identify Potential Contamination

June 2010 | Argonne National Laboratory, USA
ENVIRONET Environmental Remediation Training Course
5
Determine Exposure Scenarios

June 2010 | Argonne National Laboratory, USA
ENVIRONET Environmental Remediation Training Course
6
Determine Exposure Pathways
Dust,Radon
DrinkingWater
Fish
Plant Foods
MeatMilk
Radioactively Contaminated Material in SoilRadioactively Contaminated Material in Soil
SoilIngestion
Infiltration
Leaching
External
SurfaceWaterGroundwater

June 2010 | Argonne National Laboratory, USA
ENVIRONET Environmental Remediation Training Course
7
Gather Data
Dust,Radon
DrinkingWater
Fish
Plant Foods
MeatMilk
Radioactively Contaminated Material in SoilRadioactively Contaminated Material in Soil
SoilIngestion
Infiltration
Leaching
External
SurfaceWaterGroundwater
Contamination(size, nuclides, concentration, release)
Scenario(land use, time, diet, shielding)
Environment(precipitation, groundwater)

June 2010 | Argonne National Laboratory, USA
ENVIRONET Environmental Remediation Training Course
Perform Calculations
8

June 2010 | Argonne National Laboratory, USA
ENVIRONET Environmental Remediation Training Course
9
Understand Calculations
U-238

June 2010 | Argonne National Laboratory, USA
ENVIRONET Environmental Remediation Training Course
10
Calculate Cleanup Guidelines

June 2010 | Argonne National Laboratory, USA
ENVIRONET Environmental Remediation Training Course
11
Generate Operational Guidelines
Dose Limit
(1 mSv/yr)
Regulations Pathway Analysis Field Implementation
Dust
DrinkingWater
Fish
Plant Foods
MeatMilk
Radioactively Contaminated Material in SoilRadioactively Contaminated Material in Soil
SoilIngestion
LeachingExternal
SurfaceWaterGroundwater
Single Radionuclide DCGLs
Operational DCGLs(compliance demonstrated with MARSSIM)
Sum of Ratios
R
r rs
rsS
s DCGLCon
1 ,
,
11

June 2010 | Argonne National Laboratory, USA
ENVIRONET Environmental Remediation Training Course
12
Cleanup
June 2010 | Argonne National Laboratory, USA
ENVIRONET Environmental Remediation Training Course
13
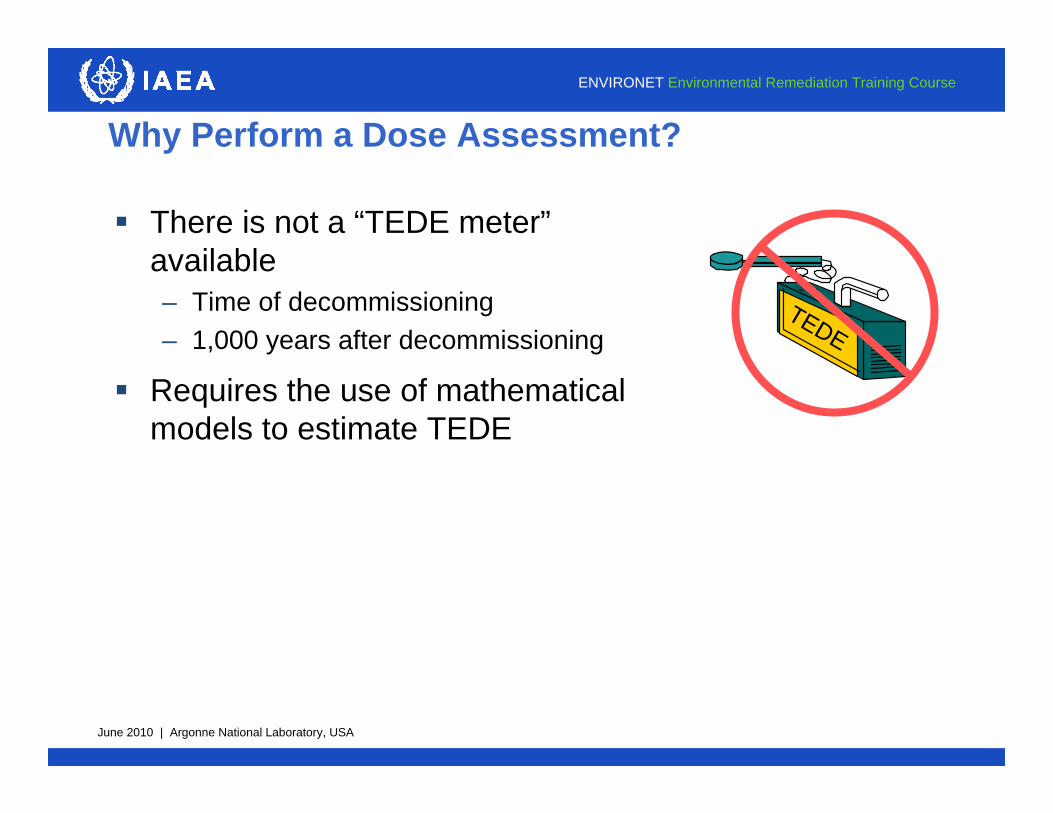
Why Perform a Dose Assessment?
There is not a “TEDE meter”available– Time of decommissioning– 1,000 years after decommissioning
Requires the use of mathematical models to estimate TEDE
TEDE

June 2010 | Argonne National Laboratory, USA
ENVIRONET Environmental Remediation Training Course
14
Why Perform a Dose Assessment?
Example Regulation: 10 CFR 20, Subpart E“A site will be considered acceptable for unrestricted use if the residual radioactivity that is distinguishable from background radiation results in a TEDE to an average member of the critical group that does not exceed 25 mrem (0.25 mSv) per year, including that from groundwater sources of drinking water, and that the residual radioactivity has been reduced to levels that are as low as reasonably achievable (ALARA).”

June 2010 | Argonne National Laboratory, USA
ENVIRONET Environmental Remediation Training Course
15
Why Perform a Dose Assessment?
Effective Dose Equivalent or Total Effective Dose Equivalent (TEDE)– External dose + 50-year committed effective dose equivalent– External + Inhalation + Ingestion
External + Inhalation + Ingestion < 1 mSv/yr– 0.25 mSv /yr: NRC dose limit
In Addition:“When calculating TEDE to the average member of the critical group the licensee shall determine the peak annual TEDE dose expected within the first 1,000 years after decommissioning”

June 2010 | Argonne National Laboratory, USA
ENVIRONET Environmental Remediation Training Course
16
Compliance Demonstration
Soil Guideline or DCGL Development– Derive acceptable residual radioactive concentrations
(DCGLs) for each radionuclide based on TEDE. Licensee must then prove the site meets the DCGLs. For multiple sources/radionuclides the “Sum of Fractions” must be less than 1.
Dose Modeling– Uses actual or expected radionuclide concentrations to
estimate TEDE. Site must be below 0.25 mSv/yr.

June 2010 | Argonne National Laboratory, USA
ENVIRONET Environmental Remediation Training Course
17
What is Dose Modeling?
Dose modeling involves using radiological assessment models to determine the dose to an individual from residual radioactive material
A licensee would input final residual radioactive material concentrations into the model to predict the dose to the individual.
Often this is called the “forward” calculation– Radionuclides Environmental Pathways Dose
June 2010 | Argonne National Laboratory, USA
ENVIRONET Environmental Remediation Training Course
18
What is a Soil Guideline or DCGL?
Derived Concentration Guideline Level
Uses computer codes to estimate residual radioactive material concentrations so that the dose to an individual is below the dose limit
Often this is called the “backward” calculation– Dose Limit Environmental Pathways Concentration
Derived separately for each radionuclide based on its maximum dose
Requires the use of the “Sum of Fractions” if multiple radionuclides or sources are present

June 2010 | Argonne National Laboratory, USA
ENVIRONET Environmental Remediation Training Course
19
RESRAD, an internationally utilized model, successfully addresses the critical question "How clean is clean enough?"
Accepted for use by government regulatory agencies• DOE (Designated by Order 5400.5)• NRC (NUREG/CR-1757)• EPA • State agencies
In use for about 20 years• Evaluation of more than 300 cleanup
sites• More than 100 training workshops• International recognition
Example Software: RESRAD – A Regulatory Tool for Determining the Allowable RESidual RADioactivity in Site Cleanup
June 2010 | Argonne National Laboratory, USA
ENVIRONET Environmental Remediation Training Course
20
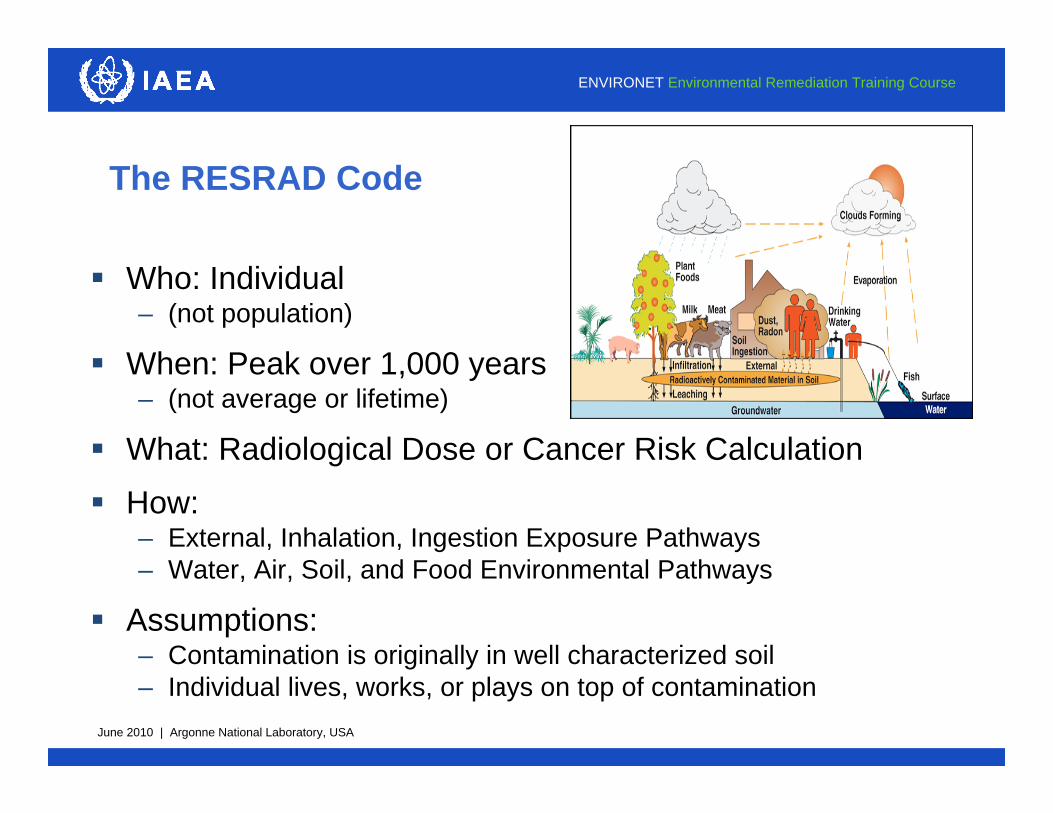
The RESRAD Code
Who: Individual – (not population)
When: Peak over 1,000 years – (not average or lifetime)
What: Radiological Dose or Cancer Risk Calculation
How: – External, Inhalation, Ingestion Exposure Pathways– Water, Air, Soil, and Food Environmental Pathways
Assumptions:– Contamination is originally in well characterized soil– Individual lives, works, or plays on top of contamination

June 2010 | Argonne National Laboratory, USA
ENVIRONET Environmental Remediation Training Course
21
Exposure Pathways Considered in RESRAD: (Resident Farmer Scenario)
Dust,Radon
DrinkingWater
Fish
Plant Foods
MeatMilk
Radioactively Contaminated Material in Soil
SoilIngestion
Infiltration
Leaching
External
SurfaceWaterGroundwater

June 2010 | Argonne National Laboratory, USA
ENVIRONET Environmental Remediation Training Course
22
Exposure Pathways Considered in RESRAD: (Industrial Use Scenario)
Dust,Radon
DrinkingWater
Radioactively Contaminated Material in Soil
SoilIngestion
Infiltration
Leaching
External
GroundwaterSurface
Water

June 2010 | Argonne National Laboratory, USA
ENVIRONET Environmental Remediation Training Course
23
RESRAD Contains an Array of Parameters for Pathway Analysis in Performing Comprehensive Risk Assessment
On-SiteDirect Exposure
On-Site AirConcentration
Dust/H-3
Radon
Plant Foods
Livestock Meat
Milk
Aquatic Foods
On-Site WaterContamination
On-Site SoilContamination
ExternalRadiation
Ingestion
Effective Dose
Equivalent/Excess
Cancer Riskto an
ExposedIndividual
ResidualRadioactive
MaterialIn Soil
SourceEnvironmental
PathwayExposurePathway
Dose orCancer Risk
InhalationOn-Site Biotic Contamination

June 2010 | Argonne National Laboratory, USA
ENVIRONET Environmental Remediation Training Course
24
Documentation of the RESRAD Computer Code
Chapters: – Pathway analysis – Derivation of soil guidelines – User’s guide for RESRAD– Verification & Validation
Appendices include detailed discussions on – Pathway models– Source factors– Distribution coefficients– Estimation of off-site doses– Special tritium and carbon-14 models– Uncertainty analysis

June 2010 | Argonne National Laboratory, USA
ENVIRONET Environmental Remediation Training Course
25
Supporting Documentation
Parameters– Data Collection Handbook to Support Modeling the Impacts of Radioactive
Material in Soil [4/93] – Development of Probabilistic RESRAD 6.0 and RESRAD-BUILD 3.0
Computer Codes [11/00]– A Compilation of Radionuclide Transfer Factors for the Plant, Meat, Milk and
Aquatic Food Pathways and the Suggested Default Values for the RESRAD Code [8/93]
Testing– Verification of RESRAD [6/94]– RESRAD Benchmarking Against Six Radiation Exposure Pathway Models
[10/94]– Evaluation of Area Factor for Finite Area Sources for Inhalation Dose
Calculations [7/98]

June 2010 | Argonne National Laboratory, USA
ENVIRONET Environmental Remediation Training Course
26
Definitions
Verification – Refers to the task or procedure by which a mathematical
solution to an arbitrarily complex problem is tested for internal mathematical consistency and accuracy
Validation– Refers to the task or procedure by which the mathematical
model is tested against accurately measured, independent sets of field or laboratory observations made over the range of conditions for which application of the model is intended

June 2010 | Argonne National Laboratory, USA
ENVIRONET Environmental Remediation Training Course
27
RESRAD Validation
Conducted leaching experiment (batch and column tests) to validate leaching model
Participating in international code-comparison exercises – VAMP, BIOMOVS II, BIOMASS and EMRAS – in some cases, using Chernobyl data
June 2010 | Argonne National Laboratory, USA
ENVIRONET Environmental Remediation Training Course
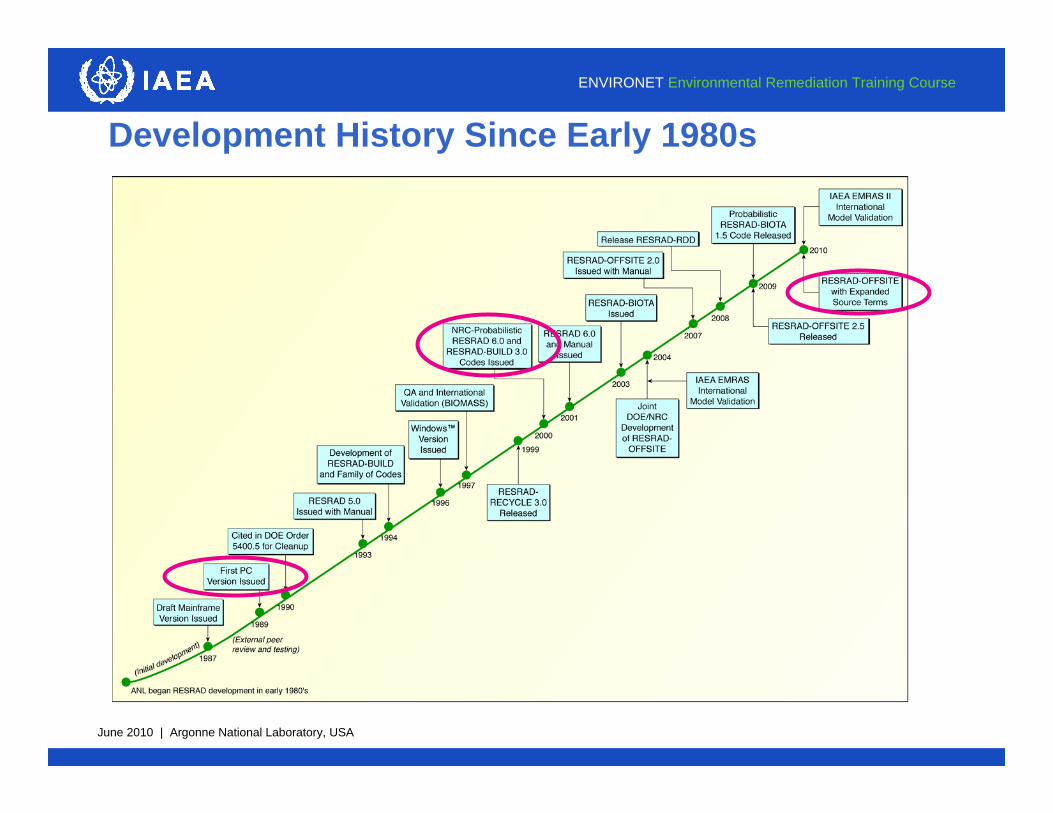
Development History Since Early 1980s
28
June 2010 | Argonne National Laboratory, USA
ENVIRONET Environmental Remediation Training Course
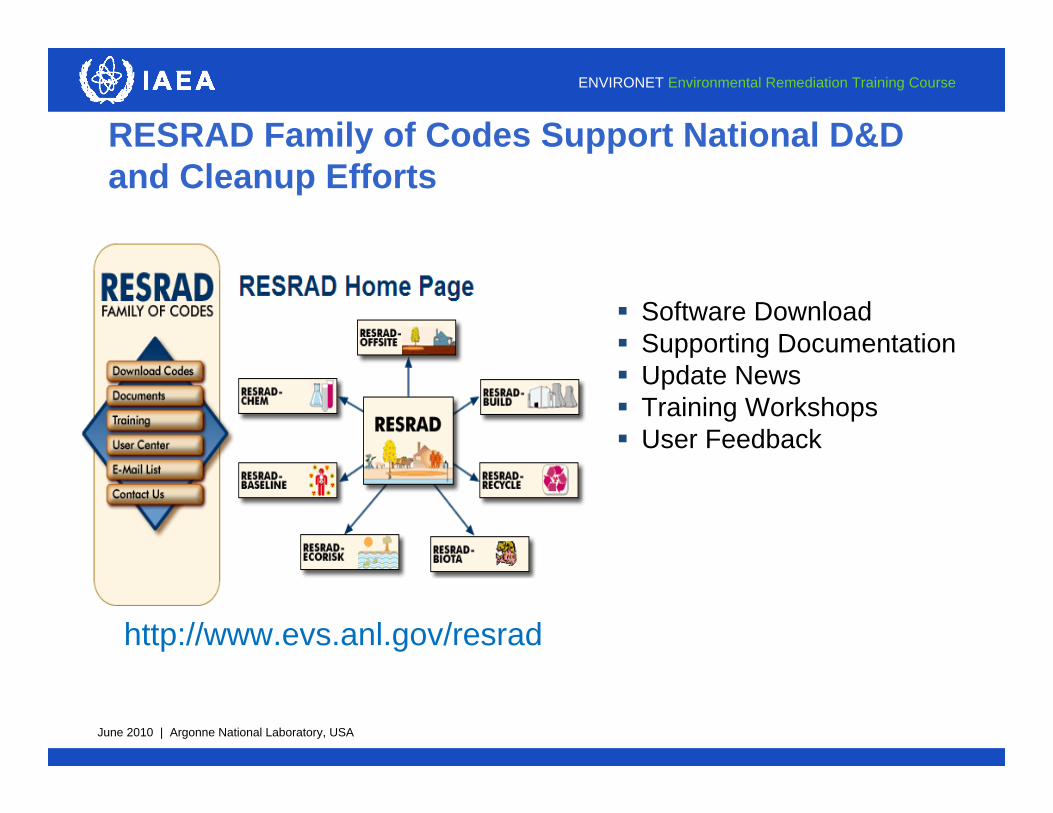
RESRAD Family of Codes Support National D&D and Cleanup Efforts
29
http://www.evs.anl.gov/resrad
Software Download Supporting Documentation Update News Training Workshops User Feedback
June 2010 | Argonne National Laboratory, USA
ENVIRONET Environmental Remediation Training Course
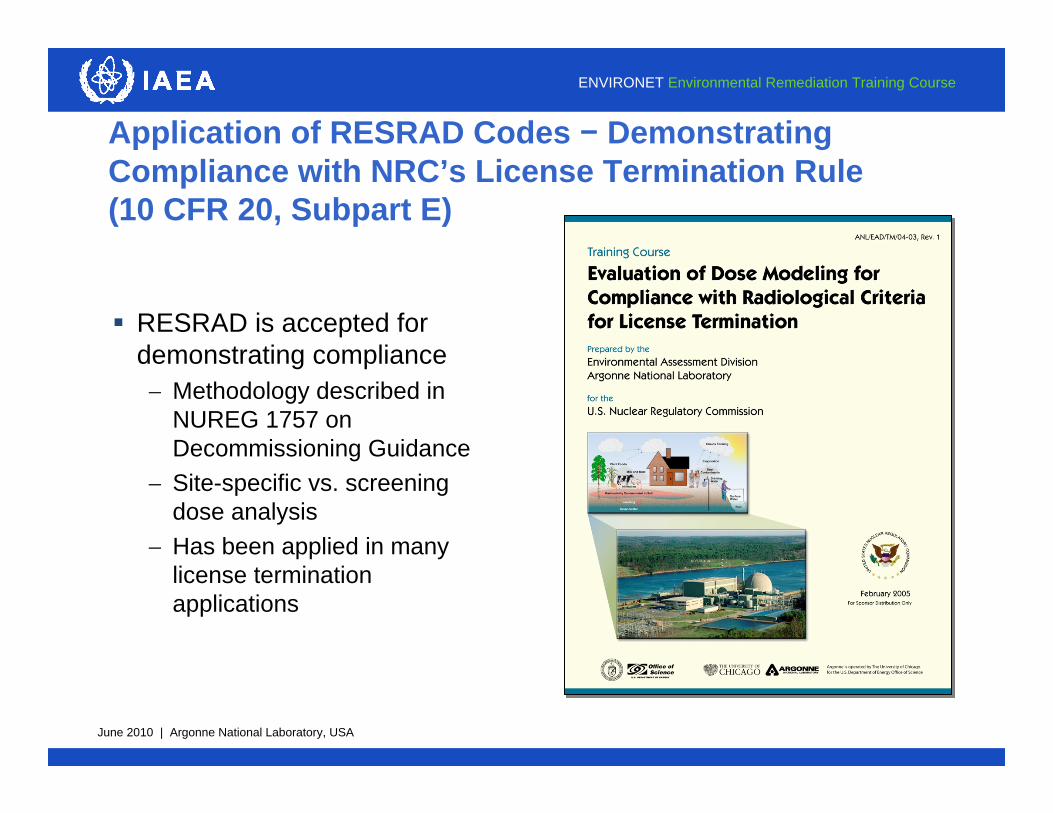
Application of RESRAD Codes − Demonstrating Compliance with NRC’s License Termination Rule (10 CFR 20, Subpart E)
RESRAD is accepted for demonstrating compliance Methodology described in
NUREG 1757 on Decommissioning Guidance
Site-specific vs. screening dose analysis
Has been applied in many license termination applications

June 2010 | Argonne National Laboratory, USA
Dose and Risk Assessment Demonstrations
Dr. Charley YuDr. David LePoireArgonne National Laboratory

June 2010 | Argonne National Laboratory, USA
ENVIRONET Environmental Remediation Training Course
2
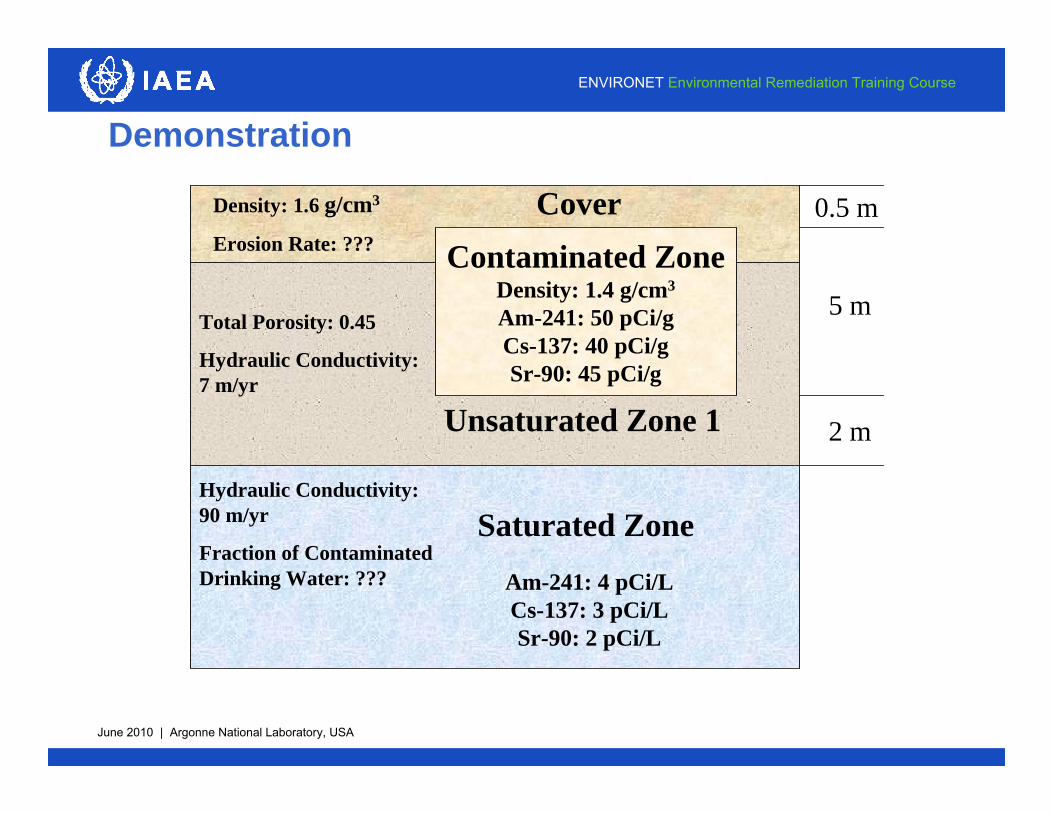
DemonstrationPrecipitation: 1.3 m/y
Irrigation: 0 m/y
<------12 m----->
Current Scenario/Site HistoryRESonant RADiological Industries is a former general manufacturer of small sources. Residues from plant operations were placed in a waste disposal pit until the plant ceased operations in 1969. Today, the site is vacant except for a single maintenance worker who checks the site 5 times weekly. This worker spends approximately 2 hours per visit at the site, and is indoors about 1 hour of that time. Drinking water is provided by a well located downgradient of the contaminated zone.
June 2010 | Argonne National Laboratory, USA
ENVIRONET Environmental Remediation Training Course
3
Demonstration
Contaminated ZoneDensity: 1.4 g/cm3
Am-241: 50 pCi/gCs-137: 40 pCi/gSr-90: 45 pCi/g
Total Porosity: 0.45
Hydraulic Conductivity: 7 m/yr
Hydraulic Conductivity: 90 m/yr
Fraction of Contaminated Drinking Water: ???
Unsaturated Zone 1
Cover
Saturated Zone
Am-241: 4 pCi/LCs-137: 3 pCi/LSr-90: 2 pCi/L
0.5 m
5 m
2 m
Density: 1.6 g/cm3
Erosion Rate: ???

June 2010 | Argonne National Laboratory, USA
ENVIRONET Environmental Remediation Training Course
RESRAD (onsite)
Methodology

June 2010 | Argonne National Laboratory, USA
ENVIRONET Environmental Remediation Training Course
5
RESRAD Pathways
Nine major environmental pathways are available in RESRAD– External (Ground)– Inhalation
• Particulates• Radon
– Ingestion• Soil• Water• Plant• Meat• Milk• Aquatic Foods
On-SiteDirect Exposure
On-Site AirConcentration
Dust/H-3
Radon
Plant Foods
Livestock Meat
Milk
Aquatic Foods
On-Site WaterContamination
On-Site SoilContamination
ExternalRadiation
Ingestion
Effective Dose
Equivalent/Excess
Cancer Riskto an
ExposedIndividual
ResidualRadioactive
MaterialIn Soil
SourceEnvironmental
PathwayExposurePathway
Dose orCancer Risk
InhalationOn-Site Biotic Contamination
June 2010 | Argonne National Laboratory, USA
ENVIRONET Environmental Remediation Training Course
6
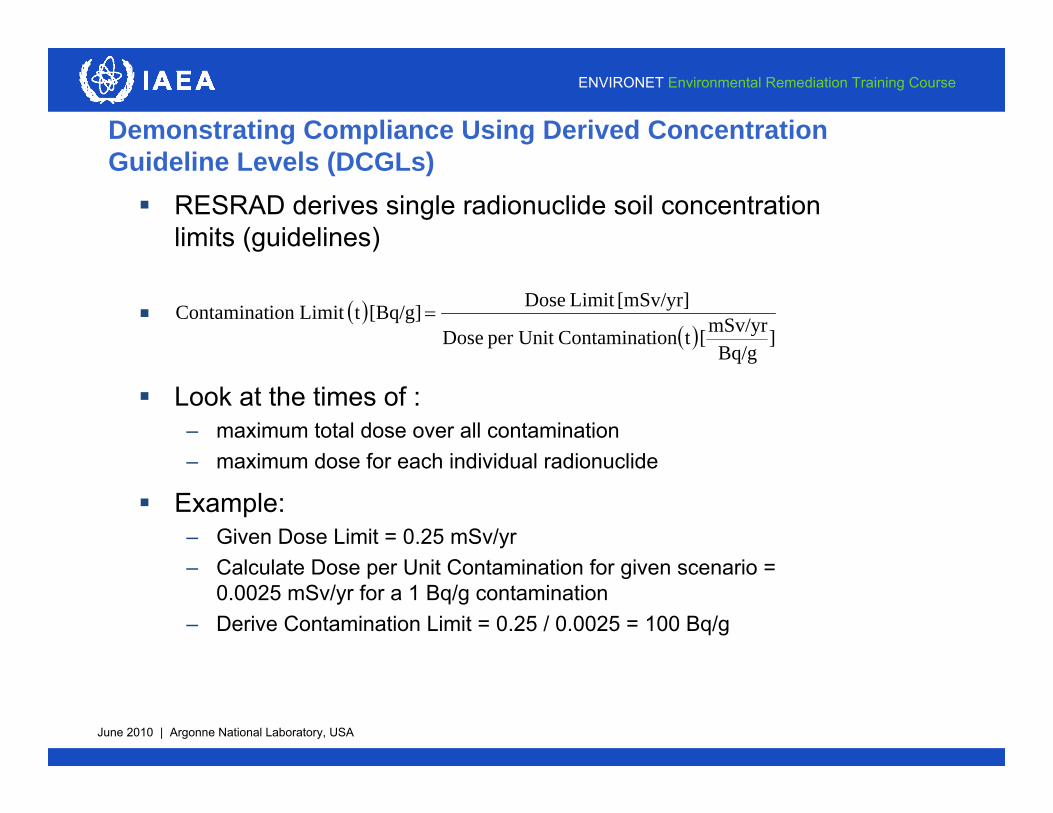
Demonstrating Compliance Using Derived Concentration Guideline Levels (DCGLs) RESRAD derives single radionuclide soil concentration
limits (guidelines)
Look at the times of :– maximum total dose over all contamination – maximum dose for each individual radionuclide
Example:– Given Dose Limit = 0.25 mSv/yr– Calculate Dose per Unit Contamination for given scenario =
0.0025 mSv/yr for a 1 Bq/g contamination– Derive Contamination Limit = 0.25 / 0.0025 = 100 Bq/g
]
Bq/gmSv/yr[ tionContaminatper Unit Dose
[mSv/yr]Limit Dose[Bq/g] tLimit ion Contaminat

June 2010 | Argonne National Laboratory, USA
ENVIRONET Environmental Remediation Training Course
7
Data Requirements Contamination:
– Size, contaminants, shielding, release
Environment:– Precipitation, groundwater, wind– Nuclide specific:
• How does the nuclide travel relative to water?• How is the nuclide incorporated into food relative to soil?
Scenario:– Land use, diet
Dose Conversion Factors– Hazard per unit of exposure
Radionuclide Information– Decay rates, decay products
June 2010 | Argonne National Laboratory, USA
ENVIRONET Environmental Remediation Training Course
8
Calculation of the Dose to Source Ratio
Dose = – Sum over exposure pathways (ingestion, inhalation, external)– Sum over environmental pathways (water, soil, air, food)– Sum over potential radionuclides accounting for decay and
ingrowth of original contaminant

June 2010 | Argonne National Laboratory, USA
ENVIRONET Environmental Remediation Training Course
9
Dose Conversion Factors (DCFs) External exposure pathway:
– Infinite depth volume factors (mSv/yr per Bq/g)
Inhalation pathway:– Inhalation factors (mSv/Bq)
Ingestion pathways:– Ingestion factors (mSv/Bq)
References: External DCFs - Federal Guidance Report No.12 (1993)– Inhalation/Ingestion DCFs - FGR No.11 (1988)

June 2010 | Argonne National Laboratory, USA
ENVIRONET Environmental Remediation Training Course
10
Dose Conversion Factor/Risk Factor Libraries
Using the Dose Conversion Factor Editor– Users can modify DCFs
• Select a more appropriate DCF• Create a new DCF
– Users can modify slope factors• HEAST 2001• FGR 13 Morbidity• FGR 13 Mortality• User Specified

June 2010 | Argonne National Laboratory, USA
ENVIRONET Environmental Remediation Training Course
11
Factors Affecting Source Lossmixing layer
erosion
leaching
timet (0)
timet (n)
uncontaminatedcover
contaminatedzone
unsaturated/saturated
zones
decay
June 2010 | Argonne National Laboratory, USA
ENVIRONET Environmental Remediation Training Course
12
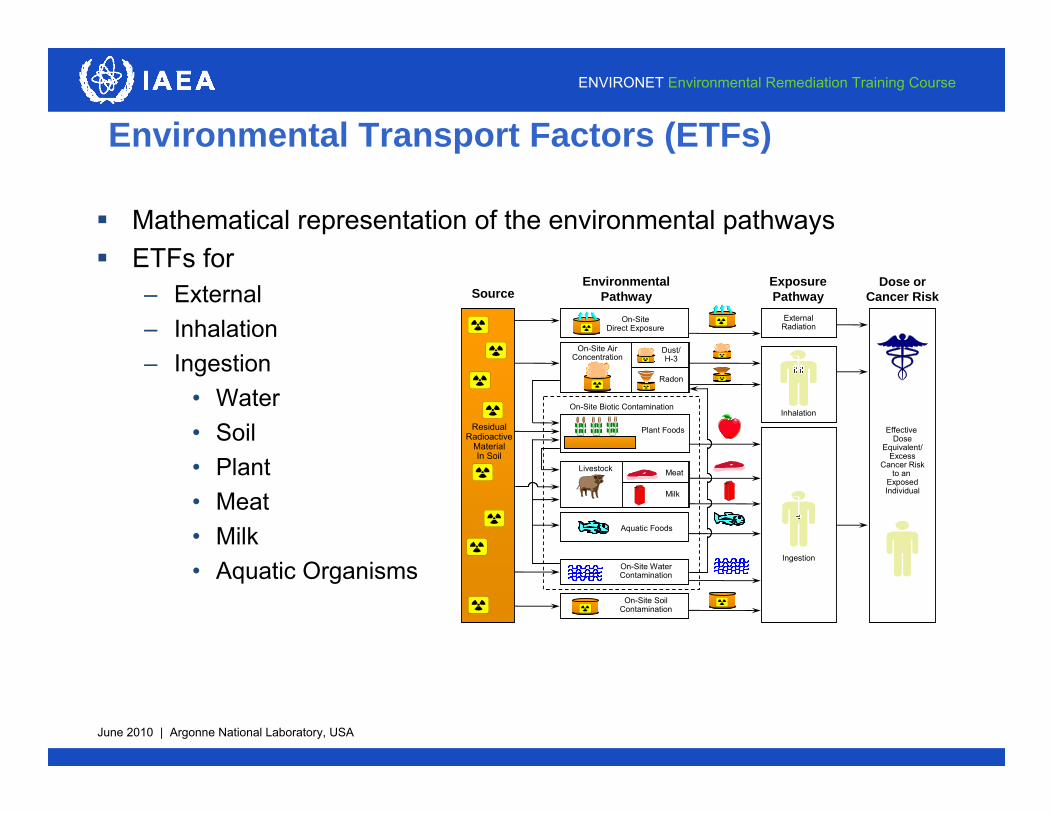
Environmental Transport Factors (ETFs)
Mathematical representation of the environmental pathways ETFs for
– External– Inhalation– Ingestion
• Water• Soil• Plant• Meat• Milk• Aquatic Organisms
On-SiteDirect Exposure
On-Site AirConcentration
Dust/H-3
Radon
Plant Foods
Livestock Meat
Milk
Aquatic Foods
On-Site WaterContamination
On-Site SoilContamination
ExternalRadiation
Ingestion
Effective Dose
Equivalent/Excess
Cancer Riskto an
ExposedIndividual
ResidualRadioactive
MaterialIn Soil
SourceEnvironmental
PathwayExposurePathway
Dose orCancer Risk
InhalationOn-Site Biotic Contamination

June 2010 | Argonne National Laboratory, USA
ENVIRONET Environmental Remediation Training Course
13
Environmental Transport Factors: External Ground
Appendix A: RESRAD Users Manual
– FO1 = occupancy and shielding factor – FSi1 = shape factor– FAi1(t) = nuclide-specific area factor – FCDi1(t) = depth and cover factor
)( )( 111 11 tFCDFAFSFOtETF iiii
Uncontaminated Cover
Contaminated Zone

June 2010 | Argonne National Laboratory, USA
ENVIRONET Environmental Remediation Training Course
14
Occupancy and Shielding Factor
Comprised of– fotd;
: Fraction of time spent outdoors– find : Fraction of time spent indoors– Fsh: External gamma shielding factor
shindotd FffFO 1
6.07.05.025.01 FO
Default Case
Important Note! Fsh = 0; completely shielded Fsh = 1; no shielding
June 2010 | Argonne National Laboratory, USA
ENVIRONET Environmental Remediation Training Course
15
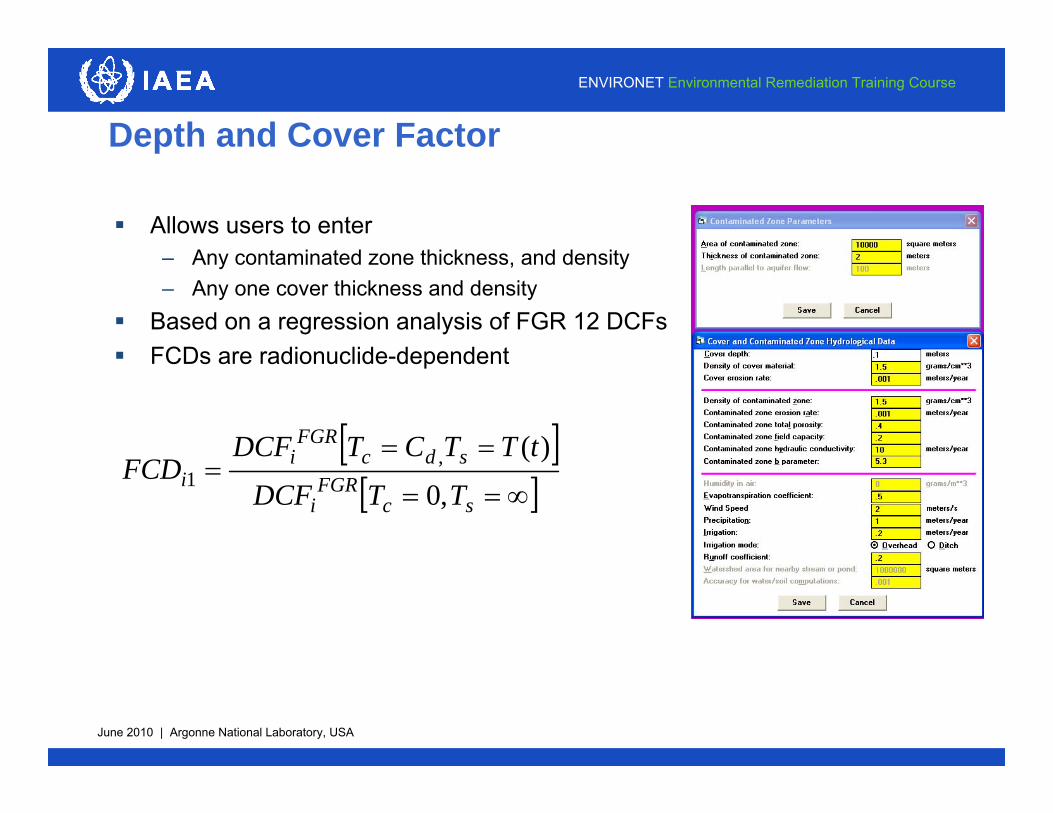
Depth and Cover Factor
Allows users to enter – Any contaminated zone thickness, and density– Any one cover thickness and density
Based on a regression analysis of FGR 12 DCFs FCDs are radionuclide-dependent
scFGR
i
sdcFGR
ii TTDCF
tTTCTDCFFCD
,0
)(,1

June 2010 | Argonne National Laboratory, USA
ENVIRONET Environmental Remediation Training Course
16
Area Factor
Radionuclide-specific factor to correct an infinite geometry (FGR 12) to finite geometry (site-specific)
Performs point-kernel integration on the dose
Uses ICRP-38 photon spectra Benchmarked against MCNP

June 2010 | Argonne National Laboratory, USA
ENVIRONET Environmental Remediation Training Course
17
Shape Factor: Non-Circular Shapes
RESRAD allows users to construct non-circular shaped sources
Allows users to place receptors anywhere on the source
Biggest Impact on long rectangular sources– Roads– Railroad right-of-way
Primarily affects the External Pathway

June 2010 | Argonne National Laboratory, USA
ENVIRONET Environmental Remediation Training Course
18
Environmental Transport Factors: Inhalation Pathway Appendix B: RESRAD Users Manual
ASR2 = mass loading factor (air/soil concentration ratio)
FA2 = area factor FCD2(t)= cover and depth factor FO2 = occupancy factor FI2 = annual intake of air (breathing rate)
222222 )( FIFOtFCDFAASRETFi
Contaminated Zone
Mixing Layer
June 2010 | Argonne National Laboratory, USA
ENVIRONET Environmental Remediation Training Course
19
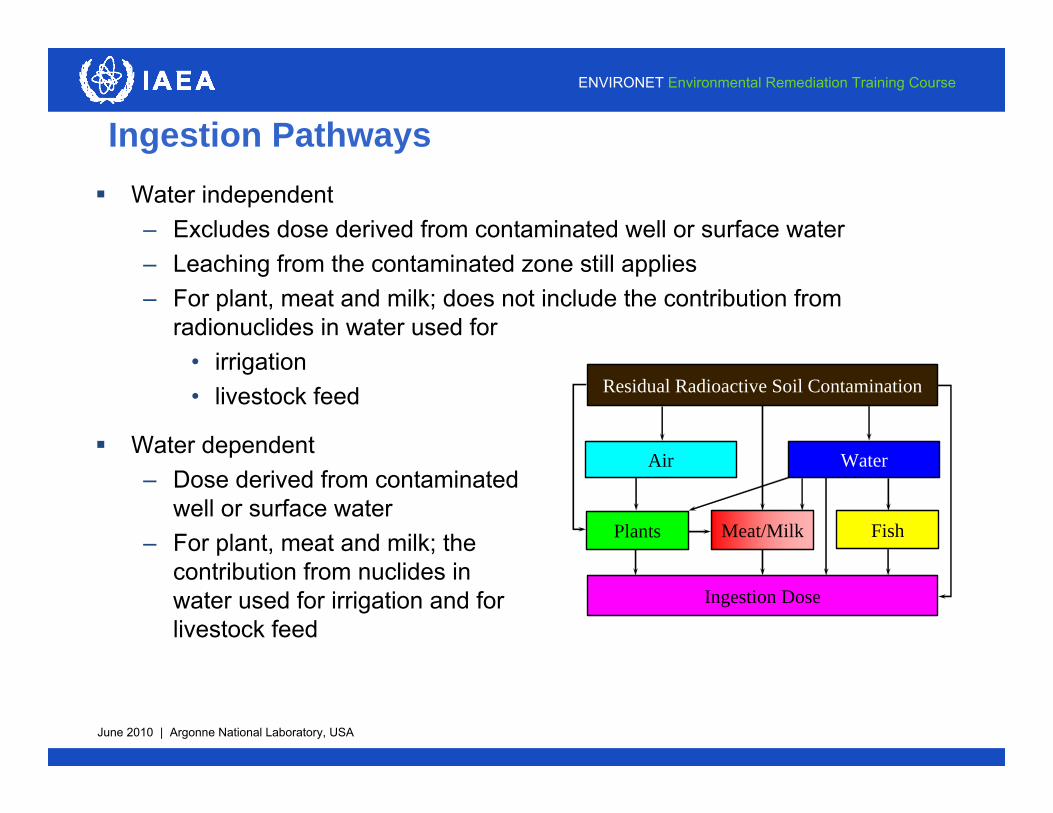
Ingestion Pathways Water independent
– Excludes dose derived from contaminated well or surface water– Leaching from the contaminated zone still applies– For plant, meat and milk; does not include the contribution from
radionuclides in water used for• irrigation• livestock feed Residual Radioactive Soil Contamination
Air Water
Ingestion Dose
Plants Meat/Milk Fish
Water dependent– Dose derived from contaminated
well or surface water– For plant, meat and milk; the
contribution from nuclides in water used for irrigation and for livestock feed
June 2010 | Argonne National Laboratory, USA
ENVIRONET Environmental Remediation Training Course
20
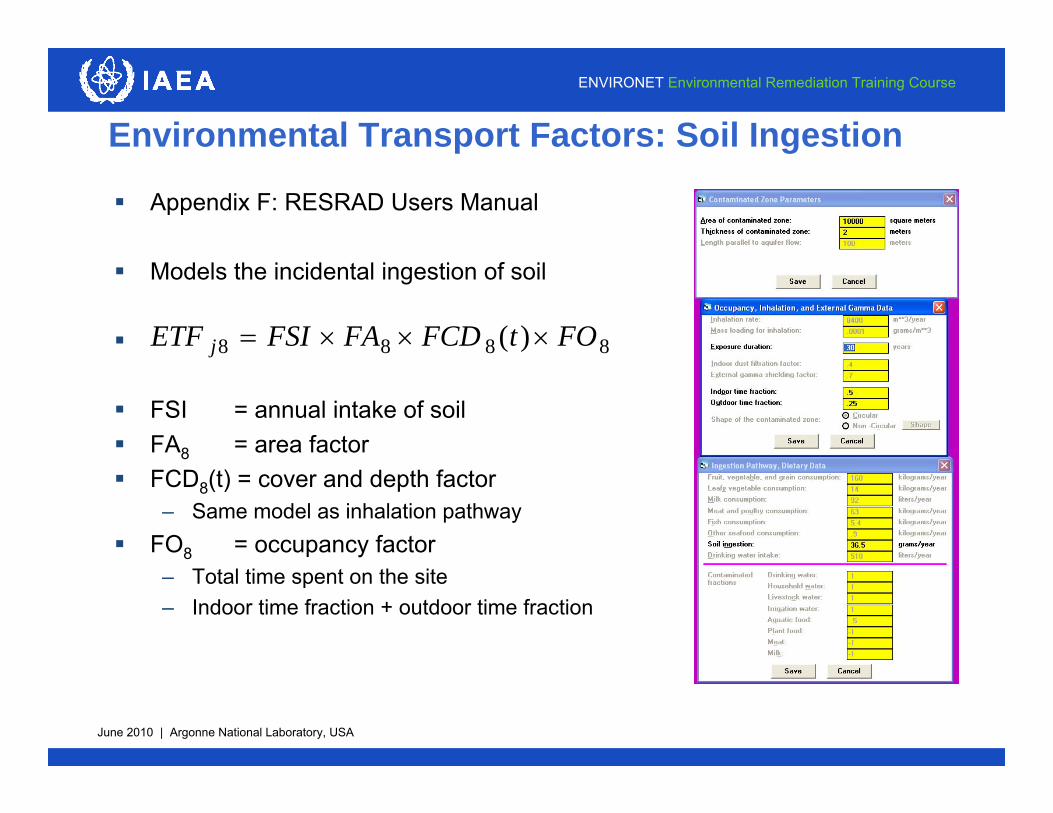
Environmental Transport Factors: Soil Ingestion
Appendix F: RESRAD Users Manual
Models the incidental ingestion of soil
FSI = annual intake of soil FA8 = area factor FCD8(t) = cover and depth factor
– Same model as inhalation pathway FO8 = occupancy factor
– Total time spent on the site– Indoor time fraction + outdoor time fraction
8888 )( FOtFCDFAFSIETF j

June 2010 | Argonne National Laboratory, USA
ENVIRONET Environmental Remediation Training Course
21
Environmental Transport Factors: Plant, Meat, and Milk Pathways Appendix D: RESRAD Users Manual
k
pqkijpkpqppqij tFSRDFtFCDFAETF )()( ,,
Where– DF = dietary factor (annual
consumption rate)– FSR(t) = food/soil concentration ratio– FA = area factor– FCD(t) = cover and depth factor

June 2010 | Argonne National Laboratory, USA
ENVIRONET Environmental Remediation Training Course
22
Water Pathway Factors
Ground SurfaceC d
hUnsaturated
(Vadose) Zone
Wel
ld w Surface Water
Irrigation,Precipitation
Radionuclide PathsContaminatedZone
Water
Table
Groundwater Flow
Saturated Zone (Aquifer)
Aquitard
T

June 2010 | Argonne National Laboratory, USA
ENVIRONET Environmental Remediation Training Course
23
Computer Model of Contaminant Transport
June 2010 | Argonne National Laboratory, USA
ENVIRONET Environmental Remediation Training Course
24
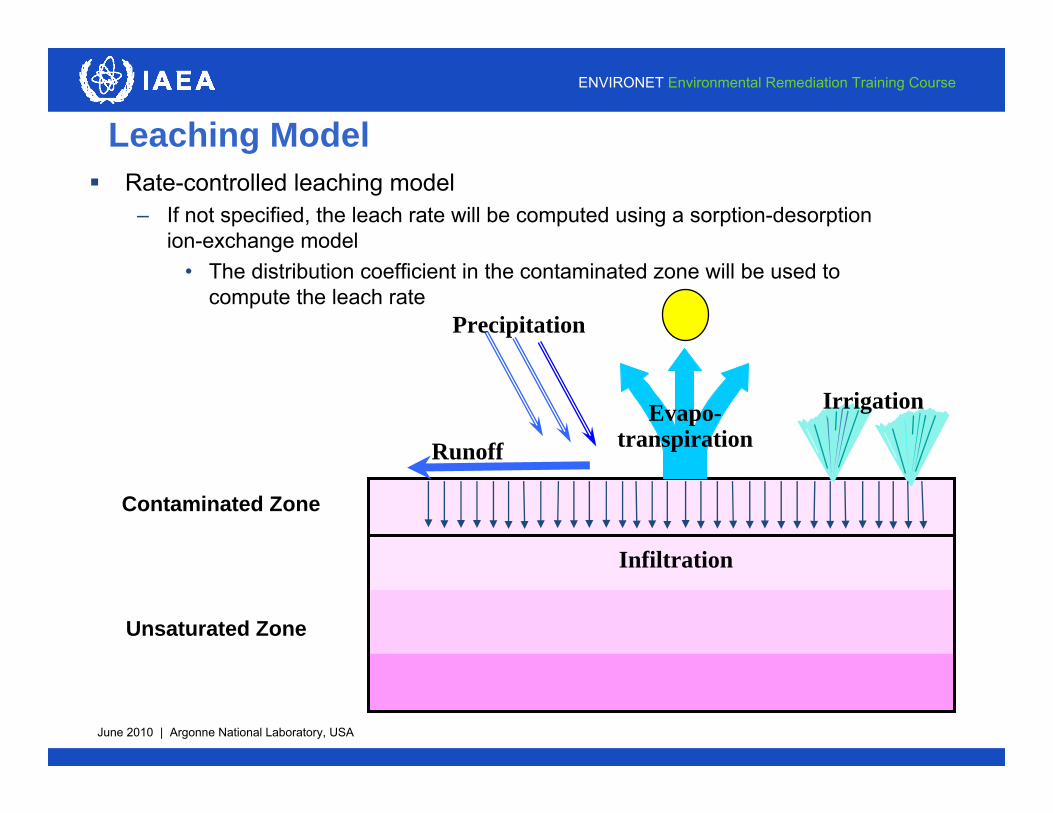
Leaching Model Rate-controlled leaching model
– If not specified, the leach rate will be computed using a sorption-desorption ion-exchange model
• The distribution coefficient in the contaminated zone will be used to compute the leach rate
Contaminated Zone
Unsaturated Zone
Runoff
Precipitation
Evapo-transpiration
Irrigation
Infiltration

June 2010 | Argonne National Laboratory, USA
ENVIRONET Environmental Remediation Training Course
25
Leaching Model
321
)()(
1
11
b
sats
dbd
st
rrrre
czd
czi
KIR
KR
RPIPCCI
RTIL
i
i
i
Note: Rs ≤ 1– Ksat ≥ I

June 2010 | Argonne National Laboratory, USA
ENVIRONET Environmental Remediation Training Course
26
Leaching Model
Radionuclide-specific Kd
Hydraulic conductivity (m/yr)– 33 [Silty Clay]– to 5,500 [Sand]
Soil-specific “b” parameter– 4.0 [Sand]– to 11.4 [Clay]
Field capacity– Lower limit of volumetric water content
See Data Collection Handbook for more information

June 2010 | Argonne National Laboratory, USA
ENVIRONET Environmental Remediation Training Course
27
Effect of Kd on Leaching and Transport
Contaminated water
Low KdContaminated Water
Low Kd
Contaminated Water
High KdContaminated Water
High Kd
Low Kd
Low Kd High Kd
High Kd
1
2
1
2
1
2
1
2
1
2
1
2
1
2
1
2
Case C
Case A Case B
Case D
1 Contaminated Zone 2 Unsaturated Zone

June 2010 | Argonne National Laboratory, USA
ENVIRONET Environmental Remediation Training Course
28
Thank You!!
For questions on the RESRAD Family of Codes, please contact:
Dr. Charley Yu, CHPArgonne National LaboratoryRESRAD Program ManagerPhone: 630-252-5589FAX: (630) 252-5880E-mail: [email protected]
http://www.evs.anl.gov/RESRAD

June 2010 | Argonne National Laboratory, USA
Dose and Risk Assessment Extensions
Sensitivity Analysis & ExpectationsOffsite AssumptionsProbabilistic AnalysisDemonstration of Extensions
June 2010 | Argonne National Laboratory, USA
ENVIRONET Environmental Remediation Training Course
2
Levels of Conservatism Pile Up
Determine exposure scenario Determine exposure pathway(s) Gather data Understand calculations Calculate guidelines Clean up
Solution:– Use more realism in
• Data (Sensitivity and Uncertainty) and • Scenario (Offsite)
– But requires additional justification
June 2010 | Argonne National Laboratory, USA
ENVIRONET Environmental Remediation Training Course
3
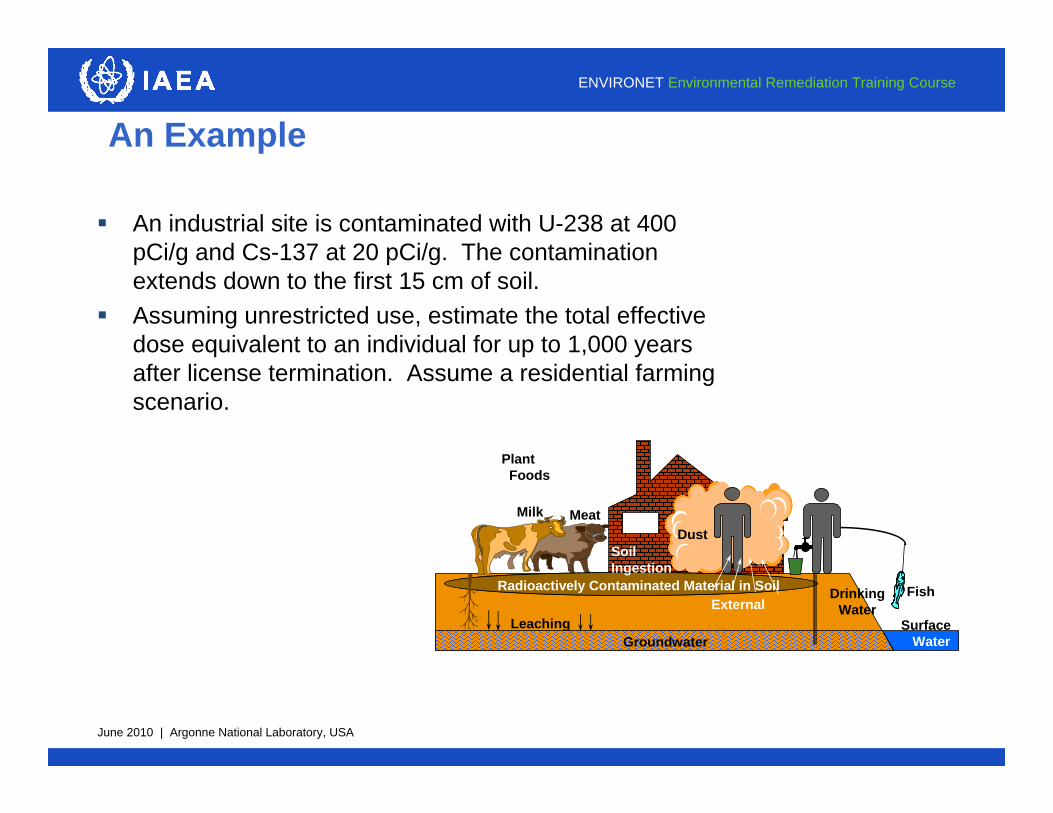
An Example
An industrial site is contaminated with U-238 at 400 pCi/g and Cs-137 at 20 pCi/g. The contamination extends down to the first 15 cm of soil.
Assuming unrestricted use, estimate the total effective dose equivalent to an individual for up to 1,000 years after license termination. Assume a residential farming scenario.
Dust
DrinkingWater
Fish
Plant Foods
MeatMilk
Radioactively Contaminated Material in SoilRadioactively Contaminated Material in Soil
SoilIngestion
LeachingExternal
SurfaceWaterGroundwater

June 2010 | Argonne National Laboratory, USA
ENVIRONET Environmental Remediation Training Course
4
Total Effective Dose Equivalent (TEDE)
0
10
20
30
40
50
60
70
80
0 100 200 300 400 500 600 700 800 900 1000
Time
TED
E (m
rem
/yr)

June 2010 | Argonne National Laboratory, USA
ENVIRONET Environmental Remediation Training Course
5
Total Effective Dose Equivalent (TEDE)
0
10
20
30
40
50
60
70
80
1 10 100 1000
Time
TED
E (m
rem
/yr)

June 2010 | Argonne National Laboratory, USA
ENVIRONET Environmental Remediation Training Course
6
Which Radionuclides Contribute to the Dose Cs-137, U-238 or both?
0
10
20
30
40
50
60
70
80
1 10 100 1000
Time
TED
E (m
rem
/yr)
Cs-137 U-238 Total Dose
June 2010 | Argonne National Laboratory, USA
ENVIRONET Environmental Remediation Training Course
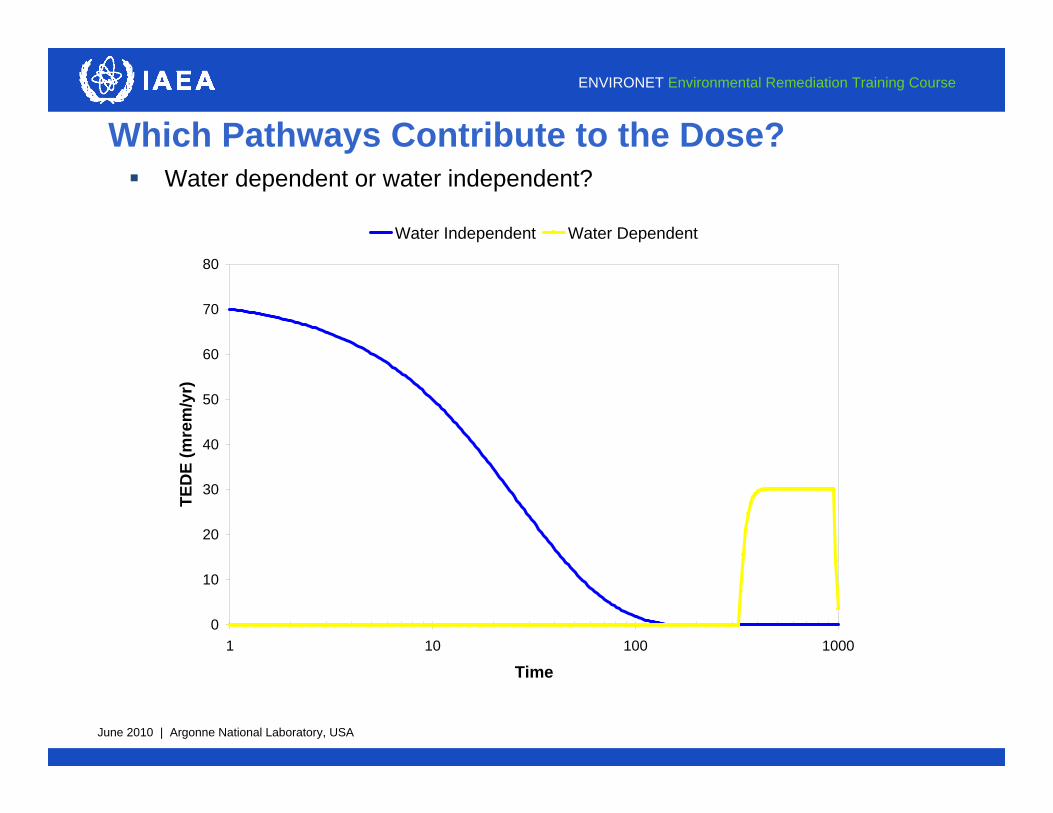
7
Which Pathways Contribute to the Dose? Water dependent or water independent?
0
10
20
30
40
50
60
70
80
1 10 100 1000
Time
TED
E (m
rem
/yr)
Water Independent Water Dependent
June 2010 | Argonne National Laboratory, USA
ENVIRONET Environmental Remediation Training Course
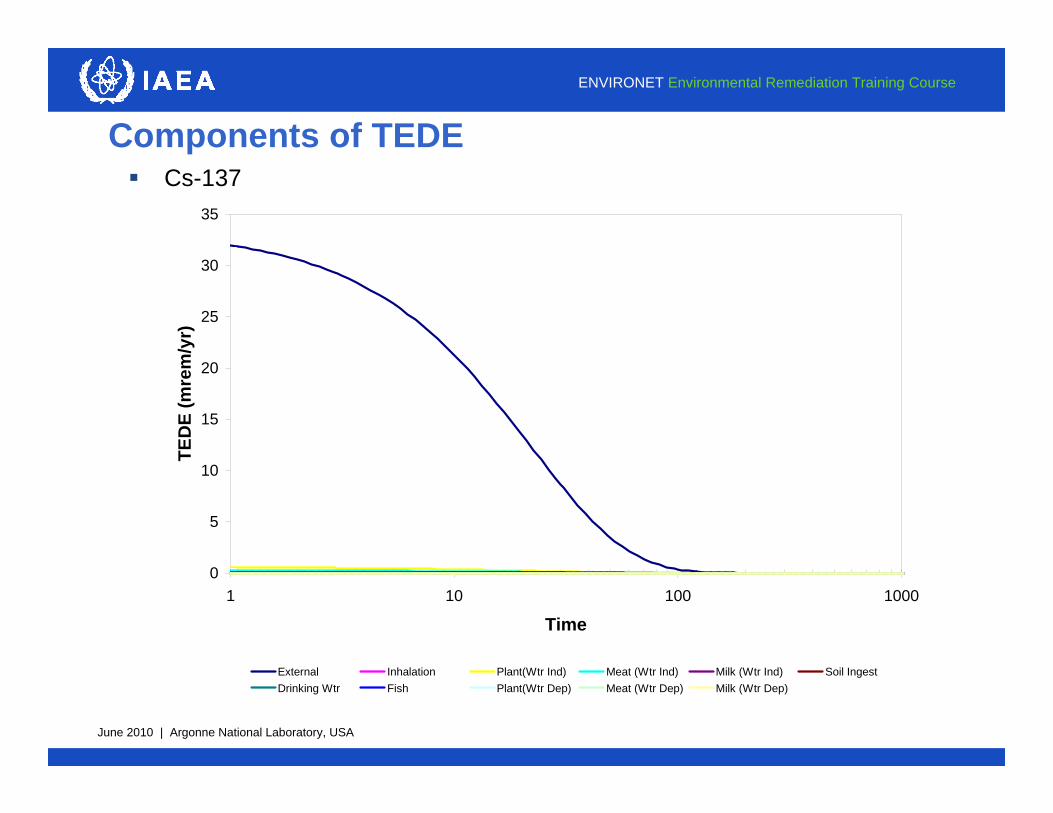
8
Components of TEDE Cs-137
0
5
10
15
20
25
30
35
1 10 100 1000
Time
TED
E (m
rem
/yr)
External Inhalation Plant(Wtr Ind) Meat (Wtr Ind) Milk (Wtr Ind) Soil IngestDrinking Wtr Fish Plant(Wtr Dep) Meat (Wtr Dep) Milk (Wtr Dep)
June 2010 | Argonne National Laboratory, USA
ENVIRONET Environmental Remediation Training Course
9
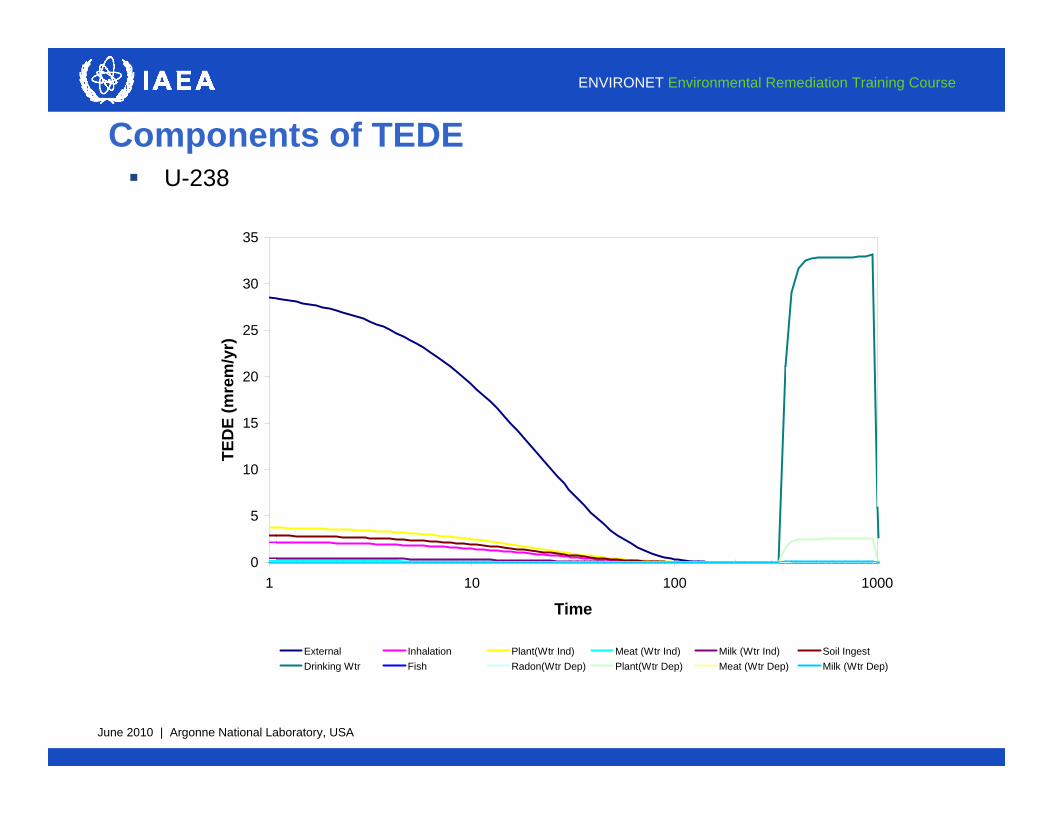
Components of TEDE U-238
0
5
10
15
20
25
30
35
1 10 100 1000
Time
TED
E (m
rem
/yr)
External Inhalation Plant(Wtr Ind) Meat (Wtr Ind) Milk (Wtr Ind) Soil IngestDrinking Wtr Fish Radon(Wtr Dep) Plant(Wtr Dep) Meat (Wtr Dep) Milk (Wtr Dep)

June 2010 | Argonne National Laboratory, USA
ENVIRONET Environmental Remediation Training Course
10
Water-Independent Components
External Pathway– Cover thickness– Contamination thickness– Erosion rates– Leach rates– Shielding factors– Time factors
Ingestion Pathways– Cover thickness– Contamination thickness– Erosion rates– Leach rates– Ingestion rates– Depth of roots
Contaminated Zone
Unsaturated Zone
Saturated Zone
June 2010 | Argonne National Laboratory, USA
ENVIRONET Environmental Remediation Training Course
11
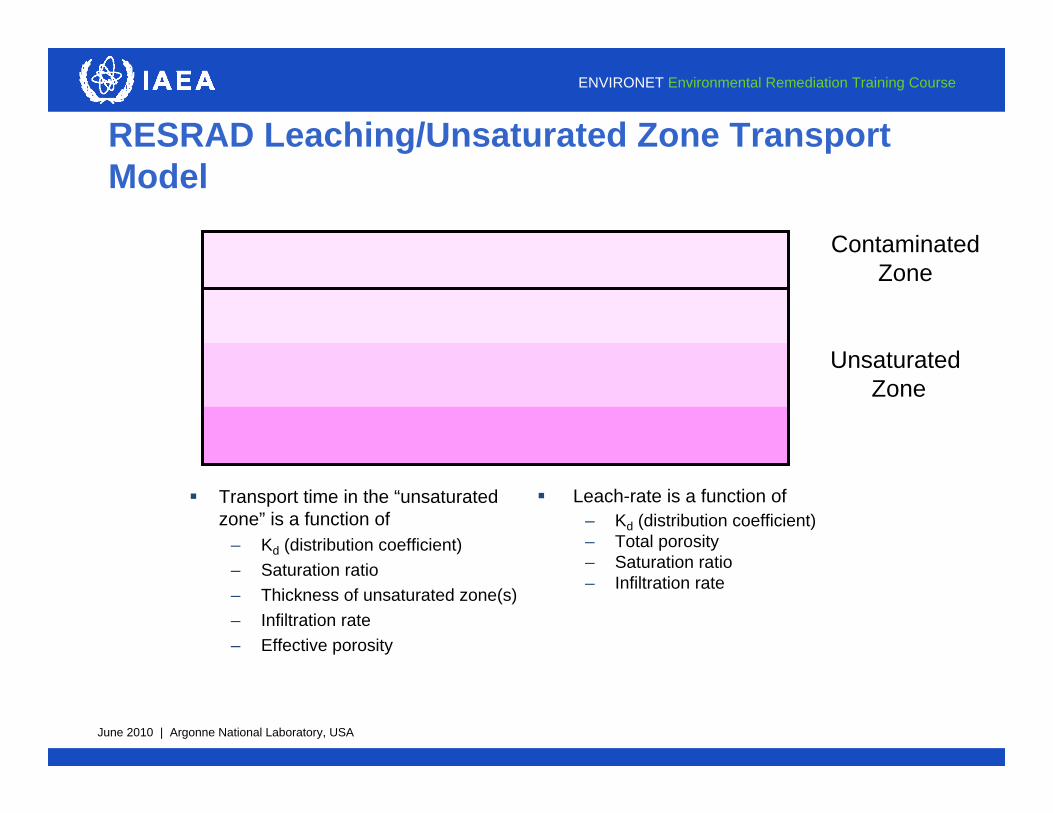
RESRAD Leaching/Unsaturated Zone Transport Model
Leach-rate is a function of – Kd (distribution coefficient)– Total porosity– Saturation ratio– Infiltration rate
Unsaturated Zone
ContaminatedZone
Transport time in the “unsaturated zone” is a function of
– Kd (distribution coefficient)– Saturation ratio– Thickness of unsaturated zone(s)– Infiltration rate– Effective porosity
June 2010 | Argonne National Laboratory, USA
ENVIRONET Environmental Remediation Training Course
12
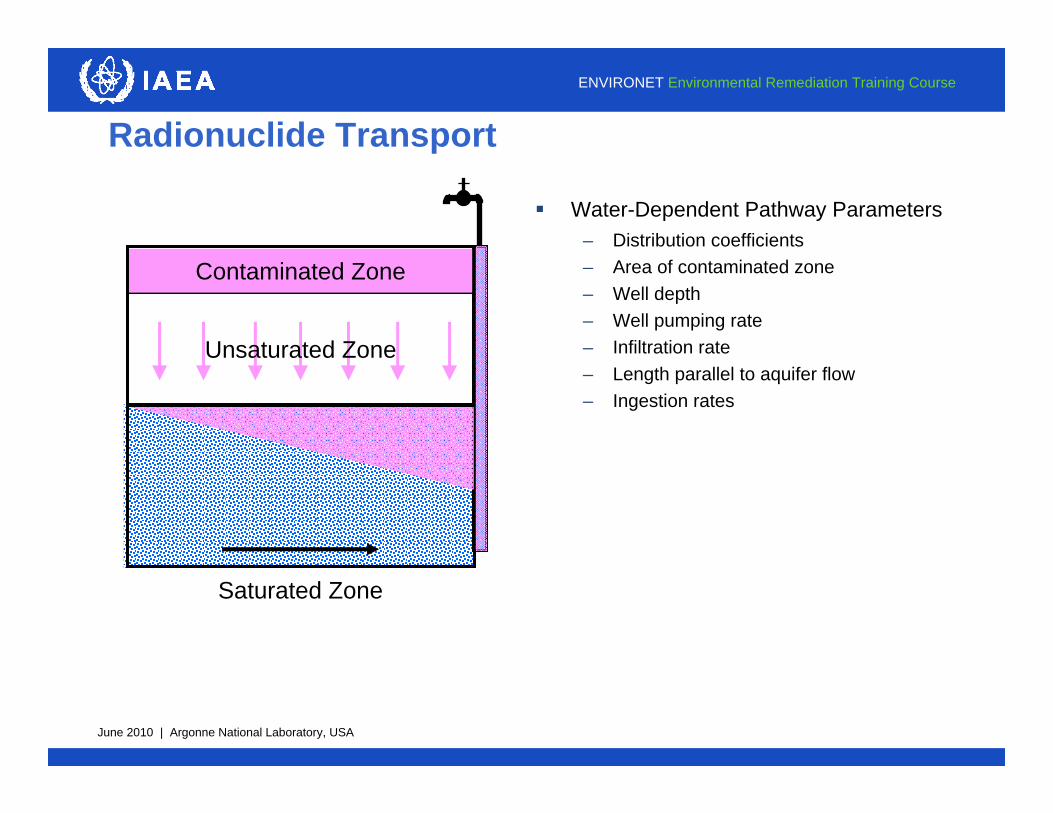
Radionuclide Transport
Contaminated Zone
Unsaturated Zone
Saturated Zone
Water-Dependent Pathway Parameters– Distribution coefficients– Area of contaminated zone– Well depth– Well pumping rate– Infiltration rate– Length parallel to aquifer flow– Ingestion rates

June 2010 | Argonne National Laboratory, USA
ENVIRONET Environmental Remediation Training Course
13
Characteristics of TEDE versus Time
0
10
20
30
40
50
60
70
80
1 10 100 1000
Time
TED
E (m
rem
/yr)
Contaminated Zone
Unsaturated Zone
Saturated Zone
Contaminated Zone
Unsaturated Zone
Saturated Zone

June 2010 | Argonne National Laboratory, USA
ENVIRONET Environmental Remediation Training Course
14
Characteristics of TEDE versus Time
0
10
20
30
40
50
60
70
80
0 100 200 300 400 500 600 700 800 900 1000
Time
TED
E (m
rem
/yr)
Unsaturated Zone
Contaminated Zone
Saturated Zone
Unsaturated Zone
Contaminated Zone
Saturated Zone

June 2010 | Argonne National Laboratory, USA
ENVIRONET Environmental Remediation Training Course
15
Characteristics of TEDE versus Time
0
10
20
30
40
50
60
70
80
0 100 200 300 400 500 600 700 800 900 1000
Time
TED
E (m
rem
/yr)
Unsaturated Zone
Saturated Zone
Contaminated Zone
Unsaturated Zone
Saturated Zone
Contaminated Zone

June 2010 | Argonne National Laboratory, USA
ENVIRONET Environmental Remediation Training Course
16
Sensitivity Analysis: An Example
Residential Farmer Scenario– U-238 and U-234 @ 100 pCi/g each– 0.5 m cover– No erosion of cover material– Water table drop rate set to 0– All other parameters set to default– Sensitivity analysis performed on
• Thickness of contaminated zone• Precipitation rate• Distribution coefficient in the
unsaturated zone
Dust,Radon
DrinkingWater
Fish
Plant Foods
MeatMilk
Radioactively Contaminated Material in SoilRadioactively Contaminated Material in Soil
SoilIngestion
Infiltration
Leaching
External
SurfaceWaterGroundwater

June 2010 | Argonne National Laboratory, USA
ENVIRONET Environmental Remediation Training Course
17
Base Case

June 2010 | Argonne National Laboratory, USA
ENVIRONET Environmental Remediation Training Course
18
Sensitivity on the Thickness of the Contaminated Zone
June 2010 | Argonne National Laboratory, USA
ENVIRONET Environmental Remediation Training Course
19
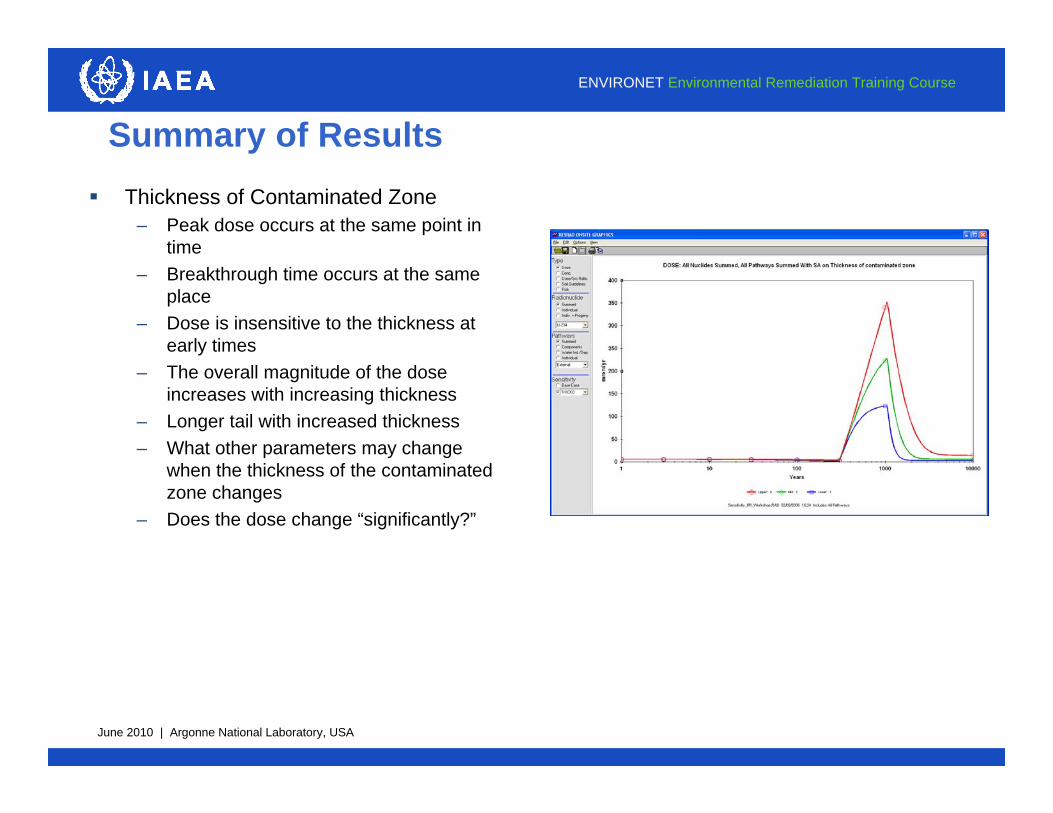
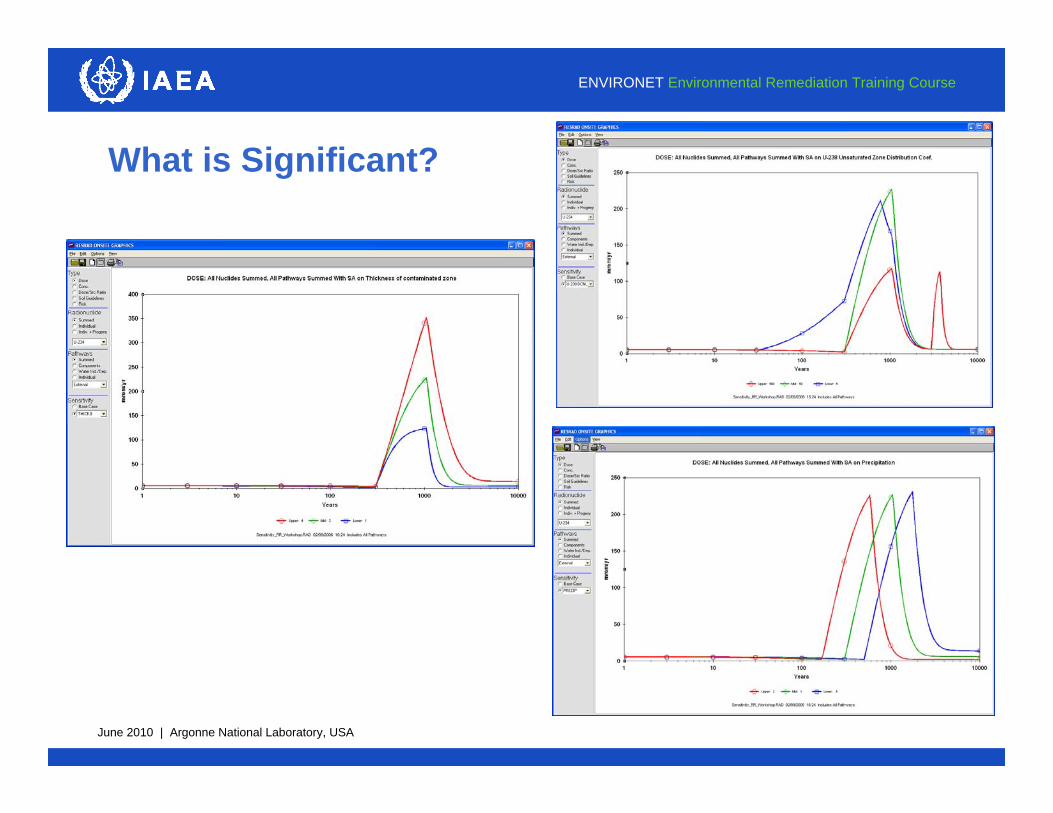
Summary of Results Thickness of Contaminated Zone
– Peak dose occurs at the same point in time
– Breakthrough time occurs at the same place
– Dose is insensitive to the thickness at early times
– The overall magnitude of the dose increases with increasing thickness
– Longer tail with increased thickness– What other parameters may change
when the thickness of the contaminated zone changes
– Does the dose change “significantly?”

June 2010 | Argonne National Laboratory, USA
ENVIRONET Environmental Remediation Training Course
20
Sensitivity on the Precipitation Rate

June 2010 | Argonne National Laboratory, USA
ENVIRONET Environmental Remediation Training Course
21
Summary of Results Precipitation Rate
– Time of peak dose changes– Breakthrough time changes– Overall magnitude of the dose is about
the same– Dose is insensitive to the precipitation
rate in early times– Decreasing the precipitation rate pushes
the peak past 1000 years– Would this be a cause for concern?– What other parameters may affect the
precipitation rate?– Would the precipitation rate be
considered “significant”?

June 2010 | Argonne National Laboratory, USA
ENVIRONET Environmental Remediation Training Course
22
Sensitivity Analysis on the Kd of U-238 in the Unsaturated Zone
June 2010 | Argonne National Laboratory, USA
ENVIRONET Environmental Remediation Training Course
23
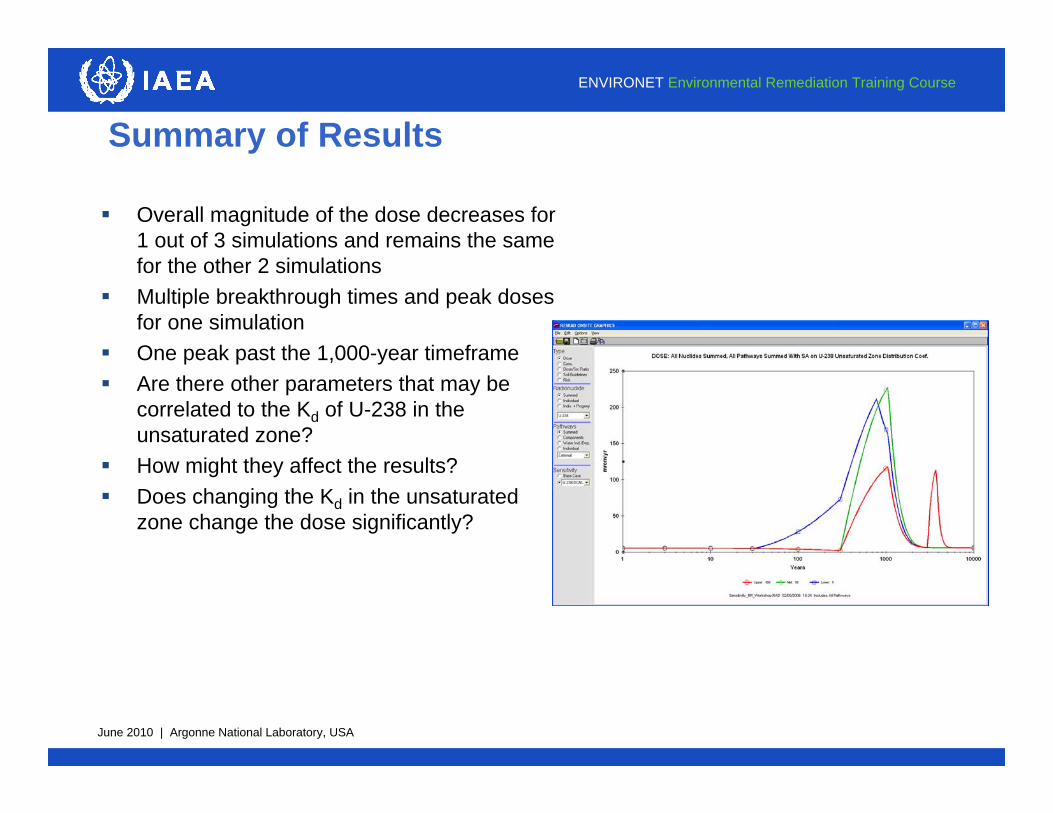
Summary of Results
Overall magnitude of the dose decreases for 1 out of 3 simulations and remains the same for the other 2 simulations
Multiple breakthrough times and peak doses for one simulation
One peak past the 1,000-year timeframe Are there other parameters that may be
correlated to the Kd of U-238 in the unsaturated zone?
How might they affect the results? Does changing the Kd in the unsaturated
zone change the dose significantly?
June 2010 | Argonne National Laboratory, USA
ENVIRONET Environmental Remediation Training Course
24
What is Significant?

June 2010 | Argonne National Laboratory, USA
ENVIRONET Environmental Remediation Training Course
Probabilistic Methodology Overview
TimeD
ose
D(1)
D(2)
D(3)
Comparison of deterministic and probabilistic inputs and calculations
Specifying distribution for inputs Inputs
– Parameter sampling– Parameter correlations
Outputs– Distribution of the peaks
• Distribution free fractiles (quantiles)• Mean (“mean of the peaks”)
– “Peak of the means” Parameter sensitivity
– Probabilistic – Deterministic

June 2010 | Argonne National Laboratory, USA
ENVIRONET Environmental Remediation Training Course
Probabilistic Analysis
June 2010 | Argonne National Laboratory, USA
ENVIRONET Environmental Remediation Training Course
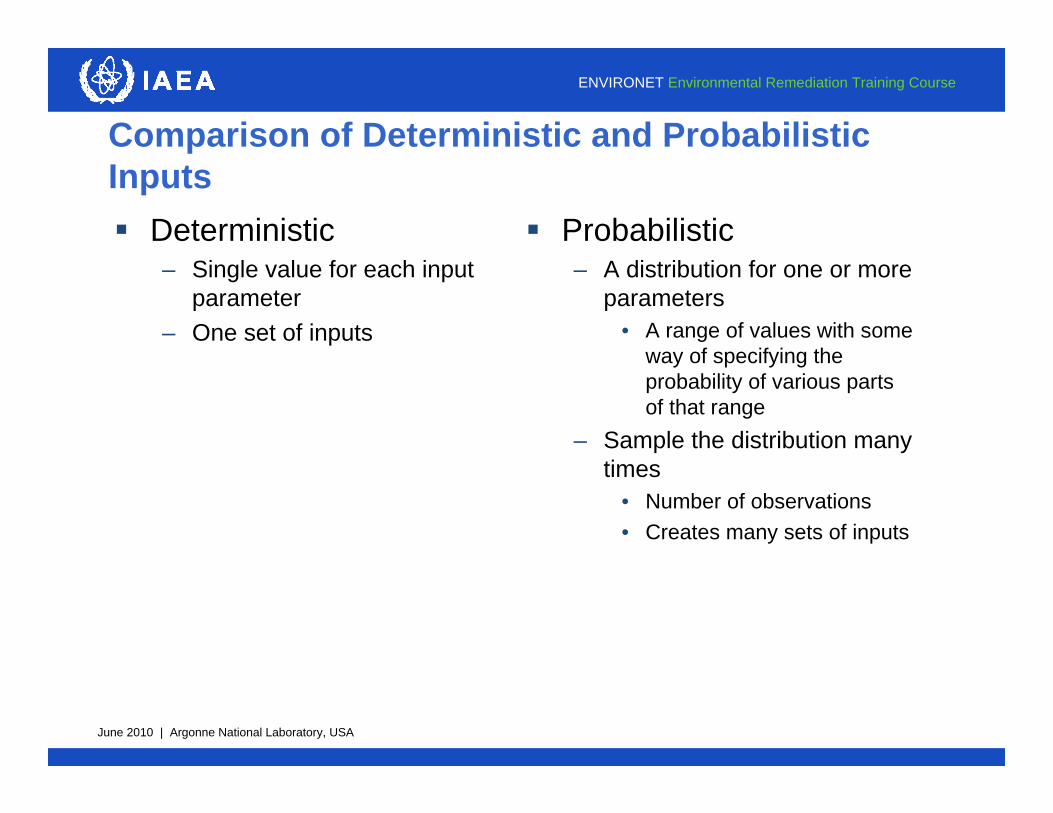
Comparison of Deterministic and Probabilistic Inputs Deterministic
– Single value for each input parameter
– One set of inputs
Probabilistic– A distribution for one or more
parameters• A range of values with some
way of specifying the probability of various parts of that range
– Sample the distribution many times
• Number of observations• Creates many sets of inputs
June 2010 | Argonne National Laboratory, USA
ENVIRONET Environmental Remediation Training Course
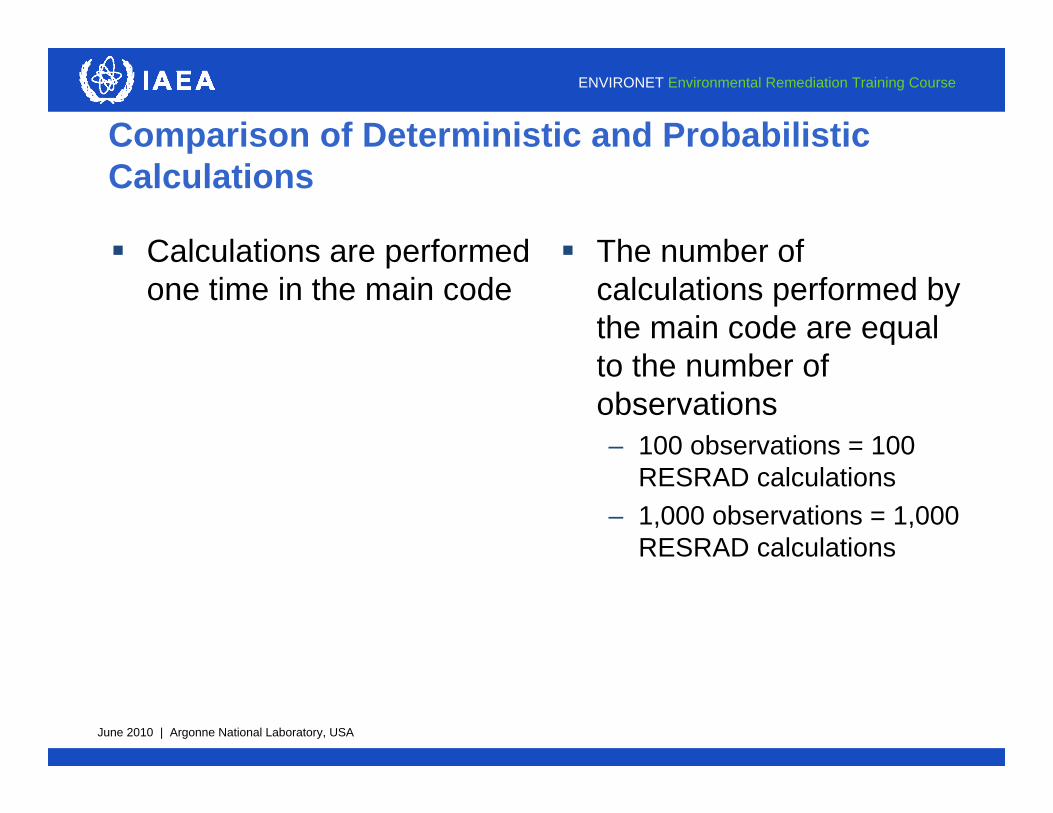
Comparison of Deterministic and Probabilistic Calculations
Calculations are performed one time in the main code
The number of calculations performed by the main code are equal to the number of observations– 100 observations = 100
RESRAD calculations– 1,000 observations = 1,000
RESRAD calculations

June 2010 | Argonne National Laboratory, USA
ENVIRONET Environmental Remediation Training Course
Comparison of Deterministic and Probabilistic Calculations
One result, whether it be the peak dose, the peak risk, or a temporal plot of dose (or risk)
As many results as there are observations
A distribution of the result, whether it be of the peak dose, of the peak risk, or distribution of dose (or risk) over time

June 2010 | Argonne National Laboratory, USA
ENVIRONET Environmental Remediation Training Course
Probabilistic Terminology
Parameter sampling Parameter correlations “Peak of the mean” “Mean of the peaks” Parameter sensitivity
– Deterministic– Probabilistic
Time
Dos
e
D(1)
D(2)
D(3)

June 2010 | Argonne National Laboratory, USA
ENVIRONET Environmental Remediation Training Course
Probabilistic Dose Assessment
Parameter distributions cannot be entered into the dose assessment model directly
Parameter distributions are “sampled” to reflect the “true” distributions
Many sampling routines have been developed

June 2010 | Argonne National Laboratory, USA
ENVIRONET Environmental Remediation Training Course
Probabilistic Specifications

June 2010 | Argonne National Laboratory, USA
ENVIRONET Environmental Remediation Training Course
0
0.2
0.4
0.6
0.8
1
1.2
1.4
1.6
1.8
2
0.5 1 1.5 2 2.5
Density (g/cm^3)
f(x)
Latin Hypercube Sampling
1.19231.304911.333961.414121.476311.5496
1.615381.649431.723381.95171
LHS Values
June 2010 | Argonne National Laboratory, USA
ENVIRONET Environmental Remediation Training Course
Parameter Correlations
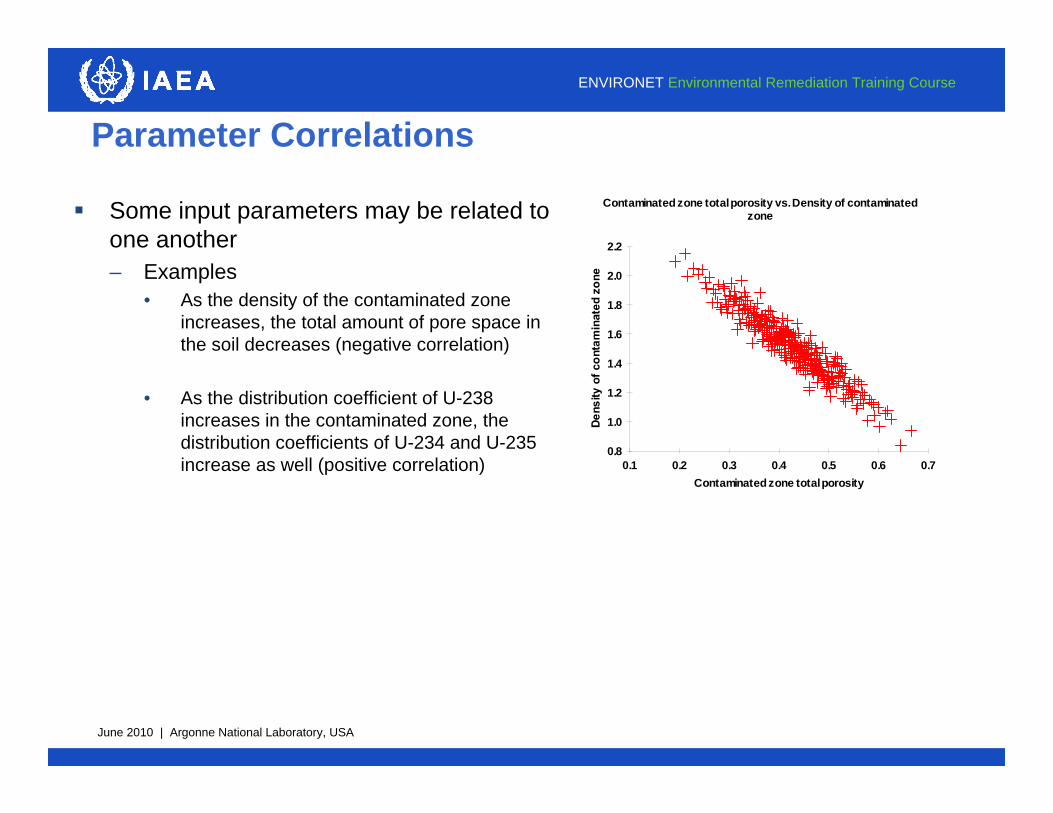
Some input parameters may be related to one another– Examples
• As the density of the contaminated zone increases, the total amount of pore space in the soil decreases (negative correlation)
• As the distribution coefficient of U-238 increases in the contaminated zone, the distribution coefficients of U-234 and U-235 increase as well (positive correlation)
0.8
1.0
1.2
1.4
1.6
1.8
2.0
2.2
0.1 0.2 0.3 0.4 0.5 0.6 0.7Contaminated zone total porosity
Contaminated zone total porosity vs. Density of contaminatedzone

June 2010 | Argonne National Laboratory, USA
ENVIRONET Environmental Remediation Training Course
Reports Available to Assist Analysts

June 2010 | Argonne National Laboratory, USA
ENVIRONET Environmental Remediation Training Course
Caution on Interpreting Probabilistic Results and Blindly Using Output Correlations
“He uses statistics like a drunk uses a lamp post….for support rather than illumination”
June 2010 | Argonne National Laboratory, USA
ENVIRONET Environmental Remediation Training Course
Probabilistic Dose Modeling Example
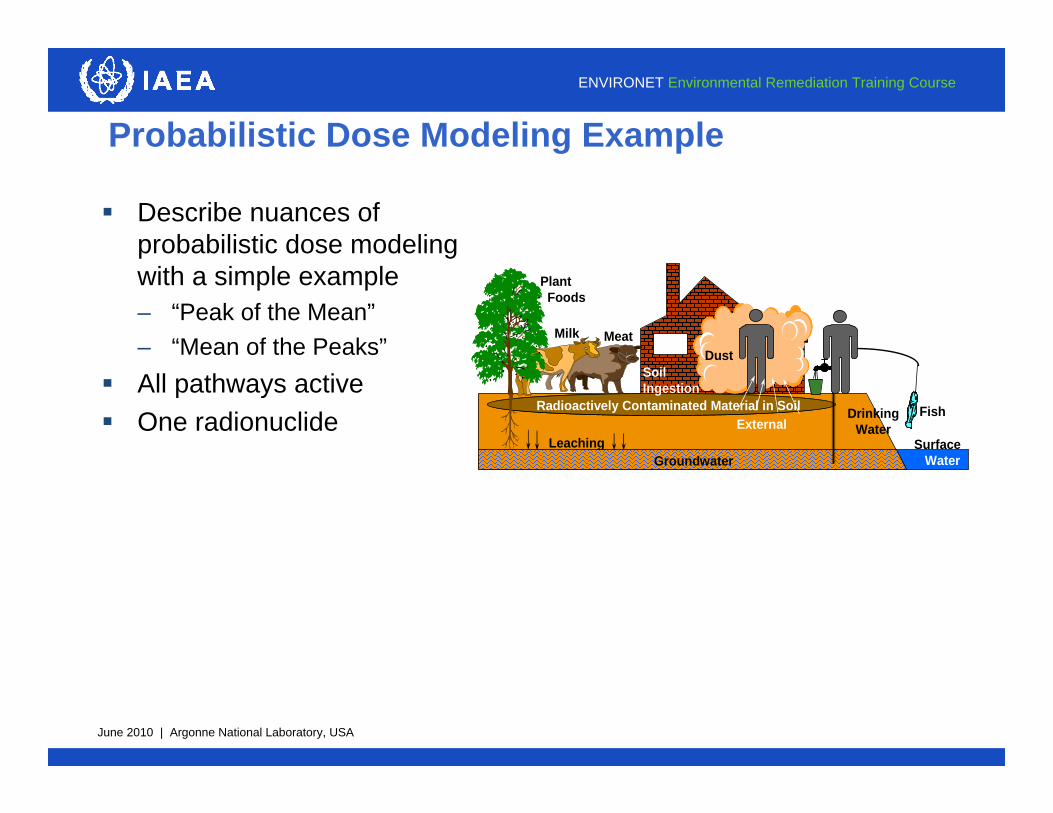
Describe nuances of probabilistic dose modeling with a simple example– “Peak of the Mean”– “Mean of the Peaks”
All pathways active One radionuclide
Dust
DrinkingWater
Fish
Plant Foods
MeatMilk
Radioactively Contaminated Material in SoilRadioactively Contaminated Material in Soil
SoilIngestion
LeachingExternal
SurfaceWaterGroundwater
June 2010 | Argonne National Laboratory, USA
ENVIRONET Environmental Remediation Training Course
Probabilistic Dose Modeling Example
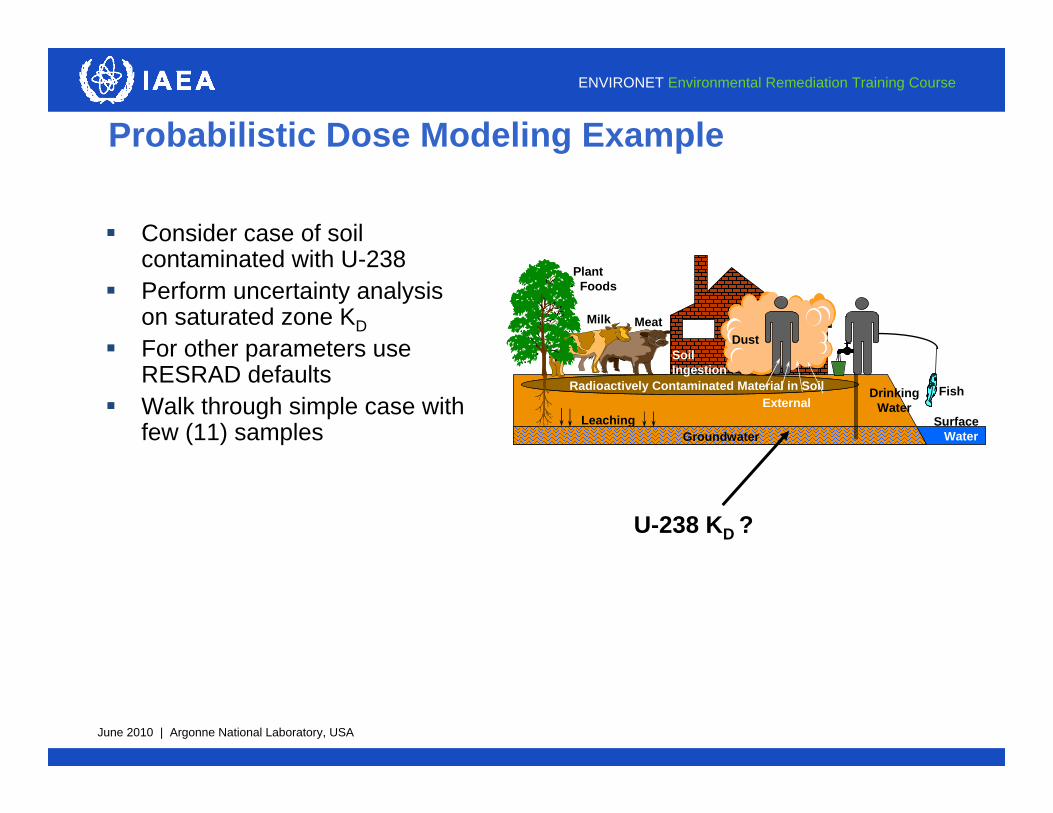
Consider case of soil contaminated with U-238
Perform uncertainty analysis on saturated zone KD
For other parameters use RESRAD defaults
Walk through simple case with few (11) samples
Dust
DrinkingWater
Fish
Plant Foods
MeatMilk
Radioactively Contaminated Material in SoilRadioactively Contaminated Material in Soil
SoilIngestion
LeachingExternal
SurfaceWaterGroundwater
U-238 KD ?

June 2010 | Argonne National Laboratory, USA
ENVIRONET Environmental Remediation Training Course
Probability Distributions for the KD of U-238 in the Saturated Zone
KD of U-238– Lognormal
distribution• =4.84• =3.13
0
0.02
0.04
0.06
0.08
0.1
0.12
0.14
0.01 10.01 20.01 30.01 40.01 50.01 60.01 70.01 80.01 90.01
Uranium Distribution Coefficient (cm3/g)
f(x)

June 2010 | Argonne National Laboratory, USA
ENVIRONET Environmental Remediation Training Course
Cumulative Probability Distributions of the KD in the Unsaturated Zone
0
0.1
0.2
0.3
0.4
0.5
0.6
0.7
0.8
0.9
1
0.E+00 1.E+04 2.E+04 3.E+04 4.E+04 5.E+04 6.E+04 7.E+04 8.E+04 9.E+04 1.E+05
Uranium Distribution Coefficient (cm3/g)
Cum
ulat
ive
Prob
abili
ty
June 2010 | Argonne National Laboratory, USA
ENVIRONET Environmental Remediation Training Course
Cumulative Probability Distributions of the KD in the Unsaturated Zone
0
0.1
0.2
0.3
0.4
0.5
0.6
0.7
0.8
0.9
1
1.E-04 1.E-03 1.E-02 1.E-01 1.E+00 1.E+01 1.E+02 1.E+03 1.E+04 1.E+05 1.E+06
Uranium Distribution Coefficient (cm3/g)
Cum
ulat
ive
Prob
abili
ty
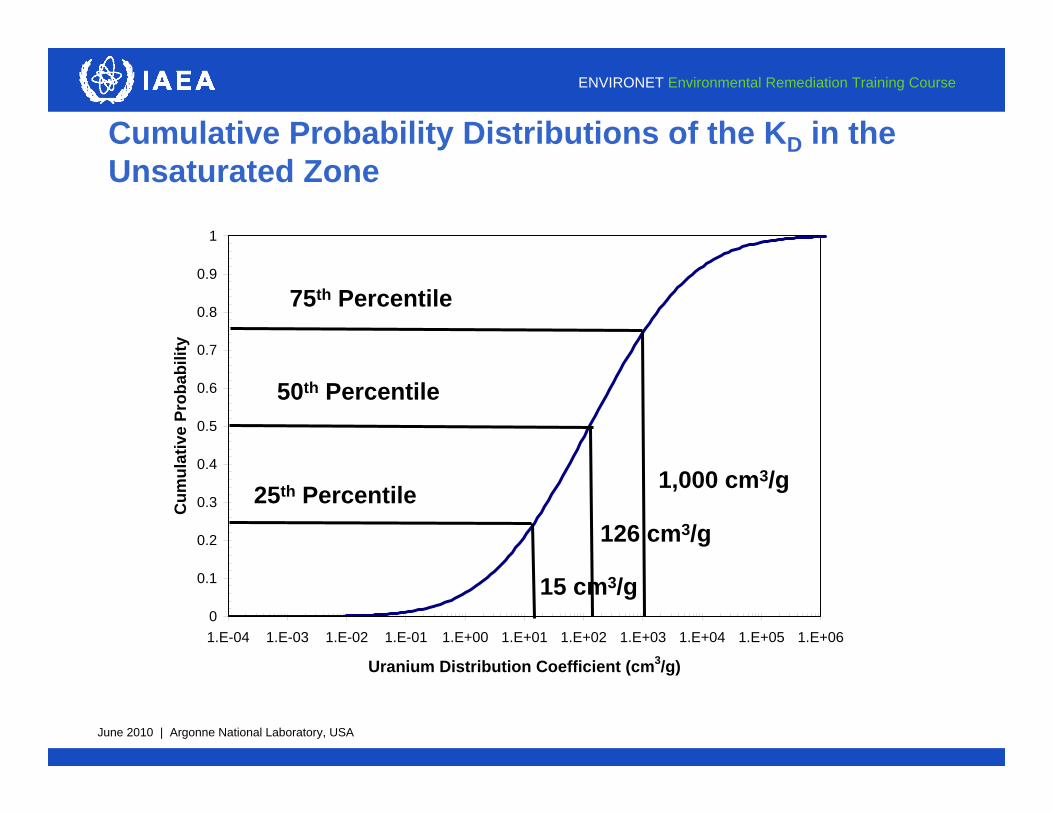
50th Percentile
126 cm3/g
75th Percentile
1,000 cm3/g25th Percentile
15 cm3/g

June 2010 | Argonne National Laboratory, USA
ENVIRONET Environmental Remediation Training Course
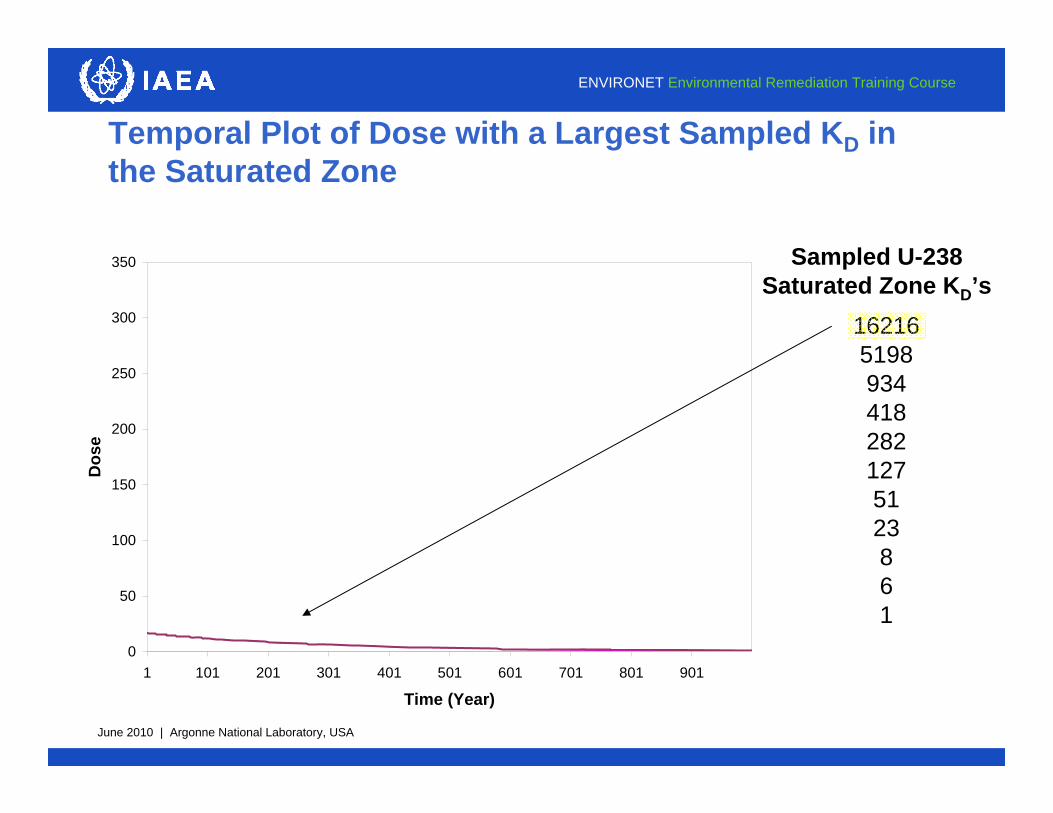
1621651989344182821275123861
81st Percentile
LHS Sampling of the U-238 KD: 11 Observations
Sampled U-238 Saturated Zone KD’s
54th Percentile
27th Percentile
June 2010 | Argonne National Laboratory, USA
ENVIRONET Environmental Remediation Training Course
Temporal Plot of Dose with a Largest Sampled KD in the Saturated Zone
0
50
100
150
200
250
300
350
1 101 201 301 401 501 601 701 801 901
Time (Year)
Dos
e
Sampled U-238 Saturated Zone KD’s
1621651989344182821275123861

June 2010 | Argonne National Laboratory, USA
ENVIRONET Environmental Remediation Training Course
Temporal Plot of Dose with a Smallest Sampled KDin the Saturated Zone
0
50
100
150
200
250
300
350
1 101 201 301 401 501 601 701 801 901
Time (Year)
Dos
e
Sampled U-238 Saturated Zone KD’s
1621651989344182821275123861

June 2010 | Argonne National Laboratory, USA
ENVIRONET Environmental Remediation Training Course
Change in the Temporal Dose Profile as the KD in the Saturated Zone Changes
Sampled U-238 Saturated Zone KD’s
16216519893441828212751238610
50
100
150
200
250
300
350
1 101 201 301 401 501 601 701 801 901
Time (Year)
Dos
e
0
50
100
150
200
250
300
350
1 101 201 301 401 501 601 701 801 901
Time (Year)
Dos
e
0
50
100
150
200
250
300
350
1 101 201 301 401 501 601 701 801 901
Time (Year)
Dos
e
0
50
100
150
200
250
300
350
1 101 201 301 401 501 601 701 801 901
Time (Year)
Dos
e
0
50
100
150
200
250
300
350
1 101 201 301 401 501 601 701 801 901
Time (Year)
Dos
e
0
50
100
150
200
250
300
350
1 101 201 301 401 501 601 701 801 901
Time (Year)
Dos
e
0
50
100
150
200
250
300
350
1 101 201 301 401 501 601 701 801 901
Time (Year)
Dos
e
0
50
100
150
200
250
300
350
1 101 201 301 401 501 601 701 801 901
Time (Year)
Dos
e
0
50
100
150
200
250
300
350
1 101 201 301 401 501 601 701 801 901
Time (Year)
Dos
e
0
50
100
150
200
250
300
350
1 101 201 301 401 501 601 701 801 901
Time (Year)
Dos
e
0
50
100
150
200
250
300
350
1 101 201 301 401 501 601 701 801 901
Time (Year)
Dos
e

June 2010 | Argonne National Laboratory, USA
ENVIRONET Environmental Remediation Training Course
0
50
100
150
200
250
300
350
1 101 201 301 401 501 601 701 801 901
Time (Year)
Dos
ePeak of the Means Approach
Early Time Period
Not much variation of dose

June 2010 | Argonne National Laboratory, USA
ENVIRONET Environmental Remediation Training Course
Peak of the Means Approach
0
50
100
150
200
250
300
350
1 101 201 301 401 501 601 701 801 901
Time (Year)
Dos
e
Mean dose later in time:
larger variations of dose
June 2010 | Argonne National Laboratory, USA
ENVIRONET Environmental Remediation Training Course
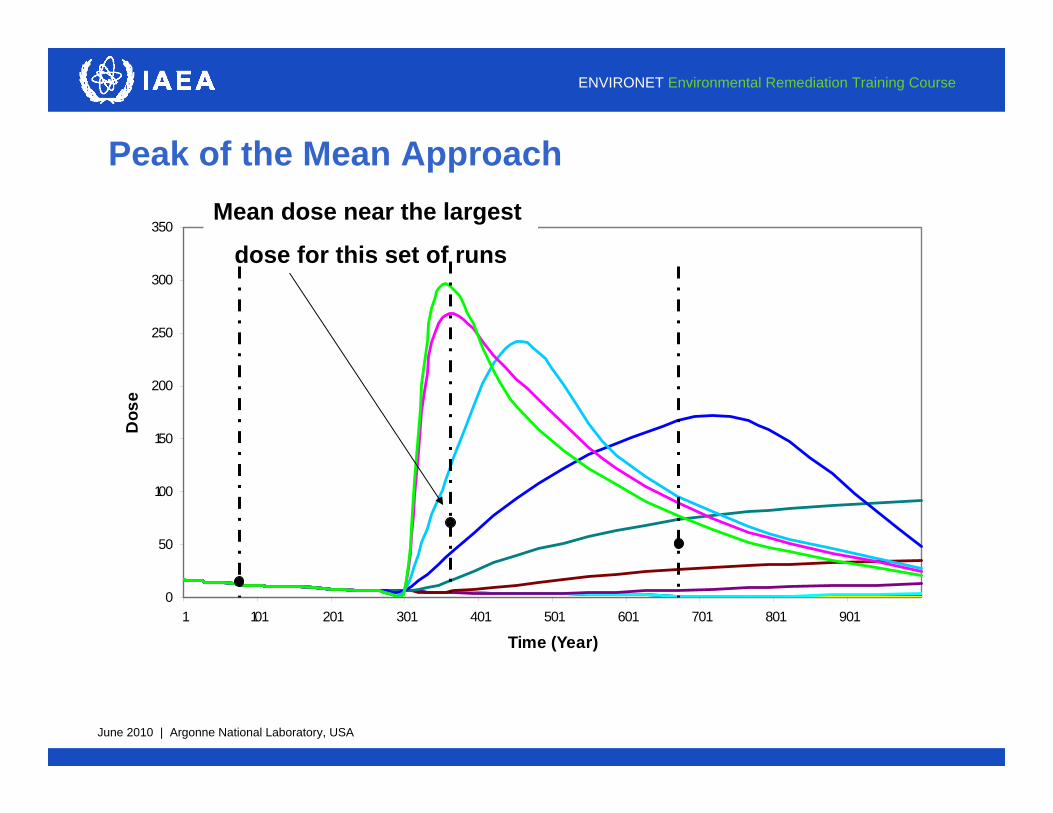
Peak of the Mean Approach
0
50
100
150
200
250
300
350
1 101 201 301 401 501 601 701 801 901
Time (Year)
Dos
e
Mean dose near the largest
dose for this set of runs
June 2010 | Argonne National Laboratory, USA
ENVIRONET Environmental Remediation Training Course
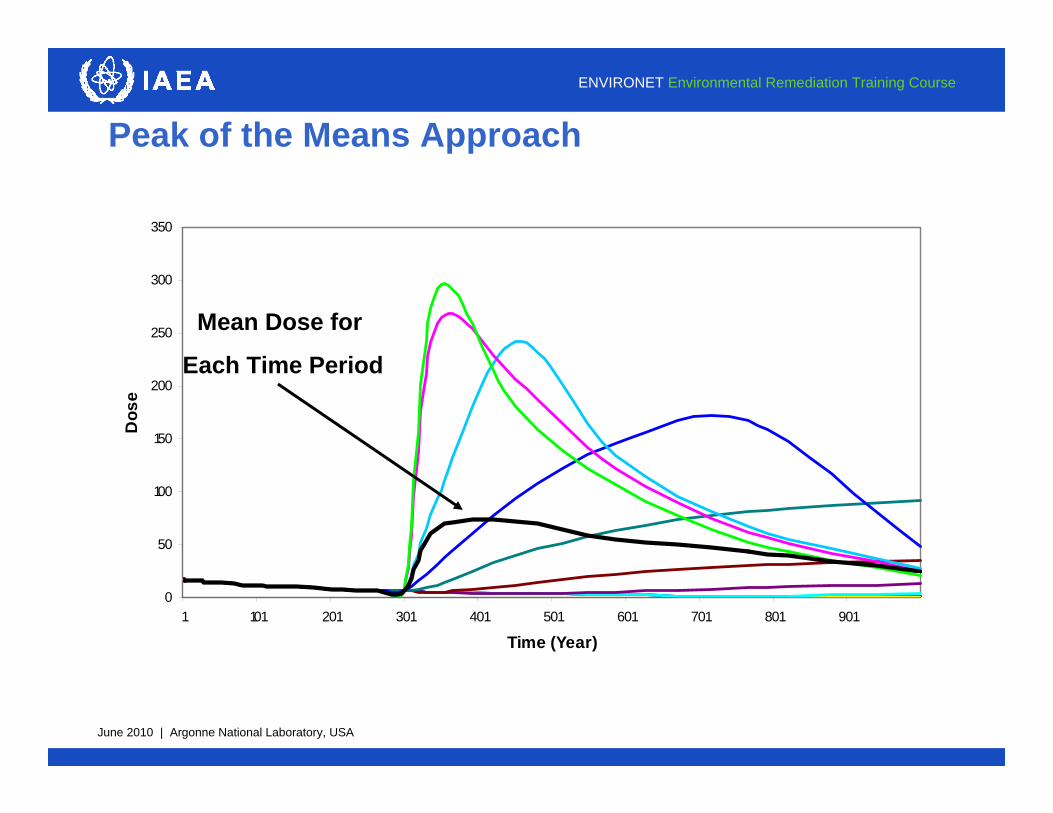
Peak of the Means Approach
0
50
100
150
200
250
300
350
1 101 201 301 401 501 601 701 801 901
Time (Year)
Dos
e
Mean Dose for
Each Time Period
June 2010 | Argonne National Laboratory, USA
ENVIRONET Environmental Remediation Training Course
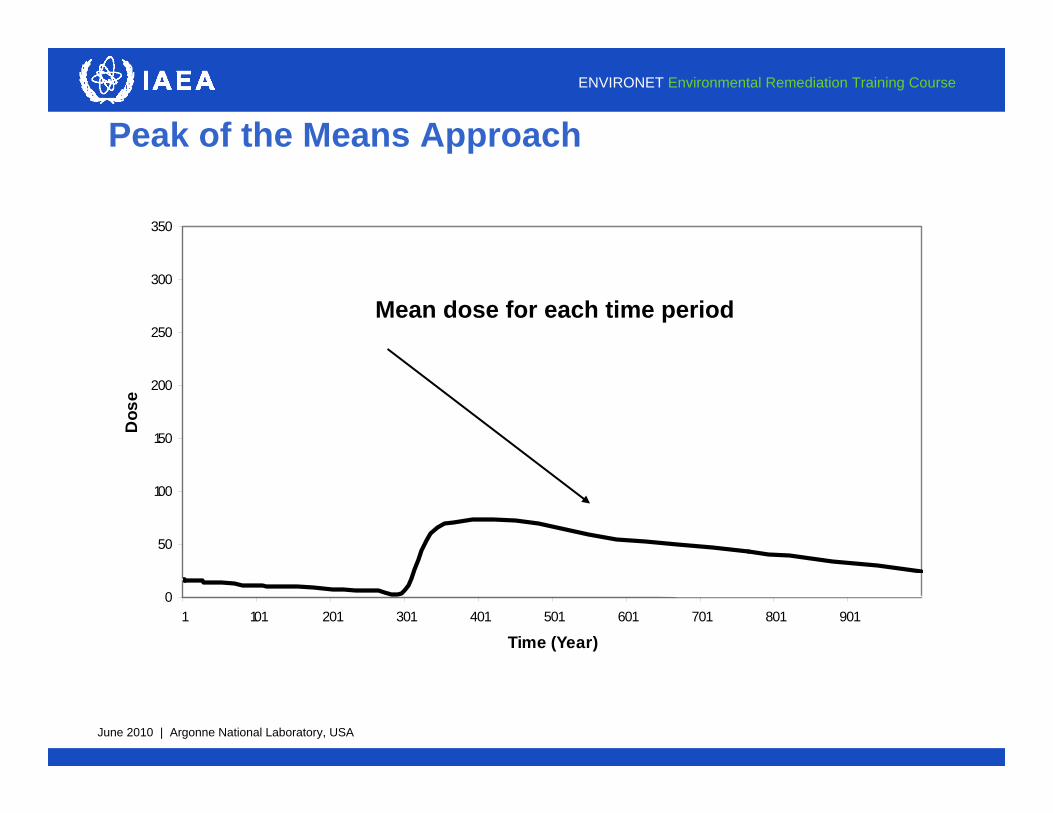
Peak of the Means Approach
0
50
100
150
200
250
300
350
1 101 201 301 401 501 601 701 801 901
Time (Year)
Dos
e
Mean dose for each time period
June 2010 | Argonne National Laboratory, USA
ENVIRONET Environmental Remediation Training Course
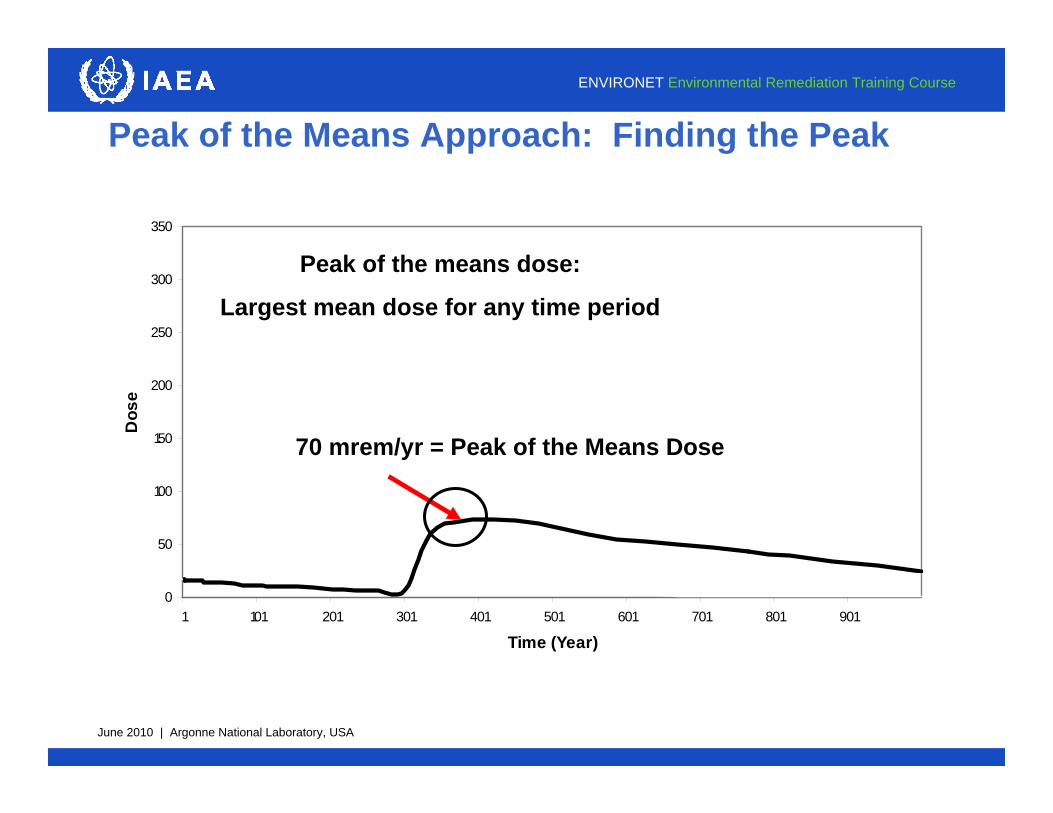
Peak of the Means Approach: Finding the Peak
0
50
100
150
200
250
300
350
1 101 201 301 401 501 601 701 801 901
Time (Year)
Dos
e
70 mrem/yr = Peak of the Means Dose
Peak of the means dose:
Largest mean dose for any time period

June 2010 | Argonne National Laboratory, USA
ENVIRONET Environmental Remediation Training Course
Mean of the Peaks Approach: Original Results
0
50
100
150
200
250
300
350
1 101 201 301 401 501 601 701 801 901
Time (Year)
Dos
e

June 2010 | Argonne National Laboratory, USA
ENVIRONET Environmental Remediation Training Course
Mean of the Peaks Dose: Identify the Peak Dose for Each
0
50
100
150
200
250
300
350
1 101 201 301 401 501 601 701 801 901
Time (Year)
Dos
e

June 2010 | Argonne National Laboratory, USA
ENVIRONET Environmental Remediation Training Course
Mean of the Peaks Approach: Calculate the Average Dose Using the Peak Values
0
50
100
150
200
250
300
350
1 101 201 301 401 501 601 701 801 901
Time (Year)
Dos
e
Mean of the
Peaks Dose=
112922592421675.925.355.165.165.165.165.16
= 106 mrem/yr
mrem/yr
June 2010 | Argonne National Laboratory, USA
ENVIRONET Environmental Remediation Training Course
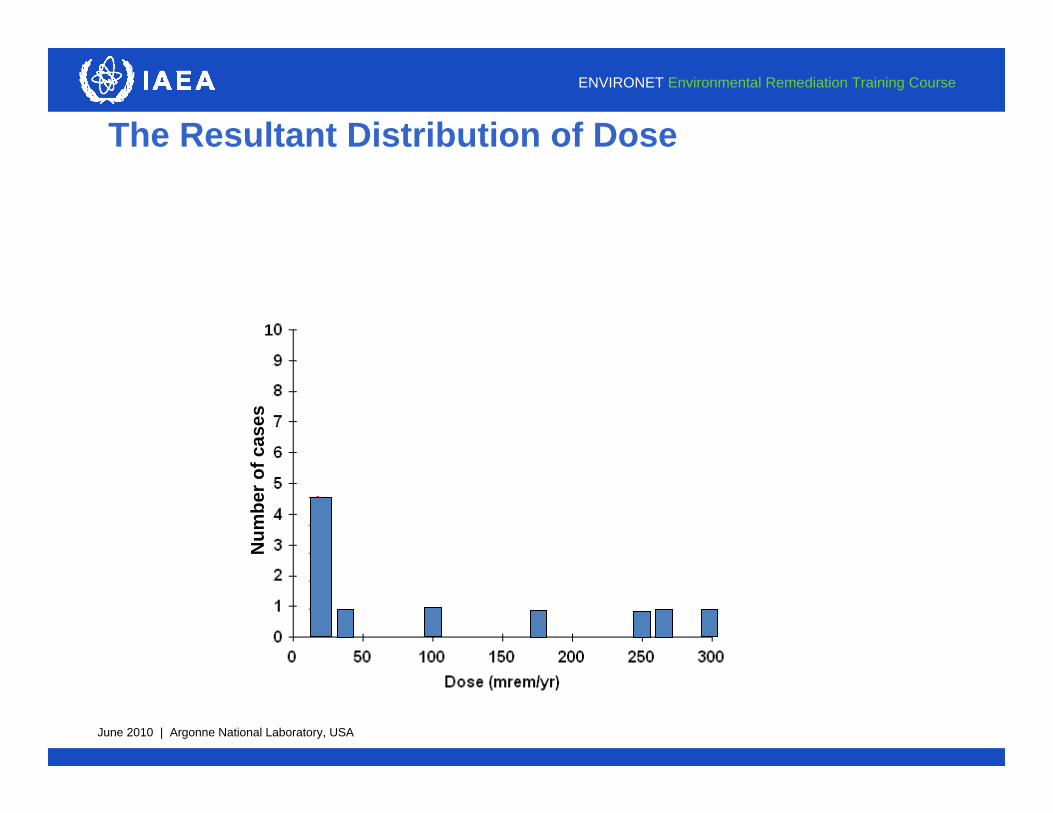
The Resultant Distribution of Dose
Num
ber o
f cas
es
1
June 2010 | Argonne National Laboratory, USA
ENVIRONET Environmental Remediation Training Course
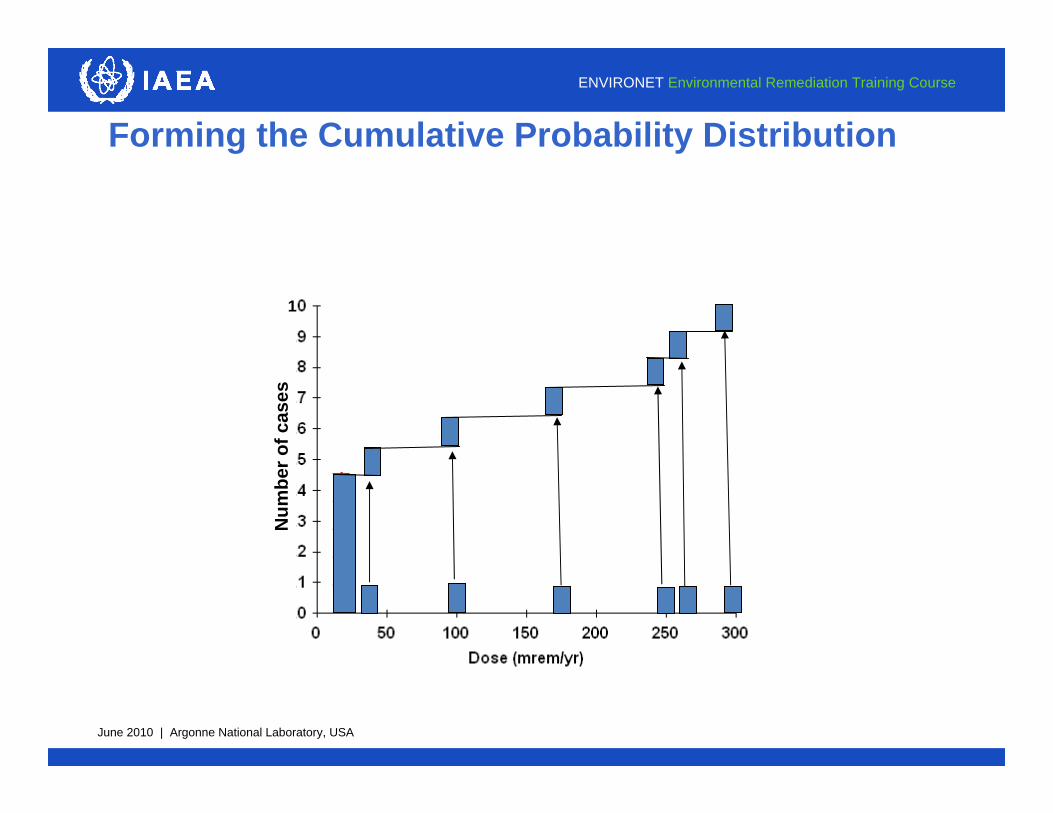
Forming the Cumulative Probability Distribution
Num
ber o
f cas
es1

June 2010 | Argonne National Laboratory, USA
ENVIRONET Environmental Remediation Training Course
Forming the Cumulative Probability Distribution

June 2010 | Argonne National Laboratory, USA
ENVIRONET Environmental Remediation Training Course
Resultant Cumulative Probability Distribution
June 2010 | Argonne National Laboratory, USA
ENVIRONET Environmental Remediation Training Course
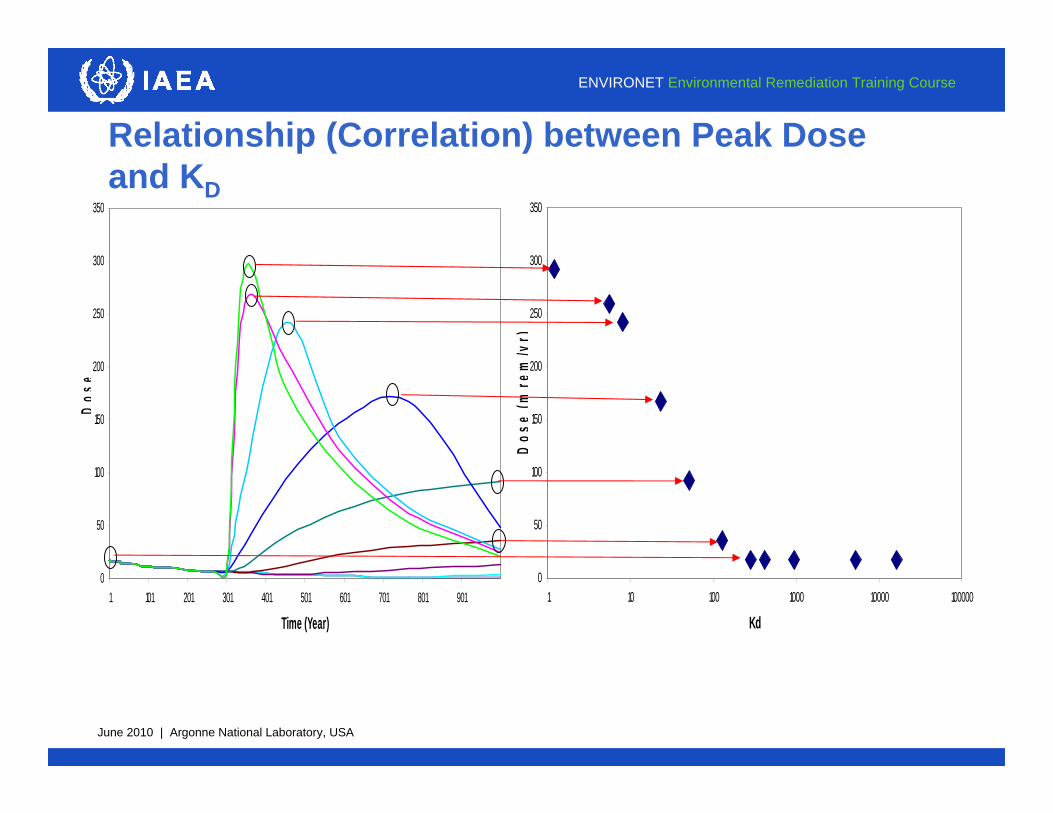
Relationship (Correlation) between Peak Doseand KD
0
50
100
150
200
250
300
350
1 101 201 301 401 501 601 701 801 901
Time (Year)
Dos
e
0
50
100
150
200
250
300
350
1 10 100 1000 10000 100000
Kd
Dos
e(m
rem
/yr)

June 2010 | Argonne National Laboratory, USA
ENVIRONET Environmental Remediation Training Course
Scatter plot of Correlation (as Seen in RESRAD)
0
50
100
150
200
250
300
350
1 10 100 1000 10000 100000
Kd
Dos
e (m
rem
/yr)
Dose is sensitive to
KD in this region

June 2010 | Argonne National Laboratory, USA
ENVIRONET Environmental Remediation Training Course
Comparison of Results
“Mean of the Peaks” dose is always greater than or equal to the “Peak of the Means” dose– Peak of the Means Dose = 70 mrem/yr– Mean of the Peaks Dose = 106 mrem/yr
When would the “Mean of the Peaks” dose and the “Peak of the Means” dose be equal?– The peak dose for each observation would have to occur at the
same time
June 2010 | Argonne National Laboratory, USA
ENVIRONET Environmental Remediation Training Course
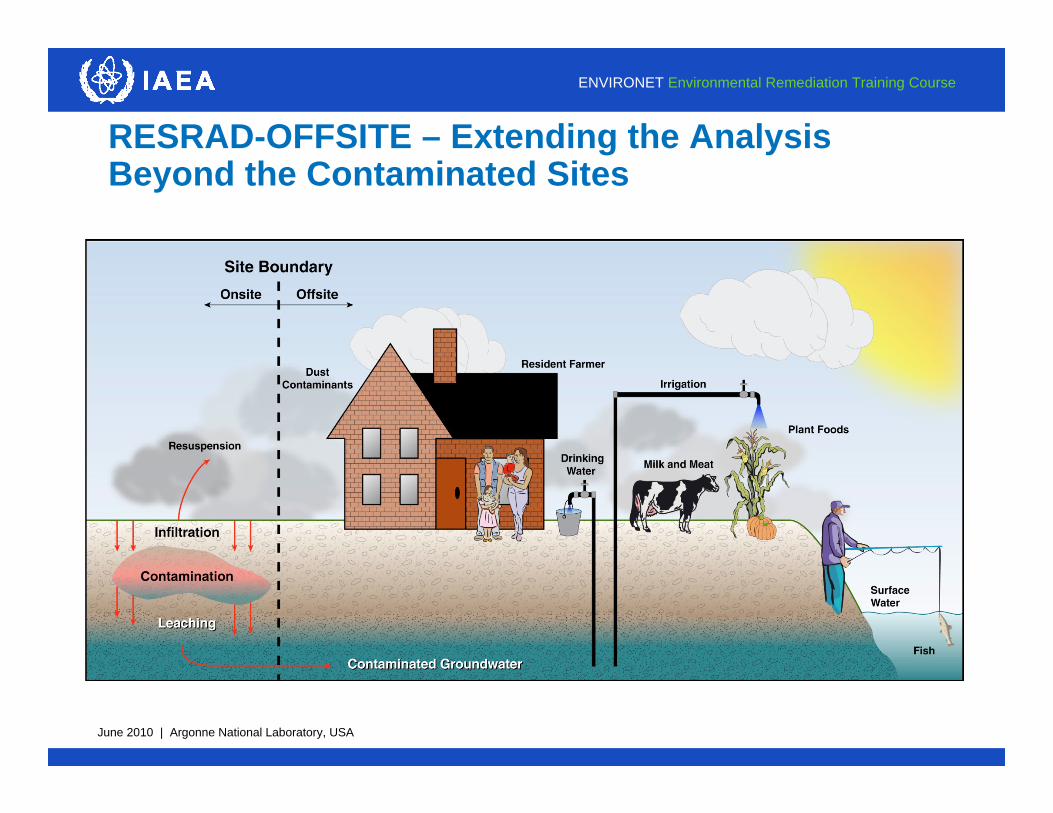
RESRAD-OFFSITE – Extending the Analysis Beyond the Contaminated Sites

June 2010 | Argonne National Laboratory, USA
ENVIRONET Environmental Remediation Training Course
Area of Primary Contamination
Primary contamination
Surface water body
Fruit, grain, non-leafy vegetables
Leafy vegetables
FodderDwelling site
well
June 2010 | Argonne National Laboratory, USA
ENVIRONET Environmental Remediation Training Course
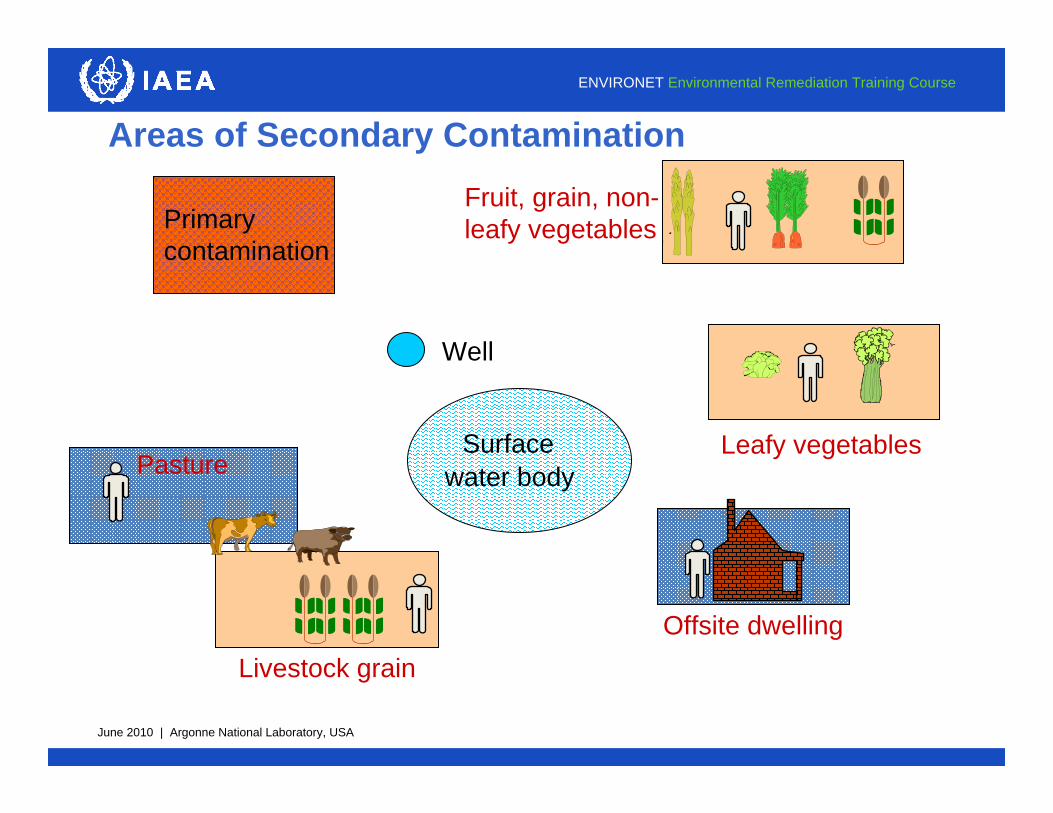
Areas of Secondary Contamination
Primary contamination
Well
Fruit, grain, non-leafy vegetables
Leafy vegetablesPasture
Livestock grainOffsite dwelling
Surface water body

June 2010 | Argonne National Laboratory, USA
ENVIRONET Environmental Remediation Training Course
Transport to Areas of Secondary Contamination
Well
Three interrelated releases: wind erosion, leaching, erosion by runoff
Surface water body
Wind erosion
Leaching
Runoff
Pasture
Livestock grain
Fruit, grain, non-leafy vegetables
Leafy vegetables
Offsite dwelling
Primary contamination

June 2010 | Argonne National Laboratory, USA
ENVIRONET Environmental Remediation Training Course
Major New Models/Features in RESRAD-OFFSITE
Transport Pathways Air dispersion (Gaussian plume) model Groundwater transport model
• 1-D advective, 1-D dispersive transport in unsaturated zone• 1-D advective (straight or curved flow path), 3-D dispersive transport in
saturated zone
Additional Impacted Areas Choice of two dwelling locations (onsite, offsite) Four agriculture areas Well and surface water body can be at different locations Accumulation in offsite soil and surface water body
Improved User Interface Graphical map user interface Both deterministic and probabilistic analysis

June 2010 | Argonne National Laboratory, USA
ENVIRONET Environmental Remediation Training Course
Input of Intermediate Contaminant Fluxes and Concentrations
RESRAD-OFFSITE can be flagged to read in: Releases and inventory of the primary contamination (deterministic run)
• Flux to groundwater• Flux to atmosphere• Flux to surface water• Inventory remaining in the primary contamination and mixing layers
Concentrations in surface water and well
This feature allows the application of RESRAD-OFFSITE to various contamination situations, e.g., Land disposal of waste Emissions from effluent stacks Discharges from wastewater pipelines
June 2010 | Argonne National Laboratory, USA
ENVIRONET Environmental Remediation Training Course
68
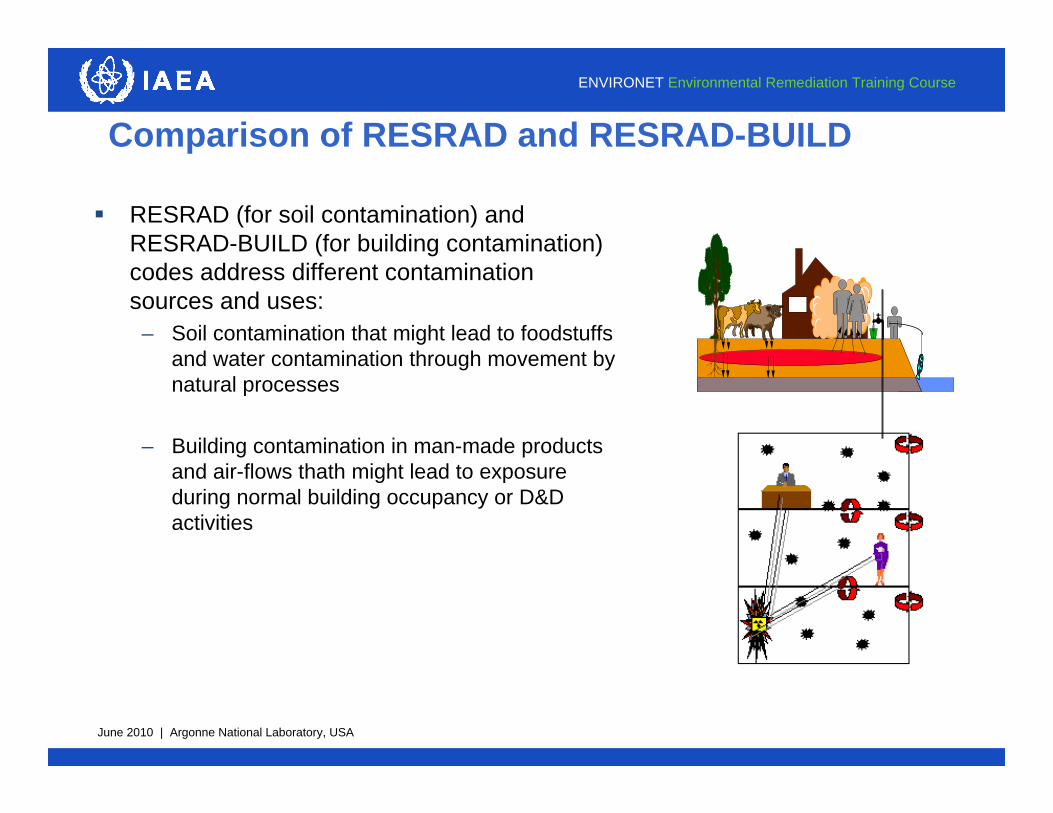
Comparison of RESRAD and RESRAD-BUILD
RESRAD (for soil contamination) and RESRAD-BUILD (for building contamination) codes address different contamination sources and uses:
– Soil contamination that might lead to foodstuffs and water contamination through movement by natural processes
– Building contamination in man-made products and air-flows thath might lead to exposure during normal building occupancy or D&D activities
June 2010 | Argonne National Laboratory, USA
ENVIRONET Environmental Remediation Training Course
69
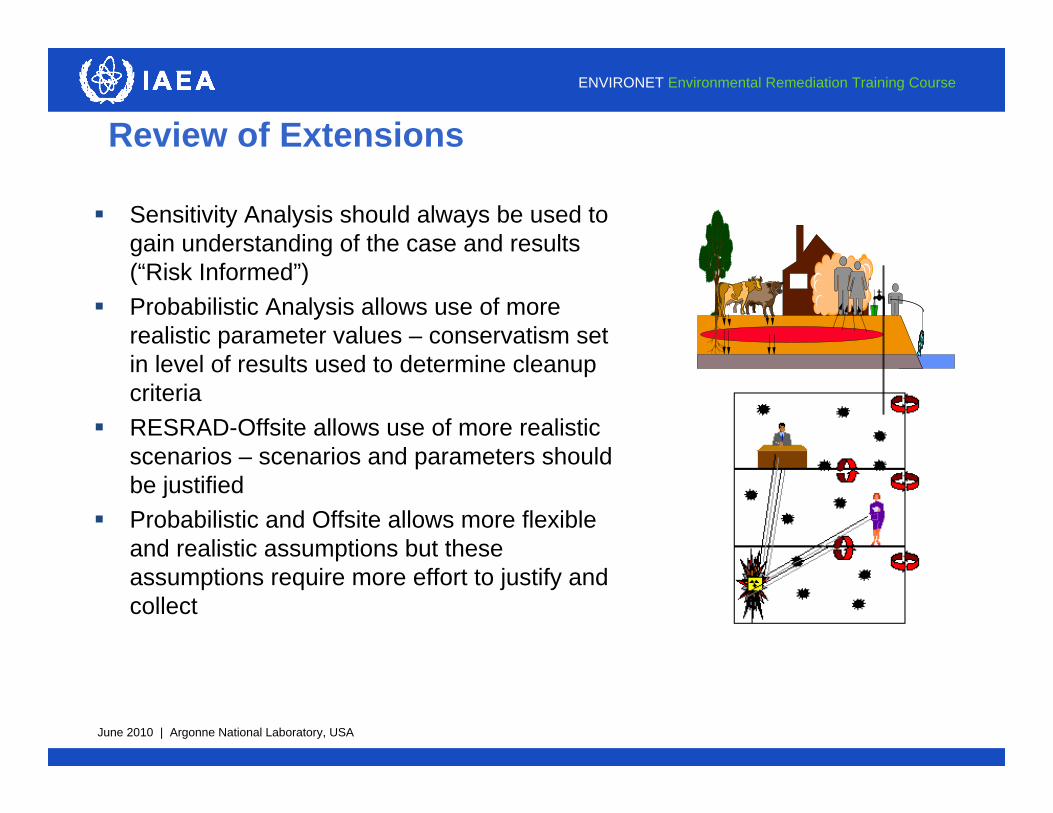
Review of Extensions
Sensitivity Analysis should always be used to gain understanding of the case and results (“Risk Informed”)
Probabilistic Analysis allows use of more realistic parameter values – conservatism setin level of results used to determine cleanup criteria
RESRAD-Offsite allows use of more realistic scenarios – scenarios and parameters should be justified
Probabilistic and Offsite allows more flexible and realistic assumptions but these assumptions require more effort to justify and collect


