____________________________________________________________________________ This document is available to the public from the National Technical Information Service, Springfield, VA 22161 DOT HS 809 952 January 2006 Technical Report VEHICLE SURVIVABILITY AND TRAVEL MILEAGE SCHEDULES Published By: NHTSA’s National Center for Statistics and Analysis
Transcript
____________________________________________________________________________ This document is available to the public from the National Technical Information Service, Springfield, VA 22161
4. Title and Subtitle Vehicle Survivability and Travel Mileage Schedules
6. Performing Organization Code
NPO-130 7. Author(s) S. Lu
8. Performing Organization Report No. 10. Work Unit No. (TRAIS)n code
9. Performing Organization Name and Address National Center for Statistics and Analysis Regulatory Analysis and Evaluation Division National Highway Traffic Safety Administration U.S. Department of Transportation NPO-130, 400 Seventh Street, S.W. Washington, DC 20590
11. Contract of Grant No.
13. Type of Report and Period Covered NHTSA Technical Report
12. Sponsoring Agency Name and Address U.S. Department of Transportation NPO-130, 400 Seventh Street, S.W. Washington, DC 20590
14. Sponsoring Agency Code
15.Supplementary Notes
16. Abstract This document serves to update the 1995 document of the same title. In this revision, we attempt to retain the methodology as much as possible from the previous release. Regardless, some changes were introduced in this updated analysis when needed. In this revision, we find that passenger cars and light trucks are being driven farther in their lifetimes (approximately 26,000 miles more per vehicle class). However, whereas younger passenger cars (less than 20 years old) are surviving slightly longer relative to the previous study, light trucks are not surviving as long as before early on in their existence, presumably due to the fact that they are being used more often as passenger vehicles than strictly for cargo. The updated analysis shows that a typical passenger car will travel a lifetime mileage of 152,137 miles, while light trucks will travel 179,954 miles. Passenger car lifetime weighted present discount factors at 3 percent, 7 percent and 10 percent are, respectively, 0.8304, 0.6700 and 0.5824; for light trucks with the same discount rates, respectively, 0.8022, 0.6303 and 0.5419. 17. Key Words
7.1. Corporate Average Fuel Economy (CAFE) VMT Schedules _______________ 35
1
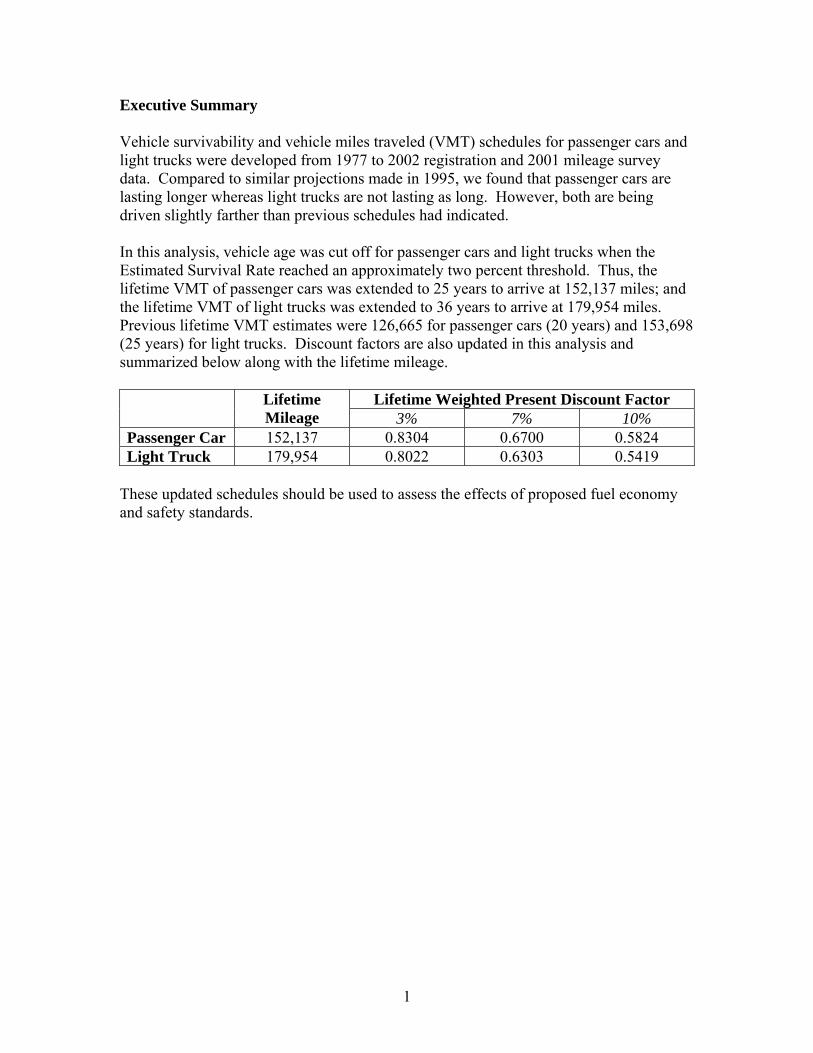
Executive Summary Vehicle survivability and vehicle miles traveled (VMT) schedules for passenger cars and light trucks were developed from 1977 to 2002 registration and 2001 mileage survey data. Compared to similar projections made in 1995, we found that passenger cars are lasting longer whereas light trucks are not lasting as long. However, both are being driven slightly farther than previous schedules had indicated. In this analysis, vehicle age was cut off for passenger cars and light trucks when the Estimated Survival Rate reached an approximately two percent threshold. Thus, the lifetime VMT of passenger cars was extended to 25 years to arrive at 152,137 miles; and the lifetime VMT of light trucks was extended to 36 years to arrive at 179,954 miles. Previous lifetime VMT estimates were 126,665 for passenger cars (20 years) and 153,698 (25 years) for light trucks. Discount factors are also updated in this analysis and summarized below along with the lifetime mileage.
These updated schedules should be used to assess the effects of proposed fuel economy and safety standards.
2
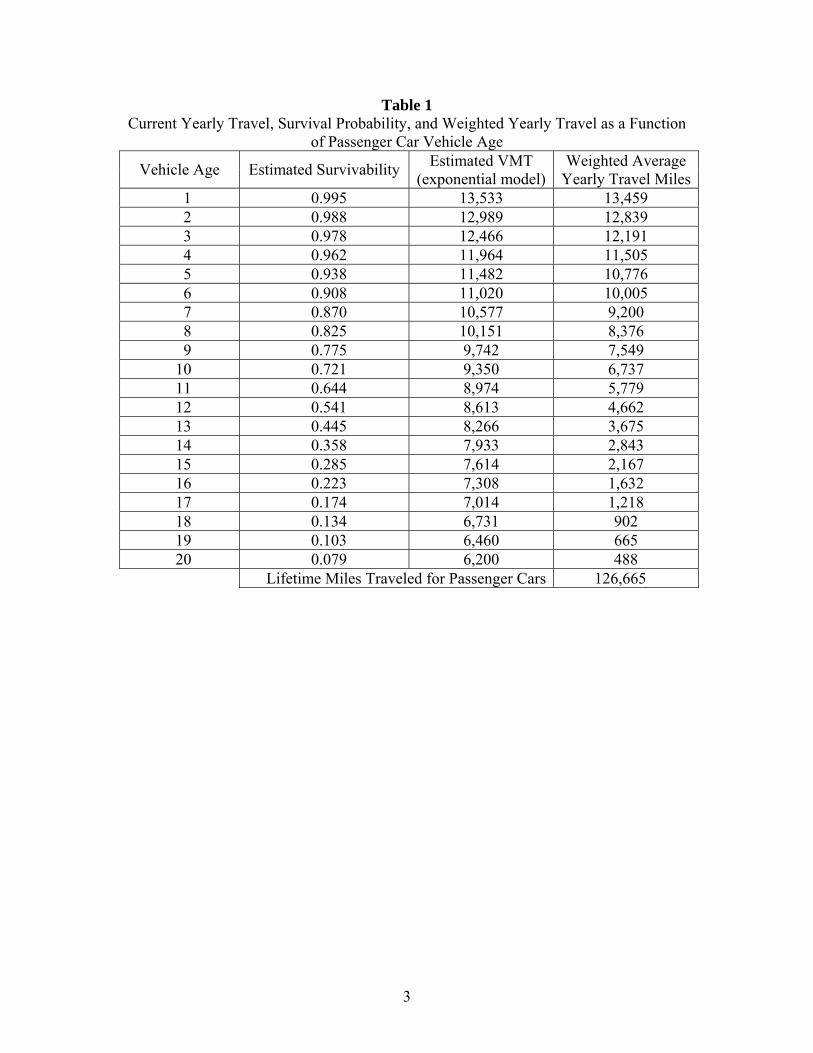
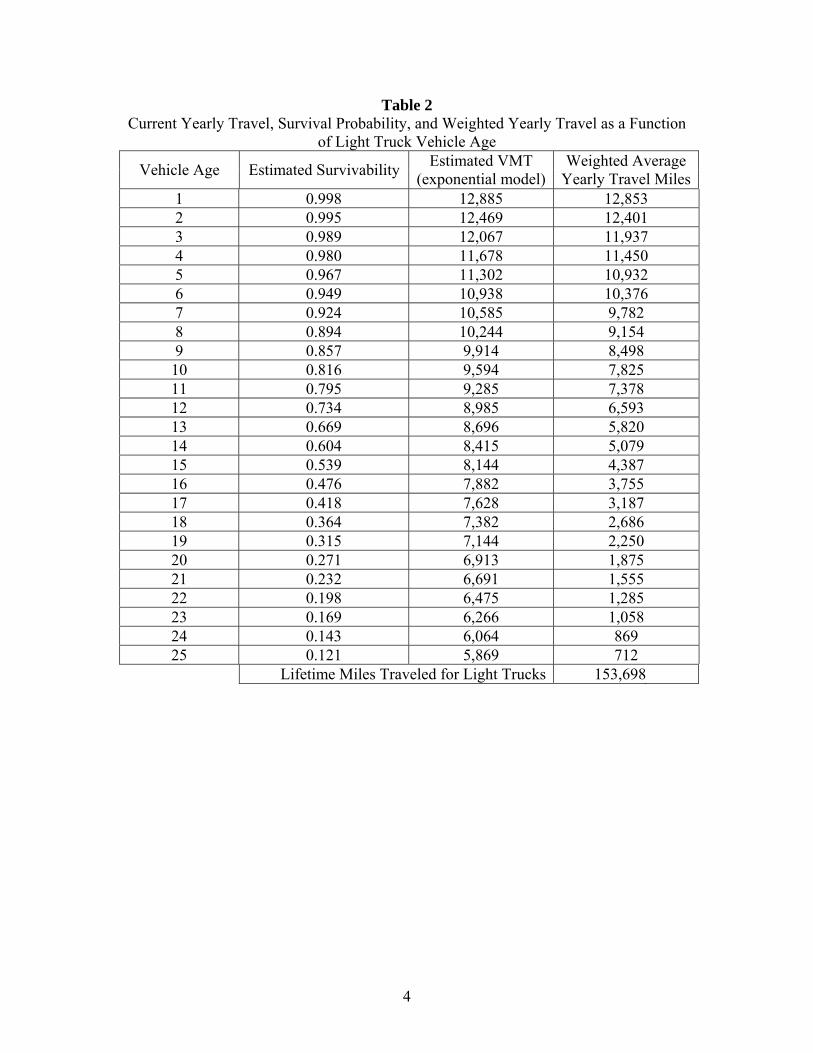
1. Introduction of Current Survivability and VMT Schedules Survivability and vehicle mileage by age schedules are needed to accurately assess the impact of automotive fuel economy standards and safety standards. The survivability schedule can be used to estimate the phase-in of new safety equipment into the vehicle fleet. These two schedules are used to compute the total weighted travel mileage over the vehicle lifetime, which is used to estimate the impact of proposed fuel economy standards on future fuel consumption and operating costs. (“Current” refers to the 1995 VMT-Survivability schedule whereas “Updated” denotes newly acquired information utilized in updating the 1995 schedule.) 1.1. Passenger Cars The 20-year schedule1 for passenger car survivability currently in use by the National Highway Traffic Safety Administration (NHTSA) was developed from R.L. Polk & Company data on registered vehicles in use by model year over the calendar years 1975 to 1993. The vehicle miles traveled (VMT) schedule currently used for passenger cars is derived from the 1991 Residential Transportation Energy Consumption Survey (RTECS)—which was designed by the Energy Information Administration (EIA) of the Department of Energy (DOE)—to collect information on the use of energy in residential vehicles in the United States. These passenger car schedules are shown in Table 1. The fourth column of Table 1, “Weighted Average Yearly Travel,” is the product of the previous two columns—the survivability and VMT schedules. The average lifetime passenger car weighted VMT is simply the sum of the yearly average travel miles over the lifetime of the car. In this case, we estimated that a passenger car would last roughly 20 years and travel a lifetime mileage of 126,665 miles. 1.2. Light Trucks The survivability and VMT 25 year schedules currently used by NHTSA for light truck regulatory impact analyses are shown in Table 2. Survivability data was obtained from 1975 to 1993 R.L. Polk and Company registrations on trucks in operation. Light truck VMT data was also taken from the 1991 RTECS. The weighted yearly travel was again the product of survivability and VMT. The total light truck weighted VMT calculated from these schedules was 153,698 miles.
Note that based on the 1975 to 1993 Polk data, 7.9 percent of passenger cars are still on the road after 20 years and 12.1 percent of light trucks are still on the road after 25 years. 1 Updated Vehicle Survivability and Travel Mileage Schedules, NHTSA (Report Number: DOT HS 808 339), November 1995.
3
Table 1 Current Yearly Travel, Survival Probability, and Weighted Yearly Travel as a Function
of Passenger Car Vehicle Age
Vehicle Age Estimated Survivability Estimated VMT (exponential model)
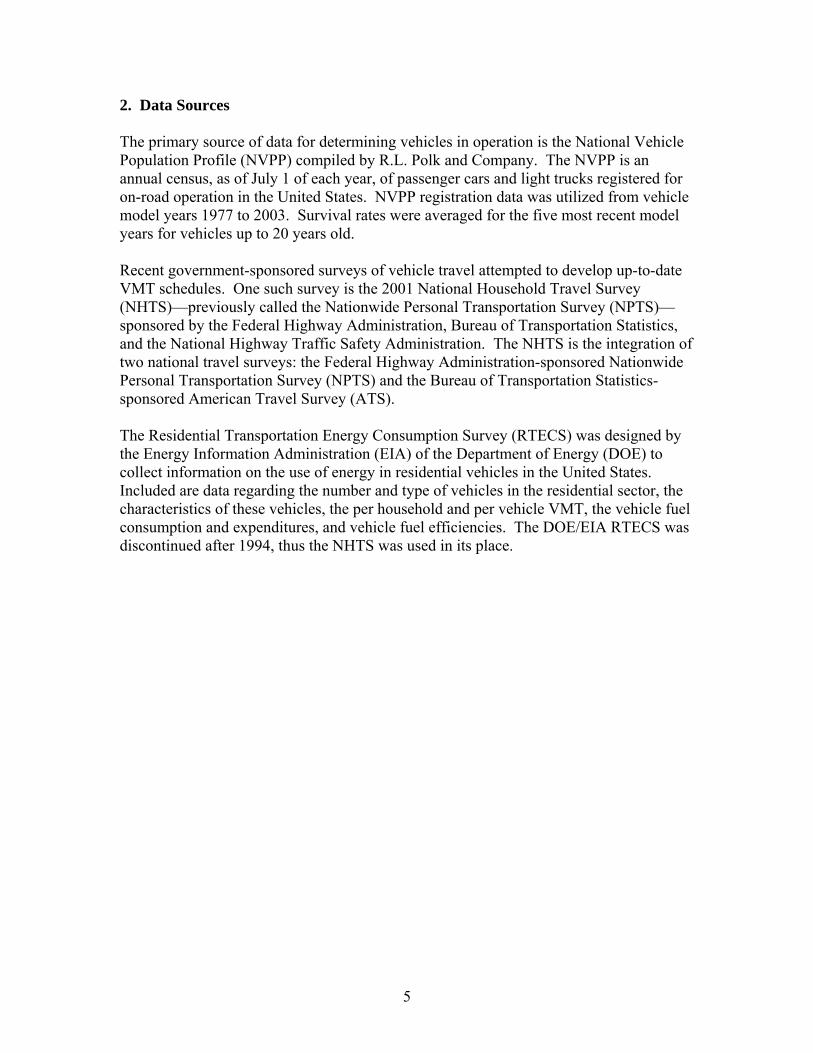
2. Data Sources The primary source of data for determining vehicles in operation is the National Vehicle Population Profile (NVPP) compiled by R.L. Polk and Company. The NVPP is an annual census, as of July 1 of each year, of passenger cars and light trucks registered for on-road operation in the United States. NVPP registration data was utilized from vehicle model years 1977 to 2003. Survival rates were averaged for the five most recent model years for vehicles up to 20 years old. Recent government-sponsored surveys of vehicle travel attempted to develop up-to-date VMT schedules. One such survey is the 2001 National Household Travel Survey (NHTS)—previously called the Nationwide Personal Transportation Survey (NPTS)—sponsored by the Federal Highway Administration, Bureau of Transportation Statistics, and the National Highway Traffic Safety Administration. The NHTS is the integration of two national travel surveys: the Federal Highway Administration-sponsored Nationwide Personal Transportation Survey (NPTS) and the Bureau of Transportation Statistics-sponsored American Travel Survey (ATS). The Residential Transportation Energy Consumption Survey (RTECS) was designed by the Energy Information Administration (EIA) of the Department of Energy (DOE) to collect information on the use of energy in residential vehicles in the United States. Included are data regarding the number and type of vehicles in the residential sector, the characteristics of these vehicles, the per household and per vehicle VMT, the vehicle fuel consumption and expenditures, and vehicle fuel efficiencies. The DOE/EIA RTECS was discontinued after 1994, thus the NHTS was used in its place.
6
3. Survivability Analysis 3.1. Passenger Cars The passenger car survival rate2 schedule based on 1977 to 2003 NVPP registrations is shown in Table 3. Since the annual NVPP registration data is tabulated as of July 1 and model year production ends several months later, the total production for model year N will appear in the NVPP data for calendar year N+1. Therefore, the survivability for vehicles with age A will be found in NVPP calendar year N+1+A, which is A+1 years after model year N. Taking the 1977 model year (MY) vehicles as an example, calendar year (CY) 1978 is assumed to have the total production for MY 1977. Thus, CY 1978 would be the base-line year for MY 1977. In addition, CY 1978 would represent a vehicle age of zero years for MY 1977; CY 1979 vehicles would be one year old, and so on. Therefore, the original survival rates were adjusted upward by one year to reflect the actual survivability computed from the NVPP registration data. A piece-wise linear relationship appeared to exist between “LN( –LN(1 – Survival Rate))” and “Vehicle Age.” Two linear regressions were performed for cars up to and including 10 years old and for cars over 10 years old to produce an accurate estimate for survival rate as a function of vehicle age. This yielded the following: Estimated Survival Rate = 1 – EXP[ –EXP(A + B × Age)] (regression model) where, for Age ≤ 10 for Age > 10 A = 1.64905 3.38136 B = -0.12143 -0.28623 r2 = 0.9921 0.9985
The regression estimates produced a 0.9921 coefficient of determination (r2) for vehicle age 10 years old and less, and 0.9985 for vehicles greater than 10 years old. The
2 Survival rate as used in this report is defined as the ratio of the number of vehicles remaining in the fleet at a given year as compared to a base-line year. Continuing with the example from above, as mentioned before, the number of MY 1977 vehicles sold in CY 1978 would serve as the base-line year for MY 1977 vehicles. In other words, CY 1978 would represent year zero (a base-line year) for MY 1977 vehicles, and the survival rate of MY 1977 vehicles in CY 1978 would be 1.0 (the number of MY 1977 vehicles in the fleet divided by to the number of MY 1977 vehicles sold is equal to one). In the following year, CY 1979, MY 1977 vehicles would be one year old. We would expect that the number of MY 1977 vehicles to have diminished due to reasons such as accidents, thefts, etc. and thus the survival rate would be less then 1.0; for CY 1980, the survival rate would be less then that found in CY 1979, and so on. A table of the survival rates as a function of the vehicle’s age (rather than as a function of its model year or the calendar year) was generated so that vehicles of differing model years, but the same vehicle age, could be matched-up to arrive at a five-year average survival rate for a particular vehicle age (e.g., three year-old vehicles are averaged together but maybe comprised of vehicles from model years 1995, 1996, 1997, 1998, and 1999).
7
estimated survival rates were computed for vehicle ages 1 to 25 years old using the above regression model and appropriate regression coefficients, A and B. The current passenger car estimated survivability schedule (1975 to 1993 NVPP data) is presented with the updated estimated survivability (1977 to 2002 NVPP data) in Figure 1. The current survivability is nearly equal to the updated survivability for newer cars up to five years old. For middle-aged to older cars between 6 and 20 years old, the updated survivability schedule indicates that newer cars are lasting longer as compared to the previous survivability schedule.
8
Table 3 Survivability of Passenger Cars by Vehicle Age
from 1977 to 2002 NVPP Registration Data
Vehicle Age Adjusted Survival Rate LN(1-SR) LN(-LN(1-SR)) Estimated
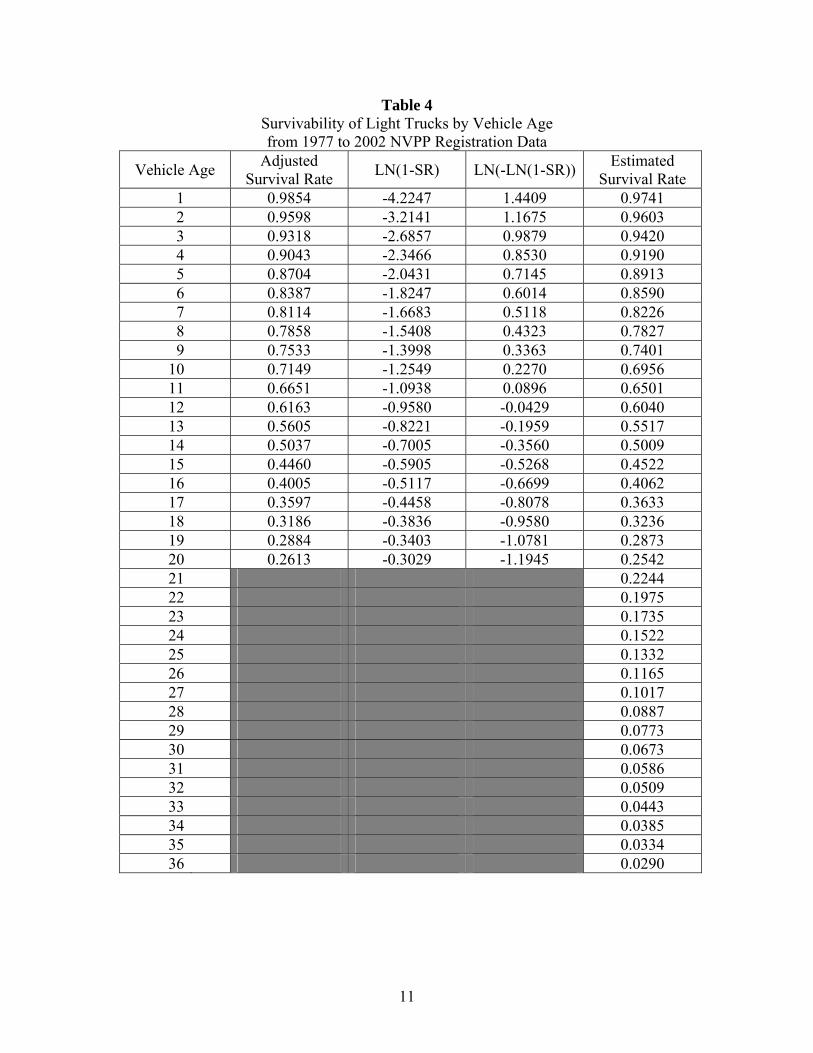
3.2 Light Trucks The light truck survivability computed from NVPP registrations is presented in Table 4. As was done with passenger cars, two linear regressions of “LN(–LN(1–Actual Survival Rate))” with the vehicle age adjusted were produced for light trucks up to and including 12 years of age and for light trucks greater than 12 years old. The cut-off point between the two linear regressions was increased by two years, relative to the previous study, for light trucks to produce a better fit and “smoother” curve. Estimated Survival Rate = 1 – EXP[ –EXP(A + B × Age)] (regression model) for Age ≤ 12 for Age > 12 A = 1.42048 1.64815 B = -0.12470 -0.14373 r2 = 0.97774 0.99662
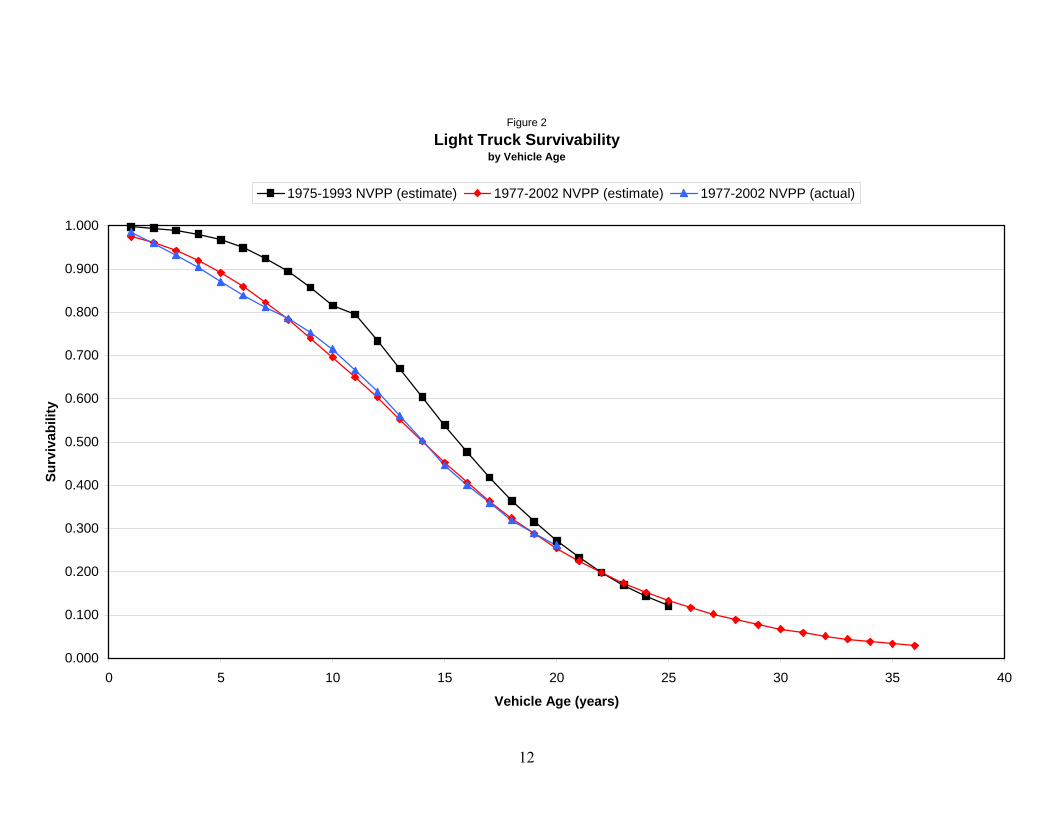
A comparison of the current light truck survivability schedule with the updated survival rate schedule is presented in Figure 2. Unlike passenger cars, it is readily apparent that, based on the updated survivability schedule, younger light trucks are not lasting as long as younger light trucks from the current schedule. The most likely explanation is that there is an increase in usage of light trucks as passenger vehicles, thus raising the exposure of light trucks to crashes and rollovers. This trend lasts approximately until 20 years of age, achieving a maximum difference of about 0.1445 at 11 years of age. Beyond 20 years of age, the survivability rates of both schedules begin to converge. It is interesting to compare the updated passenger car survival rates with updated light truck survival rates. A higher percentage of passenger cars are surviving longer early in their lives relative to light trucks of comparable vintage (up to about age 12). (Conversely, the 1995 VMT-survivability schedule illustrates the opposite trend, namely, light trucks are surviving longer early in their lives when compared to passenger cars.)
11
Table 4 Survivability of Light Trucks by Vehicle Age from 1977 to 2002 NVPP Registration Data
Vehicle Age Adjusted Survival Rate LN(1-SR) LN(-LN(1-SR)) Estimated
4. VMT Analysis The annual vehicle miles traveled (VMT) as a function of vehicle age for passenger cars up to 25 years old and light trucks up to 30 years old with their respective weighting factor3 from the 2001 NHTS is shown in Table 5 and Table 6, respectively. Prior to the 1995 NPTS, FHWA collected VMT data by asking consumers to estimate the number of miles they drive in a given year. Starting with the 1995 NPTS, FHWA changed their methodology and collected two odometer readings over a two-month period and then annualized the difference to arrive at an annual VMT. The data was collected over a 14-month period, starting in March 2001 and ending in May 2002. Since model year 2002 vehicles begin to appear in September 2001, and were already about eight months old by the end of the survey, it was assumed that 2002 vehicles were one year old in the VMT analysis, MY 2001 vehicles are two years old, and so on. A brief overview of the methodology of how the final data set that was used is discussed herein. Focusing on the variable "VEHTYPE", for the passenger car VMT analysis, all records pertaining to automobile vehicle types were included whereas those relating to any other vehicle types were eliminated. Conversely, for the light truck VMT analysis, records dealing with passenger cars were eliminated. Also, all records pertaining to "Other", "Motorcycle", "Refused", and "Don't Know" were also removed. Next, we looked at the variable "VEHYEAR." Since we could not calculate a vehicle without its model year, we eliminated all records pertaining to "Refused", "Don't Know", and "Not Ascertained"; in other words, those that did not respond were not included. Lastly, we then turned to the variable "BESTMILE." All records pertaining to "Appropriate Skip", "Refused", "Don't Know", and "Not Ascertained" were eliminated. Doing this deleted all records for which “VEHTYPE” is "RV" or "Other Truck" (i.e., all BESTMILES were blank for those types at this point). In addition, when the variable “BESTMILE”4 was equal to zero, the record was flagged and the mileage was confirmed with another mileage variable, “ANNMILE.” If “ANNMILE” was not zero, then the value of ANNMILE was taken to be the annual mileage. However, if “ANNMILE” was also zero, then it was assumed that the vehicle did, indeed, travel zero miles in a given year and the record was not included in the study.
3 The weighting factors were derived based on various factors such the time of year sampled, geographic location, household size, and so on. More information can be found in Chapter 5 and Chapter 7, Section D of the 2001 NHTS User’s Guide, which can be found at http://nhts.ornl.gov/2001/usersguide/index.shtml. 4 The variable “BESTMILE” is an attempt to choose the best estimate of the annual mileage for a vehicle. This best guess is derived from two sources: an annualized mileage based on two odometer readings that are approximately two months apart (recorded in the variable “ANNUALIZED”); the other figure is based on a driver’s reported estimate of how many miles were driven in a given year (variable “ANNMILES”).
14
4.1. Passenger Cars After inspection of the data, a linear relationship between VMT and vehicle age was postulated. In addition, whereas the current schedule assumed an exponential relationship between VMT and vehicle age, a cubic relationship between age and mileage was postulated and found to have a very good fit. Utilizing the statistical software package, STATA™ v8.2, a weighted regression analysis was performed, and resulted in the following:
Estimated VMT = A × (Age)3 + B × (Age)2 + C × (Age) + D A B C D r2
Cubic Polynomial
Model 0.3672131 -13.21949 -232.8491 14476.36 0.9689 A comparison of the current and updated VMT schedules as well as the actual VMT data from the 2001 NHTS survey as a function of vehicle age is presented in Table 5 and Figure 3 for passenger vehicles. Each record has an associated weighting factor accompanying it so that users of the NHTS data are able to, if need be, bring up the individual records to a representative level. The column “Sum of Weights” is the arithmetic sum of all the weighting factors for a particular age of a vehicle.
15
Table 5 VMT Schedule for Passenger Cars from 2001 FHWA NHTS
4.2. Light Trucks Similar to passenger cars, a cubic model was hypothesized and a linear regression was performed based on the model.
Estimated VMT = A × (Age)3 + B × (Age)2 + C × (Age) + D A B C D r2
Cubic Polynomial
Model 0.6806403 -22.844801 -238.5518 16345.32 0.9634 Unlike the passenger car where the linear regression curve declines as the vehicles age increases up to its lifespan of 25 years, for light trucks, we reach an inflection point5 within the lifespan of the truck at an approximate vehicle age of 27 years. In other words, after year 27, the VMT begins to increase rather than steadily decrease. To remedy this problem, we take the lowest estimated VMT that the truck will travel and use that as the annual mileage for the remaining lifespan of the truck. Thus, the lowest mileage that we estimate the truck will travel occurs in year 27 with a value of 6,648 miles, and is the value we use up to remainder of the lifetime of the truck (36 years).
Age ≤ 27 Estimated VMT = A × (Age)3 + B × (Age)2 + C × (Age) + D
A B C D r2 0.6806403 -22.84481 -238.5518 16345.32 0.9634
27 < Age ≤ 36
Cubic Polynomial
Model
Estimated VMT = 6,648 The results are presented below in Table 6, and a comparison of the current and updated VMT as well as the actual VMT are available in Figure 4. In Table 6, The “Unadjusted” sub-column under the main column “Estimated VMT Cubic Model” lists the values of the annual mileage based on the cubic regression model from above. As mentioned before and evidenced in the table, at year 27 the VMT reaches a minimum and then begins to increase after that; the “Adjusted” sub-column corrects this by taking the lowest VMT reached (6,648 miles) and uses that value for the remainder of the lifetime of the light truck. Judging from Figure 4 and comparing the “Actual VMT” with the estimated “Adjusted” VMT after year 27, this assumption seems to track well with the real-world data. To be certain, we performed a weighted average of the “Actual VMT” data from a vehicle age of 27 to 32, and arrive at a value of about 7,172 miles, which is not too far from our assumption of 6,648 miles. In addition, the VMT weighted by the survivability rate is of more relevance than the “unweighted” VMT, and since the survivability rates are fairly low after year 27, those weighted miles beyond year 27 contribute very little to the lifetime miles traveled. In fact, because the mileage is taken to be a constant 6,648 miles
5 An inflection point is a point on a curve at which the sign of the curvature (i.e., the concavity) changes. In our case, the concavity changes from down (or negative) to up (or positive) at an approximate vehicle age of 27 years.
18
over time rather than decreasing, the weighted VMT (by survivability rate) and the lifetime VMT for light trucks are potentially over-estimated.
19
Table 6 VMT Schedule for Light Trucks from 2001 FHWA NHTS
Estimated VMT Cubic Model Vehicle Age Actual VMT Sum of Weights
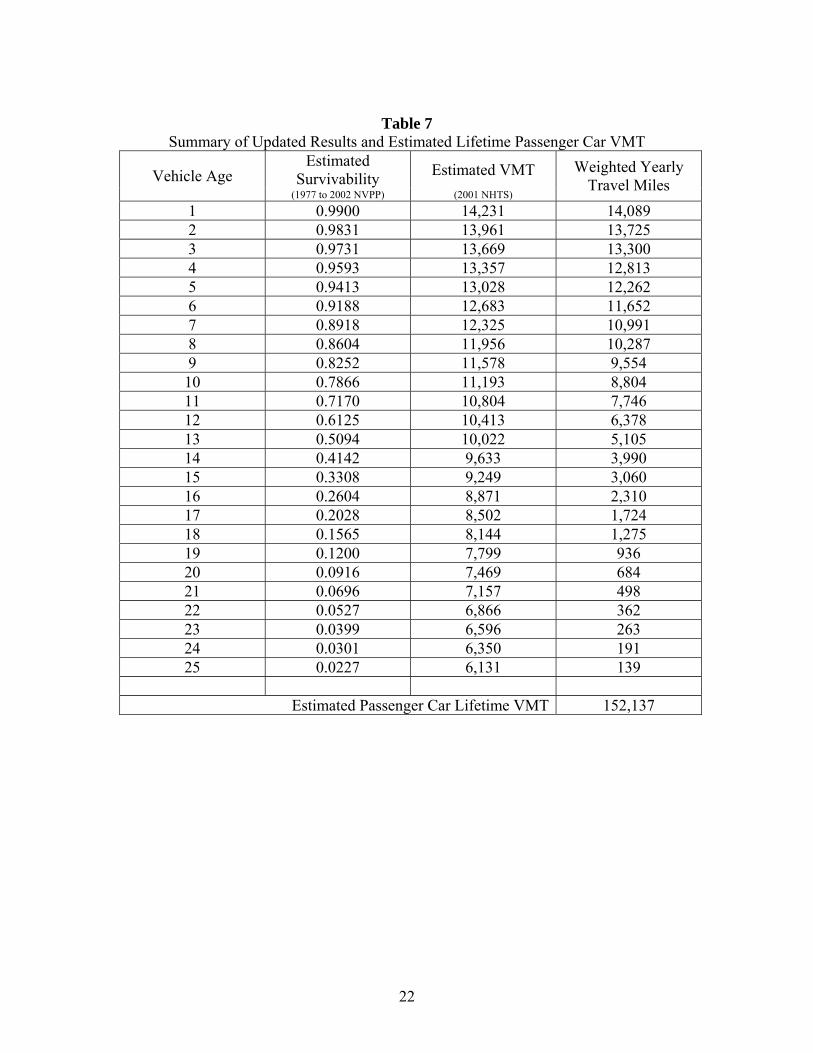
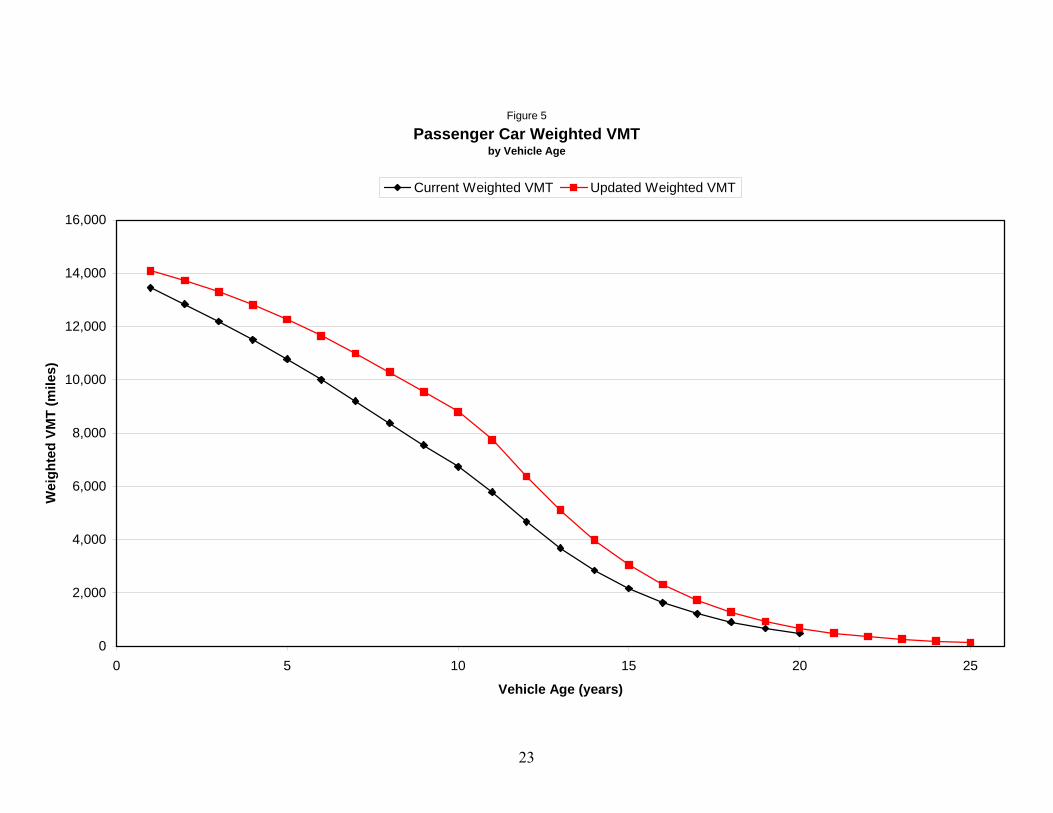
5. Lifetime Mileage 5.1. Passenger Cars The annual estimated weighted VMT and expected lifetime passenger car VMT (based on the updated 1977 to 2002 NVPP and 2001 NHTS data) is shown in Table 7. The “expected passenger car lifetime VMT” is calculated by summing the “estimated weighted VMT” over the number of years the vehicle is expected to be in service (25 years in the case of passenger cars), where the weighted VMT is simply the product of the “estimated survivability” and the “estimated VMT.” Figure 5 compares the current weighted VMT schedule with the updated weighted VMT schedule.
22
Table 7
Summary of Updated Results and Estimated Lifetime Passenger Car VMT Estimated
5.2. Light Trucks The annual estimated weighted VMT and expected lifetime passenger car VMT (based on the updated 1977 to 2002 NVPP and 2001 NHTS data) is shown in Table 8. The “expected light truck lifetime VMT” is calculated by summing the “estimated weighted VMT” over the number of years the vehicle is expected to be in service (36 years in the case of light trucks), where the weighted VMT is simply the product of the “estimated survivability” and the “estimated VMT.” Figure 6 compares the current weighted VMT schedule with the updated weighted VMT schedule.
25
Table 8 Summary of Updated Results and Estimated Lifetime Light Truck VMT
Estimated Survivability
Estimated VMT Vehicle Age (1977 to 2002 NVPP) (2001 NHTS)
6. Discount Factors Frequently, the agency discounts future safety benefits or fuel economy impacts back to present value to compare them to costs that incur when the vehicle is purchased. The present discount factors used are based on half-year discount rates with the following formula:
Present Discount Factor = 21
)1(
1−+ Ni
Equation 1
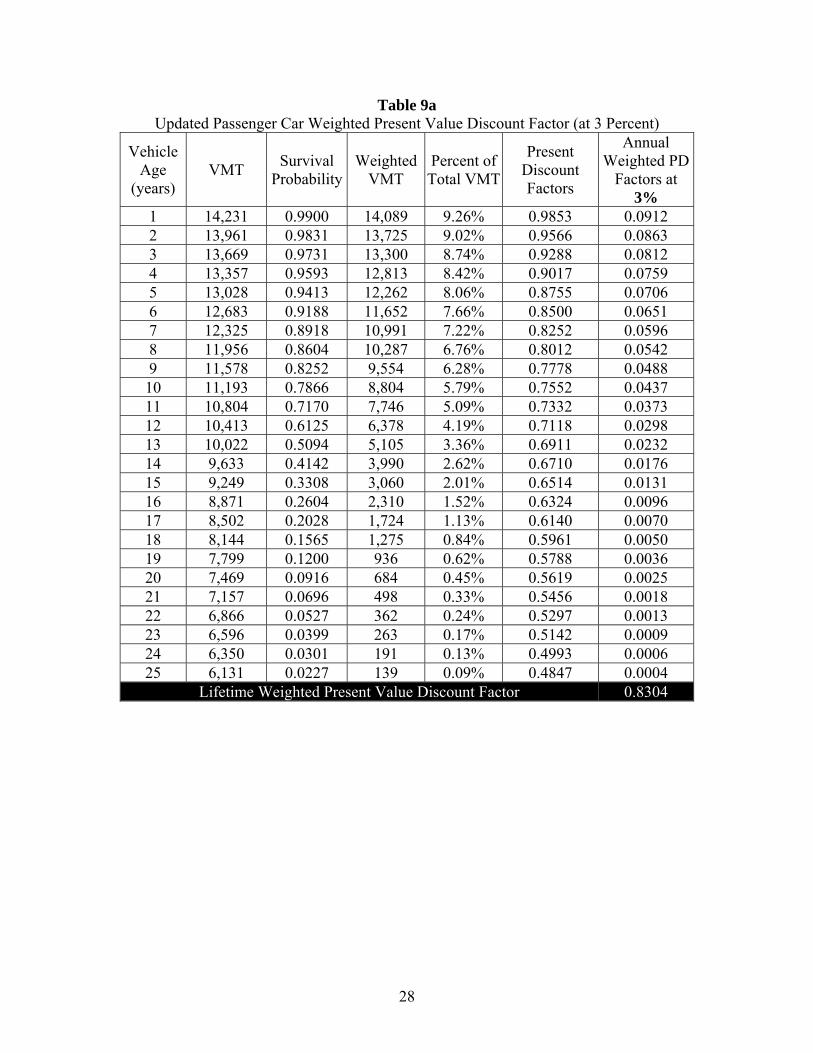
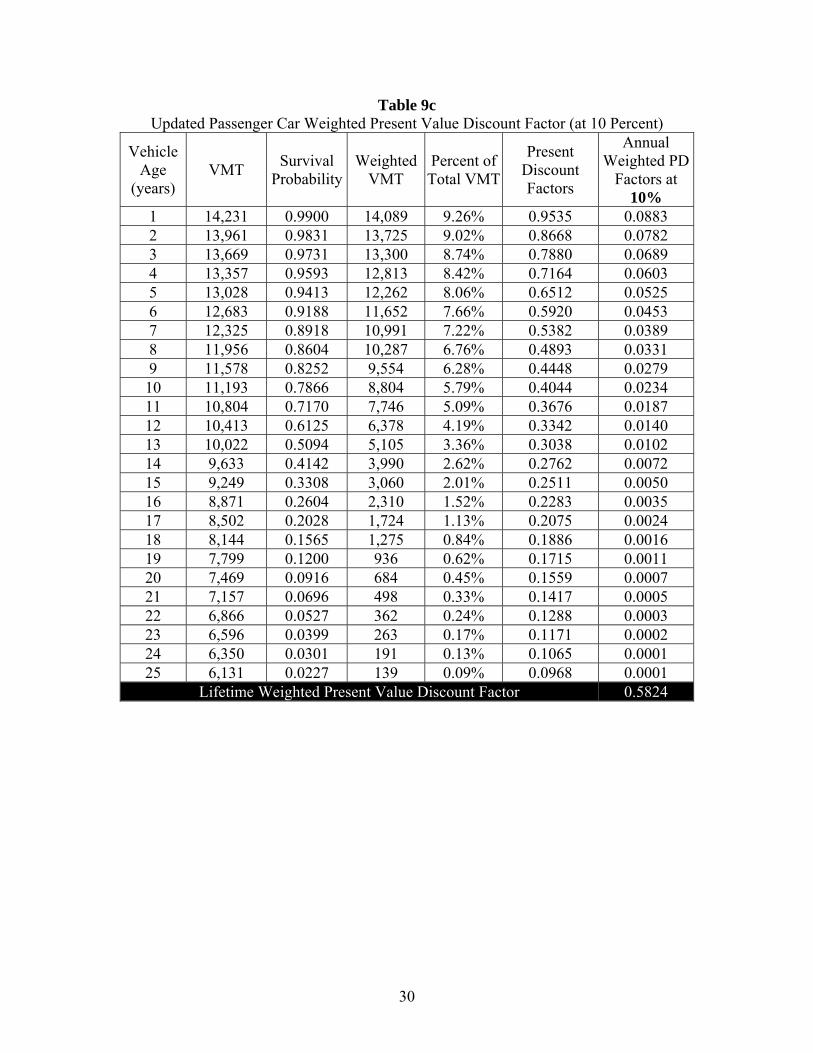
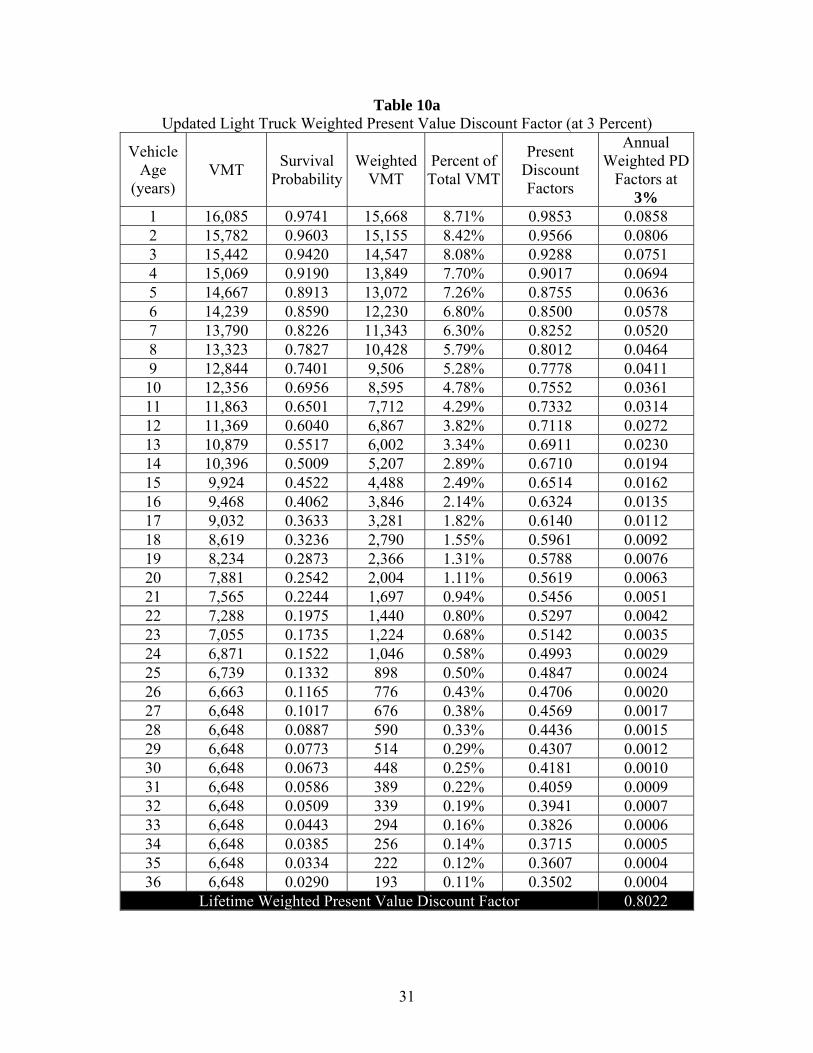
where, N = vehicle age (years) i = discount rate (e.g., 3 percent, 7 percent, 10 percent). Each present discount (PD) factor for a given vehicle age and discount rate is multiplied by their respective “Percent Total VMT” to arrive at the “Weighted Present Discount (PD) Factors” in the last columns of Tables 9 and 10. For example in Table 9a, passenger cars with a vehicle age of 10 years and a discount rate of 3 percent results in a weighted present discount factor of 0.0437 (results from multiplying the percent total VMT of 5.79 percent by the present discount value factor of 0.7552). Summing the entire range of “Annual Weighted Present Discount Factor” for a particular vehicle and discount rate gives us the “Lifetime Weighted Present Value Discount Factor” for that particular vehicle type and at that discount rate; for passenger cars, 0.8304 (at 3 percent), 0.6700 (7 percent), and 0.5824 (10 percent); for light trucks, 0.8022 (at 3 percent), 0.6303 (7 percent), and 0.5419 (10 percent).
28
Table 9a Updated Passenger Car Weighted Present Value Discount Factor (at 3 Percent)
Lifetime Weighted Present Value Discount Factor 0.5419
34
7. Appendix
35
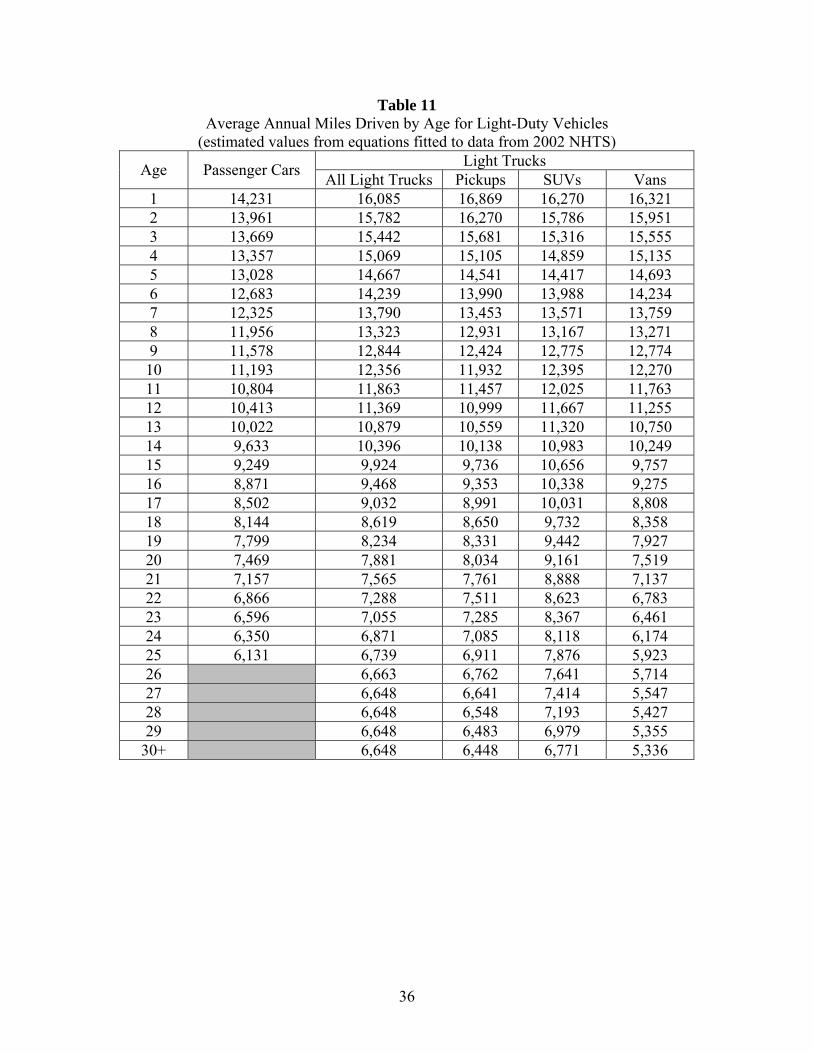
7.1. Corporate Average Fuel Economy (CAFE) VMT Schedules For a great majority of rulemakings, vehicles are classified as either a passenger car or as a light truck with the vehicle miles traveled schedules created to reflect this fact. However, an exception to this practice are the Corporate Average Fuel Economy (CAFE) standards, in which the light truck categories are further discriminated into three sub-categories based upon the light truck’s body type. These sub-categories are as follows, with the specific vehicle types following in a parenthetical expression:
• Pickups (open-bed trucks of all sizes);
• SUVs (sport wagons and utility vehicles of all sizes) and • Vans (minivans, standard and large passenger vans, and cargo vans).
Passenger cars remain grouped in their own category and are not further divided, but are listed here for the sake of completeness:
• Passenger cars (coupes, sedans, station wagons, sports cars, and convertibles). A least-squares fit of the vehicle miles traveled for each sub-category of light trucks by vehicle age is presented below in Table 11 alongside an aggregated VMT6 for all light trucks. Since a separate regression was performed on separate sub-categories, the “shape” of the curves will not match that of the aggregated light truck curve, especially at the beginnings and ends of the curves. The mileage by year schedules for each sub-category—rather than the aggregated VMT—is used in rulemakings pertaining to fuel economy. The linear regression model for the aggregated light truck VMT was presented earlier on page 17 of this report.
6 The aggregated VMT schedule under the column heading in Table 11, “All Light Trucks,” is created by combing all three sub-categories of light trucks (Pickups, SUVs and Vans) into one single group. This aggregated light truck VMT schedule also appears in Table 6 (p. 19), Table 8 (p. 25) and Tables 10a-10c (pp. 31-33).
36
Table 11 Average Annual Miles Driven by Age for Light-Duty Vehicles
(estimated values from equations fitted to data from 2002 NHTS) Light Trucks Age Passenger Cars All Light Trucks Pickups SUVs Vans