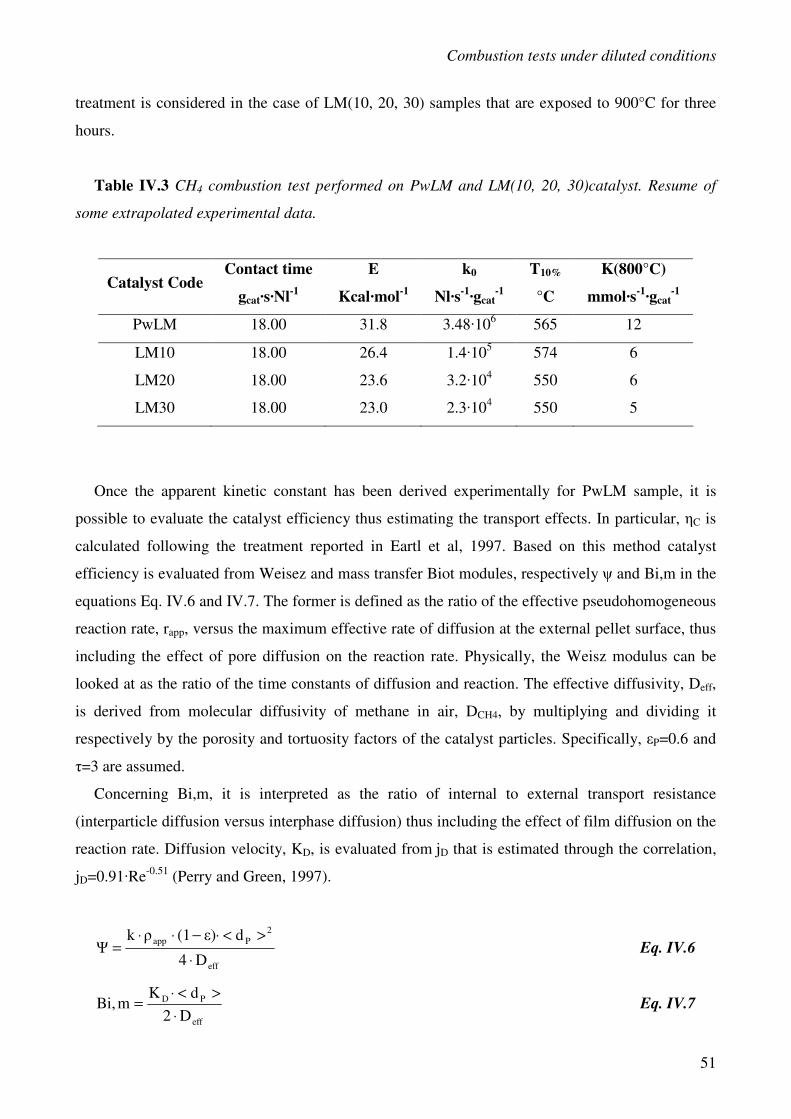
Page 1
UNIVERSITA' DEGLI STUDI DI NAPOLI FEDERICO II
Dottorato di Ricerca in Ingegneria Chimica
(XXI Ciclo)
Catalytic microcombustion for portable electric
power generation
Scientific Committee: Author:
Prof. Gennaro Russo Andrea Scarpa
Prof. Paolo Ciambelli
Prof. Francesco Gioia
Page 3
i
ABSTRACT
In this Ph. D. thesis the main issues in catalytic micro-combustion will be explored with the conclusive
aim to develop efficient combustors exhibiting a operating window wide enough to make possible their
application in portable power generation.
Particular attention will be devoted to the preparation of catalytic micro-structured reactors for the
combustion of C3H8, H2, CH4 and H2-CH4. A preparation method is developed to depose efficaciously the
active phase on inert substrates of different materials (Cordierite, α-Al2O3 and FeCralloy) and in the form of
both monoliths and platelets. Cheap and stable active phase constituted by supported perovskite, γ-
Al2O3/LaMnO3 has been prevalently considered. However, the effect of promoting perovskite with a little
amount of platinum has been taken into account and, thus, Pt/Al2O3 catalyst are prepared and tested as
reference material too.
A novel single channel planar catalytic reactor (SSR) is developed for the study of diluted combustion of
H2, CH4 and H2-CH4 up to a maximum temperature of 800°C. Such a reactor gives the possibility to
modulate the combustion chamber height thus allowing to study in depth the particular interaction between
heterogeneous and homogeneous combustion. In particular, SSR will show its maximum relevance in
understanding the chemical synergy in H2 assisted CH4 combustion.
Combustion under auto-thermal conditions has been studied too. In particular, ignition and quenching of
C3H8, H2, CH4 and H2-CH4 combustion have been investigated in a large spectrum of operating conditions.
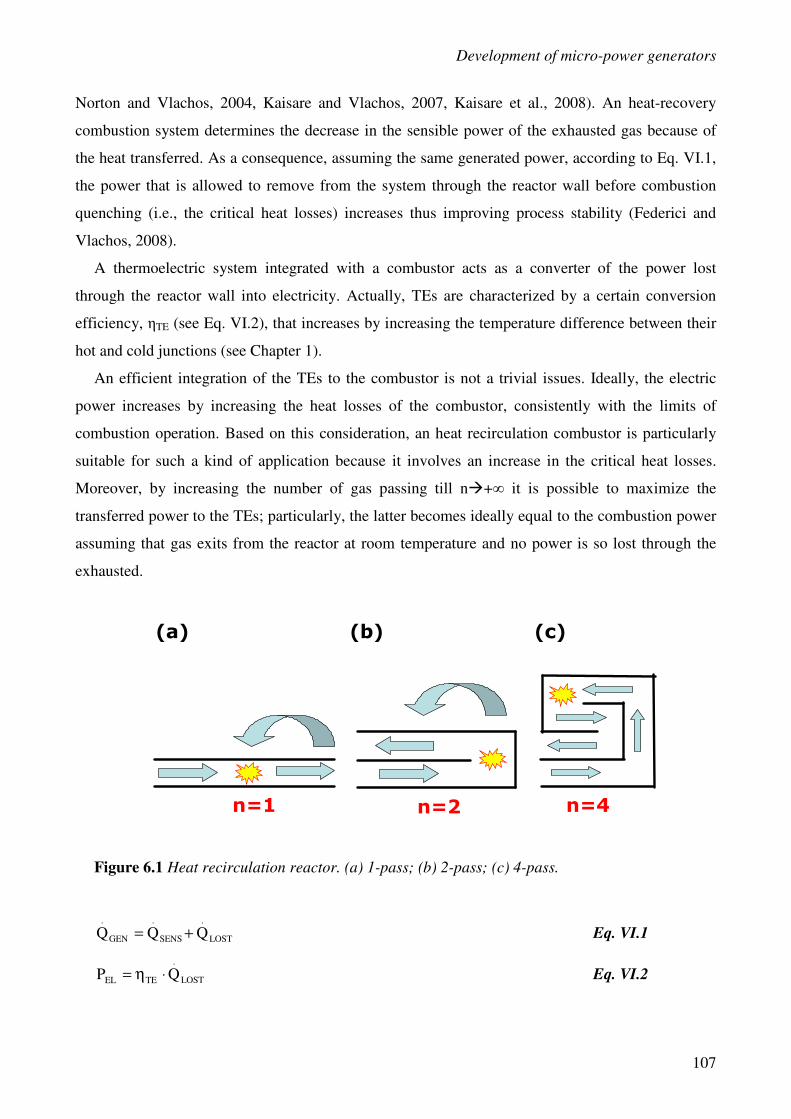
Particular attention has been devoted to novel heat-recirculation reactors. In particular, in order to
experimentally verify the role of heat recovery on combustion stability, a quartz reactor easy to run both in
heat-recirculation and in no-recirculation reactor modes is developed. The simple geometry of the proposed
reactor enables to obtain fundamental understanding of the effect of heat recirculation and on the instability
mode in the limit of low conductive reactor walls.
Micro power generators have been developed by coupling catalytic combustors with thermoelectric
modules. In particular, an innovative solution consisting on the integration of multiple pass heat-
recirculating combustors with TEs is proposed.
Part of the present work and specifically the study on heat recirculation combustors and electricity
generators (discussed in the chapters 6 and 7) has been performed at University of Delaware in the research
group of Professor Vlachos.
Page 5
i
INDEX
1.0 Introduction 1
1.1. Portable power generation using catalytic combustion 1
1.2 Instabilities in small scales combustion: heat recovery strategies 4
1.3 Catalyst for combustion applications 6
1.4 Considerations as regards fuel choice 8
1.5 Combustion to electrical power converters at small-scales 10
1.6 Aim of the thesis 14
2.0 Catalyst preparation and characterization 16
2.1 Catalysts preparation 16
2.1.1 Preparation of the platelet substrates 16
2.1.2 Pre-treatment of the FeCralloy platelets 17
2.1.3 Preparation of powder catalysts 18
2.1.4 Deposition of a catalytic film on platelets 20
2.1.5 Preparation of monolith catalysts 21
2.2 Catalysts characterization 23
2.2.1 BET measurements on powder catalysts 23
2.2.2 SEM analysis on catalytic platelets 24
2.2.2.1 Surface modification of FeCralloy 24
2.2.2.2 Catalytic layer deposed on α-alumina plates 26
3.0 Experimental set-up 28
3.1 Reactor design 28
3.1.1 Quarts reactors for combustion tests on powder catalysts 28
3.1.2 Stainless steel reactor for combustion tests on catalytic plates 29
3.1.3 Quartz reactor for combustion tests on monoliths 31
3.1.4 Heat-recirculation quartz reactors 31
3.1.5 Electricity micro-generators 33
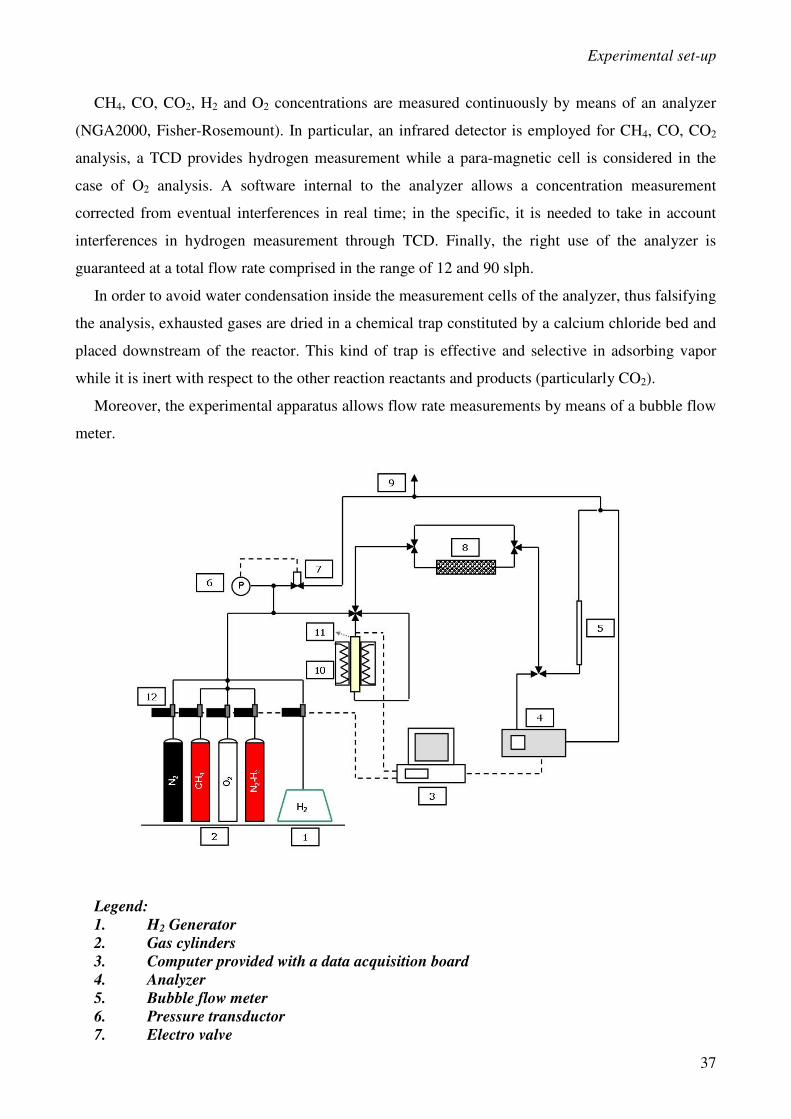
3.2 Experimental apparatus 36
3.2.1 Diluted combustion tests 36
3.2.2 Autothermal combustion tests 38
3.2.3 Measurements of electricity generators performances 40
4.0 Combustion tests under diluted conditions 43
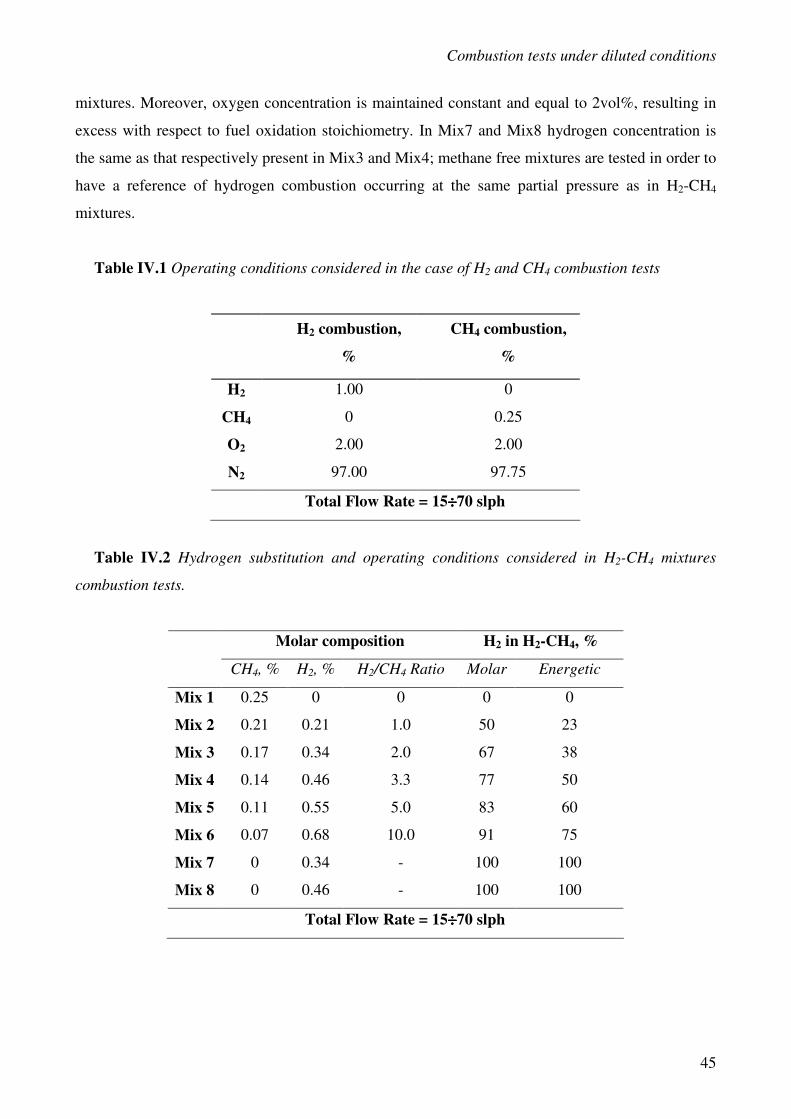
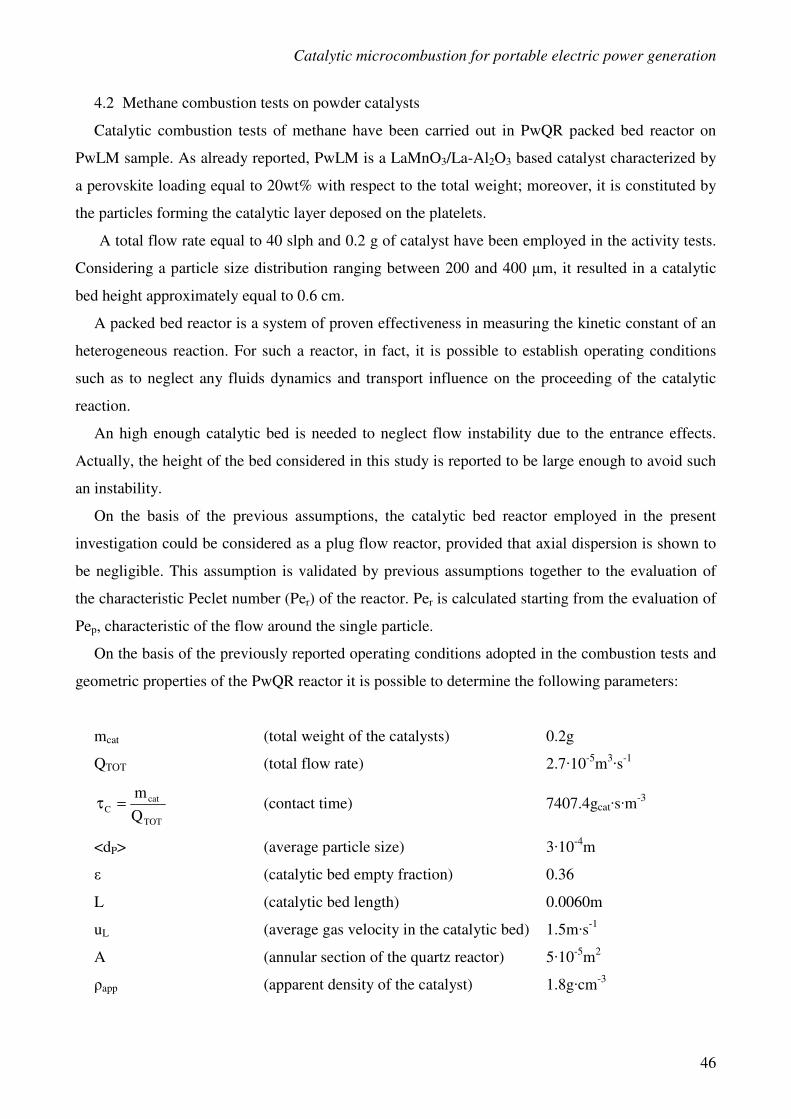
4.1 Operating conditions 44
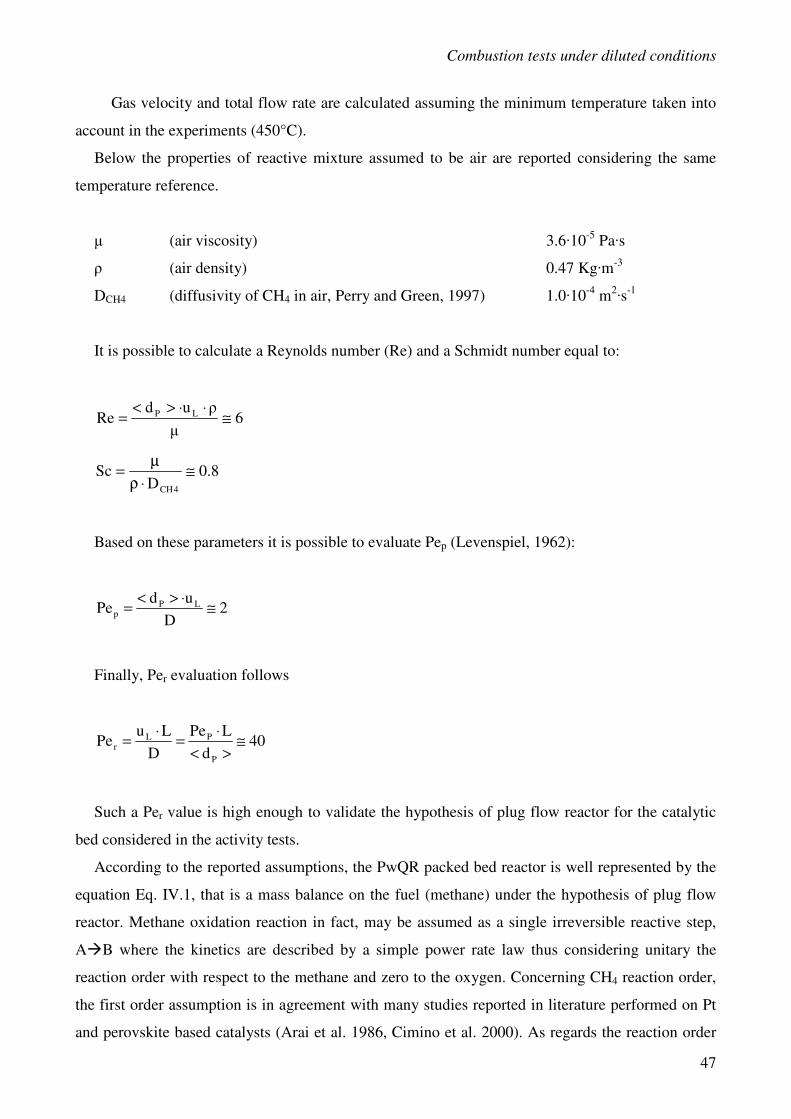
4.2 Methane combustion tests on powder catalysts 46
4.3 Combustion tests on platelets catalysts 53
4.3.1 Stability of the catalytic layer 58
4.3.2 Repeatability of the preparation method 60
4.3.3 Effect of the substrate on the catalytic activity 61
4.3.4 Reaction order 65
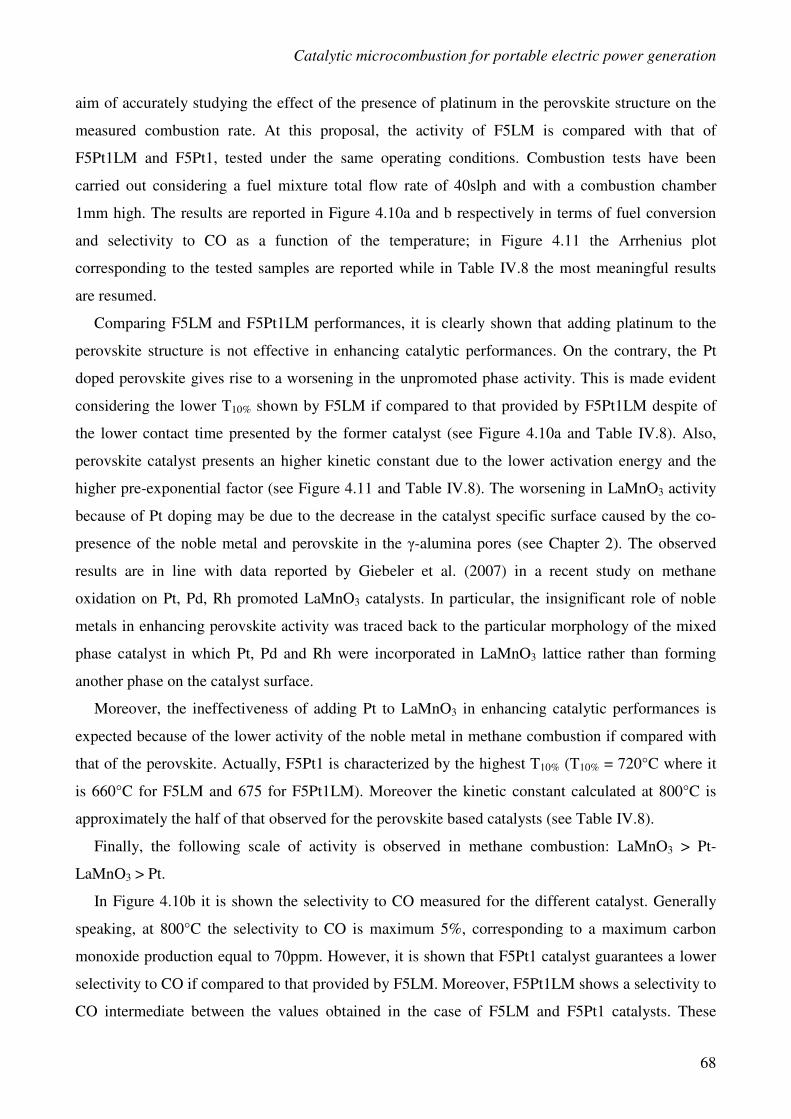
4.3.5 Combustion of CH4: effect of the active phase 67
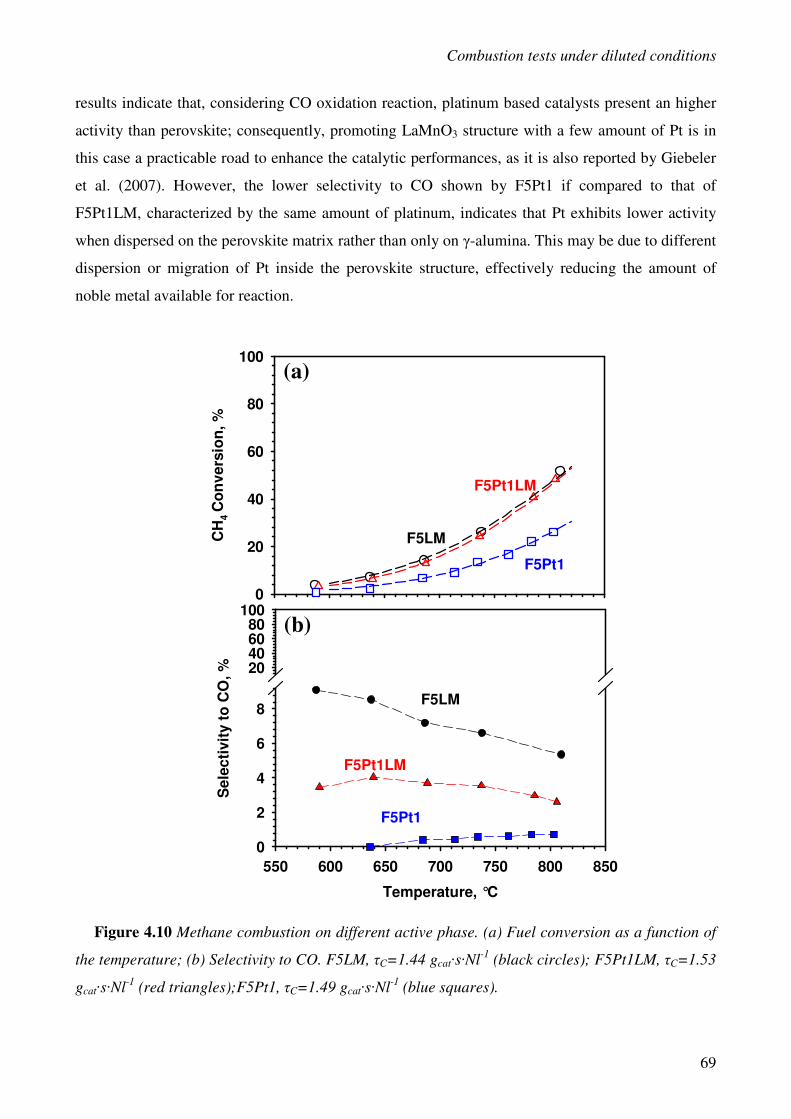
4.3.6 Combustion of H2: effect of the active phase 70
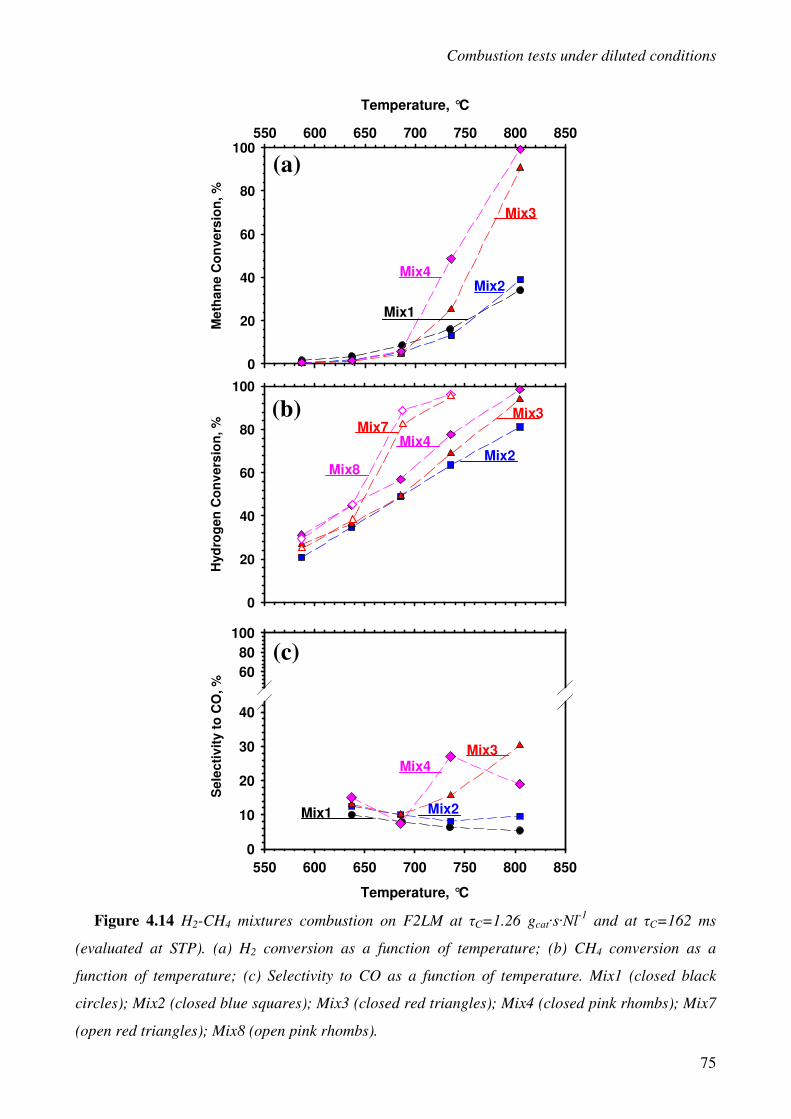
4.3.7 Combustion of H2-CH4 mixtures 74
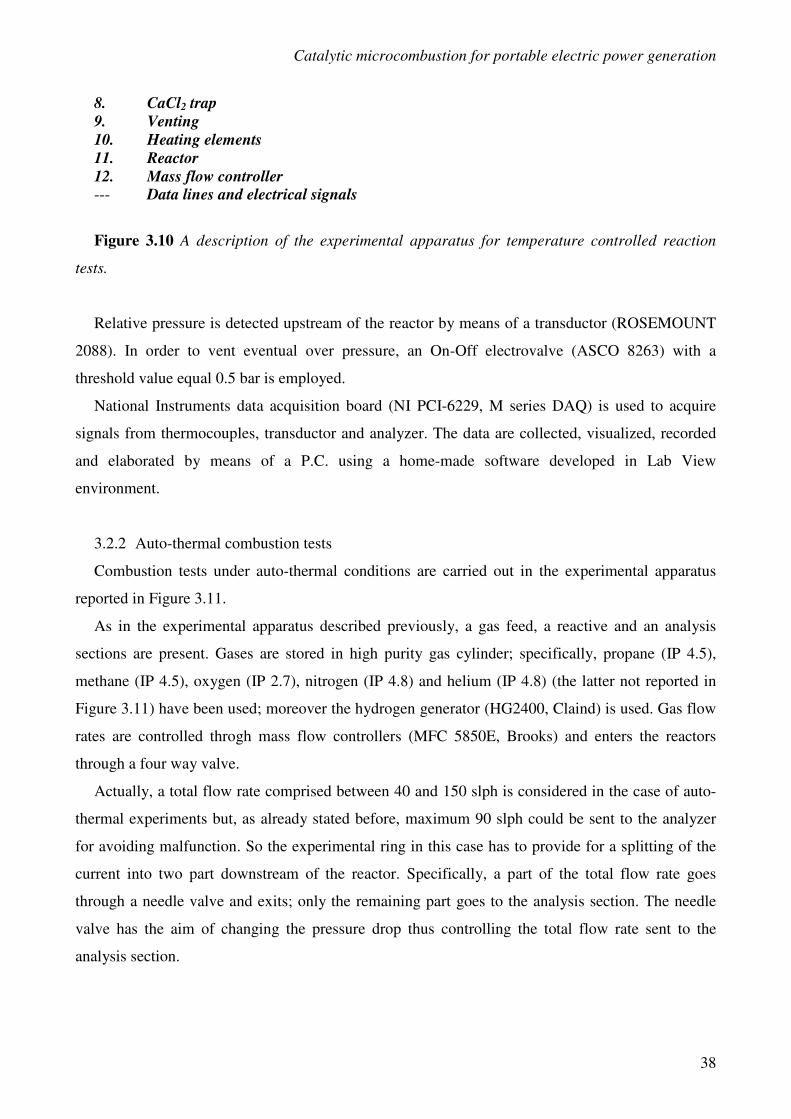
5.0 Autothermal combustion of CH4 and H2-CH4 mixtures 83
Page 6
ii
5.1 Operating conditions 84
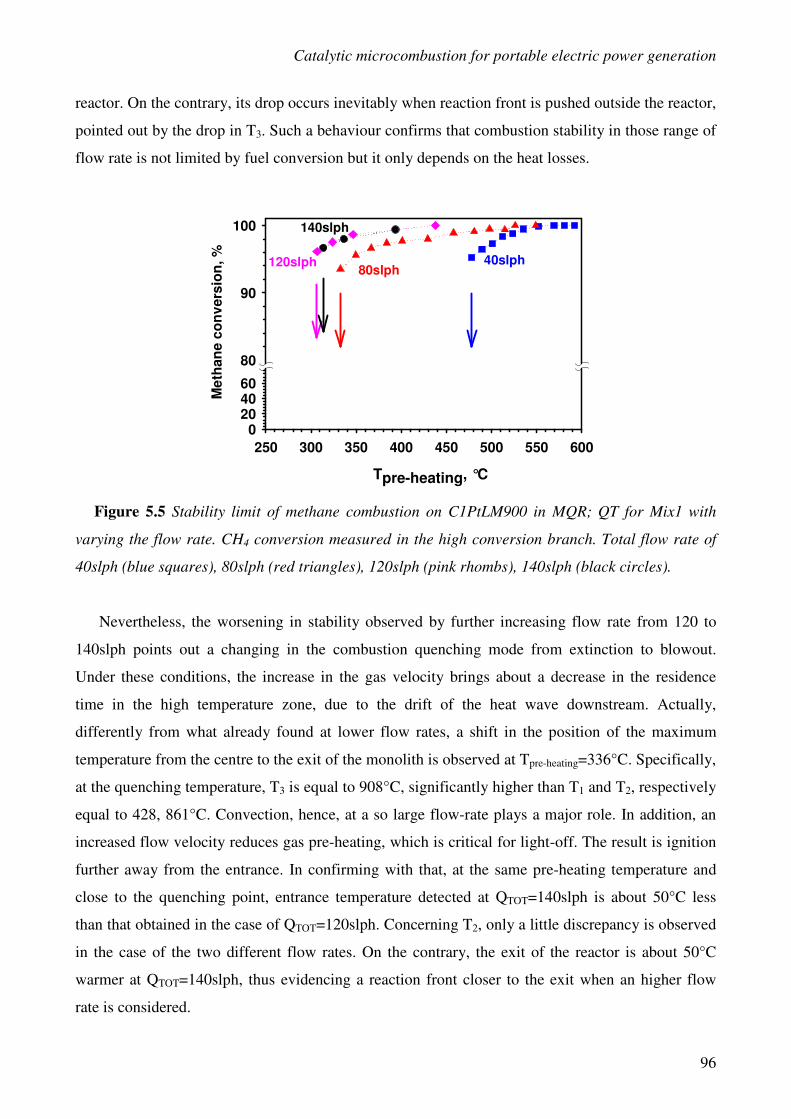
5.2 Ignition and limits of stable operation in CH4 combustion 86
5.3 Effect of the fuel concentration on CH4 combustion stability 97
5.4 Ignition and limits of stable operation in H2-CH4 combustion 100
6.0 Development of micro-power generators 106
6.1 Operating conditions 109
6.2 Operating limits of self sustained C3H8 combustion 111
6.2.1 Effect of heat recirculation 111
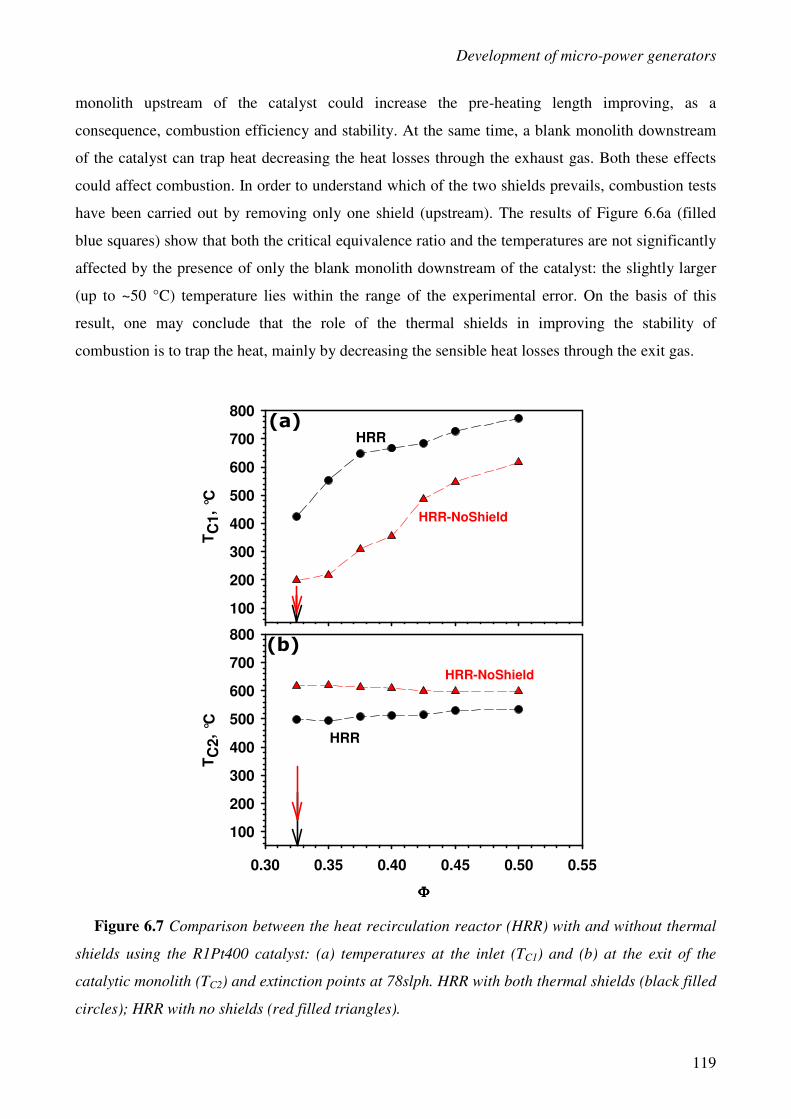
6.2.2 Effect of thermal shields 117
6.2.3 Effect of the monolith cell density 120
6.2.4 Effect of active phase 121
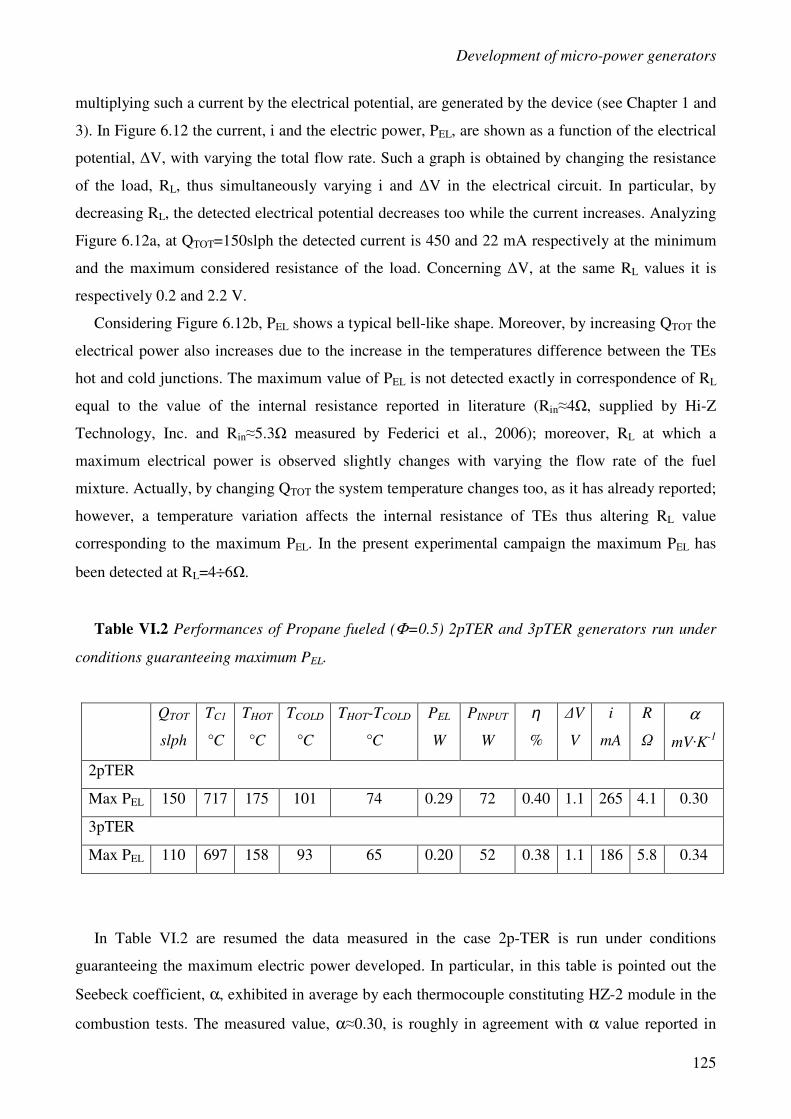
6.3 Performances of electricity generators 123
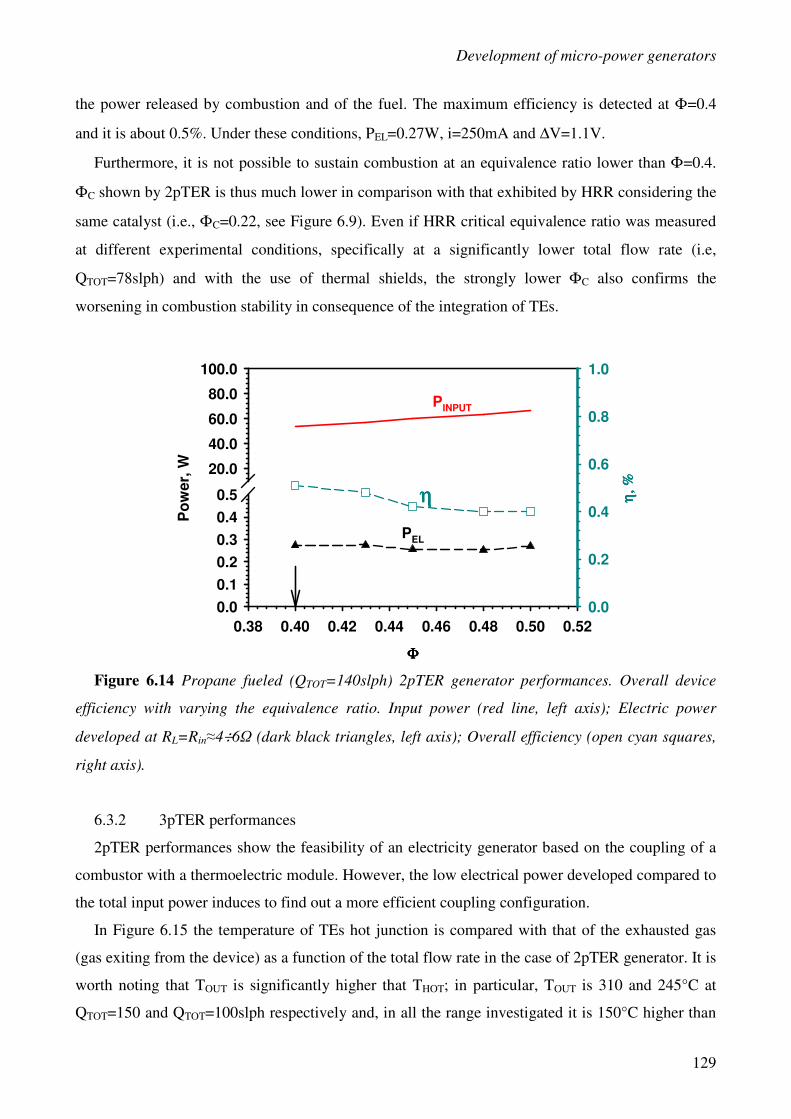
6.3.1 2pTER performances 123
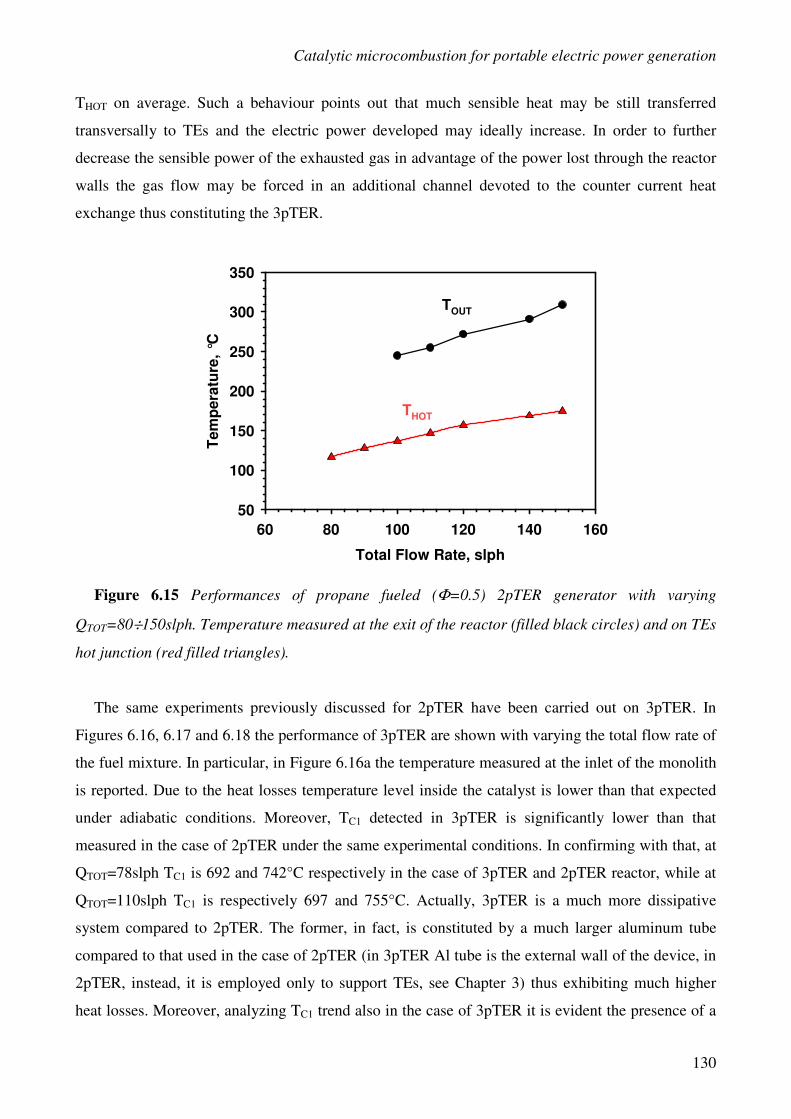
6.3.2 3pTER performances 129
7.0 Conclusions 135
Literature cited 138
Page 7
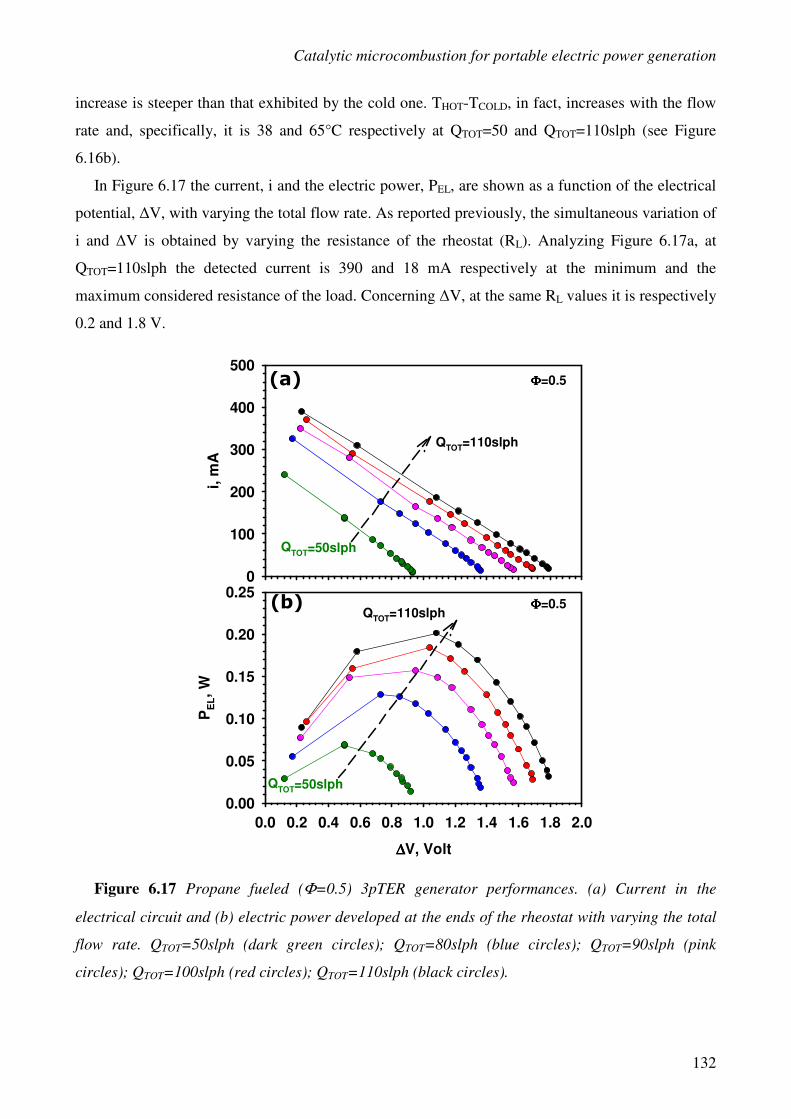
Introduction
1
CHAPTER 1
INTRODUCTION
1.1 Portable power generation using catalytic combustion
The remarkable advances experienced in the last few years in high precision techniques allow
the development of smaller and smaller electronic devices for portable use like mobile phone and
laptops (Fernandez-Pello, 2002). Moreover, the growing trend in the miniaturization of electro-
mechanical engineering systems till to a characteristic dimension of the order of micron has given
rise to a novel technological area named MEMS (micro electro-mechanical systems) mainly
involved in the fabrication of sensors and actuators but also of more complex systems like pumps
and motors (Fernandez-Pello, 2002). In the future, at the same time as the development of such
systems it is expected a rise in the demand of high energy density power sources for portable use
with small-size, low weight and long duration.
The power of interest in such applications ranges from milliwatts to watts but may be of the
order of kilowatts in the automotive field. Conventional power supply in all these cases is
constituted by batteries. However, the low energy density of this kind of systems contributes to the
excessive weight and bulk of portable equipment and severely limit the duration of operations using
portable electronic devices. This aspect is very critical in the case of MEMS where the power
source may constitute a large fraction of both mass and volume of the entire device.
Alternatively to batteries technology it has been recently proposed the use of electric portable
power sources based on combustion (Fernandez-Pello, 2002). The concept behind this emerging
research field is the higher specific energy of a liquid fuel compared to that of a battery. By the
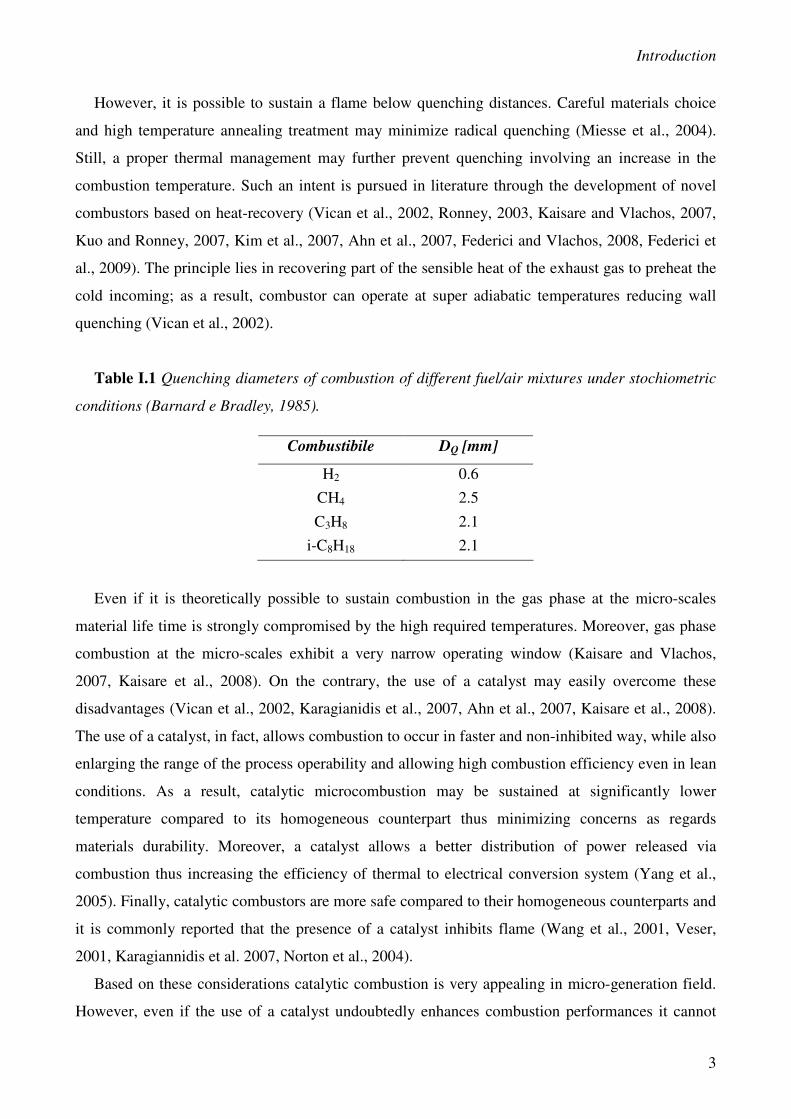
comparison of propane and iso-octane energy density with that of a Lithium ion battery, reported in
Figure 1.1, it results that a fuel is 13 and 40 times energetically denser as regards the unit of volume
and of weigh respectively. It follows that combustion is able in theory to overcome the current
State-of-the-Art in portable power production by slashing the weight and size of the ultimate
electronic device.
The high combustion potential in micro-power generation is driving the research efforts towards
the development of conversion system of the thermal power into electricity suitable for portable
applications. However, based on the values of energy density above reported, in order to equal
battery performances a quite low thermal to electrical conversion efficiency, η=2.5÷7.5% is
Page 8
Catalytic microcombustion for portable electric power generation
2
required. Moreover, in many applications even a lower efficiency may result successful considering
that a fuel based generator could be much more easy to recharge not requiring any electric power
cost. In particular, the latter aspect points out the relevance of the proposed technology in
overcoming any barrier to the use of portable technologies in remote places. As a result efficiency
doesn’t constitute the key parameter in the development of these new conception generators for the
benefit of other ratings such as compactness, operation flexibility, durability, the maintenance
requested.
Li battery i-C8H18 C3H8
En
erg
y d
en
sit
y
100
101
102
103
104
105
106
107
108
Whr/m3
Whr/Kg
Figure 1.1 Specific energy for iso-octane, propane and Lithium polymer battery. Data reported
both in the units of weight and volume. Data for propane and iso-octane derived from Perry and
Green (1997). Energy density in the unit of weight of a Li battery are derived from Palo et al.
(2002). Energy density of a Li battery in the unit of volume derived from that in the unit of weight
by considering the typical weight and the volume of a mobile phone battery.
The necessity of miniaturized electro-mechanical devices places at micro-scale the major interest
in combustion. Despite of the great technological interest, combustion application in portable
electricity generation field stays within the ambit of research involving some serious problems far
from being solved. In particular, the characteristic length scale involved in this application is
typically below the millimeter and is strongly unfavourable to the propagation of flame being of the
same order of the quenching diameter of the most common fuels (see Table I.1). Basically, by
decreasing the combustor size the surface-to-volume ratio increases thus exalting the wall-effects on
the process. More specifically, reactor wall behaves as a sink for the heat and the radicals released
via combustion causing either thermal or radical quenching of the process (Miesse et al., 2004).
Page 9
Introduction
3
However, it is possible to sustain a flame below quenching distances. Careful materials choice
and high temperature annealing treatment may minimize radical quenching (Miesse et al., 2004).
Still, a proper thermal management may further prevent quenching involving an increase in the
combustion temperature. Such an intent is pursued in literature through the development of novel
combustors based on heat-recovery (Vican et al., 2002, Ronney, 2003, Kaisare and Vlachos, 2007,
Kuo and Ronney, 2007, Kim et al., 2007, Ahn et al., 2007, Federici and Vlachos, 2008, Federici et
al., 2009). The principle lies in recovering part of the sensible heat of the exhaust gas to preheat the
cold incoming; as a result, combustor can operate at super adiabatic temperatures reducing wall
quenching (Vican et al., 2002).
Table I.1 Quenching diameters of combustion of different fuel/air mixtures under stochiometric
conditions (Barnard e Bradley, 1985).
Even if it is theoretically possible to sustain combustion in the gas phase at the micro-scales
material life time is strongly compromised by the high required temperatures. Moreover, gas phase
combustion at the micro-scales exhibit a very narrow operating window (Kaisare and Vlachos,
2007, Kaisare et al., 2008). On the contrary, the use of a catalyst may easily overcome these
disadvantages (Vican et al., 2002, Karagianidis et al., 2007, Ahn et al., 2007, Kaisare et al., 2008).
The use of a catalyst, in fact, allows combustion to occur in faster and non-inhibited way, while also
enlarging the range of the process operability and allowing high combustion efficiency even in lean
conditions. As a result, catalytic microcombustion may be sustained at significantly lower
temperature compared to its homogeneous counterpart thus minimizing concerns as regards
materials durability. Moreover, a catalyst allows a better distribution of power released via
combustion thus increasing the efficiency of thermal to electrical conversion system (Yang et al.,
2005). Finally, catalytic combustors are more safe compared to their homogeneous counterparts and
it is commonly reported that the presence of a catalyst inhibits flame (Wang et al., 2001, Veser,
2001, Karagiannidis et al. 2007, Norton et al., 2004).
Based on these considerations catalytic combustion is very appealing in micro-generation field.
However, even if the use of a catalyst undoubtedly enhances combustion performances it cannot
Combustibile DQ [mm]
H2 0.6
CH4 2.5
C3H8 2.1
i-C8H18 2.1
Page 10
Catalytic microcombustion for portable electric power generation
4
avoid instabilities due to the pronounced dissipative nature of microsystems (Norton and Vlachos,
2005, Ahn et al., 2007, Karagianidis et al., 2007, Kaisare et al., 2008, Federici et al., 2009).
Moreover, the typical low electric power at stake requires to minimize the gas pumping cost. As
a results, minimum pressure drops are required in gas flowing through the system thus making more
technologically valid structured catalysts compared to a packed bed reactors. However,
development of micro-structured reactors for combustion applications and energy production is not
a trivial matter. Deposition techniques of catalytic layers are well-established in the case of
honeycomb monoliths (Zwinkels et al., 1999, Cimino et al., 2001, Valentini et al., 2001, Fabbrini et
al., 2005). However, in microcombustion field a growing interest is devoted to planar substrates like
platelets. The scientific literature on preparation of catalyst in the form of platelets is relatively
young thus leaving unexplored many practical aspects. For this kind of substrates the only
investigated active phase is constituted by noble metals and specifically by platinum (in the most of
cases, Kusakabe et al., 2001, Vican et al., 2002, Spadaccini et al., 2003, Norton et al., 2004, Suzuki
et al., 2004, Yang et al., 2005, Norton et al., 2006) and palladium (Wang et al., 2001). In few cases
active phase has been supported by an high specific surface support constituted by a washcoat of γ-
Al2O3 (Wang et al., 2001, Vican et al., 2002). Alternatively, γ-alumina is formed through anodic
oxidation of aluminum (Suzuki et al., 2004, Norton et al., 2006). The active phase is often
unsupported and deposed directly on the substrate through electro beam deposition (Spadaccini et
al., 2003), sputtering (Kusakabe et al., 2001) and wet impregnation (Yang et al., 2005, Norton et al.,
2004). In all the case no information is provided concerning the repeatability of deposition method,
catalyst anchoring on the substrate and eventual chemical/thermal de activation of the catalyst.
1.2 Instabilities in small scales combustion: heat recovery strategies
Loss of combustion stability occurs either via extinction or blowout (Norton and Vlachos, 2004,
Kaisare et al., 2008, Ronney, 2003, Karagianidis et al., 2007). In extinction, stability is lost due to
large heat losses compared to the power provided via combustion. In blowout, quenching occurs
because of low residence time, resulting in incomplete fuel conversion and a considerable shift of
the reaction front downstream. As a results, in microscales stable combustion occurs in a limited
operating window and the challenge is to adopt a careful combustor design to enlarge it.
The wall thermal conductivity certainly plays a relevant role. Particularly, it needs to be
sufficiently high to provide ignition of the cold incoming gas but it is responsible, at the same time,
for the heat losses exhibited by the system. As a results, wall thermal conductivity needs to be
balanced in order to provide enough preheating such as to avoid blowout but limit heat losses to
prevent extinction.
Page 11
Introduction
5
Similar considerations are valid in the case of gas velocity. Particularly, it is suggested a tradeoff
regarding the total flow rate that needs to be balanced in order to generate sufficient power to
prevent extinction but avoid blowout.
As already reported, an approach to enhance microcombustion stability is based on heat
recovery. Heat-recovery systems include the reverse flow reactor and the heat recirculation reactor,
whose effectiveness in enhancing combustion stability has been studied theoretically and
experimentally (Vican et al., 2002, Ronney, 2003, Kaisare and Vlachos, 2007, Kuo and Ronney,
2007, Kim et al., 2007, Ahn et al., 2007, Federici and Vlachos, 2008, Federici et al., 2009). In
reverse flow reactor the flow direction is periodically reversed to trap a hot zone within the reactor
(Kaisare and Vlachos, 2007). A heat-recirculation combustor is equipped with a counter-current
heat exchanger that transfers the heat from the hot exhaust gas to the in-coming reactants (Ronney,
2003, Federici and Vlachos, 2008, Federici et al., 2009). One of the most effective heat-recovery
configuration for micro-combustor is constituted to date by the swiss-roll, where the counter-current
heat recirculation reactor is coiled up allowing a combustion chamber at its center (Vican et al.,
2002, Kuo and Ronney, 2007, Kim et al., 2007, Ahn et al., 2007).
Many theoretical studies report heat recovery strategy is effective in preventing blowout (Kaisare
and Vlachos, 2007, Federici and Vlachos, 2008). Compared to a single channel reactor (without
heat recirculation) a heat-recovery based reactor allows a strong decrease in the optimum reactor
wall thermal conductivity thus involving a much more efficient heat transfer of the power released
by combustion towards the cold reactants (Norton and Vlachos, 2004, Kuo and Ronney, 2007). It is
theoretically found that a more efficient heat transfer in heat recirculation reactors is due to a
change in the pre-heating mechanism of incoming gas. As already reported, in a single channel
combustor the latter occurs via axial heat transfer through the reactor walls. On the contrary, in a
heat recirculation reactor the pre-heating of incoming reactants occurs through transverse heat
transfer from countercurrent recirculation gases (Federici and Vlachos, 2008, Ronney, 2003).
However, from theoretical studies, such an enhancement in heat transfer rate is effective only in the
limit of low conductive reactor walls. In the case of highly conductive wall, in fact, it is reported
that the rate of axial heat transfer through the reactor wall may be faster than that ruled by the
transverse thermal gradiend (Federici and Vlachos, 2008, Ronney, 2003). Similar results are
obtained in the case of reverse flow reactor: even is this case, in fact, heat recovery is effective only
in the limit of low conductivity materials (Kaisare and Vlachos, 2007).
Despite the important ramifications for microcombustion, theoretical results concerning the
effects of heat recovery on combustion stability as well as the effect of wall conductivity are not
satisfactorily experimentally validated. Experiments with metallic (stainless steel) heat recirculation
Page 12
Catalytic microcombustion for portable electric power generation
6
reactor have indeed confirmed the marginal improvement in stability with heat recirculation
(Federici et al., 2009). However no direct experimental validation still exists for the most exciting
regime of low conductivity materials. Low conductivity materials, in fact, cannot easily be
machined thus making the fabrication of micro-reactor extremely difficult.
1.3 Catalyst for combustion applications
Noble metals, in particular platinum and palladium, are the most active catalysts for catalytic
combustion of hydrocarbons; their high activity at low temperatures has made possible their
applications as catalytic converters (Seiyama, 1992). Nevertheless noble metals are very expensive
and their use is not suitable in high temperature applications. It is known, in fact, these catalytic
systems lose activity at high temperature, because of sintering and volatilization phenomena.
Moreover, palladium, less volatile than platinum, exhibits a pronounced chemical instability at high
temperatures in consequence of which the activity is considerably reduced. The active phase for
combustion is palladium oxide which however tends to decompose in metallic phase: generally PdO
is stable at temperatures lower than 1055 K and beyond this temperature the reduction to the
metallic phase takes place (Lyubovsky et al., 2003). The transition from oxide phase to metal phase
is reversible but re-oxidation is a very slow phenomenon and, besides, is characterized by
hysteresis.
These restrictions justify the employment of noble metals just when high activity is required at
very low temperatures (Gélin et al., 2003); in many applications, as micro-combustors, cheaper and
more thermally and chemically stable materials are preferred, despite of a lower activity. In
catalytic combustion, transition metals meet these requests; they may be used as simple oxides (Liu
and Stephanopoulos, 1995, Bozo et al., 2000, Choudhary et al., 2002, Kirchnerova et al., 2002,
Wierzba and Depiac, 2004,), but also as mixed oxides in structures as perovskites and as dopant
substances in exa-aluminate for employment at temperatures higher than 1000°C (Zwinkels et al.,
1999).
In particular, a growing interest in catalysis concerns perovskites-type oxides. They are ternary
compounds, characterized by an ABO3 structural formula. B cations are constituted by a transition
metal and are octahedrally coordinated by oxygen; A cations are lanthanoid elements placed in the
lattice vacancies (Tejuca et al., 1989, Seiyama, 1992, Forni and Rossetti, 2002). The transition
metal gives to the structure high catalytic activity, whereas A cation is responsible for thermal
stability of the material. Both two cations may be partially substituted by other cations, causing the
formation of structural defects which influence catalytic activity of the material (Seiyama, 1992).
The activity of perovskites in oxidation reactions is ascribed to structural defects involving cation
Page 13
Introduction
7
vacancies in their lattice. As a result, an extra oxygen may be accommodated in these systems thus
causing their typical nonstochiometry (Tejuca et al., 1989). Indeed, such extra oxygen plays a
determinant role in high temperature Mars-Van-Krevelen oxidation mechanism being much more
reactive than that transferred to the surface from the gas phase (Forni and Rossetti, 2002).
Among the most studied perovskites there are those constituted by lanthanum; whereas among
transition metals chrome (Saracco et al., 1996, Zwinkels et al., 1999, De Collongue et al., 1991),
cobalt (Fabbrini et al., 2005, O'Connel et al., 1999; Alifanti et al. 2005; Kirchnerova et al., 2002),
manganese (Saracco et al., 1999, Arnone et al., 1998; Cimino et al., 2000; Cimino et al., 2001;
Cimino et al., 2003) and iron (Kirchnerova and Klvana., 2003) have been proposed. Among
different perovskites LaMnO3 is one of the most active (Saracco et al., 1999, Marchetti e Forni,
1998).
Perovskites are very cheap and thermally stable; moreover, under particular conditions, they
have the same activity of a noble metal based catalysts (Seiyama et al., 1992, Alifanti et al., 2005).
The use of perovskites is limited because of their low specific area (De Collongue et al., 1991). In
order to improve this property it is possible to disperse perovskite on a support such as to enhance
the specific area and the mechanical resistance of the material (Cimino et al., 2000). One of the
most employed support is γ-Al2O3, characterized by a specific area of about 200 m2/g. Nevertheless,
close to 1000°C, γ-alumina undergoes a phase transition to α-alumina, which exhibits a lower
specific area. In order to overcome such an inconvenient, it has been proposed to kinetically inhibit
γ to α phase transition, by adding small quantities (typically 5wt % as regards the total amount of
support is considered enough) of lanthanum oxide to the γ-alumina lattice (Arai e Machida., 1996).
In order to increase perovskites activity in combustion reactions, the use of bi-functional
catalysts has been proposed, in which perovskite phase is promoted by small quantities of noble
metal (Cifà et al., 2003, Kucharczyk and Tylus, 2004, Cimino et al., 2004, Civera et al., 2005,
Uenishi et al., 2005, Petrovic et al., 2005, Cimino et al., 2007, Giebeler et al., 2007). Perovskite,
besides exhibiting its own catalytic activity, may be an ideal environment to host noble metals
involving an high dispersion of the active phase such as to avoid noble metal volatilization and
sintering. Moreover, particular synergies may occur especially due to eventual interactions of the
noble metal with the extra oxygen in perovskites lattice. On the other hand, the noble metal, even if
in small quantities but well-dispersed, may increase catalyst activity at low temperature. Despite
numerous studies concerning catalytic combustion on Pd-perovskite catalysts (Cimino et al., 2004,
Cimino et al., 2007, Uenishi et al., 2005, Petrovic et al., 2005, Cifà et al., 2003, Kucharczyk e
Tylus, 2004, Civera et al., 2005), Pt-perovskites are almost unexplored. However platinum is the
Page 14
Catalytic microcombustion for portable electric power generation
8
most active catalyst for combustion of hydrogen, propane and butane fuels (Choudhary, 2002),
widely investigated in microcombustion, making interesting its application as perovskites dopant.
Based on the few published data (Giebeler et al., 2007) platinum promoting is not effective in
enhancing perovskites activity in methane combustion at least on oxidized samples. However, a
more detailed investigation is needed to evaluate the activity of mixed phase catalyst with respect to
single phase, both perovskites and platinum catalysts for different fuels combustion.
1.4 Considerations as regards fuel choice
Specific energies of different fuels are reported in Figure 1.2.
Heating value of liquid fuel in the unit of volume is higher than that of a gas fuel up to three
magnitude orders. Consequently, liquid fuels are very appealing in small scale, portable application
where the overall size of the electricity generators is the key parameter. However, the use of a liquid
fuel shows some disadvantages in microcombustion applications, mainly due to the need to obtain
its atomization and mixing with oxygen at micro-scales. At this proposal, complex atomizing and
micro-mixing systems have been proposed in literature (Deng et al.,2007). In order to overcome
such a drawback the use of condensable fuels like propane and butane may be preferred. Actually,
they may be stocked in liquid phase at relatively low pressure (2÷3 bar) while are gaseous at
atmospheric pressure. From a technological point of view the stocking pressure may be employed
for gas pumping without additional electrical costs.
Due to the attempt of controlling CO2 emissions, it is to be hoped the use of fuels exhibiting high
H/C ratios, especially in applications (like automotive one) involving a developed power of the
order of kilowatts. Gaseous fuels meet such a requirement exhibiting a H/C≥3 further showing high
specific power for mass unit. Among gas fuels methane is the widest used fuel in energy production
field because it is abundant and well-distributed all over the planet. However methane is also a very
stable molecule and, consequently, very difficult to burn. On the other hand, the interest in
hydrogen is very strong too. It is one of the most reactive and intrinsically clean fuel; on the
contrary, safety issues makes its distribution, stocking and employing in industrial applications a
very complex matter. In the last years the scientific interest is moving towards the study of CH4-H2
mixtures combustion. CH4-H2 fuel couples synergistically the properties of hydrogen and methane
thus constituting a fuel that is reactive and clean but also safe and well-distributed.
Page 15
Introduction
9
i-C8H18 C3H8 CH4 H2
En
erg
y d
en
sit
y
100
101
102
103
104
105
106
107
108
Whr/m3
Whr/Kg
Figure 1.2 Specific energy for iso-octane, propane, methane and hydrogen. Data reported both
in the units of weight and volume and derived from Perry and Green (1997).
Hydrogen may promote methane combustion due to both thermal and chemical effects. In
particular, H2 burning at significantly lower temperatures, may assist thermally CH4 combustion by
decreasing its light-off temperature. Deutschmann et al. (2000), through a comparative
experimental/theoretical study on CH4-H2 mixtures combustion on platinum has shown that in order
to obtain light-off of methane the quantity of hydrogen to introduce in the mixture has to determine
a rise in the catalyst temperature sufficiently high to encourage oxygen desorption and methane
adsorption.
Moreover, hydrogen addiction to methane fuel may involve a change in the chemical nature of
the catalyst modifying its active sites and its oxidation state and thus affecting the catalytic activity.
These considerations are confirmed by a study performed by Demoulin et al. (2006) on combustion
of CH4-H2 fuel on supported palladium. The authors in part have recognized the role of hydrogen
combustion in assisting thermally methane ignition, as reported by Deutschmann et al. (2000);
however, they have shown that the catalyst temperature rise produced by H2 combustion and
necessary to methane light-off is higher than that considered sufficient to determine methane
adsorption on catalyst. The hydrogen added in mixture causes, in fact, the partial reduction of
palladium from oxide form to metal, less active for methane combustion; consequently, the heat to
adduce has to increase to compensate for the enhanced light-off temperature.
Still, hydrogen may promote chemically methane combustion by activating reactive paths in the
homogeneous phase. Actually, hydrogen combustion may adduce a quantity of OH. radicals such as
Page 16
Catalytic microcombustion for portable electric power generation
10
to ignite methane in the gas phase at relatively low temperatures (Schefer et al., 2002, Dagaut e
Nicolle, 2005, Sabia et al., 2007, Derudi et al., 2007).
The high potential of hydrogen in increasing methane reactivity has the maximum resonance in
microcombustion where the use of methane has been prohibited to date.
1.5 Combustion to electrical power converters at small-scales
A possible approach to convert combustion power into electricity is to reproduce at the small
scales gas turbine large scale plants, characterized by a very high overall efficiency (of about 40%).
This kind of solution based on thermodynamics cycles has been stimulated by the advances in
MEMS allowing the fabrications of micro-turbines and micro-pumps and is pursued mainly by MIT
(Massachusetts Institute of Technology, Spadaccini et al., 2003 and Mehra et al., 2000). However
the hypothetical advantage arising from high theoretical efficiency has to be re-evaluated by
considering the life time of this kind of devices. Actually, even if novel fabrication technique allows
to scale down power production plants the friction losses are hardly scalable and component usury
strongly reduces the durability of these devices at the micro-scale.
An alternative approach is based on system converting combustion power directly into electricity
without including thermal cycles and moving parts. In such a case conversion system is coupled
with combustor constituting an heat source for the process. Several conversion principles have been
proposed and among these the most studied are thermoelectric, TE (Federici et al., 2006, Karim et
al., 2008, Qiu and Hayden, 2008) and thermophotovoltaic, TPV (Yang et al., 2002). Nowadays, TE
and TPV exhibit a theoretical efficiency maximum of 10%, significantly lower than that of fuel cell
and micro-turbine based generators. However they are characterized by high compactness,
operation flexibility, durability, low cost and maintenance requested.
In particular, a great attention is recently devoted to thermoelectric conversion system based on
Seebeck effect (Riffat and Ma, 2002, Dughaish, 2002, Wagner et al., 2007, Boukai et al., 2008,
Hochbaum et al., 2008, Vining, 2008, Goncalves et al., 2008). The great diffusion of this kind of
systems is mainly due to the great life time, higher than 105h (Riffat and Ma, 2002) and the
capability of converting to electricity any low-grade waste heat (Muhtaroglu et al., 2008).
Based on Seebeck principle, when a temperature differential is established between the hot and
colds ends of a semiconductor material an electrical potential is developed. This voltage is called
Seebeck voltage and is directly proportional to the temperature differential, as it is expressed in the
equation Eq. 1.1. Such a constant of proportionality is known as the Seebeck coefficient. In Figure
1.3 is shown a schematic of the operation mode of thermoelectric. In particular, n and p type
semiconductors are electrically connected in series with a resistive device; in consequence of the
Page 17
Introduction
11
heat supplied to the device THOT-TCOLD>0 and an electric current flows in the circuit thus delivering
an electrical power. A single couple of n and p semiconductors constitutes a thermocouple.
Generally a single thermocouple generates very low voltage. In order to increase the electric
potential an high thermocouple density is required and more thermocouples need to be connected in
series thus constituting a thermoelectric module. In a module thermocouples are thermally
connected in parallel in the sense that they are joined such as to have common hot and cold
junctions.
Thermoelectric efficiency, ηTE is the ratio between the generated electric power and that
transferred to the device. As it is reported in Eq. 1.3, ηTE increases by increasing the undimensional
figure of merit, ZT, that is a specific quantity of each considered material. ZT is a function of the
Seebeck coefficient and of electrical and thermal conductivities as reported in the equation Eq. 1.2.
Maximizing ZT is a challenging because of the difficulty in increasing electrical conductivity
without simultaneously increasing the thermal conductivity (Dughaish, 2002, Wagner et al., 2007,
Boukai et al., 2008, Hochbaum et al., 2008). Moreover, another obstacle is constituted by the low
thermal stability of thermoelectric materials mainly due to their typically low melting point, high
vapour pressure and low chemical (Dughaish, 2002). Moreover, by increasing temperature the
eventual mobility of dopant substances increases too thus changing thermoelectric properties of the
materials (Dughaish, 2002).
Several thermoelectric materials have been proposed (Dughaish 2002) and among these the most
promising are Bismuth and Lead telluride (respectively Bi2Te3 and PbTe) and Silicon-germanium .
Despite of the very promising properties of Si-Ge and PbTe materials in terms of maximum allowed
operation temperature and figure of merit, their application is up to now in a feasibility stage. On
the contrary, bismuth-telluride semiconductors are well-established thermoelectric materials and
provide a ZT≈0.7÷1 (Goncalves et al., 2008, Vining, 2008). Such materials allow a maximum
operation temperature of 250÷300°C thus exhibiting a maximum efficiency of 5÷7%. However, it is
worth mentioning the new technological frontiers consist in producing thermoelectric materials in
nano-structured form (Goncalves et al., 2008, Boukai et al., 2008, Hochbaum et al., 2008). Actually,
this strategy allows to enhance thermoelectric efficiency by determining a reduction of thermal
conductivity without affecting electrical conductivity (Hochbaum et al., 2008). Furthermore, new
exciting opportunities derive form the possibility to structure on the same substrate thermoelectric
and catalytic materials; in such a way thermoelectric is constituting part of the combustor thus
enhancing efficiency and compactness.
Page 18
Catalytic microcombustion for portable electric power generation
12
Figure 1.3 Schematic of Seebeck effect in thermoelectric conversion system
( )COLDHOT TTα∆TαV −⋅=⋅= Eq. 1.1
λ
σTαZT
2
= Eq. 1.2
++
−+−==
hotcoldhot
coldhot
TR
ELte
TTZT1
1ZT1
T
TT
P
Pη Eq. 1.3
V Seebeck voltage
α Seebeck coefficient
Z figure of merit
ZT undimensional figure of merit
THOT hot junction temperature
TCOLD cold junction temperature
T mean temperature between THOT and TCOLD
ZT figure of merit
α Seebeck coefficient
σ electrical conductivity
λ thermal conductivity
ηTE thermoelectric efficiency
PEL electric power
PTR transferred power to thermoelectric
Page 19
Introduction
13
The overall efficiency of an electric generator based on combustor/thermoelectric coupling is
equivalent to ηTE only if ideally the chemical fuel is completely transferred to thermoelectric.
However, as already reported, combustion efficiency is questionable at the micro scale and even if
fuel is totally converted the power transferred to thermoelectric is only a part of the total released
power due to the heat lost via both exhausted gas and reactor wall. Propane fueled generator
developed by Federici et al. (2006) exhibited an overall efficiency of 0.5%. In details, the energy
balance executed on the entire system revealed that only 20% of the total combustion power is
transferred to thermoelectric.
Based on these considerations, it is pointed out the need to study particular engineering solutions
assuring high combustion efficiency and an optimal combustor/thermoelectric coupling. As already
reported, heat regeneration constitutes a promising strategies to enhance combustion efficiency at
the microscale. However, heat recovery is the key parameters to improve the efficiency of
combustor/thermoelectric coupling too. Weinberg (Weinberg et al., 2002, Weinberg, 2004)
calculated the efficiency of thermoelectric converter coupled with heat recirculating combustors in
the case of a configuration based on the recovery of the thermoelectric heat wasted via cold
junction. In Figure 1.4 it is shown the schematic of the proposed configuration: thermoelectric
module is external to the combustion chamber and the unconverted heat through thermoelectric is
transferred to the cold incoming gas. In this configuration the temperature difference provided by
combustion is approximately equal to that established between the thermoelectric junctions and it is
possible to show that it should be low (250°C) to allow an efficient operation of the system. As a
consequence, the use of such a thermoelectric/combustor coupling is optimized under combustion
diluted conditions.
Figure 1.4 Schematic of combustor/heat-exchanger/converter proposed by Weinberg (2004)
Despite the great relevance, no experimental studies are found in literature concerning the
combustor/thermoelectric coupling neither regarding the configuration proposed by Weinberg nor
for any other alternative solution.
Page 20
Catalytic microcombustion for portable electric power generation
14
1.6 Aim of the thesis
In this Ph. D. thesis the main issues in catalytic micro-combustion will be explored with the
conclusive aim to develop efficient combustors exhibiting a operating window wide enough to
make possible their application in portable power generation.
Particular attention will be devoted to the preparation of catalytic micro-structured reactors for
the combustion of C3H8, H2, CH4 and H2-CH4. A preparation method is developed to depose
efficaciously the active phase on inert substrates of different materials (Cordierite, α-Al2O3 and
FeCralloy) and in the form of both monoliths and platelets. Cheap and stable active phase
constituted by supported perovskite, γ-Al2O3/LaMnO3 has been prevalently considered. However,
the effect of promoting perovskite with a little amount of platinum has been taken into account and,
thus, Pt/Al2O3 catalyst are prepared and tested as reference material too.
A novel single channel planar catalytic reactor (SSR) is developed for the study of diluted
combustion of H2, CH4 and H2-CH4 up to a maximum temperature of 800°C. Such a reactor gives
the possibility to modulate the combustion chamber height thus allowing to study in depth the
particular interaction between heterogeneous and homogeneous combustion. In particular, SSR will
show its maximum relevance in understanding the chemical synergy in H2 assisted CH4
combustion.
Combustion under auto-thermal conditions has been studied too. In particular, ignition and
quenching of C3H8, H2, CH4 and H2-CH4 combustion have been investigated in a large spectrum of
operating conditions. Particular attention has been devoted to novel heat-recirculation reactors. In
particular, in order to experimentally verify the role of heat recovery on combustion stability, a
quartz reactor easy to run both in heat-recirculation and in no-recirculation reactor modes is
developed. The simple geometry of the proposed reactor enables to obtain fundamental
understanding of the effect of heat recirculation and on the instability mode in the limit of low
conductive reactor walls.
Micro power generators have been developed by coupling catalytic combustors with
thermoelectric modules. In particular, an innovative solution consisting on the integration of
multiple pass heat-recirculating combustors with TEs is proposed as alternative to that reported by
Weinberg (Weinberg et al., 2002, Weinberg, 2004). In the configuration the temperature difference
provided by combustion is independent by that established between the thermoelectric junctions and
the combustor is run under autothermal conditions.
Page 21
Introduction
15
Part of the present work and specifically the study on heat recirculation combustors and
electricity generators (discussed in the chapters 6 and 7) has been performed at University of
Delaware in the research group of Professor Vlachos.
Page 22
Catalyst preparation and characterization
16
CHAPTER 2
CATALYST PREPARATION AND CHARACTERIZATION
This chapter concerns the preparation and the characterization of the catalysts tested in this Ph.
D. research activity.
In particular, the first section is devoted to the description of the catalyst preparation methods;
LaMnO3/γ-Al2O3, Pt/γ-Al2O3 and Pt-LaMnO3/γ-Al2O3 based catalysts have been prepared both in
the powder and in structured form. As regards structured catalysts, a procedure to coat monoliths
and platelets is presented.
The second section is devoted to the characterization of the prepared catalysts. In particular,
specific surface area measurements, SEM and EDS analysis are discussed.
2.1 Catalysts preparation
2.1.1 Preparation of the platelet substrates
Alumina platelets, characterized by an elevated thermal (maximum working temperature as high
as 2000°C), mechanical and chemical resistance, have been prepared starting from products
supplied by Cotronics Corp.. Preparation technique includes the preparation of a slurry constituted
by a liquid activator used as binder and by α-Al2O3 pure powder. The slurry is dried overnight at
room temperature and it is further fired at 950°C in air. The platelets are prepared in the required
shape and dimensions through the use of specific home-made flexible and impermeable moulds; in
particular they are made in the shape of a parallelepiped, 0.5 cm thick, 1.5 cm wide and 3.0 cm
long. The manufacturing tolerance on the finished product is 0.1 mm. A detailed description of the
preparation technique is below reported.
In order to prepare the mould, a plate in the required shape and dimensions is realized in a piece
of brass by means of a milling machine. A silicone-like slurry is poured inside the block and it is
dried overnight at room temperature. The silicone part, removed from the block, is the mould
employed for preparing the platelets (Figure 2.1c).
According to the recipe supplied by Cotronics, a specific amount of alumina powder (Cotronics
Corp., Rescor 780) and liquid activator are poured in a beaker and properly mixed until obtaining a
slurry provided with a certain consistency. The slurry is then poured in the formerly prepared
Page 23
Catalyst preparation and characterization
17
mould. The mould is successively stirred for about 15 min in order to take out from the slurry the
remaining air bubbles, thus avoiding the occurrence of cracks in the further thermal treatments.
After about 20 min the slurry in excess is removed by the mould using a shovel, in order to obtain
the platelet in the required dimensions in the limit of the manufacturing tolerance. Slurry
workability is about 20 min, then acquiring a significant mechanical resistance. The slurry inside
the mould is dried at room temperature for about 20h. After such operation the mechanical
resistance is high enough to allow the removal of the platelet from the mould and the sample is
further fired at 950°C for 5 h. Such thermal treatment determines a further increase in the substrate
mechanical resistance besides allowing the removal of the organic part present in the liquid
activator. However, thermal treatment may causes over pressure because of the air still present in
the platelet and the thermal decomposition of the organic part. So, in order to avoid cracks in the
finished product, a very low heating rate (1°C/min) has been considered. In Figure 2.1a, b, d some
pictures of the prepared plates are reported.
Figure 2.1 Preparation of the alumina platelets; (a),(b),(d): platelets shape and dimension; (c)
mould used in the preparation.
2.1.2 Pre-treatment of the FeCralloy platelets
Catalytic substrates are prepared starting from FeCralloy foils (Good Fellow), characterized by a
thickness comprised between 1 and 5 mm. The foils are properly cut in order to obtain 1.5 cm wide
and 3.0 cm long samples. Before performing the deposition of the catalytic film, the metallic plates
undergo a specific treatment whose aim is to improve the anchoring of the layer subsequently
(a) (b)
(c) (d)
Page 24
Catalytic microcombustion for portable electric power generation
18
deposed. Actually, processing residual oil, still present on the untreated sample, needs to be
removed otherwise catalyst deposition success could be seriously compromised. Furthermore, it is
reported that a specific thermal treatment in air allows the growth of γ-alumina layer on the
FeCralloy surface (Valentini et al., 2001, Zhao et al. 2003). Ceramic structures, the so-called
whiskers, interposing between the FeCralloy surface and the catalytic layer, improve the anchoring
because of their greater chemical affinity with the deposed film respect to the metallic substrate.
The specific treatment performed on FeCralloy platelets is reported below.
Metallic substrates are first cleaned in ethanol for approximately 30min.; successively, in
agreement with the procedure reported by Zhao et al. (2003), the samples are treated for 15 min. in
a solution of NaOH (1 M) and successively for 15 min. in a solution of HCl (0.5 M). After these
chemical treatments, FeCralloy substrates are calcined in air for 10h at 950°C, decisive for the
formation of the surface alumina.
2.1.3 Preparation of powder catalysts
Powder catalysts have been prepared by supporting on γ-Al2O3 the active phase constituted by
Pt, LaMnO3 and Pt-LaMnO3. The preparation procedure of the samples includes several stages. In
the first step alumina in the form of powder (CK300, Akzo) is finely ground by means of a “ball
milling” machine till the mean diameter of the particles is less then 2 µm. In order to shift γ- to α-
alumina transition at temperatures higher than 1000°C, a stabilization procedure is needed and
carried out by inserting some amount of lanthanum oxide (5wt%) into the structure, thus inhibiting
the mobility of oxygen and aluminium atoms and, as consequence, the transition to the alpha phase
(Arai e Machida, 1996). After being stabilized, γ-Al2O3 is loaded up by the active phase.
The active phase and La2O3 are deposed on alumina through an “incipient wetness
impregnation” method in a rotary vapour (Laborota 4002, Heidolph). According to this method the
inert alumina powder is suspended in an aqueous solution constituted by the precursors of the
stabilizer or of the active phase. The precursors are added to the solution in a such amount as to
have the desired load and formulation of the catalysts. The prepared suspension is fed into the
rotary vapour rotating at 75 rpm and it is dried under vacuum conditions (100 mbar) at 50°C. The
dried impregnated powder is consequently calcined at 800°C for 3h in air.
An impregnation solution constituted by lanthanum nitrate has been prepared in order to stabilize
γ-Al2O3. About active phase, in the case of Pt/γ-Al2O3 systems an impregnation solution constituted
by a diluted chloroplatinic acid solution (Sigma Aldrich) has been prepared. A solution constituted
by manganese acetate (Manganese acetate tetraydrate, Aldrich) and lanthanum nitrate (Lanthanum
nitrate Hexahydrate, Fluka) has been prepared in the case of LaMnO3/γ-Al2O3 based catalyst.
Page 25
Catalyst preparation and characterization
19
Finally, in the case of the mixed active phase, Pt-LaMnO3/γ-Al2O3 catalysts, a solution constituted
at the same time by the precursors of Pt, Mn and La has been considered.
Table II. 1 provides details and the nomenclature of the catalysts prepared. Twelve samples are
prepared characterized by a different loading of LaMnO3 e Pt. The amount of perovskite deposed on
γ-Al2O3 varies from 10 to 30 wt% as regards the total weight of catalysts. Moreover, platinum based
catalysts are characterized by a Pt amount comprised between 0.15÷1 wt % as regards the total
weight of catalysts.
The prepared catalysts constituted “fresh” samples while if pretreated constituted “aged”
samples. Powder catalysts before being tested are subjected to an ageing treatment at 900°C in air
lasting maximum 3h.
ICP analysis is employed to measure Mn, Pt and La content in the prepared catalysts. The
analysis is performed on fresh samples; in Table II. 1 the obtained results are resumed. Concerning
supported perovskites, by measuring Mn and La amount is easy to derive indirectly the loading of
LaMnO3; according to measured values a maximum discrepancy of about 10% is revealed by
comparing the nominal and the actual LaMnO3 loading. Even in the case of Pt the discrepancy
between nominal and actual loading is maximum 10%.
Table II.1 Summary of powder catalysts prepared: active phase loading in terms of nominal and
measured values. Catalyst code (column 1) notation: the first number refers to the % (wt) of Pt (if
any) and the symbol to the catalyst employed (Pt, LM=LaMnO3,Pt-LM=Pt/LaMnO3).
Loading, %
LaMnO3 Pt Catalyst Code
Nominal Actual Nominal Actual
LM10 10 9.0 0 -
LM20 20 18.5 0 -
LM30 30 32.0 0 -
0.15PtLM10 10 9.0 0.15 0.16
0.35PtLM10 10 9.0 0.35 0.36
0.9PtLM10 10 9.0 0.90 0.93
0.15PtLM20 20 18.5 0.15 0.16
0.35PtLM20 20 18.5 0.35 0.36
1PtLM20 20 18.5 1.00 1.04
0.35PtLM30 30 32.0 0.35 -
0.35Pt 0 - 0.35 0.34
1Pt 0 - 1.00 1.11
Page 26
Catalytic microcombustion for portable electric power generation
20
2.1.4 Deposition of a catalytic film on platelets
The deposition of a catalytic layer on FeCralloy and alumina platelets is carried out through two
main preparation steps. In particular, catalysts is formerly prepared in the form of powder following
the preparation method described before and it is successively deposed on the substrates.
In order to depose the catalytic film on the FeCralloy and alumina substrate, a “slurry”
constituted by the fresh powder catalysts is prepared. At this proposal the powder samples, prepared
according to the procedure as above reported, is mixed with Boehmite (Disperal, Sasol), used as
binder. The solid mixture is thus suspended in an aqueous solution of nitric acid. The recipe of the
slurry used for the coating of the FeCralloy and alumina plates is reported in Table II.2.
Table II.2 Composition of the slurry used for coating FeCralloy and alumina platelets
Quantity [mg/(ml, H2O)]
HNO3 (65%wt) 21.6
Boehmite 58.8
Powder catalyst 250
The slurry is spread on the plates through a paintbrush and it is, successively, dried at 120°C for
20min. It is, finally, calcined at 800°C for 3h, in order to anchor the catalytic film on the substrate.
Moreover, the slurry used in the preparation of the catalytic platelets is further calcined; the
resulting powder catalyst is used as reference in the kinetic measurements in order to evaluate the
effectiveness of the deposition technique.
Some details of the structured catalyst prepared are reported in Tab. II.3. The first eight samples
are FeCralloy and alumina catalytic plates. They are constituted by a loading of perovskite (if
applicable) of 20wt% as regards the total amount of catalysts deposed on the substrate. The loading
of Pt (if applicable) corresponds to 1wt%. The sample A5 is a blank platelets. Finally, PwLM is the
powder sample obtained by calcining the slurry employed to prepare perovskite supported
structured catalysts.
ICP analysis has not been performed for the catalytic film deposed on the platelets. However, its
formulation is known being equivalent to that of the powder catalysts.
As-coated samples constituted “fresh” catalysts while if pretreated constituted “aged” samples.
Catalytic platelets before being tested are subjected to an ageing treatment at 800°C in air lasting
maximum 30h.
Page 27
Catalyst preparation and characterization
21
2.1.5 Preparation of monolith catalysts
Structured catalysts, constituted by Pt/γ-Al2O3, LaMnO3/γ-Al2O3, Pt-LaMnO3/γ-Al2O3, have
been prepared by coating cordierite honeycombed monoliths (NGK), characterized by a cell density
of 400 and 900 cpsi. Considered substrates are either in the shape of a cylinder or of a
parallelepiped. The monoliths are previously cut in order to obtain the desired shape and dimension.
Specifically, rectangular reactors are 5 cm long with a cross section made up of 2x5 channels in the
case of 400 cpsi or 3x8 in the case of 900 cpsi; while circular reactors are 1.2 cm long and have a
diameter equal to 1.7 cm, corresponding to 317 channels if 900 cpsi substrates are considered.
Table II.3 Summary of catalytic plates prepared: active phase loading in terms of nominal
values. Catalyst code (column 1) notation: the first number refers to the platelet thickness (if
applicable), the second number refers to the % (wt) of Pt (if any) and the symbol to the catalyst
employed (F=FeCrAlloy, A=Alumina, Pw=Powder, Pt, LM=LaMnO3); the number after hyphen is
a sequence number in the preparation.
Active phase loading, % Height, mm Code Substrate
Amount of catalyst
mg LaMnO3 Pt plate gap
F5LM FeCralloy 16 20 - 5 1
F5Pt1LM FeCralloy 17 20 1 5 1
F5Pt1 FeCralloy 17 0 1 5 1
F2LM FeCralloy 14 20 0 2 4
F5LM-2 FeCralloy 18 20 0 5 1
A5LM Alumina 19 20 0 5 1
A5LM-2 Alumina 18 20 0 5 1
A5Pt1LM Alumina 32 20 1 5 1
A5 Alumina 0 0 0 5 1
PwLM powder - 20 0 - -
The blank monolith are wash-coated with a γ-Al2O3 thin layer (approximately 50µm thick)
through modified dip-coating technique (Cimino et al., 2001). According to this technique, the
sample is dipped in a suspension made of diluted nitric acid and a solid content, equal to 20 wt%,
Page 28
Catalytic microcombustion for portable electric power generation
22
constituted by a mixture of small size alumina (80 wt%, Alfa Aesor) and commercial boehmite
(Disperal, Sasol) powder. After few minutes, enough to fill the channels with the slurry, the
monolith is removed from the suspension and the excess is blown-out by means of compressed air.
The sample is dried for 20 minutes at 120°C and afterwards calcined at 550°C for 2 h. A certain
number of cycles are needed to depose the desired amount of alumina, approximately equal to 20
wt% of the final weight of the monolith and once got it the sample is calcined at 800°C for 3 h in
order to anchor the layer to the substrate.
In the case of cylindrical monoliths, γ-Al2O3 has been stabilized by adding lanthanum oxide after
monolith washcoating; the loaded amount of stabilizer is 5-7 wt% respect to the total washcoat
weight (lanthanum and aluminium oxide weight). Impregnation technique is used to disperse La2O3
in the alumina structure. At this proposal, the wash-coated sample is dipped in a solution of diluted
lanthanum nitrate (Lanthanum nitrate Hexahydrate, Fluka) until the monolith channels are filled
with the solution. The sample is thus removed from the solution, the excess of solution is blown-out
and the monolith is dried at 120°C for 20 min and calcined at 800°C for 3h. This procedure is
repeated until the desired loading of La2O3 is obtained.
Impregnation technique is also used to load the active phase. In the case of Pt/γ-Al2O3 catalysts,
the wash-coated sample is dipped in a solution of diluted chloroplatinic acid (Sigma Aldrich),
corresponding to 0.1wt% of Pt. After the sample is removed from the solution and the excess is
blown-out, it is calcined at 800°C for 3h. This procedure is repeated until the desired loading of Pt
is obtained. The same procedure is followed in the case of perovskite based catalysts. In particular
for preparing LaMnO3/γ-Al2O3, the wash-coated monoliths are dipped in an aqueous solution made
of lanthanum nitrate (Lanthanum nitrate Hexahydrate, Fluka) and manganese acetate (Manganse
acetate tetraydrate, Aldrich), corresponding to 1.7 wt% of La and 0.7wt% of Mn. In the case of Pt-
LaMnO3/γ-Al2O3, only one solution containing both perovskite and Pt precursors is prepared. In
particular the aqueous solution, made starting from lanthanum nitrate, manganese acetate and
chloroplatinic acid, contains 1.7 wt% of La and 0.7wt% of Mn and 0.1wt % of Pt.
As-coated samples constituted “fresh” catalysts while if pretreated constituted “aged” samples.
Catalytic monoliths before being tested are exposed to combustion environment, at T=800÷900°C
and at a carbon dioxide and water concentrations of about 6÷10vol%, for about 5-10hr.
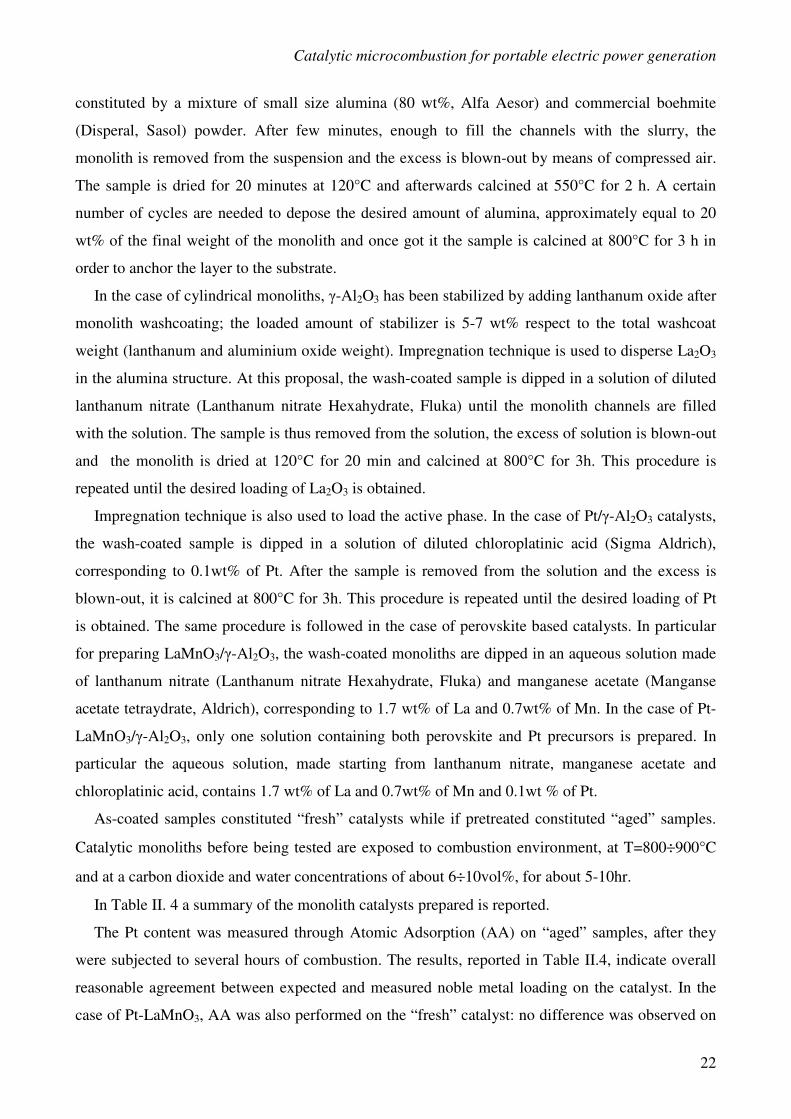
In Table II. 4 a summary of the monolith catalysts prepared is reported.
The Pt content was measured through Atomic Adsorption (AA) on “aged” samples, after they
were subjected to several hours of combustion. The results, reported in Table II.4, indicate overall
reasonable agreement between expected and measured noble metal loading on the catalyst. In the
case of Pt-LaMnO3, AA was also performed on the “fresh” catalyst: no difference was observed on
Page 29
Catalyst preparation and characterization
23
the noble metal loading, indicating good anchoring of the catalytic layer on the cordierite substrate
and no measurable Pt volatilization.
Table II. 4 Summary of monolith catalysts prepared: washcoat and active phase loading in
terms of nominal and measured values. Catalyst code (column 1) notation: the first number refers
to the % (wt) of Pt (if any), the last number to the monolith porosity in cpsi, and the symbol to the
catalyst employed (Pt, LM=LaMnO3,Pt-LM=Pt/LaMnO3).
Nominal
Loading, % Catalyst
code
Reactor
Shape
Porosity,
cpsi
Catalyst
Loading, g LaMnO3 Pt
Actual
Pt loading, %
R1Pt400 rectangular 400 0.116 - 1.00 1.06
R0.5Pt900 rectangular 900 0.220 - 0.50 0.59
R1Pt900 rectangular 900 0.217 - 1.00 1.05
R0.5PtLM900 rectangular 900 0.272 20 0.5 0.62
R0.5PtLM400 rectangular 400 0.156 20 0.5 -
RLM900 rectangular 900 0.287 20 - -
C1PtLM900 Circular 900 1.103 20 1 -
2.2 Catalysts characterization
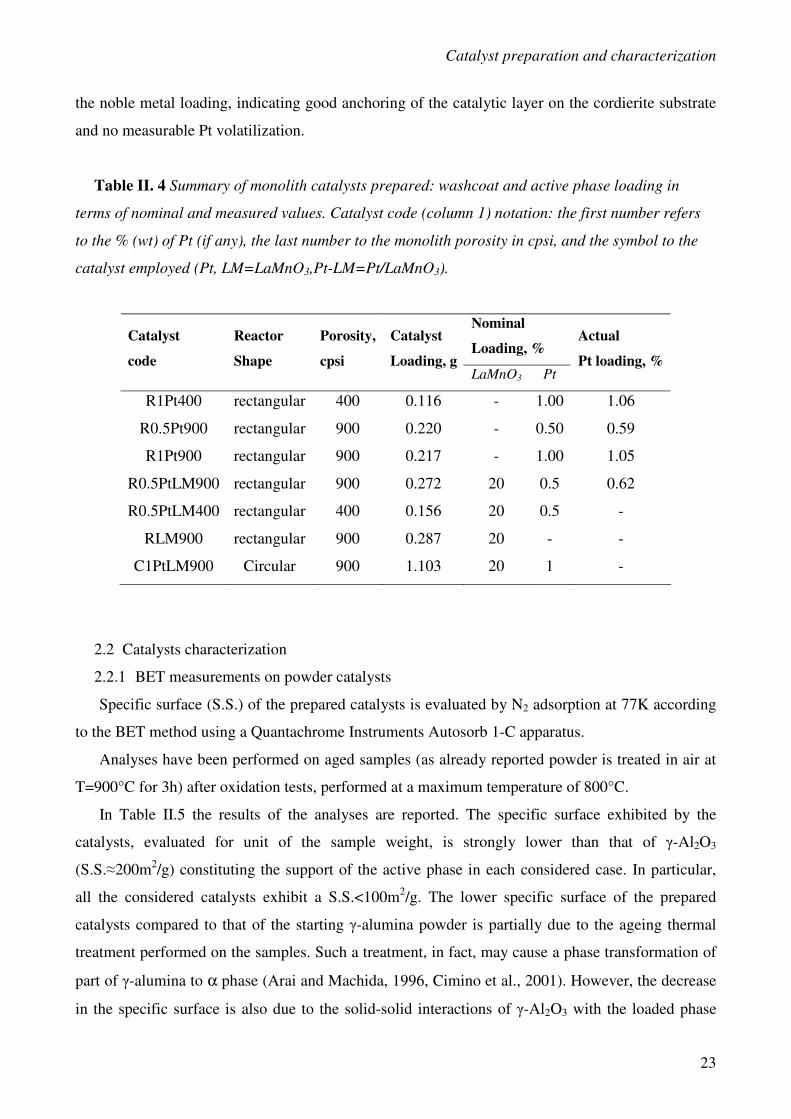
2.2.1 BET measurements on powder catalysts
Specific surface (S.S.) of the prepared catalysts is evaluated by N2 adsorption at 77K according
to the BET method using a Quantachrome Instruments Autosorb 1-C apparatus.
Analyses have been performed on aged samples (as already reported powder is treated in air at
T=900°C for 3h) after oxidation tests, performed at a maximum temperature of 800°C.
In Table II.5 the results of the analyses are reported. The specific surface exhibited by the
catalysts, evaluated for unit of the sample weight, is strongly lower than that of γ-Al2O3
(S.S.≈200m2/g) constituting the support of the active phase in each considered case. In particular,
all the considered catalysts exhibit a S.S.<100m2/g. The lower specific surface of the prepared
catalysts compared to that of the starting γ-alumina powder is partially due to the ageing thermal
treatment performed on the samples. Such a treatment, in fact, may cause a phase transformation of
part of γ-alumina to α phase (Arai and Machida, 1996, Cimino et al., 2001). However, the decrease
in the specific surface is also due to the solid-solid interactions of γ-Al2O3 with the loaded phase
Page 30
Catalytic microcombustion for portable electric power generation
24
and it becomes more significant by increasing the amount of active phase on the catalyst. In
confirming with that, S.S. of the samples decreases by increasing the perovskite loading. S.S.
decreases also by increasing the platinum loading on the samples but maintaining the same amount
of deposed perovskite. In the case of LM10, for example, the specific surface is 109 m2/g; by
considering Pt promoted catalysts, S.S.=103 and S.S.=99 are measured respectively if 0.15 and
0.35wt% of Pt is added to perovskite. It is worth mentioning that this outcome, concerning the
decrease in the specific surface in the case of Pt promoted LaMnO3 compared to that of unpromoted
perovskite, is in agreement with the results reported by Giebeler et al. (2007)
Table II.5 BET measurements on powder catalysts
Catalyst S.S.
m2/g
LM30 74.7
LM20 91.2
LM10 108.9
0.15PtLM20 81.3
0.35PtLM20 79.1
0.15PtLM10 102.8
0.35PtLM10 99.2
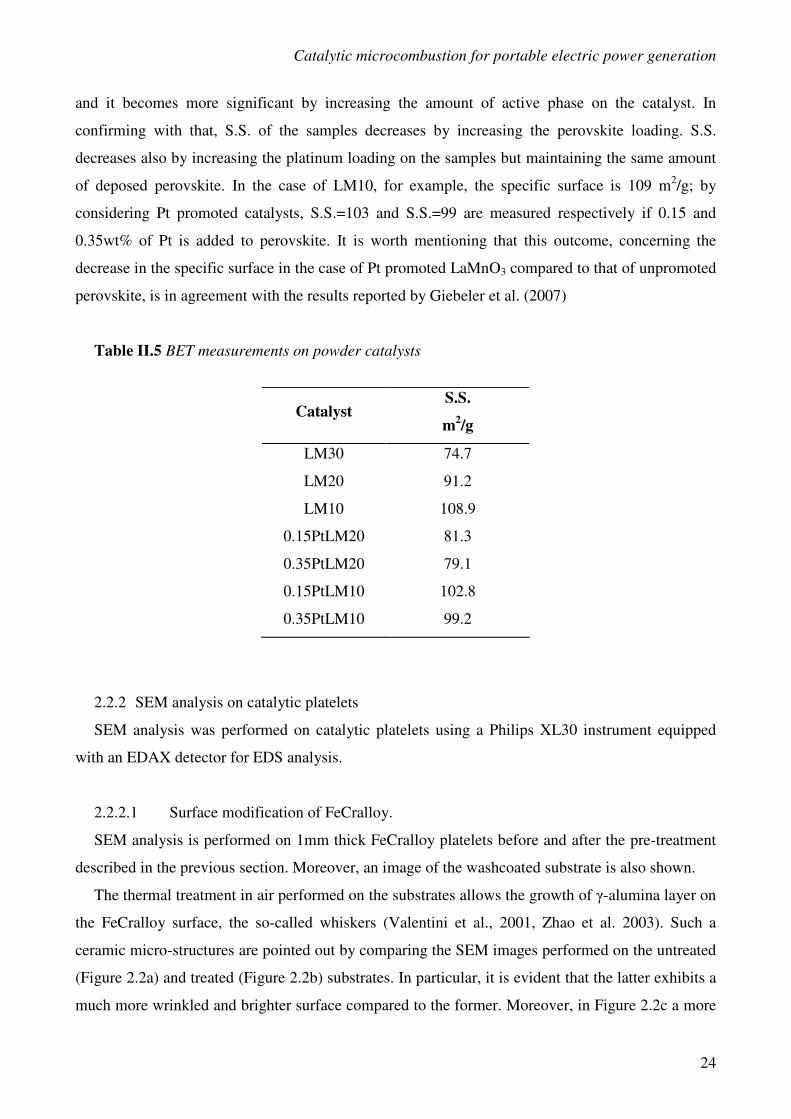
2.2.2 SEM analysis on catalytic platelets
SEM analysis was performed on catalytic platelets using a Philips XL30 instrument equipped
with an EDAX detector for EDS analysis.
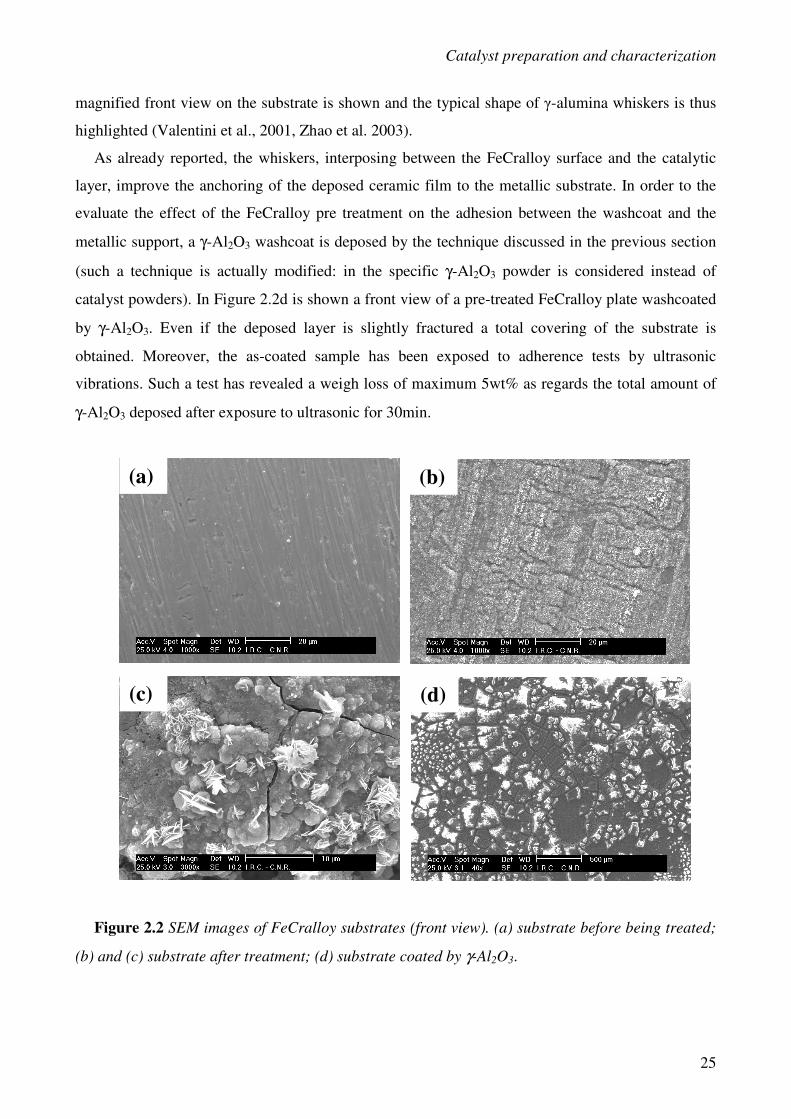
2.2.2.1 Surface modification of FeCralloy.
SEM analysis is performed on 1mm thick FeCralloy platelets before and after the pre-treatment
described in the previous section. Moreover, an image of the washcoated substrate is also shown.
The thermal treatment in air performed on the substrates allows the growth of γ-alumina layer on
the FeCralloy surface, the so-called whiskers (Valentini et al., 2001, Zhao et al. 2003). Such a
ceramic micro-structures are pointed out by comparing the SEM images performed on the untreated
(Figure 2.2a) and treated (Figure 2.2b) substrates. In particular, it is evident that the latter exhibits a
much more wrinkled and brighter surface compared to the former. Moreover, in Figure 2.2c a more
Page 31
Catalyst preparation and characterization
25
magnified front view on the substrate is shown and the typical shape of γ-alumina whiskers is thus
highlighted (Valentini et al., 2001, Zhao et al. 2003).
As already reported, the whiskers, interposing between the FeCralloy surface and the catalytic
layer, improve the anchoring of the deposed ceramic film to the metallic substrate. In order to the
evaluate the effect of the FeCralloy pre treatment on the adhesion between the washcoat and the
metallic support, a γ-Al2O3 washcoat is deposed by the technique discussed in the previous section
(such a technique is actually modified: in the specific γ-Al2O3 powder is considered instead of
catalyst powders). In Figure 2.2d is shown a front view of a pre-treated FeCralloy plate washcoated
by γ-Al2O3. Even if the deposed layer is slightly fractured a total covering of the substrate is
obtained. Moreover, the as-coated sample has been exposed to adherence tests by ultrasonic
vibrations. Such a test has revealed a weigh loss of maximum 5wt% as regards the total amount of
γ-Al2O3 deposed after exposure to ultrasonic for 30min.
Figure 2.2 SEM images of FeCralloy substrates (front view). (a) substrate before being treated;
(b) and (c) substrate after treatment; (d) substrate coated by γ-Al2O3.
(a)
(c)
(b)
(d)
Page 32
Catalytic microcombustion for portable electric power generation
26
In order to further confirm the formation of γ-Al2O3 on the surface of FeCralloy in consequence
of the described treatment in Table II.6 the results of EDS analysis on the untreated and treated
substrates are reported. In particular, it is reported that the chemical composition of the starting
FeCralloy foils is 72.1wt% of Fe, 20.3wt% of Cr and 7.6wt% of Al. Such a FeCralloy composition
is consistent with that supplied by Good Fellow and with that reported in literature for other
FeCralloy substrates (Zhao et al., 2003). After the treatment a strong alteration of FeCralloy
chemical compositions is observed. In particular, the treated sample exhibits a much higher content
of aluminum; more specifically, the percentage of Al is 7.6 and 45.2wt% respectively in the case of
untreated and treated substrate. The increase in Al percentage in the surface composition indicates
the existence of Al2O3 outer layer consisting of the alumina whiskers (Valentini et al., 2001, Zhao et
al. 2003).
Table II.6 EDS analysis on the surface of FeCralloy substrate before and after the treatment
Fe, wt% Cr, wt% Al, wt%
Untreated sample 72.1 20.3 7.6
Treated sample 40.8 14.0 45.2
2.2.2.2 Catalytic layer deposed on α-alumina plates
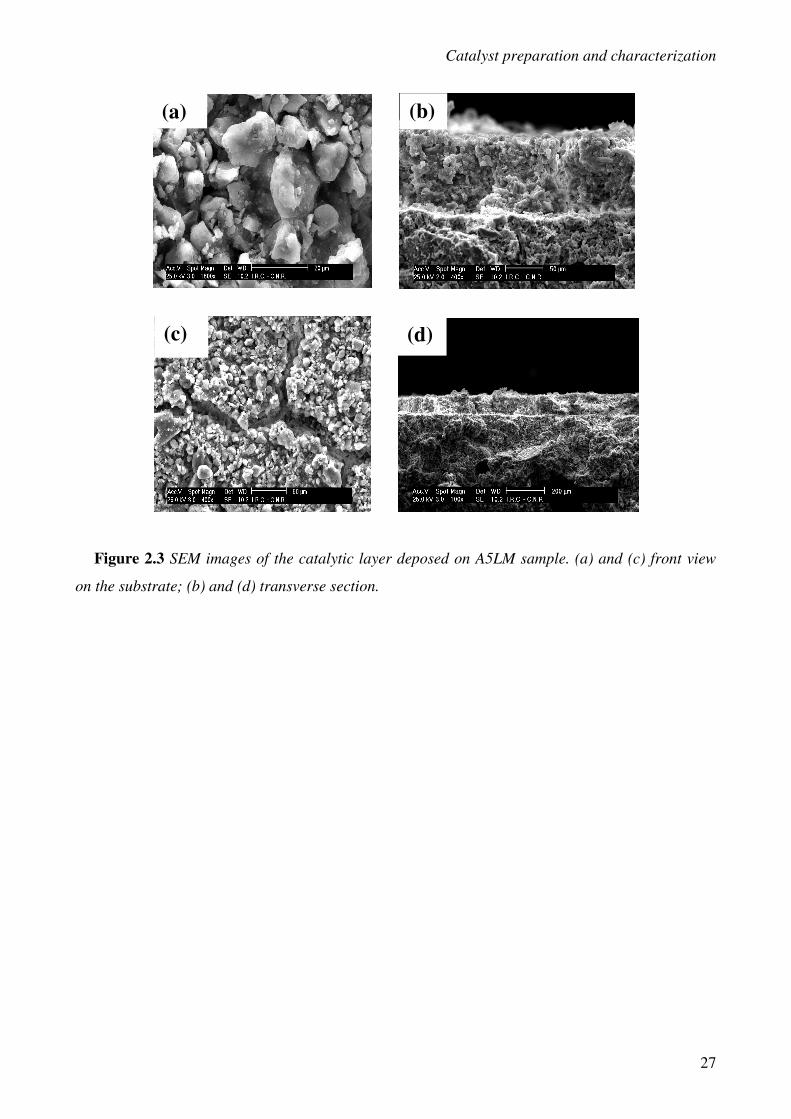
In Figure 2.3 SEM images of “fresh” A5LM catalyst are shown. In particular, two different
magnifications of both the front view and the cross section of the as-coated substrate are presented.
The platelets exhibits an homogeneous distribution of the of the catalytic layer on the surface.
The deposed film, in fact, totally covers the substrate even if some cracks are observed (see Figure
2.3c). The film deposed is constituted by blocks of particle whose size is ranged from 5 to 20µm.
(see Figure 2.3a). Moreover, the thickness of the catalytic layer is quite uniform with a value of
about 80µm (see Figures 2.3b and d).
Page 33
Catalyst preparation and characterization
27
Figure 2.3 SEM images of the catalytic layer deposed on A5LM sample. (a) and (c) front view
on the substrate; (b) and (d) transverse section.
(b)
(a)
(d)
(c)
Page 34
Experimental set-up
28
CHAPTER 3
EXPERIMENTAL SET-UP
In this chapter the reactors and the experimental set up developed in this Ph. D. research activity
are described.
The first section is devoted to the description of the different catalytic reactors employed in the
reaction tests. Different solutions are presented in terms of reactor wall materials, manufacturing
details, flow configuration and catalytic systems.
Finally, in the third section the experimental apparatus and all the employed equipments are
reported.
3.1 Reactor design
3.1.1 Quartz reactors for combustion tests on powder catalysts
A quartz reactor (PwQR) has been developed to carry out combustion tests on powder catalysts.
In Figure 3.1 a descriptive picture of the reactor is reported.
The reactor is constituted by a quartz tube whose external (OD) and internal (ID) diameters are
respectively 11.0 mm and 9.0 mm. A ceramic porous septum provided with a circular section and
with a mesh comprised between 70 and 120 µm and welded at a certain height of the quartz tube,
holds up the powder catalyst.
A smaller blind quartz tube is inserted axially inside the larger one. This second tube is mounted
such as to have the closed end strictly in contact with the septum while the open one is outside the
reactor. A thermocouple (0.5mm thick) is inserted in this tube allowing the measure of the thermal
profile inside the catalytic bed. The resulting section for the gas flowing is annular with an I.D.
equal to 6.0 mm.
The particular reactor configuration allows temperature measurements along all the length of the
bed by moving the thermocouple axially through the internal tube. Moreover, the placement of the
thermocouple longitudinally respect to the flow direction rather than transversally allows to
measure temperatures reducing perturbations on the fluid dynamics.
Page 35
Experimental set-up
29
3.1.2 Stainless steel reactor for combustion tests on catalytic plates.
High thermal resistance stainless steel (AISI 310S) reactor, SSR is used in the combustion tests
on catalytic plates. In Figure 3.2a a picture of the SSR is reported.
A particular attention has been devoted to the reactor design that has to respond to the
requirements reported below:
• the reactor has to be gastight until a relative pressure equal at least to 500 mbar;
• reactant by-passing has to be avoided
• uniform distribution of the gas residence time inside the reactor has to be achieved
• dead volume has to be reduced
• a simple placement and displacement of the platelets is needed
• thermal profile measurement along the axial length needs to be detected.
The main body of the reactor (Figure 3.2b) is constituted by a flanged barrel where a chamber
for the placements of the catalyst has been realized. The chamber is 6 mm high, 15 mm wide and 50
mm long. The catalytic plate is inserted in this cavity leaving a determined gap (varying in the range
of 1-4mm) and thus constituting the combustion chamber. The main body of the reactor shows an
annular cavity (Figure 3.2b) for the placement of a metal-plastic gasket. A flange is used to
sandwich the gasket that is properly pressed by means of six bolts and nuts.
Gas Input
Gas Output
Sliding Thermocouple
Septum
Catalyst
Gas Input
Gas Output
Sliding Thermocouple
Septum
Catalyst
Figure 3.1 Quartz reactor for combustion tests on powder (PwQR); flow direction, catalyst,
thermocouple and septum placement.
Page 36
Catalytic microcombustion for portable electric power generation
30
Several blind holes are realized on the axial length of the reactor in order to house the
thermocouples (Figure 3.2a). The holes are 7mm spaced and their end is 0.5 mm far from the
combustion chamber. The most part of the holes are on the axis of the reactor while one of them is
outside the axis in order to allow temperature measurement on the transverse direction (Figure
3.2a). Tubes for the reactant feed and for the exhausted are properly connected to the reactor
through Swagelok unions (Figure 3.2a). In Figure 3.2c it is reported the placement of the SSR in the
oven during the reaction tests.
In Figure 3.3 the flow configuration in the SSR is showed. The gas enters the reactor and flows
tangentially with respect to the catalytic platelet. Two silicon carbide foams are placed before and
after the catalysts in order to well distribute the mass flow of the gas in correspondence with the
inlet and the outlet of the catalyst.
Figure 3.2 Some images of SSR; (a) coupling flange, bolts and nuts, holes housing the
thermocouples, Swagelok unions for the connection of inlet and outlet tubes; (b) holes for bolts,
annular cavity for the gasket, combustion chamber; (c) SSR placement in the oven during reaction
tests.
Holes housingthermocouple
SiC foams
Catalyticplatelet
IN OUT
Figure 3.3 Flow configuration in SSR; catalytic platelet, holes housing thermocouples and SiC
foams placements
(a) (b) (c)
Page 37
Experimental set-up
31
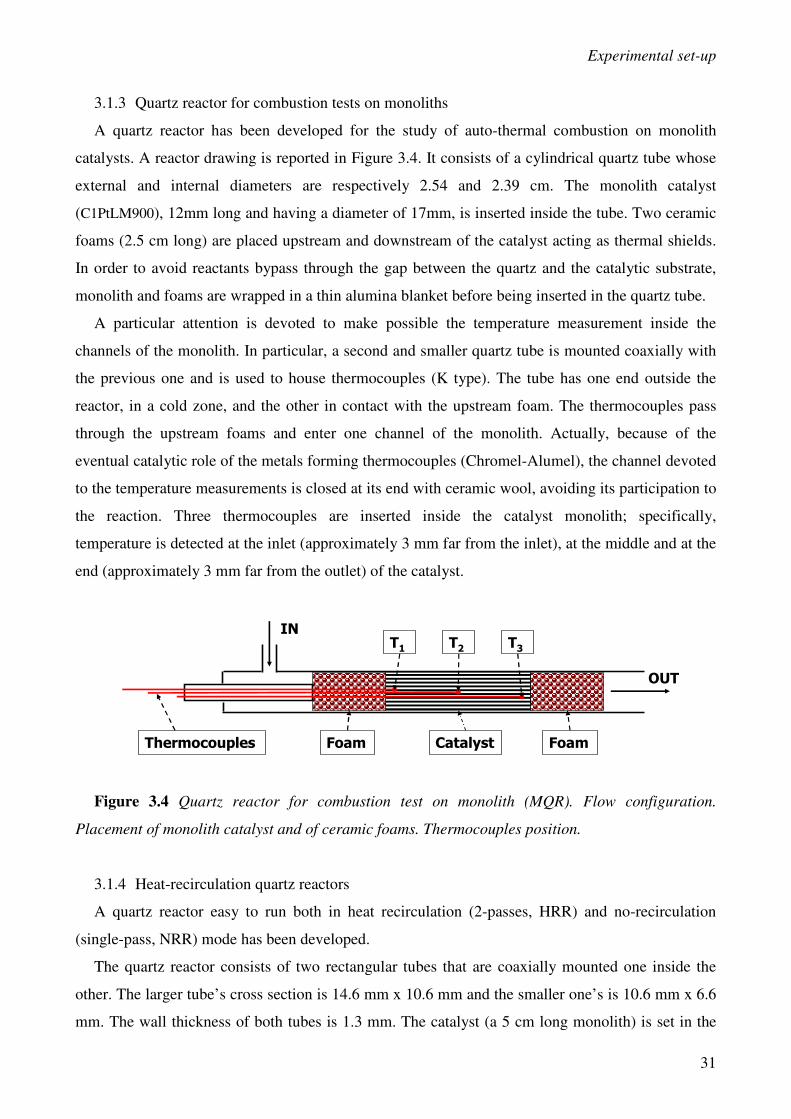
3.1.3 Quartz reactor for combustion tests on monoliths
A quartz reactor has been developed for the study of auto-thermal combustion on monolith
catalysts. A reactor drawing is reported in Figure 3.4. It consists of a cylindrical quartz tube whose
external and internal diameters are respectively 2.54 and 2.39 cm. The monolith catalyst
(C1PtLM900), 12mm long and having a diameter of 17mm, is inserted inside the tube. Two ceramic
foams (2.5 cm long) are placed upstream and downstream of the catalyst acting as thermal shields.
In order to avoid reactants bypass through the gap between the quartz and the catalytic substrate,
monolith and foams are wrapped in a thin alumina blanket before being inserted in the quartz tube.
A particular attention is devoted to make possible the temperature measurement inside the
channels of the monolith. In particular, a second and smaller quartz tube is mounted coaxially with
the previous one and is used to house thermocouples (K type). The tube has one end outside the
reactor, in a cold zone, and the other in contact with the upstream foam. The thermocouples pass
through the upstream foams and enter one channel of the monolith. Actually, because of the
eventual catalytic role of the metals forming thermocouples (Chromel-Alumel), the channel devoted
to the temperature measurements is closed at its end with ceramic wool, avoiding its participation to
the reaction. Three thermocouples are inserted inside the catalyst monolith; specifically,
temperature is detected at the inlet (approximately 3 mm far from the inlet), at the middle and at the
end (approximately 3 mm far from the outlet) of the catalyst.
IN
OUT
T3T2
CatalystFoam Foam
T1
Thermocouples
Figure 3.4 Quartz reactor for combustion test on monolith (MQR). Flow configuration.
Placement of monolith catalyst and of ceramic foams. Thermocouples position.
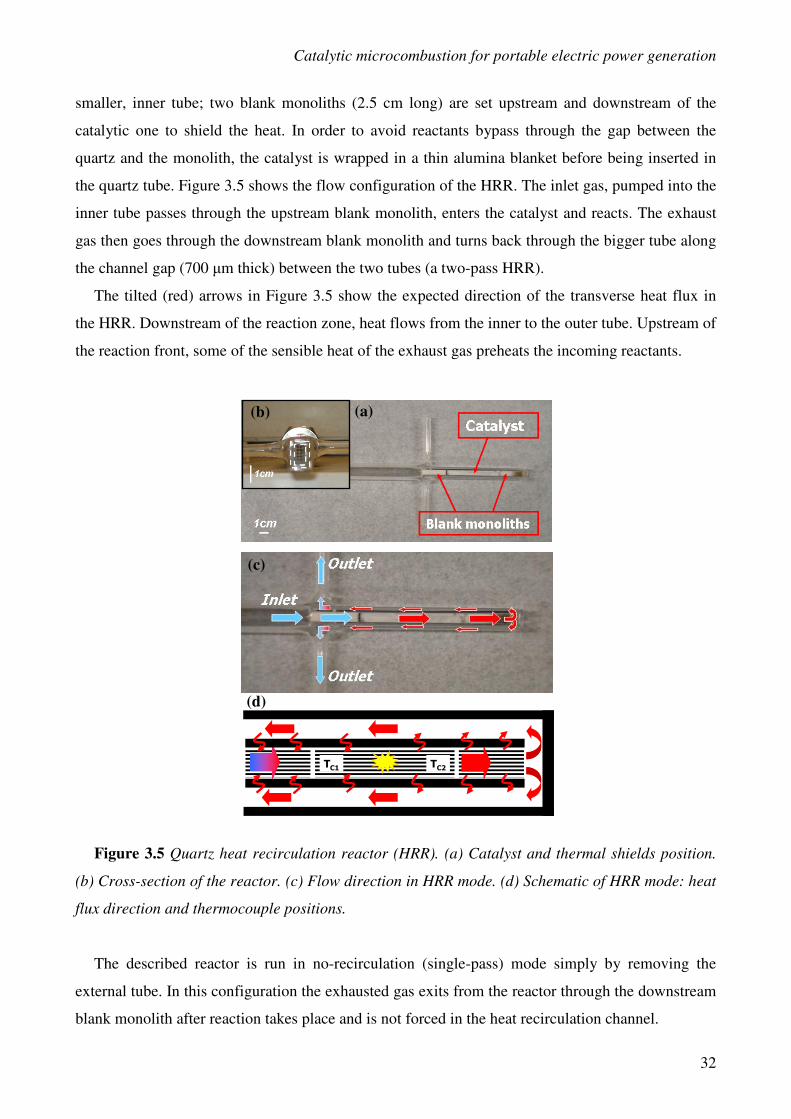
3.1.4 Heat-recirculation quartz reactors
A quartz reactor easy to run both in heat recirculation (2-passes, HRR) and no-recirculation
(single-pass, NRR) mode has been developed.
The quartz reactor consists of two rectangular tubes that are coaxially mounted one inside the
other. The larger tube’s cross section is 14.6 mm x 10.6 mm and the smaller one’s is 10.6 mm x 6.6
mm. The wall thickness of both tubes is 1.3 mm. The catalyst (a 5 cm long monolith) is set in the
Page 38
Catalytic microcombustion for portable electric power generation
32
smaller, inner tube; two blank monoliths (2.5 cm long) are set upstream and downstream of the
catalytic one to shield the heat. In order to avoid reactants bypass through the gap between the
quartz and the monolith, the catalyst is wrapped in a thin alumina blanket before being inserted in
the quartz tube. Figure 3.5 shows the flow configuration of the HRR. The inlet gas, pumped into the
inner tube passes through the upstream blank monolith, enters the catalyst and reacts. The exhaust
gas then goes through the downstream blank monolith and turns back through the bigger tube along
the channel gap (700 µm thick) between the two tubes (a two-pass HRR).
The tilted (red) arrows in Figure 3.5 show the expected direction of the transverse heat flux in
the HRR. Downstream of the reaction zone, heat flows from the inner to the outer tube. Upstream of
the reaction front, some of the sensible heat of the exhaust gas preheats the incoming reactants.
Figure 3.5 Quartz heat recirculation reactor (HRR). (a) Catalyst and thermal shields position.
(b) Cross-section of the reactor. (c) Flow direction in HRR mode. (d) Schematic of HRR mode: heat
flux direction and thermocouple positions.
The described reactor is run in no-recirculation (single-pass) mode simply by removing the
external tube. In this configuration the exhausted gas exits from the reactor through the downstream
blank monolith after reaction takes place and is not forced in the heat recirculation channel.
(d)
TC1 TC2
(b) (a)
(c)
Page 39
Experimental set-up
33
As already reported in the previous paragraph, temperature measurements is carried out inside
one channel of the reactive monolith. Even in this case a quartz tube is used to house the
thermocouples. Specifically, two thermocouples (K type) are inserted inside the catalyst monolith;
specifically, temperature is detected at the inlet (approximately 5 mm far from the inlet) and at the
end (approximately 5 mm far from the outlet) of the catalyst.
3.1.5 Electricity micro-generators
HRR combustor is integrated with a thermoelectric module (HZ-2, Hi-Z Technology, Inc.) thus
constituting an electricity generator. Such a coupling is realized taking the procedure reported by
Federici et al. (2006) as a starting point.
In Figure 3.6 a schematic of the cross-sectional view of 2pTER generator is shown. In particular,
the main parts constituting the generator are highlighted so making clear the coupling procedure.
A HHR combustor, not equipped with thermal shields, is inserted coaxially in a rectangular
aluminum tube. In order to fill the gap between the walls of quartz reactor and Al tube, HRR
combustor is previously wrapped up in a very thin copper foil (500µm thick). Actually, the presence
of an air layer in the interspace is very detrimental for the heat transfer from the combustor to
thermoelectric module. On the contrary, a promoting effect is expected by using an highly
conductive metal as copper.
The HZ-2 module is approximately 2.9cm wide x 2.9cm long x 0.5cm thick and weigh 13.5g. It
consists of 97 thermocouples arranged electrically in series and thermally in parallel. The
thermocouples consists of "Hot Pressed", Bismuth Telluride based, semiconductors. The bonded
metal conductors enable the HZ-2 module to operate continuously at temperatures as high as 250°C
and intermittently as high as 400°C without degrading the module. Moreover, the device exhibits an
internal electrical resistance Rint=4Ω (data supplied by Hi-Z Technology, Inc.). The thermoelectric
module is mounted on one side the combustor such as to have its hot junction on the aluminum
tube. The latter is a good support for the thermoelectric module; in fact, it exhibits a sufficiently
high thermal conductivity to efficaciously spread the heat released by combustion thus guaranteeing
an uniform temperature on its surface. Moreover, Al shows a lower density compared to that of
copper such as to allow a strong decrease in the final device weight.
A finned copper heat sink, CoolWave CPU Cooler from Spire, is placed on top of
thermoelectric, in correspondence of cold junction, to enhance convective cooling efficiency.
In order to prevent electrical shorting two pieces of α-alumina wafers are placed between the
thermoelectric and the aluminum tube and between the thermoelectric and the copper heat sink.
Page 40
Catalytic microcombustion for portable electric power generation
34
To improve the thermal contact, thermal grease supplied by Hi-Z is placed between the
thermoelectric and the alumina wafers and between the alumina wafers and the aluminum tube.
The part of HRR combustor not taken up by thermoelectric is devoted to the pre heating of the
fuel mixture. This reactor section, in fact, is wrapped up in a high temperature heating tape and is
successively insulated with Pyrogel (Aspen Aerogels).
To further improve the thermal contact, the entire HRR combustor/Al tube/thermoelectric/heat
sink/ stack is placed under compressive force of a coventional C-clamp (≈30lb).
Figure 3.6 Schematic representation of 2pTER. The main constituting parts are highlighted: Al
tube, copper foils, HRR combustor, thermoelectric module (hot and cold junctions), heat sink, α-
Al2O3 foils.
In Figure 3.7 a schematic of the cross-sectional view of 3pTER generator is shown.
The coupling procedure of the thermoelectric module with the combustor is exactly the same as that
employed in the case of 2pTER but differently from this generator, 3pTER is formed by a 3-pass
heat recirculation reactor whose external wall is constituted by the aluminum tube. In other word, in
3pTER Al tube is not only a support of thermoelectric module but is a part of the reactor. As a
consequence in the 3-pass generator the Al tube is much bigger than that employed in the case of 2-
Heat Sink αααα-Al2O3 foil
TEs
module
Al tube Cu foil
cold junction
hot junction
HRR
Page 41
Experimental set-up
35
pass generator. In Figure 3.8 a picture of 3pTER is shown. In particular, it is highlighted the
presence of Swagelok-type fittings to mount the aluminum tube on HRR.
In Figure 3.9 a picture of the as-mounted 3pTER generator is reported. In particular, it is
highlighted the presence of two external thermocouples employed to measure the hot and cold
junctions temperatures. Moreover, the two electric wires exiting from thermoelectric module are
shown. Actually, as it will be clear later, these wires constitute part of the electric circuit considered
to test generator performances. In Figure 3.9 are also shown other generator elements like the C-
clamp, the heating tape and the heat sink/thermoelectric stack.
Figure 3.7 Schematic representation of 3pTER. The main constituting parts are derived by
comparing this drawing with that reported in Figure 3.5: Al tube, HRR combustor, thermoelectric
module (hot and cold junctions), heat sink, α-Al2O3 foils.
Figure 3.8 Picture of 3pTER generator.
3cm
Page 42
Catalytic microcombustion for portable electric power generation
36
3.2 Experimental apparatus
3.2.1 Diluted combustion tests
Reaction tests have been carried out in the experimental apparatus reported in Figure 3.10.
Overall, it is divided into a gas feed, reactive and analysis sections, whose details are reported
below.
Gas is stored in high purity cylinders; specifically, methane (IP 4.5), oxygen (IP 2.7), nitrogen
(IP 4.8) and H2/N2 mixture (2Vol% H2) have been used. Moreover, pure hydrogen has been
provided by a generator (HG2400, Claind) based on water electrolysis.
Gas flow rates have been controlled through mass flow controllers (MFC 5850E, Brooks),
communicating with a computer by means of a serial interface. Gas cylinders are provided with
specific regulators adjusting the delivery pressure to the MFCs at their working value, (4 bar).
Figure 3.9 Picture of as mounted 3pTER generator. (a) C-clamp; (b) gas inlet; (c) exhausted
gas; (d) heating tape; (e) k-type thermocouples; (f) heat sink/thermoelectric stack; (g) electric wire
exiting from TEs.
Reactant gas passes through a four way valve and in dependence of the valve position enters the
reactor or by-passes it. By-passing the reactor is necessary to measure the inlet gas composition.
In order to carry out combustion test under temperature controlled conditions, electric heating
elements are employed. Specifically, a tubular furnaces (Lenton), working at a maximum
temperature equal to 1200°C, is considered in the case of PwQR. In the case of SSR it is employed
a muffle (AAF1100, Carbolite) working at maximum 1100°C. Both the furnaces are provided with
a PID-type controller.
(a)
(b)
(b)
(c)
(d)
(e)
(f)
(g)
Page 43
Experimental set-up
37
CH4, CO, CO2, H2 and O2 concentrations are measured continuously by means of an analyzer
(NGA2000, Fisher-Rosemount). In particular, an infrared detector is employed for CH4, CO, CO2
analysis, a TCD provides hydrogen measurement while a para-magnetic cell is considered in the
case of O2 analysis. A software internal to the analyzer allows a concentration measurement
corrected from eventual interferences in real time; in the specific, it is needed to take in account
interferences in hydrogen measurement through TCD. Finally, the right use of the analyzer is
guaranteed at a total flow rate comprised in the range of 12 and 90 slph.
In order to avoid water condensation inside the measurement cells of the analyzer, thus falsifying
the analysis, exhausted gases are dried in a chemical trap constituted by a calcium chloride bed and
placed downstream of the reactor. This kind of trap is effective and selective in adsorbing vapor
while it is inert with respect to the other reaction reactants and products (particularly CO2).
Moreover, the experimental apparatus allows flow rate measurements by means of a bubble flow
meter.
Legend:
1. H2 Generator
2. Gas cylinders
3. Computer provided with a data acquisition board
4. Analyzer
5. Bubble flow meter
6. Pressure transductor
7. Electro valve
Page 44
Catalytic microcombustion for portable electric power generation
38
8. CaCl2 trap
9. Venting
10. Heating elements
11. Reactor
12. Mass flow controller --- Data lines and electrical signals
Figure 3.10 A description of the experimental apparatus for temperature controlled reaction
tests.
Relative pressure is detected upstream of the reactor by means of a transductor (ROSEMOUNT
2088). In order to vent eventual over pressure, an On-Off electrovalve (ASCO 8263) with a
threshold value equal 0.5 bar is employed.
National Instruments data acquisition board (NI PCI-6229, M series DAQ) is used to acquire
signals from thermocouples, transductor and analyzer. The data are collected, visualized, recorded
and elaborated by means of a P.C. using a home-made software developed in Lab View
environment.
3.2.2 Auto-thermal combustion tests
Combustion tests under auto-thermal conditions are carried out in the experimental apparatus
reported in Figure 3.11.
As in the experimental apparatus described previously, a gas feed, a reactive and an analysis
sections are present. Gases are stored in high purity gas cylinder; specifically, propane (IP 4.5),
methane (IP 4.5), oxygen (IP 2.7), nitrogen (IP 4.8) and helium (IP 4.8) (the latter not reported in
Figure 3.11) have been used; moreover the hydrogen generator (HG2400, Claind) is used. Gas flow
rates are controlled throgh mass flow controllers (MFC 5850E, Brooks) and enters the reactors
through a four way valve.
Actually, a total flow rate comprised between 40 and 150 slph is considered in the case of auto-
thermal experiments but, as already stated before, maximum 90 slph could be sent to the analyzer
for avoiding malfunction. So the experimental ring in this case has to provide for a splitting of the
current into two part downstream of the reactor. Specifically, a part of the total flow rate goes
through a needle valve and exits; only the remaining part goes to the analysis section. The needle
valve has the aim of changing the pressure drop thus controlling the total flow rate sent to the
analysis section.
Page 45
Experimental set-up
39
High fuel concentration required for achieving auto-thermal condition brings about a vapor
partial pressure in the exhausted higher than vapor pressure at room temperature. An ice bath based
condenser is placed upstream of the trap in order to avoid its fast saturation.
As already described in the previous paragraph, Fisher-Rosemount NGA2000 analyzer is used to
measure continuously CH4, CO, CO2, H2 and O2 concentrations.
In the case of propane combustion gas is analyzed using an HP 6890 Series Gas Chromatograph:
CO2 and O2 are detected using a TCD detector, while C3H8 using both TCD and FID detectors.
Fuel mixtures are ignited by means of electric heating elements. Specifically, a tubular furnaces
(Lenton), provided with a PID-type controller and working at a maximum temperature of 1200°C,
is considered in the case of MQR reactor. A one-zone-controlled heating tape is instead employed
in the case of HRR and NRR.
In order to reduce heat dissipation the reactors are thermally insulated with either ceramic wool
or pyrogel (Aspen Aerogels).
Legend:
1. H2 Generator
2. Gas cylinders
3. Computer provided with a data acquisition board
4. Analyzer or Gas Chromatograph
5. Bubble flow meter
6. Pressure transductor
Page 46
Catalytic microcombustion for portable electric power generation
40
7. Electro valve
8. CaCl2 trap
9. Venting
10. Heating elements
11. Reactor
12. Mass flow controller
13. Ice bath condenser
14. Needle valve
--- Data lines and electrical signals
Figure 3.11 A description of the experimental apparatus for auto-thermal combyustion tests
3.2.3 Measurements of electricity generators performances
To quantify power generation, the thermoelectric module is connected in series with a rheostat to
simulate the operation of a portable electronic device. A voltmeter and an ammeter are used to
measure respectively load voltage and current as a function of load resistance by varying the
resistance of the rheostat.
In Figure 3.12 is reported the electric circuit considered in the testing of the generators. In such a
figure, thermoelectric modules is represented by the box, the internal resistance of TEs is Rint, the
load resistance is RL and the A and V circles are respectively the ammeter and the voltmeter.
The ammeter is connected is series with the thermoelectric and measures the current i flowing
through the circuit. The voltmeter is connected in parallel with the thermoelectric and measures the
potential difference at its ends, VCD. However, VCD is also equal to the voltage drop at the ends of
RL, VCE. According to the equation Eq. III.1, the power developed, PEL, is obtained by the product
of the measured values of the voltage and the current.
Moreover, in the electrical circuit shown in Figure 3.12 VAB is the electrical potential developed
by the thermoelectric module or Seebeck voltage. By applying Ohm’s law on the whole circuit is
possible to calculate the current as a function of VAB and Rint (Eq. III.2). As a results, by
substituting such an expression of current in Eq. III.1, it is possible to obtain PEL as a function of the
Seebeck voltage, of Rint and of RL. Actually, considering the first derivative of PEL as regard RL it
results that PEL shows a maximum in correspondence with RL=Rint.
Page 47
Experimental set-up
41
Figure 3.12 Electrical circuit considered in the perfomances tests of 2pTER and 3pTER
generators .
Seebeck voltage, VAB is obtained multiplying the thermal gradient at which TEs are subjected
(THOT-TCOLD) by the apparent Seebeck coefficient, α’, exhibited by the module (see Eq. III.3).
However, VAB is related to the measured electrical potential through the equation Eq. III.4. Once
noted the internal resistance of the module and the number of thermocouples constituting it, by
measuring voltage and current as indicated it is possible to evaluate the Seebeck coefficient α of the
material constituting TEs (see Eq. III.5).
( )2
intL
COLDHOT
L
2
LDCELRR
TT'RiRiVP
+
−⋅α⋅=⋅=⋅= Eq. III.1
( )
intL
COLDHOT
RR
TT'i
+
−⋅α= Eq. III.2
( ) ABCOLDHOT VTT' =−⋅α Eq. III.3
( ) DCintCOLDHOT ViRTT' =⋅−−⋅α Eq. III.4
( ) nTT
ViR
COLDHOT
DCint
⋅−
+⋅=α Eq. III.5
VDC (measured voltage)
i (measured current)
VAB (Seebeck voltage)
THOT (temperature of the hot junction of thermoelectric)
TCOLD (temperature of the hot junction of thermoelectric)
α’ (apparent Seebeck coefficient)
Page 48
Catalytic microcombustion for portable electric power generation
42
α (Seebeck coefficient)
n (number of thermocouples constituting thermeoelectric)
Page 49
Combustion tests under diluted conditions
43
CHAPTER 4
COMBUSTION TESTS UNDER DILUTED CONDITIONS
Combustion of methane, hydrogen and their mixtures has been carried out in a novel catalytic
micro-structured reactors developed in this Ph. D. research activity, as described in the previous
chapter, and tested in the SSR.
Supported perovskite based catalysts have been considered and the effect of doping perovskite
with a little amount of platinum has been taken into account and, thus, Pt/Al2O3 catalyst has been
prepared and tested as reference material too.
The effectiveness of the deposition method in transferring the catalytic properties to the platelet
shaped substrates has to be preliminarily verified. At this proposal, the activity of the catalytic
platelets has been compared with that of the powder constituting the deposed layer. As a
consequence, the first paragraph of this chapter is devoted to the results of combustion tests carried
out on powder samples in PwQR.
In a structured catalytic reactor, and in particular in a micro-combustor, the proceeding of
heterogeneous reaction may be strongly affected by fluid dynamics issues. In particular, flow
distribution may be critical because of gas by-passing and channeling as well as the presence of
dead volumes in the reactor, resulting in a loss of combustor efficiency. Moreover fuel conversion
may be transport limited thus not allowing an efficient use of the catalyst, especially in a fully
developed laminar fluid dynamics regime, typical in micro-combustion.
As described in the previous chapter, the SSR reactor design has included specific solution to
allow a good flow distribution. In particular SiC carbide foams inserted before and after the plates
are determinant in minimizing gas channeling and stagnation phenomena. Furthermore, the high
precision adopted in the realization of the catalytic micro reactor allows to suppress any gas path
alternative to that through the combustion chamber, actually avoiding gas by-passing.
However, a specific study is needed for the comprehension of eventual transport limitation on
fuel conversion. As demonstrated in the following, the proposed micro-structured reactor is an
effective tool to carry out such a study because of the total uncoupling of the reactive phenomena
with fluid dynamics. In fact, such a reactor gives the possibility to perform combustion tests with
varying the characteristic properties of transport maintaining unaltered the catalysis. In the specific,
Page 50
Catalytic microcombustion for portable electric power generation
44
the height of the combustion chamber is changed by varying the height of the platelet but without
modifying the amount of considered catalyst.
The study on CH4-H2 combustion has been addressed toward the comprehension of hydrogen
effect on methane oxidation rate. Specifically, the chosen operating conditions allow to neglect the
thermal effect and to focalize the attention on eventual chemical synergies occurring in the co-
combustion.
4.1 Operating conditions
Activity tests have been carried out under isothermal and strongly diluted conditions. In such
conditions the power generated by the reaction is not enough to guarantee auto-thermal process and
an external power source is needed to carry out the reaction. On the contrary, the amount of heat
released by the conversion of fuel is almost negligible with respect to the warming power needed
from outside, so that isothermal and controlled conditions could be assured. As already reported in
the previous chapter, electric ovens are employed to heat the catalytic combustor until a specific
reaction temperature. Specifically, activity tests have been performed at a maximum temperature
equal to 800°C.
Unless otherwise noted, as prepared catalysts are pre-treated at 800°C for 3h before being tested.
Hydrogen and methane oxidation tests have been carried out at different flow rates in the range
15-70 slph. Fuel percentage in the mixture was 0.25vol% in the case of methane and 1vol% in the
case of hydrogen (in both the cases fuel concentration is below the LFL that is 4 and 5%
respectively foe H2 and CH4 combustion), thus approximately supplying the same overall heating
value of 80 J·Nl-1
despite of the fuel. Oxygen content is four times higher than the stoichiometric
value required for complete combustion occurrence, corresponding to an equivalence ratio
(Φ=0.25).
In Table IV.1. compositions of the fuel mixtures considered for H2 and CH4 combustion tests are
reported.
Concerning the study of H2-CH4 mixtures combustion, experiments have been carried out by
varying the H2/CH4 ratio at a total flow rate varying between 15÷70 slph (see Table IV.2 for
details). As it is reported in Table IV.2, Mix1 up to Mix6 are characterized by a growing content of
H2 while leaving the overall calorific value of the fuel constant (80 J·Nl-1
). The molar H2 fraction in
the H2-CH4 mixtures varyies from 0% in Mix1 to 91% in Mix6, corresponding to a maximum
energetic substitution equal to 75% of the total power input. Mix7 and Mix8 are methane free
mixtures and are characterized by a lower overall heating, respectively equal to 33 and 45 J·Nl-1
.
Hydrogen and methane are fed in very diluted conditions, below the LFL of the considered
Page 51
Combustion tests under diluted conditions
45
mixtures. Moreover, oxygen concentration is maintained constant and equal to 2vol%, resulting in
excess with respect to fuel oxidation stoichiometry. In Mix7 and Mix8 hydrogen concentration is
the same as that respectively present in Mix3 and Mix4; methane free mixtures are tested in order to
have a reference of hydrogen combustion occurring at the same partial pressure as in H2-CH4
mixtures.
Table IV.1 Operating conditions considered in the case of H2 and CH4 combustion tests
H2 combustion,
%
CH4 combustion,
%
H2 1.00 0
CH4 0 0.25
O2 2.00 2.00
N2 97.00 97.75
Total Flow Rate = 15÷÷÷÷70 slph
Table IV.2 Hydrogen substitution and operating conditions considered in H2-CH4 mixtures
combustion tests.
Molar composition H2 in H2-CH4, %
CH4, % H2, % H2/CH4 Ratio Molar Energetic
Mix 1 0.25 0 0 0 0
Mix 2 0.21 0.21 1.0 50 23
Mix 3 0.17 0.34 2.0 67 38
Mix 4 0.14 0.46 3.3 77 50
Mix 5 0.11 0.55 5.0 83 60
Mix 6 0.07 0.68 10.0 91 75
Mix 7 0 0.34 - 100 100
Mix 8 0 0.46 - 100 100
Total Flow Rate = 15÷÷÷÷70 slph
Page 52
Catalytic microcombustion for portable electric power generation
46
4.2 Methane combustion tests on powder catalysts
Catalytic combustion tests of methane have been carried out in PwQR packed bed reactor on
PwLM sample. As already reported, PwLM is a LaMnO3/La-Al2O3 based catalyst characterized by
a perovskite loading equal to 20wt% with respect to the total weight; moreover, it is constituted by
the particles forming the catalytic layer deposed on the platelets.
A total flow rate equal to 40 slph and 0.2 g of catalyst have been employed in the activity tests.
Considering a particle size distribution ranging between 200 and 400 µm, it resulted in a catalytic
bed height approximately equal to 0.6 cm.
A packed bed reactor is a system of proven effectiveness in measuring the kinetic constant of an
heterogeneous reaction. For such a reactor, in fact, it is possible to establish operating conditions
such as to neglect any fluids dynamics and transport influence on the proceeding of the catalytic
reaction.
An high enough catalytic bed is needed to neglect flow instability due to the entrance effects.
Actually, the height of the bed considered in this study is reported to be large enough to avoid such
an instability.
On the basis of the previous assumptions, the catalytic bed reactor employed in the present
investigation could be considered as a plug flow reactor, provided that axial dispersion is shown to
be negligible. This assumption is validated by previous assumptions together to the evaluation of
the characteristic Peclet number (Per) of the reactor. Per is calculated starting from the evaluation of
Pep, characteristic of the flow around the single particle.
On the basis of the previously reported operating conditions adopted in the combustion tests and
geometric properties of the PwQR reactor it is possible to determine the following parameters:
mcat (total weight of the catalysts) 0.2g
QTOT (total flow rate) 2.7·10-5
m3·s
-1
TOT
cat
CQ
m=τ (contact time) 7407.4gcat·s·m
-3
<dP> (average particle size) 3·10-4
m
ε (catalytic bed empty fraction) 0.36
L (catalytic bed length) 0.0060m
uL (average gas velocity in the catalytic bed) 1.5m·s-1
A (annular section of the quartz reactor) 5·10-5
m2
ρapp (apparent density of the catalyst) 1.8g·cm-3
Page 53
Combustion tests under diluted conditions
47
Gas velocity and total flow rate are calculated assuming the minimum temperature taken into
account in the experiments (450°C).
Below the properties of reactive mixture assumed to be air are reported considering the same
temperature reference.
µ (air viscosity) 3.6·10-5
Pa·s
ρ (air density) 0.47 Kg·m-3
DCH4 (diffusivity of CH4 in air, Perry and Green, 1997) 1.0·10-4
m2·s
-1
It is possible to calculate a Reynolds number (Re) and a Schmidt number equal to:
6µ
ρudRe LP ≅
⋅⋅><=
8.0D
Sc4CH
≅⋅ρ
µ=
Based on these parameters it is possible to evaluate Pep (Levenspiel, 1962):
2D
udPe LP
p ≅⋅><
=
Finally, Per evaluation follows
40d
LPe
D
LuPe
P
PLr ≅
><
⋅=
⋅=
Such a Per value is high enough to validate the hypothesis of plug flow reactor for the catalytic
bed considered in the activity tests.
According to the reported assumptions, the PwQR packed bed reactor is well represented by the
equation Eq. IV.1, that is a mass balance on the fuel (methane) under the hypothesis of plug flow
reactor. Methane oxidation reaction in fact, may be assumed as a single irreversible reactive step,
AB where the kinetics are described by a simple power rate law thus considering unitary the
reaction order with respect to the methane and zero to the oxygen. Concerning CH4 reaction order,
the first order assumption is in agreement with many studies reported in literature performed on Pt
and perovskite based catalysts (Arai et al. 1986, Cimino et al. 2000). As regards the reaction order
Page 54
Catalytic microcombustion for portable electric power generation
48
of the oxygen it is reported that is slightly higher than zero (Arai et al. 1986, Cimino et al., 2000).
However, the oxygen excess considered in the reaction tests allows to neglect the effect on the
reaction rate of the variation of the O2 concentration respect to that of CH4. After all, the reported
assumptions on the reaction order are reasonably valid especially when the aim is a preliminary
evaluation of the kinetic constant.
cekckrdt
dcTR
E
0app ⋅⋅−=⋅−=−= ⋅−
Eq. IV.1
( )
−−=
⋅−=
C
0τ
x1lnln
TR
Elnklnk Eq. IV.2
c (methane concentration) mol·m-3
c0 (initial methane concentration) mol·m-3
k (apparent kinetic constant for unit of catalyst amount) m3·s
-1·gcat
-1
rapp (apparent reaction rate) mol·m-3·s
-1
k0 (pre-exponential factor) m3·s
-1·gcat
-1
E (apparent activation energy) cal·mol-1
x (fuel conversion) mol/mol
Among the reported parameters, rapp is the apparent reaction rate of the process, generally
derived on the basis of laboratory experiments. Such a parameter depends on transport effects and it
is equivalent to the intrinsic reaction rate only in a pure kinetic controlled regime. The combined
effect on the effective reaction rate of interphase and interparticle diffusion is reduced in a catalyst
efficiency, ηC, given by the ratio between the apparent and the intrinsic reaction rate (Ertl et al.,
1997).
b
app
extporeCr
rηηη =⋅= Eq. IV.3
s
app
porer
rη = Eq. IV.4
b
s
extr
rη = Eq. IV.5
Page 55
Combustion tests under diluted conditions
49
In the equations Eq. IV.3 and IV.5, rb is the reaction rate that is obtained if the reactant
concentration on the catalyst corresponds to that in the bulk. Nevertheless, a concentration drop
occurs because of the resistance to mass transport in the gas phase and in the catalyst pores. In a
kinetic controlled regime transport rate is much higher compared to that of the intrinsic reaction and
the catalyst efficiency my be assumed unitary.
The equation Eq. IV.1 is solved taking into account the initial condition on methane
concentration, c(t=0)=c0; the solution is represented by the equation Eq. IV.2 that is the Arrhenius
plot and provides the kinetic constant estimated from the experimental measurements as a function
of the fuel conversion (and hence, of the experimental conditions adopted). From equation Eq. IV.2
it follows the characteristic time of the packed bed reactor, the contact time, defined as the amount
of catalyst divided by the total flow rate. Its unit is not properly a time, but it can be possible to
have the residence time (in the contact with catalysts) by multiplying it for an apparent packed bed
density.
In Figure 4.1 the results of methane combustion tests performed on PwLM are reported while in
Table IV.3 some extrapolated experimental data are resumed.
In Figure 4.1a, the fuel conversion is reported as a function of the temperature measured inside
the catalytic bed. The threshold temperature of PwLM catalyst for CH4 oxidation, defined as the
temperature at which 10% of fuel is converted, lies at about 565°C; fuel conversion is 95% at
750°C, while it is expected to be 100% at 800°C. In the investigated conditions, the presence of CO
as by-product of CH4 oxidation is not detected being methane completely converted to CO2. In
Figure 4.1 b the kinetic constant of methane combustion over PwLM catalyst is shown in terms of
the Arrhenius plot; in Table IV.3 the values of the activation energy and the pre-exponential factor
as well as the kinetic constant at 800°C are resumed. It is worth mentioning that the detected
activation energy (31.8 kcal·mol-1
) is rather high respect to the typical values, comprised between
23 e 26 Kcal/mol, reported in the case of methane combustion on non supported perovskite (Cimino
et al., 2000, Seiyama, 1992, Kirchnerova et al., 2002). This experimental evidence points out that γ-
Al2O3 support affects the kinetic mechanism of methane combustion on perovskite probably
because of an alteration in the morphology of the active phase due to the interactions occurring
between manganese and alumina (Choudhary et al., 2002, Cimino et al., 2000, Arnone et al., 1998).
Nevertheless, a different behaviour is observed by testing, under the same operating conditions,
LM(10, 20, 30) constituted by the same LaMnO3/La-γ-Al2O3 active phase as PwLM but not
representative of the platelet catalyst (in such a case supported perovskites prepared by
impregnating stabilized γ-Al2O3 is not further mixed to Boehmite and nitric acid but directly
calcined, see Chapter 2 for details). In particular, the activation energy shown by LM(10, 20, 30)
Page 56
Catalytic microcombustion for portable electric power generation
50
samples is significantly lower than that measured for PwLM (see Table IV. 3) and it is in agreement
with that reported in literature for both supported and unsupported perovskites (Cimino et al., 2000,
Seiyama, 1992, Arnone et al., 1998, Choudhary et al., 2002). As a result, catalytic properties of
perovskites are altered in the case of PwLM catalyst. Based on this evidence, it is possible to
conclude that eventual interactions occurring between manganese and alumina in LaMnO3/La-γ-
Al2O3 are exalted by structuring the catalyst.
Temperature, °C
400 500 600 700 800 900
CH
4 C
on
ve
rsio
n,
%
0
10
20
30
40
50
60
70
80
90
100 (a)
1000/T, K-1
0.9 1.0 1.1 1.2
Ln
(k)
3
4
5
6
7
8
(b)
Figure 4.1 CH4 combustion test performed on PwLM catalyst (contact time τc = 18 g·s·Nl-1
). (a)
Fuel conversion as a function of the temperature measured in the catalytic bed. (b) Arrhenius plot.
In table IV.3 it is also pointed out that the kinetic constant evaluated at 800°C shown by LM(10,
20, 30) samples is unchanged and it is significantly lower that that measured for PwLM. This result
is due to the different ageing treatments performed on the catalysts. Specifically a more severe
Page 57
Combustion tests under diluted conditions
51
treatment is considered in the case of LM(10, 20, 30) samples that are exposed to 900°C for three
hours.
Table IV.3 CH4 combustion test performed on PwLM and LM(10, 20, 30)catalyst. Resume of
some extrapolated experimental data.
Catalyst Code Contact time
gcat·s·Nl-1
E
Kcal·mol-1
k0
Nl·s-1·gcat
-1
T10%
°C
K(800°C)
mmol·s-1·gcat
-1
PwLM 18.00 31.8 3.48·106
565 12
LM10 18.00 26.4 1.4·105
574 6
LM20 18.00 23.6 3.2·104 550 6
LM30 18.00 23.0 2.3·104 550 5
Once the apparent kinetic constant has been derived experimentally for PwLM sample, it is
possible to evaluate the catalyst efficiency thus estimating the transport effects. In particular, ηC is
calculated following the treatment reported in Eartl et al, 1997. Based on this method catalyst
efficiency is evaluated from Weisez and mass transfer Biot modules, respectively ψ and Bi,m in the
equations Eq. IV.6 and IV.7. The former is defined as the ratio of the effective pseudohomogeneous
reaction rate, rapp, versus the maximum effective rate of diffusion at the external pellet surface, thus
including the effect of pore diffusion on the reaction rate. Physically, the Weisz modulus can be
looked at as the ratio of the time constants of diffusion and reaction. The effective diffusivity, Deff,
is derived from molecular diffusivity of methane in air, DCH4, by multiplying and dividing it
respectively by the porosity and tortuosity factors of the catalyst particles. Specifically, εP=0.6 and
τ=3 are assumed.
Concerning Bi,m, it is interpreted as the ratio of internal to external transport resistance
(interparticle diffusion versus interphase diffusion) thus including the effect of film diffusion on the
reaction rate. Diffusion velocity, KD, is evaluated from jD that is estimated through the correlation,
jD=0.91·Re-0.51
(Perry and Green, 1997).
eff
2
Papp
D4
dε)(1ρkΨ
⋅
><⋅−⋅⋅= Eq. IV.6
eff
PD
D2
dKmBi,
⋅
><⋅= Eq. IV.7
Page 58
Catalytic microcombustion for portable electric power generation
52
τ
εDD
PCH
eff4
⋅= (effective diffusivity)
εP=0.6 (porosity factor of particle)
τ=3 (tortuosity factor of the particle)
KD (diffusion velocity)
( ) 3/2
L
DD Sc
u
Kj ⋅= (Colburn factor for mass transfer)
In Table IV.4 the values of ηC, ψ and Bi,m are reported as a function of the temperature. These
modules are calculated assuming a particle diameters, <dP>=3·10-4
m, characteristic of PwLM
catalyst. Moreover, in order to understand the effect of such a parameter on catalysts efficiency, a
<dP>=1·10-4
m is considered too.
Considering the higher particle diameter, at T=700°C an unitary catalyst efficiency is calculated
thus pointing out a kinetic controlled regime. By increasing the temperature a decrease in the
catalyst efficiency is observed. In particular, ηC is 0.95 and 0.7 at 725°C and 800°C respectively.
Such a trend of ηC is expected because the reaction rate increases exponentially with the
temperature while transport parameters are roughly unchanged. Interphase diffusion velocity is
higher than interparticle one even if the same order of magnitude is calculated (see Bi,m values in
Table IV.4).
In the range of investigated temperature (450÷750°C) PwLM catalyst efficiency is sufficiently
high to neglect any transport effect on the reaction rate. On the contrary, beyond T=750°C the mass
transfer become determinant and a mixed kinetic and transport controlled regime occurs.
However, in the case of a lower particle diameter, <dP>=1·10-4
m, an unitary efficiency is
calculated in a wider range of temperature and in particular ηC=1 results at 800°C. Actually, a
decrease in <dP> involves an increase in the mass transfer rate compared to that of the chemical
reaction.
It is worth mentioning that <dP>=1·10-4
m is approximately the thickness of the catalytic layer
deposed on a substrate. As a consequence, a kinetic controlled regime is expected in the case of
oxidation test on catalytic platelets assuming that reaction rate is maintained the same as that of
unstructured catalyst.
Page 59
Combustion tests under diluted conditions
53
Table IV.4 Combustion test on PwLM: ηC, ψ and Bi,m are reported as a function of the
temperature
<dP>=3·10-4
m <dP>=1·10-4
m Temperature, °C
ηC ψ Bi,m ηC ψ Bi,m
700 1 0.18 4.46 1 0.02 2.60
725 0.95 0.26 4.43 1 0.03 2.58
750 0.85 0.37 4.39 1 0.04 2.56
775 0.80 0.51 4.35 1 0.06 2.54
800 0.70 0.70 4.32 1 0.08 2.52
4.3 Combustion tests on platelets catalysts
Catalytic combustion tests of methane, hydrogen and mixture between them have been carried
out in SSR reactor on catalytic platelets. For such a peculiar system, a preliminary study is needed
to understand any eventual limitations to fuel conversion due to fluid dynamics and transport issues.
Before presenting the results of an experimental campaign, a mathematical description of the SSR
reactor is also reported with the aim to understand and assess the main phenomena involved in the
micro combustor operation.
As already reported, in SSR structured reactor gas flows in the channel, tangentially with respect
to the catalytic surface. In order to have a good contact between the reactants and the catalyst, the
Peclet number, defined as the ratio between the residence and the diffusion time, needs to be much
higher than unity. Moreover, in order to avoid a transport limited regime the diffusion time has to
be much lower that the reaction time.
Reactor geometry, gas properties, combustion test operating conditions, parameters and non
dimensional groups employed are reported below.
Geometrical reactor properties:
W (platelet width) 0.015 m
L (reactor length) 0.0300 m
δ (combustion chamber height) 0.0010 m
)(244
δ
δδ
+⋅
⋅⋅=⋅=
W
W
erWetPerimet
onCrossSectiH (equivalent diameter) 0.0019 m
δW (washcoat thickness) 5·10-5
m
Page 60
Catalytic microcombustion for portable electric power generation
54
Considered operating conditions (reference temperature is equal to 800°C):
QTOT=4.0·10-5
Nm3·s
-1
uL=2.7 m·s-1
Gas properties values (reference temperature is equal to 800°C):
ρ=0.32 Kg·m-3
µ=4.3·10-5
Pa·s
DCH4=1.9·10-4
m2·s
-1
Parameters and variables:
kb (intrinsic kinetic constant for unit of catalyst amount) m3·s
-1·gcat
-1
kb’ (intrinsic kinetic constant for unit of catalytic surface) m·s-1
L
Ru
L=τ (residence time) s
cS (fuel concentration in the solid phase) mol·m-3
Non dimensional groups:
Re (Reynolds number) ρ·v·δH/µ
Sc (Schmidt number) µ/(ρ·DCH4)
Sh (Sherwood number) KD·δH/DCH4
Pe (Peclet number) (L/uL)/(δH/KD)
Gas flows through the SiC foams and enters the combustion chamber with a Re number varying
in the range of 35÷40. At the entrance section the velocity profile is flat and a certain reactor length
is required to allows the developing of the laminar regime, as represented in Figure 4.2. The
hydrodynamic entrance length Lent, under the hypothesis of isothermal and incompressible flow, is
given by the equation Eq. IV. 8 (Hayes and Kolaczkowski, 1997) and is equal to 2.4 mm.
Considering that the reactor is 30mm long, more than 90% of the total combustor length is
characterized by a fully developed laminar flow. On the basis of this estimation, the flow is
considered laminar along the whole channel.
Page 61
Combustion tests under diluted conditions
55
z
Hydrodynamicentrance region
Fully developedregion
LLentent
δV(x,z)
x
Figure 4.2 Velocity profile development in the entrance of SSR micro-structured reactor.
Lent = 0.035·δH·Re Eq. IV. 8
In the conditions of fully developed laminar regime, it is possible to evaluate a Sh number
approximately equal to 4 (Bird et al., 1979). This value of Sh number together with the values of
diffusivity and equivalent diameter previously reported supply a diffusion velocity KD = 0.41 m·s-1
.
Once evaluated the diffusion velocity, it is possible to calculate the Peclet number. In the specific, a
Pe ≈ 30 is estimated, a value enough high to allow considering the reactants diffusion on the
catalytic substrate satisfactorily efficient to avoid gas exiting from the reactor without contacting
the catalyst.
The reactor behaviour can be hence described through a one dimensional model and more
specifically through an heterogeneous model (Hayes and Kolaczkowski, 1997). According to this
model, no transverse concentration gradient occurs in the gas phase. Species concentration shows a
discontinuity at the gas-solid interface thus providing the driving force for the reactants transport on
the catalyst. Separate mole balance is written for the solid which is coupled with gas phase
equations. Reactants diffusion from the gas bulk to the catalytic surface is described through KD
(that is a diffusion velocity in the gas phase). This is coherent with the hypothesis of one
dimensional model not including the solution of species mass balance on the transverse direction.
The equations Eq. IV.9-11 represent the mass balance in the gas phase. Basically, considering
the elemental reactor volume represented by the red broken line in Figure 4.3, the difference
between the incoming and outcoming moles must be equal to the moles transported to the catalyst
Page 62
Catalytic microcombustion for portable electric power generation
56
surface. In Eq. IV. 9 the mass balance is reported in terms of differential equation with the
corresponding boundary condition.
[Moles in]- [Moles out]- [Moles transported to catalyst surface]=0 Eq. IV. 9
Q·[c(z)-c(z+dz)]-KD·(c-cS)·W·dz=0 Eq. IV. 10
==
=−⋅⋅−⋅
0
SD
c0)c(z
0)c(cWKdz
dcQ
Eq. IV. 11
zCatalyst
dz
c(z)
cs(z)
c(z+dz)Gas phase
δ
Figure 4.3 SSR: approximations of the heterogeneous model. No transverse profile of
concentration in the gas phase. The gas solid interface is a discontinuity.
The equations Eq. IV.12-14 represent the mass balance in the solid phase. Basically, considering
an elemental catalytic surface, it is assumed that the moles transported to the catalyst surface react
following a first order reaction rate. In Eq. IV. 14 the value of the fuel concentration on the catalytic
surface, cS, is calculated as a function of the fuel concentration in the gas phase, c.
[Moles reacted on the catalyst]- [Moles transported to catalyst surface]=0 Eq. IV. 12
kb’·cS(z)·W·dz - KD·(c-cS)·W·dz=0 Eq. IV. 13
'
bD
D
SkK
cKc
+
⋅= Eq. IV. 14
Page 63
Combustion tests under diluted conditions
57
Substituting the equation Eq.IV.14 into the Eq. IV.11, it is possible to obtain a differential
equation with the gas phase concentration, c, as the only unknown. The Eq. IV.15 represents the
solution of the differential problem and provides the fuel conversion at the exit of the reactor.
⋅⋅
+
⋅−−=
Q
LW
kK
kKexp1x
'
bD
'
bD Eq. IV. 15
Assuming KD >> kb’, that is what happens under a kinetic regime, the solution of the mass
balance equation is given by Eq. IV.16, which has been given in terms of kb’. By multiplying and
dividing the exponential term by both the thickness and the apparent density of the catalytic layer, it
is possible to obtain the solution in terms of kb. It is worth mentioning that fuel conversion, in the
case of a kinetic regime, does not depend on the geometry of the reactor and particularly on the
height of the combustion chamber, but should depend only on the intrinsic activity of the catalyst
and contact time τC = mcat/Q.
⋅−−=
⋅
⋅−−=
⋅⋅−−=
Q
mk
Q
mk
Q
LWkx cat
b
cat
appW
b
b exp1exp1exp1'
'
ρδ Eq. IV. 16
On the other hand, looking at the case characterized by KD << kb’, that is the transport-limited
regime, the solution of the mass balance equation is given by Eq. IV.17. Multiplying and dividing
the exponential term by the height of the combustion chamber it is possible to obtain the solution in
terms of the residence time. Moreover, expressing KD as a function of the Sh number, it follows the
dependence of fuel conversion on the height of the combustion chamber.
τ⋅
δ
⋅−−=
⋅⋅
δ
⋅−−=
⋅⋅−−= R2
4CH4CH
D
DShexp1
Q
LWDShexp1
Q
LWKexp1x Eq. IV. 17
The reported analysis reveals that fuel conversion depends on the height of the combustion
chamber only in a transport limited or mixed, kinetic and transport limited, regimes. In the case of a
pure kinetic regime no dependence of the fuel conversion on the channel height should be detected.
Consequently, the experimental proof of the absence of any transport restriction on fuel
conversion in the isothermal tests of CH4 oxidation has been performed by measuring fuel
conversion on a fixed catalytic substrate with varying the height of the combustion chamber and
maintaining the same flow rate. In particular, reaction tests are performed at 40 slph increasing the
Page 64
Catalytic microcombustion for portable electric power generation
58
channel gap from 1 to 4 mm. F2LM catalytic platelet has been considered for such an analysis,
which is 2mm thick, so providing, as reported in Table II.3, a combustion chamber 4 mm high. In
order to change the height of the channel some wedges are used in order to increase the platelet
thickness until a value of 5 mm. It follows an unchanged contact time, equal to 1.26 gcat·s·Nl-1
and a
residence time varying between 11 and 45 ms (evaluated at 800°C). CH4 conversion is reported as a
function of the temperature detected along the reactor. At least three thermocouples, equally spaced
on the reactor length, have been employed in the combustion tests. With varying the position of the
thermocouple, variation in the measured temperature is always ±1°C. Actually, the strong diluted
conditions adopted guarantee an isothermic profile along the reactor despite of the developed
combustion heat. The temperature shown in the presented results is measured at the entrance of the
catalyst. The results, presented in Figure 4.4, show that methane conversion is not affected by the
height of the combustion chamber. This experimental data points out the absence of transport
limitation on fuel conversion, the latter resulting unchanged because of the unchanged contact time.
Temperature, °C
550 600 650 700 750 800 850
Meth
an
e C
on
vers
ion
,%
0
20
40
60
80100
Height 1mm
Height 3mm
Height 4mm
Figure 4.4 Methane combustion tests on Fe2LM in SSR. Fuel conversion at τC=1.26 gcat·s·Nl-1
with varying the combustion chamber height (δ): δ=4mm (red triangles); δ=3mm (black circles);
δ=1mm (blue squares).
4.3.1 Stability of the catalytic layer
The deposition of a well anchored catalytic layer on a substrate is a critical issue. In a
combustion environment, in fact, the integrity of the deposed film is strongly affected by thermal
stresses particularly due to temperature overshoot.
Page 65
Combustion tests under diluted conditions
59
In particular, high temperature operation involves a worsening in catalyst performances mainly
due to chemical and physical deactivation phenomena (sintering, solid-solid interactions; McCarty
et al., 1999, Zwinkels et al., 1999, Cimino et al., 2001). At this proposal, activity has been detected
after several ageing cycles of the sample. In the specific, catalytic substrates have been tested for
methane combustion just prepared and after being treated in air at 800°C for 30h at most. In Figure
4.5 methane conversion on A5LM-2 catalytic platelet is reported as a function of the temperature,
with varying the ageing treatment duration. A slight de-activation of the catalyst is observed in the
first 12h of treatment, as it is expected. Specifically, at 785°C CH4 conversion decreases from 43%,
measured for the “just prepared” catalyst, to 37%, measured for the 12h aged catalyst,
corresponding to a decrease of about 14%. After longer treatment the decreasing in fuel conversion
is no more significant; for example, a further 18h ageing treatment performed on the 12h treated
catalyst involves a methane conversion decrease of only 5%.
Temperature, °C
600 650 700 750 800
CH
4 C
on
ve
rsio
n,
%
0
20
40
60
80
100just prepared
12h treatment
15h treatment
27h treatment
30h treatment
Figure 4.5 Methane combustion tests on A5LM-2 in SSR. Fuel conversion at τC=1.62 gcat·s·Nl-1
with varying the duration of ageing treatment: catalyst just prepare (black circles); treatment 12h
long (red triangles); treatment 15h long (pink squares); treatment 27h long (green hexagons);
treatment 30h long (blue rhombs).
It follows that a 12h treatment is long enough to obtain a catalytic system working in stable
conditions.
Moreover, a worsening in catalyst performances may occur even in consequence of a bad
anchoring of the catalytic film in the substrate. At this proposal, the catalytic substrates have been
Page 66
Catalytic microcombustion for portable electric power generation
60
subjected to mechanical stresses at room temperature in an ultrasonic bath showing a weight loss
lower than 5wt% as regards the layer weight after a 30min long treatment. Moreover, the catalytic
system didn’t show a weight loss after the described ageing cycles thus attesting the good anchoring
of the deposed film in consequence of both mechanical and thermal stresses.
On the basis of these results, each prepared catalytic platelet has been tested after being pre-
treated in air at 800°C for 12h.
In the case of A5LM-2, under stable working conditions of the catalyst, a methane conversion
equal to 44% is detected at 805°C, the maximum investigated temperature. Moreover, T10%, the
temperature at which 10% of fuel is converted, is equal to 680°C. Kinetic parameters are resumed
in Table IV.5 and will be discussed in the following paragraph.
4.3.2 Repeatability of the preparation method
Other preliminary experiments are carried out in order to verify the repeatability of the
preparation method. Activity tests are performed on catalysts provided with the same formulation
and prepared with the same procedure. In the specific, two identical FeCralloy catalytic plates,
F5LM and F5LM-2, and alumina plates, A5LM and A5LM-2, are prepared and tested for methane
combustion at the same conditions. In Figure 4.6 the Arrhenius plots related to the tested catalyst
are reported while in Table IV.5 the main results are resumed. The Arrhenius plots are evaluated
assuming a first order reaction for methane combustion.
Table IV.5 Repeatability of the preparation method: CH4 combustion on F5LM, F5LM-2, A5LM
and A5LM-2. Deviation in the kinetic parameters.
Alumina substrates FeCralloy substrates
A5LM A5LM-2 Deviation, % F5LM F5LM-2 Deviation, %
E, Kcal·mol-1
32.6 29.2 10 26.2 25.5 3
k(800°C), mmol·gcat-1·s
-1 17.0 14.0 16 18.0 19.0 5
The preparation method shows a good repeatability in the case of FeCralloy substrates. In fact,
the deviation in the activation energy and in the kinetic constant measured for F5LM and F5LM-2 is
respectively 3 and 5%.
A worsening in the repeatability of the preparation method is observed for the alumina
substrates. Considering A5LM and A5LM-2 catalysts deviations of about 10% and 16% are
observed respectively in the values of activation energy and in the values of the kinetic constant.
Page 67
Combustion tests under diluted conditions
61
Figure 4.6 Repeatability of the preparation method. (a) CH4 combustion tests on F5LM and
F5LM-2 in SSR. Arrhenius plot related to F5LM-2, τC=1.65 gcat·s·Nl-1
(black circles); F5LM,
τC=1.44 gcat·s·Nl-1
(red triangles). (b) CH4 combustion tests on A5LM and A5LM-2 in SSR.
Arrhenius plot related to A5LM-2, τC=1.62 gcat·s·Nl-1
(pink squares); A5LM, τC=1.71 gcat·s·Nl-1
(green hexagons).
4.3.3 Effect of the substrate on the catalytic activity
Combustion tests of CH4 have been carried out supporting LaMnO3/Al2O3 based catalyst on
different platelets. Moreover, the substrate activity is measured by testing the platelets lacking in the
active phase. The experiments have been performed considering a 1mm high combustion chamber
and at a total flow rate equal to 40 slph. F5LM, F2LM, A5LM and A5 platelets have been tested.
Considering the amount of catalyst deposed on each substrate, the catalysts supply a different
ln(k
)
5
6
7
8
9
F5LM-2F5LM
(a)
1000/T, K-1
0.9 1.0 1.1 1.2
Ln
(k)
5
6
7
8
9
A5LM-2
A5LM
(b)
Page 68
Catalytic microcombustion for portable electric power generation
62
contact time, as it specified in Table IV.6. In the case of FeCralloy catalytic platelets, F5LM is 5
mm thick (see Table II.3) and provides a combustion chamber 1mm high. On the contrary, F2LM is
2mm thick (see Table II.3) and in order to obtain the same combustion chamber height a 3mm thick
wedge is used.
Methane conversion as a function of the temperature and Arrhenius plots are reported for the
different tested substrates respectively in Figure 4.7a and 4.7b. Moreover, the most meaningful
results are resumed in Table IV.6.
Concerning the combustion tests performed on F2LM and A5LM catalysts, CH4 conversion
detected at the maximum temperature is respectively 34 and 53%. Moreover, T10% is higher in the
case of the former catalyst (see Table IV.6); specifically it is 710°C and 680°C respectively for
FeCralloy and alumina catalytic substrates. This outcome is expected because of the lower contact
time resulting in the combustion test on F2LM sample compared to that supplied by A5LM.
Looking at the Arrhenius plot reported in Figure 4.7b, approximately the same activation energy is
obtained for the two catalysts (it is 31.3 and 32.6 Kcal·mol-1
respectively for F2LM and A5LM)
while a slightly higher kinetic constant is calculated for A5LM (see Table IV.6).
Concerning F5LM catalytic platelet, CH4 conversion detected at the maximum temperature is
52% while T10% is 660°C. Furthermore, at low temperature F5LM shows an higher catalytic activity
if compared to that of A5LM and F2LM; this result is pointed out by the significantly lower
activation energy measured for the former sample (approximately 26.2 Kcal·mol-1
). However, at
high temperature F5LM activity is in line with that of A5LM and F2LM. This result is highlighted
by approximately the same kinetic constant calculated at 800°C for F5LM and A5LM (see Table
IV.6). It is worth mentioning the difference of activity between F5LM and F2LM. These samples
are characterized by the same FeCralloy substrate that is 5mm thick in the former case and 2mm in
the latter. The difference in activity is probably due to the different amount of γ-alumina taken out
on the surface of the substrate following up FeCralloy pre-treatment before proceeding to the
catalyst deposition (see Chapter 2). Actually, an higher thickness may result in a bigger amount of
alumina on the substrate surface and, as consequence, in an higher activity of the further deposed
catalytic layer.
In Figure 4.7a the performances of A5, catalyst free α-alumina substrate, are reported. Maximum
CH4 conversion is around 5%, much lower than that provided by the catalytic platelets: the substrate
as well as the reactive paths in the gas phase don’t play a role in the methane conversion under the
investigated conditions.
Page 69
Combustion tests under diluted conditions
63
F5LM
Temperature, °C
550 600 650 700 750 800 850
CH
4 C
on
ve
rsio
n,
%
0
20
40
60
80
100
A5
A5LM
F2LM
(a)
F5LM
1000/T, K-1
0.9 1.0 1.1 1.2
Ln
(k)
3
4
5
6
7
8
9
10
PwLM
A5LM
F2LM
(b)
Figure 4.7 Effect of the substrate on the perovskite catalytic activity in CH4 combustion. (a) CH4
conversion as a function of the temperature on F5LM (blue open triangles), F2LM (pink open
rhombs), A5LM (green open hexagons), and A5 (cyan squares) ;(b)Arrhenius plot related to tests
on F5LM (blue open triangles), F2LM (pink open rhombs), A5LM (green open hexagons), PwLM
(red closed circles).
Page 70
Catalytic microcombustion for portable electric power generation
64
Table IV.6 Effect of the substrate on the perovskite catalytic activity in CH4 combustion.
Resume of some extrapolated experimental data.
In Figure 4.7b and in Table IV.6 the activity of the catalytic plates is compared with that of the
catalytic layer tested in the form of powder, PwLM.
The higher contact time provided by the powder catalyst compared to that of the platelets, allows
a significantly lower T10% in the former case. In the specific, T10% is 565°C for PwLM and is
comprised between 650 and 700°C for the structured catalysts (see Table IV.6).
Comparing the performances of PwLM with those of A5LM, it results a lower kinetic constant
evaluated at 800°C in the case of the powder catalyst while approximately the same activation
energy is detected (see Table IV.6). On the basis of these results, the characteristic feature of the
kinetics of the methane oxidation on perovskite-based catalysts seem to be unchanging by passing
from a powder to a structured material, as it is attested by the same measured energy barrier. On the
contrary, by deposing the catalyst on a substrate a better active phase dispersion is achieved thus
allowing an increase in the number of the active sites available for the reaction to occur, as it is
attested by the reported increase in the pre-exponential factor of the kinetic constant (k0 in Table
IV.6).
Comparing the performances of PwLM with those of FeCralloy catalytic substrates, the previous
considerations are still valid. Nevertheless, the increase in perovskite activity by structuring the
catalyst is observed only in the case of F5LM while it is not significant for F2LM. Actually, as
already discussed, an improving of the catalyst dispersion is obtained considering F5LM because of
the amount of the “taken out” γ-alumina greater and greater with increasing the thickness of the
substrate.
Catalyst code τC
gcat·s·Nl-1
T10%
°C
E
Kcal·mol-1
K0
Nl·s-1·gcat
-1
k(800°C)
mmol·s-1·gcat
-1
F5LM 1.44 660 26.2 3.6·105
18.0
F2LM 1.26 710 31.3 2.9·106 13.0
A5LM 1.71 680 32.6 7.0·106 17.0
A5 0 - - - -
PwLM 18.00 565 31.8 3.5·106 12.0
Page 71
Combustion tests under diluted conditions
65
4.3.4 Reaction order
An evaluation of the reaction order of methane and hydrogen is presented in this paragraph. The
reaction order is obtained by measuring conversion as a function of the initial concentration of the
fuel at a fixed temperature and equivalence ratio. The oxygen is in large excess with respect to the
fuel total oxidation stoichiometric; in such a way O2 concentration is almost constant through the
reactor thus not influencing the reaction rate.
The conversion measurements are fitted by the kinetic law represented by the equation Eq. IV.
19. The latter is obtaining by assuming a reaction rate depending on a power law equation as
regards the fuel concentration (see the equation Eq. IV.18) and a reactor working under isothermal
plug flow conditions. In Eq. IV.19 the fuel conversion (x) is reported as a function of the reaction
order (α), the kinetic constant (k), the contact time (τC) and the initial fuel concentration (c0), the
first two constituting the fitting parameters while the other the input parameters.
α
app ckr ⋅⋅= appρ Eq. IV. 18
( )[ ] αα τα −− ⋅⋅−⋅−−= 1
11
0 111 Ckcx Eq. IV. 19
The reaction order of methane total oxidation is evaluated in the case of LaMnO3/Al2O3 based
catalyst. In Figure 4.8 it is reported CH4 conversion on A5LM-2 as a function of the initial fuel
concentration, the latter being comprised between 4.0·10-5
and 2.0·10-4
M. Experiments are carried
out at two temperatures, 785°C and 685°C and at an equivalence ratio Φ = 0.2. The conversion
measurements are fitted by means of the previously specified regression law (Eq. IV.19); the
resulted fitting parameters are reported in Table IV.7. Methane conversion decreases with
increasing the initial fuel concentration, this behaviour being due to a less than linear dependence of
the reaction kinetics on CH4 concentration. The methane reaction order is estimated, in fact, at
approximately 0.8 at 685°C and 0.9 at 785°C. These values are very close to the reaction order
equal to 0.84 reported by Cimino et al. (2000) for CH4 oxidation on the same LaMnO3/Al2O3 based
catalyst. These results are also useful to weigh the error made by consider a first order dependence
for methane combustion on perovskite; actually, such an assumption could be considered
acceptable, depending on the context and the precision requested. Moreover, as already reported, a
first order rate dependence on methane has been also claimed even in the case of Pt based catalysts
(Arai et al. 1986), so that it follows that in the present study a first order as regard the fuel has been
assumed for the methane combustion independently on the catalyst.
Page 72
Catalytic microcombustion for portable electric power generation
66
The reaction order of hydrogen oxidation is evaluated in the case of Pt-LaMnO3/Al2O3 based
catalyst. In Figure 4.9 H2 conversion on A5Pt1LM is reported as a function of the initial fuel
concentration and the contact time, respectively variable in the ranges of 5·10-5
< c0 < 4·10-4
M and
1.65 < τC < 2.88 gcat·s·Nl-1
. Experiments are carried out at 147°C and at an equivalence ratio Φ =
0.24. The fitting parameters obtained from the regression are reported in Table IV.7. As it has been
observed in the case of methane combustion, hydrogen conversion decreases with increasing the
initial fuel concentration, resulting in a less than linear dependence of the reaction kinetics on H2
concentration. In the specific, the measured hydrogen reaction order is approximately 0.73. On the
basis of this result, the assumption of a first reaction order as regards fuel concentration for H2
combustion on Pt-LaMnO3/γ-Al2O3 is a reasonable hypothesis too, especially considering that the
aim of this study is a rough evaluation of the activity shown by different catalysts in order to
compare their performances. A first order rate dependence has been considered in the present study
even in the case of H2 combustion on Pt/γ-Al2O3 catalyst, assuming that the presence of perovskite
does not involve a significant change in the mechanism of hydrogen combustion on platinum.
Moreover, a first order kinetics is kept even on unpromoted perovskite catalysts: in such a case, in
fact, a reaction order of 0.8÷1 is reported in literature (Cimino et al., 2003)
C0, M
0.0 6.0e-5 1.2e-4 1.8e-4
CH
4 C
on
ve
rsio
n,
%
0
10
20
30
40
60
80
100
T=785°C
T=685°C
Figure 4.8 Methane combustion on A5LM-2 catalyst in SSR. Fuel conversion at τC=1.62
gcat·s·Nl-1
and Φ=0.2 as a function of initial fuel concentration with varying the temperature.
T=685°C (red triangles); T=785°C (black circles).
Page 73
Combustion tests under diluted conditions
67
Table IV.7 Kinetic constants and fuel reaction order resulting from the regression. Methane
combustion on A5LM-2 catalyst in SSR at τC=1.62 gcat·s·Nl-1
. Hydrogen combustion on A5Pt1LM
catalyst in SSR at 1.65 <τC< 2.88 gcat·s·Nl-1
: kinetic constant and H2 reaction order resulting from
the regression.
Temperature, °C αααα k, lαααα·mol
1-αααα·s
-1·gcat
-1
CH4 Combustion
685 0.78 8·10-3
785 0.89 0.102
H2 Combustion
147 0.73 1.66
QTOT
=40slph
C0, M
0 1e-4 2e-4 3e-4 4e-4 5e-4
H2 C
on
vers
ion
, %
0
10
20
30
40
60
80
100
QTOT
=60slphQTOT
=70slph
Figure 4.9 Hydrogen combustion on A5Pt1LM catalyst in SSR. Fuel conversion measured at
147°C and Φ=0.24 as a function of initial fuel concentration with varying the flow rate. Total flow
rate equal to 40slph and τC=2.88 gcat·s·Nl-1
(black circles); total flow rate equal to 60slph and
τC=1.92 gcat·s·Nl-1
(red triangles); total flow rate equal to 70slph and τC=1.65 gcat·s·Nl-1
(blue
squares).
4.3.5 Combustion of CH4: effect of the active phase
Different γ-alumina supported active phases are tested in the methane combustion. In particular,
perovskite, platinum and the phase constituted by their mixture are taken into consideration with the
Page 74
Catalytic microcombustion for portable electric power generation
68
aim of accurately studying the effect of the presence of platinum in the perovskite structure on the
measured combustion rate. At this proposal, the activity of F5LM is compared with that of
F5Pt1LM and F5Pt1, tested under the same operating conditions. Combustion tests have been
carried out considering a fuel mixture total flow rate of 40slph and with a combustion chamber
1mm high. The results are reported in Figure 4.10a and b respectively in terms of fuel conversion
and selectivity to CO as a function of the temperature; in Figure 4.11 the Arrhenius plot
corresponding to the tested samples are reported while in Table IV.8 the most meaningful results
are resumed.
Comparing F5LM and F5Pt1LM performances, it is clearly shown that adding platinum to the
perovskite structure is not effective in enhancing catalytic performances. On the contrary, the Pt
doped perovskite gives rise to a worsening in the unpromoted phase activity. This is made evident
considering the lower T10% shown by F5LM if compared to that provided by F5Pt1LM despite of
the lower contact time presented by the former catalyst (see Figure 4.10a and Table IV.8). Also,
perovskite catalyst presents an higher kinetic constant due to the lower activation energy and the
higher pre-exponential factor (see Figure 4.11 and Table IV.8). The worsening in LaMnO3 activity
because of Pt doping may be due to the decrease in the catalyst specific surface caused by the co-
presence of the noble metal and perovskite in the γ-alumina pores (see Chapter 2). The observed
results are in line with data reported by Giebeler et al. (2007) in a recent study on methane
oxidation on Pt, Pd, Rh promoted LaMnO3 catalysts. In particular, the insignificant role of noble
metals in enhancing perovskite activity was traced back to the particular morphology of the mixed
phase catalyst in which Pt, Pd and Rh were incorporated in LaMnO3 lattice rather than forming
another phase on the catalyst surface.
Moreover, the ineffectiveness of adding Pt to LaMnO3 in enhancing catalytic performances is
expected because of the lower activity of the noble metal in methane combustion if compared with
that of the perovskite. Actually, F5Pt1 is characterized by the highest T10% (T10% = 720°C where it
is 660°C for F5LM and 675 for F5Pt1LM). Moreover the kinetic constant calculated at 800°C is
approximately the half of that observed for the perovskite based catalysts (see Table IV.8).
Finally, the following scale of activity is observed in methane combustion: LaMnO3 > Pt-
LaMnO3 > Pt.
In Figure 4.10b it is shown the selectivity to CO measured for the different catalyst. Generally
speaking, at 800°C the selectivity to CO is maximum 5%, corresponding to a maximum carbon
monoxide production equal to 70ppm. However, it is shown that F5Pt1 catalyst guarantees a lower
selectivity to CO if compared to that provided by F5LM. Moreover, F5Pt1LM shows a selectivity to
CO intermediate between the values obtained in the case of F5LM and F5Pt1 catalysts. These
Page 75
Combustion tests under diluted conditions
69
results indicate that, considering CO oxidation reaction, platinum based catalysts present an higher
activity than perovskite; consequently, promoting LaMnO3 structure with a few amount of Pt is in
this case a practicable road to enhance the catalytic performances, as it is also reported by Giebeler
et al. (2007). However, the lower selectivity to CO shown by F5Pt1 if compared to that of
F5Pt1LM, characterized by the same amount of platinum, indicates that Pt exhibits lower activity
when dispersed on the perovskite matrix rather than only on γ-alumina. This may be due to different
dispersion or migration of Pt inside the perovskite structure, effectively reducing the amount of
noble metal available for reaction.
Figure 4.10 Methane combustion on different active phase. (a) Fuel conversion as a function of
the temperature; (b) Selectivity to CO. F5LM, τC=1.44 gcat·s·Nl-1
(black circles); F5Pt1LM, τC=1.53
gcat·s·Nl-1
(red triangles);F5Pt1, τC=1.49 gcat·s·Nl-1
(blue squares).
F5LM
Temperature, °C
550 600 650 700 750 800 850
Se
lec
tivit
y t
o C
O,
%
0
2
4
6
8
20406080
100
F5Pt1LM
F5Pt1
(b)
F5LMCH
4 C
on
ve
rsio
n,
%
0
20
40
60
80
100
F5Pt1LM
F5Pt1
(a)
Page 76
Catalytic microcombustion for portable electric power generation
70
1000/T, K-1
0.90 0.95 1.00 1.05 1.10
Ln
(k)
6.0
6.5
7.0
7.5
8.0
8.5
9.0
F5LM
F5Pt1LM
F5Pt1
Figure 4.11 Methane combustion on different active phase. Arrhenius plot corresponding to
F5LM, τC=1.44 gcat·s·Nl-1
(black circles); F5Pt1LM, τC=1.53 gcat·s·Nl-1
(red triangles);F5Pt1,
τC=1.49 gcat·s·Nl-1
(blue squares).
Table IV.8 Effect of the active phase on CH4 combustion. Resume of some extrapolated
experimental data.
4.3.6 Combustion of H2: effect of the active phase
As in the case of methane combustion, perovskite, platinum and the phase constituted by their
mixture are tested in hydrogen combustion with the aim to understand the interactions between the
noble metal and LaMnO3 perovskite and the correlations to catalytic activity.
At this proposal, A5LM and F5LM are tested and the resulting activity is compared with that of
F5Pt1LM and F5Pt1. Combustion tests have been carried out considering a fuel mixture total flow
rate of 40slph and with a combustion chamber 1mm high. Hydrogen combustion tests on perovskite
Catalyst code τC
gcat·s·Nl-1
T10%
°C
E
Kcal·mol-1
k0
Nl·s-1·gcat
-1
k(800°C)
mmol·s-1·gcat
-1
F5LM 1.44 660 26.2 3.6·105 18.0
F5Pt1LM 1.53 675 29.0 1.1·106 15.0
F5Pt1 1.49 720 27.7 3.3·105 8.0
Page 77
Combustion tests under diluted conditions
71
are shown in Figure 4.12. Moreover, in that figure the catalytic performances of A5, representative
of the activity of the α-alumina substrate, are shown. In Figure 4.13 the activity of Pt based catalyst
is presented, while in Table IV.9 the most meaningful results are resumed.
F5LM
Temperature, °C
300 400 500 600 700 800 900
H2 C
on
ve
rsio
n,
%
0
10
20
30
40
50
60
70
80
90
100
A5LM
A5
Figure 4.12 Hydrogen combustion tests on perovskite and on “catalyst free” α-alumina
substrate. F5LM, τC=1.44 gcat·s·Nl-1
(red squares); A5LM, τC=1.71 gcat·s·Nl-1
(black circles); A5
(cyan line).
The results reported in Figure 4.12 show that perovskite is characterized by a very low activity in
hydrogen oxidation, as it is evident by considering the high values of T10% found. Considering
A5LM, in fact, T10% is equal to about 600°C; moreover, based on the available data, it is not easy to
derive T10% in the case of F5LM but it is evident that 500°C<T10%<600°C is found. Such a
surprisingly high T10% is in agreement with other studies reported in literature (Cimino et al., 2003).
In fact, employing published kinetics data, under the PFR hypothesis a T10%=500°C is obtained
assuming the same contact time as that considered in A5LM experiments. In Figure 4.12 is also
evident that a total fuel conversion is observed only at about 740°C in the case of both F5LM and
A5LM. Nevertheless, at the specified temperature hydrogen is totally converted even without a
catalyst on the α-alumina substrate, A5. In the case of the catalyst free substrate, in fact, at a
temperature comprised between 670 and 700°C a steep increase in hydrogen conversion from 0 to
100% is observed. Such a temperature level, in fact, is high enough to the occurrence of gas phase
combustion via radical reactions. Moreover, the presence of a substrate may play an significant role
in the activation of the reactive paths in the gas phase by promoting the radical formation. This
Page 78
Catalytic microcombustion for portable electric power generation
72
result reveals that in the case of H2 oxidation on perovskite, it is not possible to neglect the
contribute of combustion in the homogeneous reactions, the latter being determinant in completing
the conversion of the fuel. Such a phenomenon, not ascribed to the presence of a catalyst, is not a
classical flame combustion. Actually, the strong reactants dilution determines a slow flameless
process, known in literature as “mild combustion” (Schefer et al., 2002, Dagaut e Nicolle, 2005,
Sabia et al., 2007, Derudi et al., 2007).
In the case of A5LM, as already observed for A5, a steep increase in fuel conversion from 18 to
81% is observed at a temperature comprised between 637 and 687 °C. At a temperature lower than
637°C H2 is converted only thanks to the presence of catalyst; on the contrary, above this
temperature fuel is mainly converted in the gas phase. For A5LM and A5 temperature at which a
jump in conversion is observed is roughly the same. The threshold temperature at which gas phase
reactive paths occur is very different considering F5LM where perovskite is deposed on FeCralloy
substrate. In this case a jump in fuel conversion from 4 to 46% is observed at a temperature
comprised between 489 and 587°C. The specified range of temperature is strongly lower than that
observed in the case α-alumina substrates are considered thus revealing a more relevant role of
FeCralloy in promoting the radical formation. Notwithstanding in F5LM combustion in the gas
phase starts at a lower temperature, total H2 conversion is observed at the same temperature level
observed in the case of A5 and A5LM. This behaviour is ascribed to the typical slowness of
combustion in “mild” conditions.
Promoting perovskite with a little amount of platinum is very effective in enhancing the catalytic
activity in hydrogen combustion. T10% measured in the case of F5Pt1LM, in fact, is 95°C, more than
5 times lower if compared to that measured for F5LM (see Table IV.9). The much higher activity of
platinum promoted perovskite compared to the unpromoted sample inhibits eventual combustion
paths occurring in the gas phase.
From the comparison of the catalytic performances of F5Pt1LM and F5Pt1 (reported in Figure
4.13 and in Table IV.9), it results that Pt/γ-Al2O3 shows a higher activity. This is made clear by
comparing the value of T10% measured in the case of F5Pt1LM and F51Pt, respectively equal to
95°C and 65°C (see Table IV.9). Moreover, Pt/γ-Al2O3 provides a lower activation energy and an
higher kinetic constant calculated at 200°C (see Table IV.9). The lower activity shown by F5Pt1LM
if compared to that of F5Pt1, despite of the same amount of noble metal present on the two different
catalysts, as already described may be due to the different dispersion or migration of Pt inside the
perovskite structure determining a decrease in the amount of noble metal available for the reaction.
Moreover, such a result may be further explained by considering the lower specific surface area
exhibited by F5Pt1LM compared to that of F5Pt1 (see Chapter 2).
Page 79
Combustion tests under diluted conditions
73
Finally, the following scale of activity is observed in hydrogen combustion: Pt > Pt-LaMnO3>
LaMnO3, namely exactly the reverse one compared with methane oxidation.
Temperature, °C
50 100 150 200 250 300
H2 C
on
ve
rsio
n,
%
0
10
20
30
40
50
60
70
80
90
100
F5Pt1LM
F5Pt1
(a)
1000/T, K-1
1.8 2.0 2.2 2.4 2.6 2.8 3.0 3.2
Ln
(k)
3
4
5
6
7
8
9
10
F5Pt1LM
F5Pt1
(b)
Figure 4.13 Hydrogen combustion on different active phase. (a) Fuel conversion as a function of
temperature; (b) Arrhenius plot. F5Pt1LM, τC=1.53 gcat·s·Nl-1
(red triangles); F5Pt1, τC=1.49
gcat·s·Nl-1
(blue squares).
Page 80
Catalytic microcombustion for portable electric power generation
74
Table IV.9 Effect of the active phase on H2 combustion. Resume of some extrapolated
experimental data.
4.3.7 Combustion of H2-CH4 mixtures
The study on the combustion of methane and hydrogen mixtures has been carried out in SSR
reactor on structured catalysts constituted by γ-alumina supported perovskite deposed on FeCralloy
and α-alumina platelets. Different operating conditions have been considered; in particular,
different fuel mixtures and flow rates (as already reported in Table IV.2) as well as different
combustion chamber heights have been taken into account. By varying simultaneously the flow rate
and the channel height but maintaining the catalyst amount, it is possible to change the process
contact time (τC) without affecting the residence time (τR); vice versa, by varying the combustion
chamber height but maintaining the same flow rate and catalyst amount it is possible to perform
experiments at different τR but at the same τC.
In Figure 4.14 combustion experiments performed on F2LM catalyst in a 4 mm high combustion
chamber and at total flow rate equal to 40slph are presented. Specifically, conversion of hydrogen
and methane as well as the selectivity to carbon monoxide of converted CH4 are shown as functions
of the temperature in the case of Mix1, Mix2, Mix3, Mix4, Mix7 and Mix8.
Catalyst code τC
gcat·s·Nl-1
T10%
°C
E
Kcal·mol-1
k0
Nl·s-1·gcat
-1
k(200°C)
mmol·s-1·gcat
-1
F5LM 1.44 500 - - -
F5Pt1LM 1.53 95 10.9 2.7·105
60.0
F5Pt1 1.49 65 9.1 6.6·104 100.0
Page 81
Combustion tests under diluted conditions
75
Mix2
Hyd
rog
en
Co
nv
ers
ion
, %
0
20
40
60
80
100
Temperature, °C
550 600 650 700 750 800 850
Me
tha
ne C
on
ve
rsio
n, %
0
20
40
60
80
100
Temperature, °C
550 600 650 700 750 800 850
0
10
20
30
40
60
80
100
Sele
cti
vit
y t
o C
O, %
Mix3
Mix4
Mix8
Mix7
Mix3
Mix4
Mix1
Mix2
Mix2 Mix1
Mix4 Mix3
(a)
(b)
(c)
Figure 4.14 H2-CH4 mixtures combustion on F2LM at τC=1.26 gcat·s·Nl-1
and at τC=162 ms
(evaluated at STP). (a) H2 conversion as a function of temperature; (b) CH4 conversion as a
function of temperature; (c) Selectivity to CO as a function of temperature. Mix1 (closed black
circles); Mix2 (closed blue squares); Mix3 (closed red triangles); Mix4 (closed pink rhombs); Mix7
(open red triangles); Mix8 (open pink rhombs).
Page 82
Catalytic microcombustion for portable electric power generation
76
Concerning methane conversion (Figure 4.14a), in the case of hydrogen free mixture (Mix1), as
already reported in Figure 4.4, 40% of fuel is converted at the maximum investigated temperature
(TMAX). In Mix2, where 50vol% of methane is substituted with hydrogen (H2/CH4=1), hydrocarbon
conversion does not vary significantly (see Figure 4.14a). In the specific, up to a temperature of
about 750°C CH4 conversion measured in the case of Mix2 is approximately the same as that
detected in Mix1, despite of the lower inlet methane concentration This is expected because of the
first order of the oxidation reaction as regards CH4 concentration. At the maximum investigated
temperature, on the contrary, an higher fuel conversion is observed in the case of Mix2. This
circumstance recurs and it is more pronounced further increasing the H2/CH4 ratio in the fuel
mixture. In the specific, considering Mix3 (H2/CH4=2) up to a temperature of about 700°C methane
conversion is very close to that detected in the case of Mix1 and Mix2 (see Figure 4.14a). Beyond
this temperature in Mix3 CH4 conversion starts to increase more significantly till to reach at TMAX a
value of about 90%, much higher than that detected in the case of Mix1 and Mix2 (see Figure
4.14a). The enhanced system performances in converting CH4 is ascribed to a thermally activated
promoting effect due to the co-feeding of hydrogen. Such an effect, is accentuated with further
increasing H2 content in the fuel mixtures. In the specific, considering Mix4 (H2/CH4=2) beyond
700°C methane conversion experiences a steep increase, similarly to the case of Mix3. However,
higher is the amount of hydrogen in the fuel mixture, higher is CH4 conversion. In confirming with
that, in Figure 4.14a it is shown that at about 740°C fuel converted in Mix4 is about 50% while it is
only 25% in Mix3. Moreover, differently from combustion tests on Mix3, a total methane
conversion is detected at TMAX when a H2/CH4=3.3 is considered.
In Figure 4.14b it is reported hydrogen conversion measured in the case of H2-CH4 mixtures
(Mix2, Mix3, Mix4) as well as in methane free mixtures, Mix7 and Mix8, under the operating
conditions specified at the beginning of this paragraph (F2LM catalyst and 4mm high combustion
chamber). As already described in the paragraph 4.3.6 (Figure 4.12), hydrogen combustion on
perovskite is very slow and a very high temperature is needed to totally convert the fuel. Moreover,
it has been shown as the thermal level required to efficiently burn H2 on that catalyst is high enough
to activate reactive paths in the gas phase. Such a flameless combustion, occurring in “mild”
conditions, strongly enhances hydrogen combustion rate completing its conversion. These
assumptions are confirmed analyzing H2 conversion measured in the case of Mix7 and Mix8 (CH4
free fuel mixtures). These mixtures are characterized by a much lower fuel partial pressure if
compared with 1vol% of hydrogen considered in the combustion tests reported in the paragraph
4.3.6 (compare values reported in Table IV.1 and Table IV.2); moreover, the latter experiments
were performed on F5LM and A5LM catalysts in a 1mm high combustion chamber. Analyzing the
Page 83
Combustion tests under diluted conditions
77
results reported in Figure 4.14b, in both Mix 7 and Mix8 fuel conversion is very low up to a
temperature of 640°C; beyond this temperature a steep increase in the converted hydrogen (from
45% to 89% in the case of Mix8 and from 38% to 82% in the case of Mix7) is observed till a total
fuel conversion is obtained at 740°C. This temperature is very close to that reported in the
paragraph 4.3.6 in the case of A5LM and F5LM catalysts, despite of the pronounced differences in
the adopted operating conditions. Concerning the temperature at which the “jump” in hydrogen
conversion is observed in the case of Mix7 and Mix8 on F2LM, it is consistent with that reported in
Figure 4.12 in the case of A5LM. Despite of the same material of the substrate, this temperature,
instead, is much higher than that obtained for F5LM. Actually, this catalytic substrate, thicker than
F2LM (the thickness is respectively 5mm and 2mm), has already shown an higher catalytic activity
in methane combustion (see Figure 4.7) and, at the same way, may show higher performances in H2
combustion. Nevertheless, fuel partial pressure strongly affects the combustion rate in the gas phase
thus rendering not much meaningful a comparison between the results presented in this section and
that reported in the paragraph 4.3.6. Moreover, further confirming the latter assumption, later in this
paragraph it will be shown as the combustion chamber height too plays an important role on the
reactive paths in the gas phase. The effect of the inlet hydrogen partial pressure on the fuel
conversion is reported in Figure 4.14b where combustion tests of Mix7 and Mix8 are compared.
Despite of the very low difference in H2 inlet concentration, respectively 0.34 and 0.46vol%, a
significant higher fuel conversion is observed in the case of Mix8.
A different behaviour is observed in the hydrogen combustion when H2-CH4 fuel mixtures are
considered. Comparing H2 conversion in the case of Mix8 and Mix4, characterized by the same H2
partial pressure, a significantly lower fuel conversion is detected in the case methane is present in
the fuel mixture (Mix4). In particular, the conversion is the same up to 640°C while beyond this
temperature the “jump” in fuel conversion observed in the case of Mix8 doesn’t occur in the CH4-
H2 mixture resulting in a lower converted fuel in the latter case. In further confirming of that, Mix4
shows a total hydrogen conversion at about 800°C where, under the same investigated conditions, it
was observed at 740°C in Mix8. The same conclusions are drawn by comparing hydrogen
conversion in the case of Mix7 and Mix3, characterized by a lower H2 content. It is worth noting
that, as already observed in the case of methane free fuel, even in the CH4-H2 mixture H2
conversion increases with increasing the fuel inlet partial pressure. In the case of Mix2,
characterized by the lowest hydrogen content, the maximum investigated temperature is not enough
to guarantee a total H2 conversion. In this case it is about 80% where both in Mix3 and Mix4 it was
100% .
Page 84
Catalytic microcombustion for portable electric power generation
78
On the basis of these results, it is clear that hydrogen shows a promoting effect on methane
combustion rate. Such an effect is thermally activated and it is more and more significant with
increasing the degree of methane substitution with hydrogen. At the same time, the presence of
methane in the fuel mixture is unfavourable to hydrogen combustion and, specifically, inhibits the
H2 conversion in the gas phase. A reasonable explanation of such a phenomenon is ascribed to the
occurrence of reactive paths in the gas phase between methane and radicals involved in hydrogen
combustion mechanism. Based on this assumption, the observed promoting effect occurs because
H2 constitutes a source of radicals that favours CH4 combustion in the gas phase at relatively low
temperature. Moreover, a part of these radicals, involved in methane consumption reactions, is no
more available to sustain hydrogen combustion thus giving an explanation to the inhibiting effect of
methane on H2 oxidation in CH4-H2 fuel mixtures (compare H2 conversion measurements obtained
in Mix7 and Mix3 as well as in Mix8 and Mix4 reported in Figure 4.14b).
The reported assumptions are supported by several studies in literature on “mild” combustion of
CH4-H2 mixtures. (Schefer et al., 2002, Dagaut e Nicolle, 2005, Sabia et al., 2007, Derudi et al.,
2007). As it is known, OH. radicals play the most relevant role in the light-off of methane
combustion in the gas phase: these radicals, in fact, chemically activate the hydrocarbon molecules
abstracting from them H. radicals, thus producing CH3
. radicals (r IV.1). As it is shown by Dagaut
and Nicolle (2005), without co-burning hydrogen, OH. radicals are mainly produced by the
breaking of oxygen molecules through the reaction r IV.2. Because of the great chemical stability of
oxygen, r IV.2 requires high temperature to occur and, specifically, at least 900°C is needed. By
adding hydrogen to the methane fuel mixture a changing in the OH. formation mechanism occurs:
in particular, by increasing the hydrogen content in the fuel, hydroxyl radicals are produced more
and more significantly through r IV.3 and, specifically, from HO2., an intermediate product of low
temperature H2 combustion. Practically speaking, hydrogen presence in the fuel improves system
performances in converting methane because determines an increase in the production of hydroxyl
radicals at a temperature relatively low thus allowing hydrocarbon combustion in the gas phase at
an unexpectedly low thermal level.
CH4+OH. CH3
.+H2O r IV.1
O2+H. OH
.+ O
. r IV.2
H.+HO2
. OH
..+ OH
. r IV.3
An experimental verification of the occurrence of methane combustion in the gas phase is
reported in Figure 4.14c, where selectivity to carbon monoxide is reported in the case of Mix1,
Page 85
Combustion tests under diluted conditions
79
Mix2, Mix3 and Mix4. In the case of hydrogen free fuel mixture (Mix1), selectivity to CO
decreases monotonically with the temperature. In the specific, at the maximum investigated
temperature CO selectivity is about 5%, corresponding to a carbon monoxide production of
approximately 50ppm. By adding to the fuel mixture an hydrogen content high enough to allow
methane total conversion a different behavior is observed. In particular, considering Mix3,
characterized by an H2/CH4 ratio equal to 2, selectivity to CO is very close to that measured for
Mix1 up to a temperature of 700°C. On the contrary, beyond this temperature and in
correspondence with the “jump” observed in methane conversion (see Figure 4.14a) CO selectivity
strongly increases in the case of Mix3 till to reach much higher values than those detected for Mix1.
In particular, Mix3 exhibits at TMAX a selectivity of 30%, corresponding to a carbon monoxide
production of approximately 490ppm. Similar considerations are valid in the case of combustion
experiments of Mix4. In particular it is worth noting that, in correspondence of methane conversion
“jump”, selectivity to CO measured for Mix4 is higher than that of Mix3. On the contrary this trend
is inverted at TMAX. The enhanced production of carbon monoxide in correspondence with the
increase in methane conversion in H2-CH4 fuel shows that hydrocarbon reacts in the gas phase.
Actually, hydrocarbon catalytic combustion proceeds assuring a quite total selectivity to CO2. On
the contrary, under the investigated conditions, carbon monoxide is a typical product of
homogeneous combustion because the temperature is too low to allow the further oxidation of CO
to CO2.
The promoting effect of hydrogen on methane combustion has been studied with varying the
temperature and the H2/CH4 ratio. Nevertheless, it may be interesting to understand the role of the
residence time, τR, on the system performances in converting the H2-CH4 fuel mixtures. Actually, τR
is the characteristic time of the reactions occurring in the gas phase and, as consequence, by
changing it the hydrogen promoted reactivity of methane in the homogeneous phase may be
affected too. In Figure 4.15 methane conversion is reported as a function of the H2/CH4 ratio with
varying τR. In order to study the effect of the residence time on the combustion rate specifically in
the gas phase, the experiments are carried out maintaining unchanged the characteristic time of the
catalysis (contact time, τC). In particular, the experiments are performed on F2LM at a total flow
rate of 40slph resulting in a τC=1.26 gcat·s·Nl-1
. Moreover, the temperature is maintained constant
and, specifically, T=800°C. Such a temperature is higher than the thermal threshold required to
activate the reactive paths involving methane consumption in the gas phase. The residence time is
changed by varying the height of the combustion chamber: in the specific, 1, 3 and 4 mm high
combustion chambers have been considered, corresponding to residence times respectively equal to
11, 34 and 45 ms (evaluated at 800°C).
Page 86
Catalytic microcombustion for portable electric power generation
80
In Figure 4.15 methane conversion follows two different trends with varying τR depending on
H2/CH4 ratio. At a H2/CH4 ratio less than one, fuel conversion doesn’t depend significantly on the
residence time. This happens because H2/CH4≤1 (Mix1 and Mix2) is not high enough to allow a
reactivity of CH4 reactivity in the gas phase and fuel is converted exclusively on the catalyst.
Moreover, at fixed catalyst formulation methane conversion doesn’t change with τR because the
unchanged contact time, as it has been already discussed in the paragraph 4.3 and specifically
shown in Figure 4.4.
H2/CH4, ratio
0 1 2 3 4
Meth
an
e C
on
ve
rsio
n,
%
0
20
40
60
80
100
Height 4mm
Height 3mm
Height 1mm
ττττR
T=800°C
Figure 4.15 H2-CH4 mixtures combustion on F2LM at τC=1.26 gcat·s·Nl-1
. CH4 conversion as a
function H2/CH4 ratio at 800°C with varying the residence time (evaluated at 800°C). τR=45ms
(closed black circles); τR=34ms (closed red triangles); τR=11ms (closed blue squares).
By increasing the H2/CH4 ratio in the fuel mixture (Mix3 and Mix4), as it has already reported, a
steep increase in methane conversion is observed; moreover the amount of converted fuel increases
with the residence time. By comparing this result with those obtained previously at H2/CH4≤1 it is
clear as a changing in the conversion regime occurs at H2/CH4=1: specifically while at H2/CH4≤1
methane is catalytically converted, at higher ratios the dependence of CH4 conversion on τR shows
that the combustion takes place in the gas phase. Specifically, at a H2/CH4 ratio equal to 2 (Mix3) it
is shown as the methane conversion is 45, 68 and 90% in the case of a τR respectively equal to 11,
34 and 45ms. As it is expected, an increase in methane conversion is observed further increasing the
Page 87
Combustion tests under diluted conditions
81
H2/CH4 ratio, but the same dependence on τR is maintained. In particular, in the case of Mix4 fuel
conversion is 87, 93 and 100% respectively at τR equal to 11, 34 and 45ms.
Under the investigated conditions, CH4-H2 fuel mixtures burn in the gas phase despite of the
presence of an active catalyst. On the basis of this result, it is needed to examine in depth the role of
the catalyst. First of all, it is worth noting that the catalyst plays a relevant role on the selectivity of
the converted methane: in particular, the detected CO selectivity in the CH4-H2 (see Figure 4.14c) is
much lower than that which is expected in a “pure” homogeneous combustion. Based on this
consideration, the catalyst, even if not involved in the reaction of methane consumption, is certainly
determinant in oxidizing CO to CO2 improving combustion efficiency. However this may be not the
only role of the catalyst and in order to better understand the possible synergy between the
homogeneous and the heterogeneous some specific experiments have been performed. Specifically,
CH4-H2 combustion tests have been carried out on F2LM at a fixed residence time with varying the
contact time. As already specified, this is possible by changing simultaneously the total flow rate
and the combustion chamber height. In Figure 4.16 CH4 conversion is shown as a function of the
H2/CH4 ratio with varying the contact time; the residence time and the temperature are maintained
constant and are respectively 34 ms and 800°C.
At low H2/CH4 ratio(H2/CH4≤1), where only catalytic reaction occurs, fuel conversion increases
by increasing the contact time, as it is expected. In particular, in the case of H2/CH4=1 (Mix2) CH4
conversion is 77 and 35% respectively at τC=3.84 and 1.26 gcat·s·Nl-1
.
By increasing the H2/CH4 ratio (H2/CH4>1), homogeneous reaction paths are expected; in these
conditions, methane conversion still increases by increasing the contact time, despite of the same
residence time. For example, in the case of H2/CH4=2 (Mix3) CH4 conversion is 92 and 68%
respectively at τC=3.84 and 1.26 gcat·s·Nl-1
. Moreover, higher is the contact time and lower is the
ratio H2/CH4 at which methane is totally converted. As a result, an increase in the contact time
shows a positive role on the H2 assisted methane combustion in the gas phase, revealing a certain
synergy between heterogeneous and homogeneous reaction. In particular, the catalyst, partially
converting methane on its surface, reduces the amount of the hydrocarbon in the gas phase thus
increasing the effective H2/CH4 ratio. This results in a lower and lower H2 amount necessary to burn
efficiently CH4-H2 fuel with increase the contact time.
Page 88
Catalytic microcombustion for portable electric power generation
82
T=800°C
H2/CH4, Ratio
0 2 4 6 8 10 12
Meth
an
e C
on
ve
rsio
n,
%
0
20
40
60
80
100
Q=15slph; δ=1mm
Q=40slph; δ=3mm
ττττC
Figure 4.16 H2-CH4 mixtures combustion on F2LM at τR=34 ms (evaluated at 800°C). CH4
conversion as a function H2/CH4 ratio at 800°C with varying the contact time. τC=3.84 gcat·s·Nl-1
(black triangles); τC=1.26 gcat·s·Nl-1
(red circles).
Page 89
Autothermal combustion of CH4 and H2-CH4 mixtures
83
CHAPTER 5
AUTOTHERMAL COMBUSTION OF CH4 AND H2-CH4 MIXTURES
In this chapter an experimental study on the catalytic combustion of hydrogen, methane and
their mixtures under autothermal conditions is presented.
γ-Alumina supported Pt-LaMnO3 catalyst has been taken into account. Among the different
active phases considered in this study, this choice results optimal in the case of H2-CH4 mixtures
combustion, since, as previously reported, such a catalyst is constituted by the combination of the
most active phases for both methane (i.e., perovskite) and for hydrogen (i.e., platinum) oxidations.
Under autothermal conditions, the heat generated by the reaction should be high enough to
guarantee the self-sustainability of the combustion process. As a consequence of ignition, total fuel
conversion involves a steep rise of the system temperature that is sustained by the release of the
heat of combustion despite of the relatively cold incoming gas. In the actual experimental
conditions, however, the steady state temperature measurements result in lower values with respect
to the adiabatic temperature of combustion, due to the unavoidable heat losses that are also expected
in a pronouncedly not adiabatic system like a microcombustor. In addition, as already discussed in
the first chapter, autothermal combustion is stable in a narrow operating window because of the
occurrence of two quenching modes, extinction and blowout, associated to a drop in temperature
and conversion (Ronney, 2003, Norton and Vlachos, 2004, Kaisare et al., 2008) due to different
causes. In the extinction mode, stability is lost due to a too large heat loss (towards surroundings)
compared to the thermal power provided via combustion. In the blowout mode, quenching occurs
because of a too large flow rate, resulting in incomplete fuel conversion for both insufficient
residence time and a considerable shift of the reaction front downstream, due to insufficient cold
feed gas pre-heating.
The main pursued object is to study the ignition behaviour and the stable combustion limits of
H2, CH4 and H2-CH4 fueled monolithic microcombustor. In particular, light-off temperature and
quenching conditions are measured with varying inlet fuel compositions and total flow rate.
Differently from isothermal H2-CH4 combustion tests (discussed in the previous chapter), focused
to the comprehension of the eventual promoting effect of hydrogen on the chemistry of methane
combustion, autothermal tests proposed in this section allow to understand the role of H2 in
Page 90
Catalytic microcombustion for portable electric power generation
84
thermally assisting CH4 combustion. Actually, the great reactivity of hydrogen on Pt based catalysts
(see paragraph 4.3.6) allows its ignition roughly at room temperature. The thermal power developed
by H2 combustion could bring about a rise in the catalyst temperature thus lowering the ignition
temperature of a CH4-H2 mixtures in comparison with that of CH4 only. Aside the specified effect
on ignition behaviour, hydrogen may play a role in enlarging the operating window of methane self-
sustained combustion by keeping away extinction and blowout instability modes.
5.1 Operating conditions
Combustion tests have been carried out in MQR reactor on C1PtLM900 catalyst (see 2.1.5 and
3.1.3 paragraphs for details).
In order to achieve autothermal conditions, a sufficient thermal power needs to be developed
through combustion. As a consequence, an high overall heating value fuel is required, differently
from isothermal tests where a strong reactant dilution was taken into account. In Table V.1 the
specifics of the considered fuel mixtures are reported.
Table V.1 Composition of fuel mixtures in the case of CH4, H2 and CH4-H2 combustion tests
under autothermal conditions.
Fuel
CH4 CH4- H2 H2
Mix1 Mix2 Mix3 Mix4
H2, % - - 2.1 2.1
CH4, % 2.8 3.8 2.2 -
O2, % 10.0 10.0 10.0 10
N2, % 87.2 86.2 85.7 87.9
Equivalence ratio, Φ 0.56 0.76 0.54 0.1
Heating value, KJ·Nl-1 0.9 1.2 0.9 0.2
Thermal Power, W 10-35 13-47 10-35 2-8
QTOT=40÷÷÷÷140slph
For safety issues, fuel composition is always below the LFL of each considered fuel. In
particular, concerning methane combustion, fuel composition is under 5%vol and it is 2.8% and
Page 91
Autothermal combustion of CH4 and H2-CH4 mixtures
85
3.8%vol respectively for Mix1 and Mix2. Moreover, O2 content was kept at 10% vol. for the same
reason.
The specified compositions supply an overall heating value that is 0.9 and 1.2 kJ·Nl-1
,
respectively in the case of Mix1 and Mix2. A CH4-H2 mixture, Mix3, is prepared with the same
overall heating value of Mix1. Specifically, an H2/CH4 ratio of 0.95 is taken into account
corresponding to a substitution of methane with hydrogen of 49% as regards the molar content
while it is 22% considering the energetic content of H2 with respect to the overall heating value of
the mixture. Methane and hydrogen concentrations in Mix3 are respectively of 2.2 and 2.1%vol.
Such a fuel percentage is below the mixture LFL that is equal to 4.5%vol. Concerning Mix4, it is a
H2/O2/N2 mixture prepared with the same hydrogen content as Mix3 and by replacing CH4 with N2.
Such a fuel is characterized by an overall heating value of 0.2 kJ·Nl-1 (of course lower than that of
Mix3) and is considered as a reference of the thermal power supplied by hydrogen in CH4-H2
combustion. Finally, as regards the oxygen content, it is 10%vol in all the investigated fuel
mixtures. Such a O2 concentration is in excess with respect the total combustion stoichiometry but
not higher than MOC value. The considered compositions result in different equivalence ratio, as it
is reported in Table V.1.
In Table V.1 it is also reported the range of the investigated gas flow rate, QTOT; specifically,
QTOT is ranging from 40 and 140slph corresponding to an input power that varyies in the range of
2÷50W.
The experiments provide for the ignition of the fuel mixture by means of the reactor pre-heating;
in particular, the minimum ignition temperature (MIT) is here defined as the gas temperature at
which light off occurs at the minimum pre-heating. Once obtained fuel ignition, the external pre-
heating is progressively decreased and stable combustion is observed until system is quenched at a
specific temperature, QT, corresponding to minimum value external pre-heating of entrance gas
temperature that allows stable combustion.
MIT and QT are measured according to a specific experimental procedure. In particular, the
system is heated in inert atmosphere up to a specific furnace set-point temperature. Then the fuel
mixture is fed to the reactor and temperature profile inside the catalyst as well as fuel conversion
are continuously measured. Temperature set point of the external electric furnace is increased with a
step of 5°C till fuel ignites and MIT is found (through the measurements of thermocouples inserted
in the monolith, and not evaluating the actual furnace temperature). After fuel mixture ignition,
steady states of combustion are measured by decreasing furnace set-point temperature until to reach
the quenching point at QT.
Page 92
Catalytic microcombustion for portable electric power generation
86
MIT and QT (as well as Tpre-heating reported in the following graphs) of a specific fuel mixture,
fixed the total flow rate, represent gas temperatures obtained if the same flow rate of an inert N2-O2
(10vol% in oxygen) mixture is preheated inside the reactor at a furnace temperature set-point
corresponding respectively to combustion ignition and quenching. The reactor is placed in a zone of
the furnace where it is possible to neglect any border effect on heating: consequently an isothermal
profile in the reactor should be expected in the case an inert mixture is heated at a specified furnace
set point. Even so, the detected temperature increases along the catalytic reactor length because of
the heat transferred by convection and a maximum temperature difference of about 20°C is detected
between inlet and outlet of the monolithic reactor. Based on this, the choice of MIT and QT is not
univocally determined. However, as regards the ignition phenomena the temperature considered is
the highest one (i.e. the exit temperature); on the contrary as regards the quenching it is the lowest
one (i.e. the entrance temperature).
Combustion performances are compared for the various operating conditions studied herein in
terms of MIT and QT measured values. In particular, the latter is a very good metric of combustor
stability. In the following graphs, the quenching point is indicated with vertical arrows.
The catalyst has been pre-treated in a combustion environment up to 1000°C for approximately
6h. Such a treatment allows to stabilize the catalyst properties. Actually, a good reproducibility is
found for each single experiment, repeated some time after many days of tests; this is proved by no
relevant change in the measured values of MIT and QT after the catalyst was used for several hours
(approximately 120 h).
Finally, it is worth mentioning that no carbon monoxide is detected in all the performed
combustion tests as it is typical in Pt based catalyst (see Chapter 4).
5.2 Ignition and limits of stable operation in CH4 combustion
In Figure 5.1 it is reported the transient of the ignition at MIT measured in the case of
combustion of Mix1 at a total flow rate of 80slph: CH4 concentration and conversion (respectively
Figure 5.1 a and b) as well as thermal profile inside the monolith (Figure 5.1c) are reported as
functions of time. Concerning Figure 5.1c, T1, T2 and T3 are respectively the temperatures measured
at the inlet, the centre and the exit of the reactor.
In the graphs shown it is possible to distinguish more regions, Zone 1, 2, 3 and 4.
Page 93
Autothermal combustion of CH4 and H2-CH4 mixtures
87
time, min
0 20 40 60 80 100 120
500
600
700
800
900
1000
T1
T2
T3
Me
tha
ne C
on
ve
rsio
n,
%
0
20
40
60
80
100
0.0
0.5
1.0
1.5
2.0
2.5
3.0
Me
tha
ne
Co
nc
en
tra
tio
n,
%T
em
pe
ratu
re,
°C
1 2 3 4
(a)
(b)
(c)
Figure 5.1 CH4 combustion on C1PtLM900 in MQR at QTOT=80slph; Ignition transient of Mix1
at MIT=534°C. Section 1: Evaluation of MIT: thermal profile for an O2-N2 mixture. Sections 2, 3,
4: CH4 is sent to the reactor: fuel light-off. (a) CH4 concentration (black line). (b) CH4 conversion
(green line). (c) thermal profile inside the monolith: T1 (blue line), T2 (red line), T3 (pink line).
Page 94
Catalytic microcombustion for portable electric power generation
88
Zone 1 is characterized by an almost constant temperature profile: it represents the minimum
pre-heating condition which gives place to the ignition of methane combustion. Consequently, by
analyzing the zone 1 thermal profile, it can be derided the MIT value. As already discussed, the
detected temperature increases along the catalytic reactor length because of the heat produced by
methane conversion to carbon dioxide and transferred from the entry to the exit sections of the
monolith by convection. In the specific, T1, T2 and T3 assume the values of respectively 522, 525
and 534°C and, based on previous assumption, MIT=534°C.
In Zone 2 Mix1 is sent to the reactor. A methane conversion of about 10%vol is observed (see
Figure 5.1b) as detected by the decrease of fuel exit concentration (see Figure 5.1a). Considering
the kinetic parameters evaluated in the Chapter 4 and assuming a PFR reactor, the measured
conversion is consistent with that expected at a temperature equal to MIT, fixing the contact time,
τC=49.6 gcat·s·Nl-1
. Moreover, the insulation of the combustor makes sure that part of the developed
thermal power is not lost towards the environment but trapped inside the system. This is made clear
by considering the increase in temperature observed on the catalyst (see Figure 5.1c). Specifically,
an increase of about 20, 15 and 5°C is measured respectively in the case of T3, T2 and T1.
The increase in the reactor temperature determines an increase in fuel conversion and,
consequently, a further increase in the system temperature. The repeating of this cycle brings about
the progressive increase with the time in methane conversion and catalyst temperature as it is shown
in the Zone 3. Specifically, in this region a rise in the percentage of converted CH4 up to about
30%vol is observed; moreover, T1, T2 and T3 are respectively 550, 580 and 650°C.
A certain induction time (about 75 min) is needed in the Zone 3 to have combustion “run-away”.
In the Zone 4, in fact, the temperature level reached by the system is sufficiently high to allow the
total conversion of the methane. A steep increase in the fuel converted with a negligible production
of carbon monoxide is thus observed. The total selectivity to CO2 of the process points out that
methane is converted on the heterogeneous phase, being CO one main product of homogeneous
combustion in this range of operating conditions (Hayes and Kolaczkowski, 1997). Moreover, the
available thermal power is totally developed and, as a consequence, system temperature strongly
raises. The ignition takes place at the exit of the monolith where the temperature is higher. This is
clearly shown in Figure 5.1c where it is shown that a temperature “jump” occurs firstly for T3 and
then for T2 and T1. On the basis of the last recorded data (that are not representing the steady state
yet), at the end of the fourth zone, T1, T2 and T3 are respectively 700, 920 and 840°C. Differently
from the thermal profile measured in Zone 2 and 3, in correspondence with the fuel ignition,
maximum temperature shifts from the exit to the centre of the reactor. A temperature wave
travelling from the exit to the inlet of the reactor is thus observed pointing out the reaction front
Page 95
Autothermal combustion of CH4 and H2-CH4 mixtures
89
propagation backwards. Such a result is a relevant advancement towards the understanding of
microcombustor behaviour; however, a similar ignition behaviour was observed a few years ago by
Cimino et al. (2001) who investigated methane autothermal combustion in pronouncedly not
adiabatic laboratory reactors.
It is worth noting that the transient of methane ignition at the MIT, from the feeding to the total
combustion of the fuel, lasts about 90 min and a still longer evolution is expected to have a steady
state (the latter is not reported). Such a quite long induction time is more and more reduced as the
preheating temperature is increased with respect to MIT.
In Figure 5.2 the steady state of Mix1 combustion at a total flow rate of 80slph is reported, as
function of the decreased pre-heat temperature. In the specific, it has been reported methane
conversion (Figure 5.2a) and temperature measurements inside the monolithic reactor (Figure 5.2b).
As already discussed, at the specified flow rate Mix1 ignition occurs at a MIT=534°C. However,
once ignited, the catalytic combustion of methane still remains effective with reducing the pre-
heating temperature. Examining Figure 5.2a and, specifically, the low conversion branch (open red
circles), before the ignition most of CH4 stays unconverted at a pre-heating temperature lower than
MIT (a fuel conversion less than 10%vol is detected). By progressively heating up the system from
such an unlighted state, fuel conversion slightly increases till it jumps in correspondence with MIT
(pointed out in the graph by a red upward arrow). By subsequently decreasing the pre-heating
temperature from such an ignited state, fuel conversion does not retrace the curve exhibited during
the heating up process and, in particular, does not drop thus constituting an high conversion branch
(closed black circles in Figure 5.2a). It is so revealed the existence of two stable steady states at the
same pre-heating temperature. Such a behaviour is typical of highly exothermic reactions
(Levenspiel, 1962, Hayes and Kolaczkowski, 1997) for which a multiplicity of steady states may
result from energy and mole balance equations for any given set of inlet conditions to reactor.
Examining the high conversion branch shown in Figure 5.2a, the percentage of converted methane
decreases with decreasing the pre-heating temperature. In particular, methane conversion is higher
than 96% at a Tpre-heating>367°C; then it starts to decrease more significantly till to reach a value of
93% in correspondence with the quenching point (at a pre-heating temperature so named QT).
Further decreasing the temperature beyond this value, the fuel conversion suddenly drops going
back to the low conversion branch and the combustion process quenches. The minimum pre-heating
temperature at which stable combustion is observed, i.e. the critical temperature QT, represents the
thermal limit of combustion operation; under the specified conditions of Mix1 and 80 slph QT is
equal to 333°C, significantly lower than MIT. Such a discrepancy points out the hysteresis of about
200°C exhibited by the cooling/heating curve.
Page 96
Catalytic microcombustion for portable electric power generation
90
250 300 350 400 450 500 550 600
100
300
500
700
900
1100
1300
Tpre-heating, °C
Meth
an
e c
on
ve
rsio
n,
%
0204060
75
80
85
90
95
100
T1
T2
T3
Tad
(b)
(a)
High conversion branch
Low conversion branch
Te
mp
era
ture
, °C
Cooling
Heating
Figure 5.2 Stability limits of CH4 combustion on C1PtLM900 in MQR; QT for Mix1 at
QTOT=80slph as a function of Tpre-heating. (a) CH4 conversion: high (black closed circles) and low
(red open circles) conversion branches. (b) Temperature in the high conversion branch (T1, blue
squares, T2, red rhombs, T3, pink triangles) and theoretical adiabatic temperature (Tad, green line).
A multiplicity of stable steady states curves for any given pre-heating temperature is expected
even in terms of temperature measured inside the reactor. Similarly to the case of conversion, in
fact, by heating up the system starting from unlighted conditions a transition to high temperature
ignited state occurs at MIT, while on the contrary, by cooling down the system starting from ignited
conditions, the transition to low temperature quenched state occurs at QT. Nevertheless, in Figure
5.2b only the high temperature branch is reported. In that figure T1, T2 and T3 as well as adiabatic
temperature of the fuel mixture, Tad, are reported. The latter is ranged between 1220 and 1000°C
(depending on the preheating temperature) under the investigated condition and it is always higher
than the measured combustion temperatures, T1, T2 and T3. This result points out the intrinsic non-
Page 97
Autothermal combustion of CH4 and H2-CH4 mixtures
91
adiabaticity of such a kind of micro-structured system, that is a typical feature of practical micro-
combustors. Considering the maximum investigated pre-heating temperature of approximately
550°C, T1, T2 and T3 are respectively, 805, 958 and 886°C, highlighting that a maximum
temperature is set in proximity of the centre of the reactor, as it has been already shown in Figure
5.1. Based on this result, the reaction front, consistently with the maximum temperature position,
stabilizes at the center of the monolith; moreover, the second half of the reactor is a post-
combustion zone, where the detected temperature decreases because of the heat losses, while the
first half of the reactor provides for the gas pre-heating, above all through the axial heat flux from
the combustion zone. By decreasing the pre-heating temperature a general decrease in the
temperature level is observed as a consequence of the lower adiabatic temperature. However, a
different decreasing slop is observed for the three measured temperatures. Concerning the entrance
temperature, its drop with Tpre-heating is consistent with Tad decrease: this assumption is made clear
considering that T1 and Tad decrease slopes are approximately the same, at least till methane is
totally converted (see Figure 5.1). In particular, in consequence of a decrease in pre-heating of
about 200°C T1 decreases of about 280°C. On the contrary, in correspondence with the same
decrease in pre-heating T2 and T3 decrease is significantly lower and specifically of 153 and 90°C
respectively. It follows that the observed phenomena are strongly non linear: actually they are ruled
by the heat losses that under these conditions are controlled by radiative heat transfer depending on
T4. The weaker variability of the exit thermal level points out that by decreasing the pre-heating
temperature T2 and T3 tend to overlap till they are approximately the same at Tpre-heating=QT (at a
preheating temperature equals to QT, T2 and T3 are respectively 805 and 796°C). Actually, by
decreasing the temperature of the incoming gas (i.e, Tpre-heating in Figure 5.2) in order to reach the
same thermal threshold to sustain the combustion process a longer and longer pre-heating length is
needed in the reactor. As a consequence, a reaction front drift downstream is observed while the
post-combustion zone becomes shorter resulting in a decrease in its active surface. However, the
increase in the pre-heating length observed with decreasing the temperature of the incoming gas
brings about a lower and lower contact time of the reactants with the high temperature reactor zone,
as it is shown by the drop in fuel conversion (see Figure 5.2a).
In Figure 5.3 it is reported the transient behaviour of the system during the quenching of Mix1
combustion at a flow rate of 80slph for a pre-heating temperature of 328°C, a value lower than QT.
In particular, temperature and methane conversion measurements are reported as a function of time
respectively in Figure 5.3a and b. At t=0 T1, T2 and T3 are respectively 524, 807 and 797°C while
fuel conversion is 93%. Still, after 10min these values are practically unchanged. Nevertheless, after
this segment, T1 and T2 start simultaneously to decrease while T3 slightly increases till to exceed T2
Page 98
Catalytic microcombustion for portable electric power generation
92
at t=15min. A temperature wave is thus observed travelling from the inlet to the exit of the reactor.
Such a behaviour is connected to combustion quenching phenomena in the presence of important
heat losses and it is due to the insufficient gas preheat or insufficient contact time at the necessary
high temperature zone and results in the reaction front shift downstream and its subsequent exit
from the reactor. After 45 min T1, T2 and T3 are respectively 425, 626 and 816°C. At that instant T3
reaches a maximum after which it quickly decreases. At t=55 min the system is, in fact, totally
quenched. Concerning methane conversion it follows the same T3 trend: in particular, the
percentage of converted fuel is practically unchanged compared to that revealed at t=0 (it is actually
more than 90%) till T3 drop (t>45min). After that instant, in agreement with T3 behaviour, methane
conversion strongly decreases and at t=55min fuel is practically unconverted.
Te
mp
era
ture
, °C
300
400
500
600
700
800
900
T1
T2
T3
time, min
0 10 20 30 40 50 60 70 80 90
0
20
40
60
80
100
Me
than
e c
on
vers
ion
, %
(a)
(b)
Figure 5.3 CH4 combustion on C1PtLM900 in MQR. Quenching transient of Mix1 at
QTOT=80slph and Tpre-heating=328°C. (a) CH4 conversion (green line). (b) Temperature
measurements (T1, blue line, T2, red line, T3, pink line).
Page 99
Autothermal combustion of CH4 and H2-CH4 mixtures
93
140slph
300
400
500
600
700
800
900
1000
1100
1200
1300
40slph
80slph
120slph
Tpre-heating, °C
T1,
°C
300
400
500
600
700
800
900
1000
1100
1200
1300
250 300 350 400 450 500 550 600
300
400
500
600
700
800
900
1000
1100
1200
1300
T2,
°CT
3,
°C
(a)
(b)
(c)
140slph
40slph
80slph 120slph
Tad
Tad
140slph
40slph
80slph 120slph
Tad
Figure 5.4 Stability limit of methane combustion on C1PtLM900 in MQR; QT for Mix1 with
varying the flow rate. Temperature measured in the high conversion branch. (a) T1; (b) T2; (c) T3 as
a function of the pre-heating temperature. Total flow rate of 40slph (blue squares), 80slph (red
triangles), 120slph (pink rhombs), 140slph (black circles); adiabatic temperature (Tad, green line).
Page 100
Catalytic microcombustion for portable electric power generation
94
The behaviour observed and described in Figg. 5.1-5.3 presents some relevant difference in
dependence of the flow rate adopted. Actually, maintaining the same chemical composition (Mix1),
the thermal power of the mixture entering the micro-reactor depends on the flow rate (and is
proportional to it), hence all thermal effects can be severely affected. In Figure 5.4 and Figure 5.5
the high conversion branch of Mix1 combustion is shown respectively in terms of measured
temperature and CH4 conversion, as a function of the pre-heating temperature, at different values of
the flow rate. The reported arrows point out the quenching temperature observed and the window of
stable combustion at the different operating conditions. It is shown as the quenching temperature
progressively decreases with increasing flow rate from 40 to 120slph, thus extending the limits of
stable combustion. On the contrary, it starts to decrease further increasing the gas flow from 120 to
140slph. Specifically, QT is 478, 333, 306°C at QΤOT respectively equals to 40, 80, 120slph while it
is 314°C at QΤOT=140slph. Increasing the flow rate a different behaviour is observed in the detected
temperature in dependence on the particular reactor section (see Figure 5.4).
Concerning the entrance temperature, T1, it increases by increasing the flow rate from 40 to
80slph; on the contrary, it is practically unchanged varying the gas flow from 80 to 140slph.
Considering the temperature measured at the centre of the reactor, T2, it increases in a larger flow
rate range in comparison with T1 case; particularly, T2 progressively increases by increasing flow
rate up to 120slph while it does not vary any more further increasing the flow rate up to 140slph.
Finally, concerning T3, reactor exit temperature, it increases in all the investigated flow rate range.
By increasing the flow rate a dual effect is expected on combustion stability. In particular,
considering the same fuel composition, the power developed by the combustion linearly increases
with total flow rate. At the steady state and for a non adiabatic reactors (like a microcombustor) the
power released via combustion is equal to the sum of the power lost through the reactor walls and in
the exhausted gases. To balance the increase in the combustion power this sum has necessarily to
increase linearly with the total flow rate. However, the heat losses through the reactor walls don’t
depend on the total flow rate and the sensible heat of exhausted only linearly. Consequently, in
order to get over the higher power released via combustion at higher flow rates the system has to
reach higher temperatures. In such a way, in fact, by increasing the total flow rate the power lost in
the exhausted gases increases more than linearly; moreover, the heat lost through the walls
increases too in consequence of the increase in the heat transfer driving force. As a result, an
increase in the flow rate determines an increase in the system adiabaticity level because heat losses
are a fraction less and less important of the thermal power increase developed by methane
combustion. Nevertheless, an increase in the flow rate brings about a decrease in the contact time
Page 101
Autothermal combustion of CH4 and H2-CH4 mixtures
95
and, as a consequence, a possible worsening of fuel conversion, if contact time becomes
insufficient. These considerations suggest a tradeoff behaviour regarding the total flow rate.
Specifically, in a range of low gas velocity, such as to guarantee a sufficient contact time, an
enhancement of combustion stability is expected by increasing flow rate. An increase in the system
adiabaticity, in fact, is effective in preventing extinction, as it has been already shown in the first
chapter (Kaisare and Vlachos, 2007, Kaisare et al., 2008). Nevertheless, in a range of gas velocity
not more compatible with the total fuel conversion, an increase in flow rate is detrimental for
combustion stability causing blowout (Kaisare and Vlachos, 2007, Kaisare and al., 2008).
Based on these considerations, the expansion of combustion operation limits (i.e., the decrease
in QT) observed by increasing the flow rate from 40 to 120slph is consistent with an enhanced
system adiabaticity. Assuming T3 as the temperature of the exhausted gas, from experimental data
one can calculate the power lost in the exhausted gas and comparing it to the total power generated
it is possible to evaluate the heat lost through the reactor walls. At a Tpre-heating≈500°C, for example,
considering a QTOT=40slph the power released via combustion is about 10W and the sensible power
of exiting gases is about 3.5W. As a result, the power lost trough the reactor walls is approximately
6W that correspond to a 65% of the total power confirming the pronounced thermal dissipation in a
microcombustor. By increasing the total flow rate and specifically at QTOT=80slph but maintaining
the same Tpre-heating≈500°C, the power released via combustion is about 20W, the sensible power of
exiting gases is about 11W; the power lost trough the reactor walls is thus about 9W that correspond
to a 45% of the total power confirming the enhanced adiabaticity of the system. Further increasing
the total flow rate from QTOT=80slph to QTOT=120slph, at Tpre-heating≈345°C the percentage of heat
lost through the reactor walls still decreases from 28 to 17%. As a result, under these conditions loss
in combustion stability observed at a pre-heating temperature lower than QT is ascribed to the low
power input compared to heat losses through the reactor wall. This particular instability mode
occurs at nearly complete fuel conversion and is described as extinction (Kaisare and al., 2008). By
analyzing the thermal profiles reported in Figure 5.4, for QTOT=40÷120slps a maximum temperature
is detected in correspondence with the centre of the reactor. Such a maximum increases by
increasing the flow rate confirming the enhanced adiabaticity of the system. Moreover, as it is
shown in Figure 5.5, the increase in the flow rate in the specified range brings about an increase in
the fuel conversion despite of the decrease in the contact time, due to the faster catalytic combustion
kinetics consequent to the increased temperature. Furthermore, the dynamics of quenching via
extinction is pointed out in Figure 5.3 at QTOT=80slph. In that graph it is shown that fuel conversion
does not significantly decrease despite of the decrease in gas residence time in the high temperature
zone due to the temperature wave travelling downstream cooling the entrance and the centre of the
Page 102
Catalytic microcombustion for portable electric power generation
96
reactor. On the contrary, its drop occurs inevitably when reaction front is pushed outside the reactor,
pointed out by the drop in T3. Such a behaviour confirms that combustion stability in those range of
flow rate is not limited by fuel conversion but it only depends on the heat losses.
Tpre-heating, °C
250 300 350 400 450 500 550 600
Me
than
e c
on
vers
ion
, %
0204060
80
90
100 140slph
40slph80slph
120slph
Figure 5.5 Stability limit of methane combustion on C1PtLM900 in MQR; QT for Mix1 with
varying the flow rate. CH4 conversion measured in the high conversion branch. Total flow rate of
40slph (blue squares), 80slph (red triangles), 120slph (pink rhombs), 140slph (black circles).
Nevertheless, the worsening in stability observed by further increasing flow rate from 120 to
140slph points out a changing in the combustion quenching mode from extinction to blowout.
Under these conditions, the increase in the gas velocity brings about a decrease in the residence
time in the high temperature zone, due to the drift of the heat wave downstream. Actually,
differently from what already found at lower flow rates, a shift in the position of the maximum
temperature from the centre to the exit of the monolith is observed at Tpre-heating=336°C. Specifically,
at the quenching temperature, T3 is equal to 908°C, significantly higher than T1 and T2, respectively
equal to 428, 861°C. Convection, hence, at a so large flow-rate plays a major role. In addition, an
increased flow velocity reduces gas pre-heating, which is critical for light-off. The result is ignition
further away from the entrance. In confirming with that, at the same pre-heating temperature and
close to the quenching point, entrance temperature detected at QTOT=140slph is about 50°C less
than that obtained in the case of QTOT=120slph. Concerning T2, only a little discrepancy is observed
in the case of the two different flow rates. On the contrary, the exit of the reactor is about 50°C
warmer at QTOT=140slph, thus evidencing a reaction front closer to the exit when an higher flow
rate is considered.
Page 103
Autothermal combustion of CH4 and H2-CH4 mixtures
97
5.3 Effect of the fuel concentration on CH4 combustion stability
On the basis of the above discussed results, there is a maximum beyond which a further increase
in the total flow rate does not involve any improvement in combustion stability because of the
unavoidable combustion blowout. On the contrary, increasing the equivalence ratio of the fuel
mixture is a more effective tool to expand autothermal combustion operation involving an increase
in the input power without affecting gas velocity and, as a consequence, gas residence time and fuel
conversion.
In Figure 5.6 the high conversion branch of Mix2 combustion is shown in terms of T2 (Figure
5.6a) and CH4 conversion (Figure 5.6b) measurements as a function of the pre-heating temperature
and with varying the flow rate. The reported arrows point out observed QT and the window of
stable combustion at the different operating conditions. A comparison between QTs values of Mix1
and Mix2 combustion is reported in Figure 5.7 as a function of the flow rate. Moreover, in Figure
5.8 thermal profiles detected in the case of Mix1 and Mix2 are compared at the same pre-heating
and total flow rate.
Quenching temperature monotonically decreases with increasing flow rate from 40 to 120slph,
thus extending the limits of stable combustion. Specifically, QT is 387, 251, 161, 58, 55°C at a
QTOT respectively equal to 40, 60, 80, 100 and 120slph, showing that stable combustion is sustained
practically with no external pre-heating at the last two flow rates. It is worth noting that when
external preheating is too low it is technically difficult to control set-point temperature of the oven;
as a result, critical temperature measurements are not reliable at the highest flow rate. However, the
critical temperature detected in the case of Mix2 are strongly lower than those obtained in the case
of Mix1 combustion (see Figure 5.7). As a result, a strong increase in combustion stability is
observed increasing the equivalence ratio of the fuel mixture. Considering an higher Φ, in fact,
combustion extinction is kept away because of the increased thermal power compared to the heat
losses (Kaisare et al., 2008). This is clearly shown in Figure 5.8 in which thermal profiles measured
in Mix1 and Mix2 combustion are reported in the case of QTOT=40slph and Tpre-heating=478°C. At the
specified flow rate, such a preheating level corresponds to the critical temperature of Mix1, while
the enhanced stability at an higher Φ is consistent with the increase in the thermal level observed
inside the combustor. In particular, T1, T2 and T3 values increase respectively from 646, 770, 723°C
detected in the case of Mix1 combustion to 749, 867, 775°C corresponding to Mix2 combustion. As
a result, temperature increase is more significant at the inlet section of the reactor suggesting a
reaction front closer to the entrance in the case of combustion under richer conditions. Mix2
combustion provides a maximum temperature at the centre of the reactor (i.e., T2) under all the
Page 104
Catalytic microcombustion for portable electric power generation
98
range of QTOT and Tpre-heating investigated. In particular, as it is shown in Figure 5.6a, the differences
between T2 and Tpre-heating monotonically increases with flow rate approaching the system to
adiabatic conditions.
120slph
600
700
800
900
1000
1100
1200
1300
1400
1500
40slph80slph
100slph
T2,
°C
60slph
50 150 250 350 450 550
Me
tha
ne c
on
vers
ion
, %
0204060
80
85
90
95
100
Tpre-heating, °C
120slph40slph
80slph
100slph 60slph
(a)
(b)
Tad
Figure 5.6 Stability limit of methane combustion on C1PtLM900 in MQR; QT for Mix2 with
varying the flow rate. Temperature and conversion measured in the high conversion branch. (a) T2,
(b) conversion as a function of the pre-heating temperature. Total flow rate of 40slph (blue
squares), 80slph (red triangles), 120slph (pink rhombs), 140slph (black circles); adiabatic
temperature (Tad, green line).
Page 105
Autothermal combustion of CH4 and H2-CH4 mixtures
99
Total Flow Rate, slph
20 40 60 80 100 120 140 160
QT
, °C
50
150
250
350
450
550
Mix2
Mix1
Figure 5.7 Stability limit of methane combustion on C1PtLM900 in MQR; QT for Mix1 (red
triangles) and Mix2 (black circles) with varying the flow rate.
Mix1
Reactor lenght, cm
0.4 0.6 0.8 1.0 1.2 1.4 1.6
Te
mp
era
ture
, °C
600
650
700
750
800
850
900
Mix2
Figure 5.8 Methane combustion on C1PtLM900 in MQR at Tpre-heating=478°C and total flow rate
of 40slph. Thermal profile in the case of Mix1(red triangles) and Mix2 (black circles) combustion
with varying the flow rate.
Moreover, the same behaviour is observed for methane conversion (see Figure 5.6b): in
particular considering a QTOT=120slph, a total fuel conversion is measured supplying a significantly
lower external preheating (about 50°C) compared to that needed to sustain Mix1 combustion (Tpre-
Page 106
Catalytic microcombustion for portable electric power generation
100
heating≈307°C). As a result, a strong improvement of overall combustion efficiency is achieved by
increasing the equivalence ratio of the fuel mixture.
However, by analyzing the trend of Mix2 quenching temperature with QTOT (see Figure 5.7), its
decrease shows a tendency to level off at the highest investigated flow rates. Such a behaviour may
suggest a transition from an extinction to a blowout quenching regime further increasing the flow
rate from QTOT=120slph. If so, it is confirmed that methane combustion is quenched via blowout at
roughly the same flow rate independently on the fuel mixture equivalence ratio.
5.4 Ignition and limits of stable operation in H2-CH4 combustion
In Figure 5.9 the ignition transient of Mix3 at MIT is reported. The experiment has been carried
out at the same flow rate, QTOT=80slph, considered in the Mix1 ignition test. In particular, thermal
profile inside the monolith (Figure 5.9a) as well as CH4 and H2 conversion measurements (Figure
5.9b) are reported as a function of time.
As it was shown for the experiment of Mix1 light-off (see Figure 5.1), in Figure 5.9 it is possible
to distinguish four regions, Zone 1, 2, 3 and 4.
Zone 1 shows the MIT by reporting the thermal profile corresponding to the minimum pre-
heating of the N2-O2 mixture (see Figure 5.9a). MIT is the highest temperature detected along the
catalytic reactor length and, specifically, it is 451°C. Such a value is approximately 80°C lower than
that obtained in the case of Mix1 combustion. As a result, by substituting part of CH4 with H2,
maintaining the same input power to the reactor, enhances the fuel reactivity.
In Zone 2 Mix3 is sent to the reactor. As it is expected, at a pre-heating temperature equal to
451°C, hydrogen is totally converted; H2 conversion, in fact, shows a steep increase from 0 to 100%
as soon as hydrogen is fed to the reactor (see Figure 5.9b), a result expected on the basis of results
obtained in the study of H2 combustion under diluted and isothermal conditions (see Chapter 4) . On
the contrary, the specified preheating temperature is too low to covert significantly methane.
Hydrogen combustion involves an increase in the catalyst temperature; specifically, at t=64min
(delimiting Zone 2), T1, T2 and T3 are respectively 518, 573 and 565°C. Nevertheless, methane
combustion is active at these temperatures. As a consequence, H2 assists thermally CH4 combustion
and both fuels are converted in parallel; therefore, after 64 minutes CH4 conversion is
approximately 8%. Such a behaviour is very different from that observed in the ignition of Mix1: in
that case, in fact, MIT was high enough to start methane combustion and a steep increase in CH4
conversion was observed in Zone 2 (see Figure 5.1). On the contrary, the catalyst is practically
inactive towards methane combustion at 451°C, i.e. at the minimum ignition temperature of Mix3
but in consequence of the thermal rise produced by hydrogen conversion CH4 is partially converted
Page 107
Autothermal combustion of CH4 and H2-CH4 mixtures
101
to CO2 (i.e, methane combustion is thermally assisted by hydrogen): consequently, the increase in
CH4 conversion observed in Zone 2 in the case of Mix3 ignition is slower than that corresponding
to Mix1 .
Tem
pera
ture
, °C
400
500
600
700
800
900
1000
1100
1200
T1
T2
T3
0 40 80 120 160 200 240 280 320
Fu
el
Co
nv
ers
ion
, %
0
20
40
60
80
100 x
H2
time, min
xCH
4
Tad,Mix4
Tad,Mix3
1 2 3 4
(a)
(b)
Figure 5.9 CH4-H2 and H2 combustion on C1PtLM900 in MQR at a total flow rate of 80slph
(τC=49.6 gcat·s·Nl-1
); Light-off of Mix3 at MIT=450°C. Section 1: No fuel is sent to the reactor:
thermal profile for an O2-N2 mixture. Section 2: Ignition dynamics of CH4-H2 fuel. Section 3: Mix4
combustion (a) CH4 (black line) and H2 (red line) conversion measurements. (b) Thermal profile
inside the monolith: T1 (blue line), T2 (red line), T3 (pink line). Adiabatic temperature (Tad) of Mix3
(green line) and Mix4 (cyan line).
Moreover, it is worth noting that in the case of Mix3 ignition, in Zone 2 a maximum temperature
is observed at the centre of the reactor. However, as the time passes, T3 increases faster than T2 until
at t=75min, in the Zone 3, they are practically equal. Such a thermal profile is very different from
that measured in Mix1 ignition where, in the same time region, temperature monotonically
increases along the reactor length (T1<T2<T3, see Figure 5.1). The particular thermal profile
Page 108
Catalytic microcombustion for portable electric power generation
102
detected in Mix3 ignition may be ascribed to un uncoupled proceeding of H2 and CH4 combustion.
Specifically, hydrogen is totally burnt and shows a totally developed reaction front that, as it is
expected, is placed at the centre of the reactor. On the contrary, in Zone 2 methane combustion
proceeds very slowly in the time unit and is responsible for a gradual temperature increase at the
exit of the reactor.
As it has been already found in the light-off of Mix1, after a certain induction time, needed to
further increase the temperature inside the reactor, combustion “run-away” occurs in Zone 3 and a
steep increase in the converted fuel is observed. Moreover, the available power is totally developed
and, as a consequence, system temperature strongly raises approaching adiabatic conditions (see
Figure 5.9a and b). In particular, approximately 200min are needed to observe a fully developed
CH4 light-off and under ignited conditions, T1, T2 and T3 are respectively 735, 920 and 840°C.
Once Mix3 fuel mixture is ignited, Mix4 is fed to the combustor (see Zone 4 in Figure 5.9). As it
is expected, H2 is still totally converted (see Figure 5.9b). Moreover, in agreement with the lower
overall heating value of hydrogen fuel mixture compared to that of Mix3, temperatures strongly
decrease (Figure 5.9a). In particular, at the steady state T1, T2 and T3 are respectively 529, 566 and
549°C. Mix4 fuel combustion actually produces the same thermal power developed by hydrogen in
Mix3 combustion. As a consequence, the thermal profile resulting in Mix 4 combustion at a
preheating temperature equals to Mix3 minimum ignition temperature, represents the effective MIT
of methane in CH4-H2 mixture and it is consistent with the minimum ignition temperature of
methane measured on the same catalyst and at the same flow rate in absence of hydrogen (see
Figure 5.1). These results confirm the role of H2 in thermally assisting CH4 combustion thus
decreasing its MIT. Moreover, temperatures detected in Mix4 combustion, i.e. the temperatures
developed by the co-burnt hydrogen at Mix3 MIT, are higher than those found for CH4 ignition
(30°C higher, compare Zone 1 in Figure 5.1 and in Figure 5.9). This result can be explained keeping
in mind that, with respect to CH4 ignition in Mix1, in Mix3 case methane concentrations is lower;
being partially substituted with H2. Actually, because of the first order of methane combustion
reaction, the conversion doesn’t change with conversion and in the case of the minor equivalence
ratio mixture, fixed the reactor temperature, combustion releases a lower power. As result, in order
to ignite methane in Mix3 an higher reactor temperature is needed.
Mix4 combustion shows a maximum temperature at the centre of the reactor, as it is expected in
a fully developed hydrogen ignition because of the reaction front closeness to the entrance. By
comparing thermal profile detected in Mix4 combustion with that shown by Mix3 in the Zone 2,
where the same amount of hydrogen is converted but most part methane remains unconverted, it is
worth noting that T2 and T3 are lower in the first case. This result can be explained considering that
Page 109
Autothermal combustion of CH4 and H2-CH4 mixtures
103
in Zone 2 methane present in Mix3 is partially converted thus determining a temperature rise at the
exit of the reactor more significant than that observed in zone 4. On the contrary, the temperatures
at the entrance of the catalytic reactor in Zone 4 and Zone 2 are practically the same thus revealing
that the thermal level reached in such a reactor zone is ascribed exclusively to hydrogen
combustion.
It is worth mentioning that maximum temperature detected in Mix4 combustion is only 40°C less
than its adiabatic temperature. Such a difference is significantly lower if compared to those
measured in methane combustion (Mix1 and Mix3) showing a greater adiabaticity of hydrogen
combustion process. The latter, in fact, is sustained at lower temperatures at which the heat
dissipation is very slow because of the decrease in the heat transfer driving force.
In Figure 5.10 Mix1 and Mix3 minimum ignition temperatures are reported as a function of the
fuel mixtures total flow rate. In the case of methane combustion, Mix1, MIT is practically
independent on the flow rate in the limit of the experimental errors. Consistently with the MIT
reported previously in the case of QTOT=80slph, MIT is around 530°C in all the investigated cases.
This result is ascribed to the dual effect of the flow rate on the fuel ignition. From one side by
increasing the flow rate contact time decreases and as consequence fuel conversion decreases too.
However, by increasing the flow rate the input power increases too thus allowing the development
of an higher developed power. According to the experimental results, these two effects are balanced
and increasing the flow rate the same preheating temperature is required for ignition despite of the
lower fuel conversion.
Total Flow Rate, slph
20 40 60 80 100 120 140 160
MIT
, °C
400
450
500
550
600
Mix1
Mix3
Figure 5.10 MIT of CH4 and CH4-H2 combustion on C1PtLM900 in MQR as a function of total
gas flow rate; MIT for Mix3 (red triangles) and Mix1 (black circles).
Page 110
Catalytic microcombustion for portable electric power generation
104
Differently from the case of methane combustion, MIT of CH4-H2 fuel strongly depends on the
flow rate, as it is shown in Figure 5.10. In the case of QTOT=80slph, as already discussed, MIT is
about 450°C (about 80°C lower than MIT of Mix1 fuel). By decreasing the total flow rate till to
QTOT=40slph an increase in the MIT is observed and particularly MIT=500°C, only 30°C lower
than MIT of Mix1 fuel. On the contrary, by increasing the flow rate up to 120slph a decrease in
MIT is observed and particularly MIT=440°C, 90°C lower than MIT of Mix1 fuel. These results
reveal that the promoting effect of hydrogen on methane ignition is more and more substantial with
increasing the gas flow rate. Actually, by increasing the gas flow rate the input chemical potential
increases too. Moreover, H2 combustion is very fast at the investigated temperature (higher than
400°C) and H2 conversion is practically not affected by the contact time being 100% at every gas
flow rate. As a consequence by increasing the flow rate the thermal power released by H2 increases
too and a growing amount of power is available to ignite methane thus determining a decrease in
fuel MIT.
Aside the effect on methane ignition temperature, hydrogen may enhance the stability of the
hydrocarbon combustion.
In Figure 5.11 the quenching temperature measured in the case of Mix3 combustion is compared
to that shown by Mix1 at different flow rates. Based on the obtained results, it is evident that QTs of
Mix1 and Mix3 are practically the same independently on the gas flow rate. Eventual differences in
Mix1 and Mix3 QTs, in fact, are ascribed to experimental error. As a consequence, hydrogen
addiction to methane fuel mixture does not produce a relevant effect on limits of the autothermal
combustion operation. This result reveals that combustion quenching is a phenomena ruled by the
ratio between the developed power via combustion and the power lost. Independently by the
presence of hydrogen, Mix1 and Mix3 are characterized by the same input power and as in both the
cases fuel is totally converted the same power is released via combustion. Moreover, Mix1 and
Mix3 combustion is performed in the same reactor and assuming that the two fuels determine
approximately the same temperatures in the combustor the power lost is also the same. As a
consequence, once the system is ignited and fuel is totally converted thus developing a fixed
thermal power, quenching limits cannot depend on the nature of the fuel and hydrogen addiction to
methane fuel doesn’t produce any promoting effect.
Page 111
Autothermal combustion of CH4 and H2-CH4 mixtures
105
Total Flow Rate, slph
20 40 60 80 100 120 140 160
QT
, °C
200
250
300
350
400
450
500
550
600
Mix1
Mix4
Figure 5.11 Stability limit of CH4 and CH4-H2 combustion on C1PtLM900 in MQR; QT for Mix1
(red triangles) and Mix3 (green squares) as a function of the flow rate.
Page 112
Development of micro-power generators
106
CHAPTER 6
DEVELOPMENT OF MICRO-POWER GENERATORS
Propane fueled catalytic microcombustors are integrated with thermoelectric elements (TEs) thus
constituting micro-device for the electricity production.
The range of produced power is typically low (0÷1 Watt) and consistent with the demand of
portable devices. This aspect makes the use of any external heating system dramatically heavy on
the economy of the process because of an unacceptable decrease in the overall efficiency. However,
the development of a efficient combustion system not subjected to an external preheating is not a
trivial matter. As already discussed in the Chapters 1 and 5, microcombustion operation is strictly
limited due to loss of stability either via extinction or blowout (Ronney, 2003, Norton and Vlachos,
2004, Kaisare and Vlachos, 2007, Kaisare et al., 2008). In confirming with that, the study on
autothermal methane combustion in micro-structured reactors shown in the previous chapter has
pointed out that a minimum preheating level is needed to sustain the process. Moreover,
thermoelectric conversion system abstracts heat from combustion system further reducing the
operating window of the device (Federici et al., 2006).
Based on these considerations, a great attention needs to be devoted to the development of an
appropriate catalytic combustion system. Such an object is pursued by adopting specific solutions in
terms of catalyst and reactor configuration, geometry and wall material such as to have a
sufficiently large operating window of autothermal combustion.
As already discussed in the first chapter, an approach to enhance microcombustion stability is
based on heat-recovery (Vican et al., 2002, Ronney, 2003, Kaisare and Vlachos, 2007, Kuo and
Ronney, 2007, Kim et al., 2007, Ahn et al., 2007, Federici and Vlachos, 2008, Federici et al., 2009).
This strategy is carried out in heat recirculation reactors in which the heat of combustion is
recovered by means of a variable number of channels devoted to the counter current heat exchange.
A n-pass combustor is ideally obtained by folding up a counter current heat recirculation reactor, as
it is shown in Figure 6.1. Under adiabatic conditions, no heat is lost through the reactor wall and the
power generated via combustion is equivalent to the sensible heat of the exhausted gas. On the
contrary, under real conditions part of the combustion heat is transferred to the environment, as it is
described by the equation Eq. VI.1, causing combustion quenching via extinction (Ronney, 2003,
Page 113
Development of micro-power generators
107
Norton and Vlachos, 2004, Kaisare and Vlachos, 2007, Kaisare et al., 2008). An heat-recovery
combustion system determines the decrease in the sensible power of the exhausted gas because of
the heat transferred. As a consequence, assuming the same generated power, according to Eq. VI.1,
the power that is allowed to remove from the system through the reactor wall before combustion
quenching (i.e., the critical heat losses) increases thus improving process stability (Federici and
Vlachos, 2008).
A thermoelectric system integrated with a combustor acts as a converter of the power lost
through the reactor wall into electricity. Actually, TEs are characterized by a certain conversion
efficiency, ηTE (see Eq. VI.2), that increases by increasing the temperature difference between their
hot and cold junctions (see Chapter 1).
An efficient integration of the TEs to the combustor is not a trivial issues. Ideally, the electric
power increases by increasing the heat losses of the combustor, consistently with the limits of
combustion operation. Based on this consideration, an heat recirculation combustor is particularly
suitable for such a kind of application because it involves an increase in the critical heat losses.
Moreover, by increasing the number of gas passing till n+∞ it is possible to maximize the
transferred power to the TEs; particularly, the latter becomes ideally equal to the combustion power
assuming that gas exits from the reactor at room temperature and no power is so lost through the
exhausted.
n=2 n=4n=1
(a) (b) (c)
Figure 6.1 Heat recirculation reactor. (a) 1-pass; (b) 2-pass; (c) 4-pass.
LOST
.
SENS
.
GEN
.
QQQ += Eq. VI.1
LOST
.
TEEL QP ⋅η= Eq. VI.2
Page 114
Catalytic microcombustion for portable electric power generation
108
GEN
.
Q (Combustion power)
SENS
.
Q (Sensible power of the exhausted gas)
LOST
.
Q (Power transferred to the environment through reactor wall)
ELP (Electric power)
TEη (Thermoelectric efficiency)
Nevertheless, electric power does not depend only on the transferred power to TEs but also on
the gas temperature. In order to have an adequate value of thermoelectric efficiency, in fact,
sufficiently high temperature of the TEs hot junction (but compatible with the maximum working
temperature allowed by TEs, see Chapter 1) is needed. Based on this, exhausted gas temperature
and consequently the sensible power need to be sufficiently high.
Such a behaviour suggests a tradeoff regarding the number of gas passing in a heat recirculation
channel. Particularly, it needs to be balanced in order to allow a sufficient heat flux through TEs
(high number of passing is hoped for) but avoid too much lower temperature of the exhausted for
the efficient conversion of thermal to electric power (low number of passing is hoped for).
In this study structured catalytic reactors, in the shape of honeycomb monoliths, have been
prepared and tested for the autothermal combustion of propane/air mixtures using different catalyst
active phases (Pt, LaMnO3, and mixed phases) and monolith porosity (900 and 400 cpsi monoliths).
The role of heat-recirculation on the operating window of self-sustained combustion is investigated
for a 2-pass quartz reactor; the simpler geometry of such a system compared to that of a swiss-roll
reactor (Kuo and Ronney, 2007, Kim et al., 2007, see Chapter 1) enables to obtain fundamental
understanding of the effect of the main reactor parameters, the catalyst and the effect of wall
conductivity on instability mode (extinction and blowout). In particular, concerning with the latter
aspect, no direct experimental validation still exists of an effective improvement of the combustion
stability only in the limit of low conductivity materials (Kuo and Ronney, 2007, Kaisare and
Vlachos, 2007, Federici and Vlachos 2008, Federici et al., 2009, see Chapter 1 for details), despite
the important ramifications for microcombustion.
The main issues involved in the integration of the catalytic combustor with thermoelectric
elements (TEs) are successively discussed. In particular, thermal management of the device is
studied in order to make as efficient as possible such a coupling. At this proposal, the performances
of the generator are evaluated in the case TEs are integrated with both a 2 and 3 pass combustor.
Page 115
Development of micro-power generators
109
6.1 Operating conditions
R1Pt400, R0.5Pt900, R1Pt900, R0.5PtLM900, R0.5PtLM400 and RLM900 catalysts are tested
in HRR and NRR reactors (see 2.1.5 and 3.1.4 paragraphs for details).
As already discussed in the previous chapter, in order to achieve autothermal conditions an high
overall heating value fuel is required. In Table VI.1 the specifics of the considered fuel mixtures are
reported. In particular, the maximum investigated equivalence ratio is Φ~0.5 and corresponds to a
maximum propane concentration not higher than fuel LFL of 2.2%; moreover, such a condition
involves an adiabatic temperature rise of ~1250 °C. Flow rates vary from 36 to 150slph; considering
the number of channels and the gap height of the tested monoliths, the gas velocity (based on inlet
conditions) inside each single channel varies from 1.4 to 5.1 m/s in the case of 400 cpsi and from
0.8 to 2.9 m/s in the case of 900 cpsi monoliths, resulting in a minimum residence time of 10 ms
(inlet conditions).
Table VI.1 Operating conditions adopted in propane/air autothermal combustion tests.
Composition, equivalent ratio, heating value, total flow rate and input power of fuel mixture.
C3H8, % 2.2÷0.9
Air, % 99.1÷97.8
Φ 0.54÷0.22
Heating value, KJ·Nl-1
1.9÷0.8
QTOT 150÷42
Input Power, W
77.1÷8.9
Before a reaction test, each catalyst is reduced for 2 hours at 500 °C in a mixture of hydrogen
(99.99%) and helium (99.998%).
After reduction of the catalyst and system cooling in helium, the reacting mixture is fed to the
reactor. The combustor is then electrically heated until ignition of the reacting mixture occurs,
indicated by a steep increase in the temperature measured at the exit of the catalyst module,
whereupon the heat supply is turned off, and the reactor is left running autothermally.
In this study only the high conversion branch will be shown even if an ignition temperature
range is provided. In particular, Pt/γ-Al2O3 catalysts show the lowest ignition temperature of ~300
°C, whereas for LaMnO3/γ-Al2O3 a temperature as high as 550 °C is needed for light-off. The
Page 116
Catalytic microcombustion for portable electric power generation
110
addition of the same amount of Pt (as in Pt/γ-Al2O3) to LaMnO3/γ-Al2O3 results in an intermediate
ignition temperature of ~450 °C.
Self-sustained (autothermal) combustion was followed by progressively decreasing the
equivalence ratio of the fuel mixture while keeping the total flow rate constant, until the process
quenched at a critical equivalent ratio Φc. Φc is a very good metric of reactor stability for various
configurations studied herein. In the following graphs, the quenching point, associated with a drop
in temperature and conversion, is indicated with vertical arrows.
The catalyst has been pre-treated in a combustion environment up to 850 °C for approximately 6
h. Such a treatment allows stabilization of the catalyst properties. Good reproducibility was found
for each single experiment as proved by the lack of any relevant change in the measured values of
Φc (within experimental error). This finding is consistent with the lack of volatilization indicated by
comparing the Pt loading of fresh and spent catalysts (see discussion above). In addition, no
apparent change in activity was observed after the catalyst was used for several hours
(approximately 100 h), as well as in testing different catalysts with the same nominal properties
(experiments with different monoliths were conducted at least twice).
The temperature inside the central channel of the monoliths is measured via two K
thermocouples (0.5 mm thick). Thermocouples are set close to the inlet (0.5 cm from the entrance
section of gases) and the outlet (0.5 cm from the exit) of the structured catalyst. The position of
thermocouples inside the catalytic reactor is indicated in Figure 3.5 (see chapter 3.0). The
thermocouples are inserted inside the monolith in order to ensure that no outside temperatures are
obtained due to some uncertainty in exactly positioning the thermocouples. In addition, with the
thermocouples being inside the channels, it is avoided temperature measurements that are affected
from radiation. The temperatures of the external quartz tube and the exit gas are also measured in
order to have a rough idea of the reactor thermal profile. The reactor is insulated with Pyrogel
(Aspen Aerogels).
A thermoelectric module is integrated with a catalytic microcombustor according to two
different configurations. In particular, 2pTER and 3pTER electricity generators are studied
considering R1Pt900 catalyst. In 2pTER a thermoelectric module, properly supported on an
aluminum tube, is integrated with HRR; in 3pTER thermoelectric module is directly integrated with
a 3-pass combustor whose external wall is constituted by an aluminum tube (see Chapter 3 for
details). To ensure a good thermal contact between the elements of the generator, the entire
microcombustor/thermoelectric stack is placed under compressive force using a conventional C-
clamp (see Chapter 3 for details). The beneficial effect of such a solution on thermoelectric
performances was shown by Federici et al. (2006).
Page 117
Development of micro-power generators
111
As discussed in the Chapters 1 and 3, according to the Seebeck effect a thermoelectric device
produces an electrical potential obtained multiplying its Seebeck coefficient by the thermal gradient
at which it is subjected. However, a thermoelectric module typically exhibits an internal resistance
Rint. In the case of HZ-2 (see Chapter 3) a value of Rint=4Ω is supplied by Hi-Z Technology, Inc.
even if a value of Rint=5.3Ω is experimentally measured by Federici et al. (2006). In order to test the
performances of thermoelectric it is coupled in series with a resistive device, constituted by a
rheostat. The value of the resistance of the load, RL, is changed perceptually from 0 to 100%. A
voltmeter and ammeter are employed to measure respectively the potential difference, ∆V, at the
ends of the load and electric current in the circuit, i. Power adsorbed by the load, PEL, is thus
derived multiplying i by ∆V; moreover, RL is obtained too by dividing ∆V by i. The electric power
ideally exhibits a maximum in correspondence with RL=Rint=4 Ω; eventual discrepancies are due to
the variation of the internal resistance of the device with the thermoelectric working temperature.
Still, the measurements of the electrical potential at the ends of the rheostat allows to estimate the
Seebeck coefficient of the device (see Chapter 3).
Performance of 2pTER and 3pTER generators are shown in terms of current-voltage
characteristic and PEL with varying the total flow rate and the equivalence ratio of the fuel mixtures.
Moreover, temperature is measured inside the catalyst and in correspondence with the both the hot
and the cold junction of thermoelectric module.
Unless otherwise noted, combustion tests are carried out by considering thermal shields,
upstream and downstream of the catalytic monolith.
6.2 Operating limits of self sustained C3H8 combustion
6.2.1 Effect of heat recirculation
The effect of heat recirculation on propane combustion stability has been studied for the
R1Pt400 catalyst (see Table II.4 for details). Figure 6.2 shows the temperatures near the inlet (TC1)
and outlet (TC2) of the catalyst as functions of the equivalence ratio for the NRR for three flow rates
(indicated) along with the critical equivalence ratio (arrows).
Due to heat losses, the temperatures are much lower than the adiabatic temperature (~1250 °C at
Φ = 0.5 and 1000 °C at Φ = 0.4). It is interesting that on increasing the flow rate, different behavior
is observed upstream and downstream of the monolith (ca. TC1 and TC2). The temperature near the
catalyst exit (TC2), shown in Figure 6.2b, is fairly constant with changing equivalence ratio, and
increases with increasing flow rate. The latter behavior is caused by the increased power input to
the reactor in comparison to heat losses. The temperature near the inlet of the catalyst (TC1), shown
in Figure 6.2a, does not significantly change with flow rate for high equivalence ratios (near Φ ≈
Page 118
Catalytic microcombustion for portable electric power generation
112
0.5), probably because fuel ignition starts very close to the entrance. Actually, the TC1 thermocouple
corresponds to the pre-heating zone of the reactor whose temperature is significantly affected by the
heat transferred from the catalyst (mainly by radiation at relatively high temperatures).
At lower equivalent ratios (Φ < 0.5) (i.e., approaching the quenching point), TC1 decreases with
increasing flow rate, probably due to a decrease the residence time which causes a drift of the
reaction zone downstream. In addition, a higher flow velocity decreases the length for gas pre-
heating, which is necessary for light-off. The result is ignition further away from the entrance. In
fact, an inversion in the position of the maximum temperature is observed when varying the flow-
rate: at 48 and 78slph, the catalyst entrance is warmer than the exit, whereas at 108slph the opposite
is true for all Φs.
108slphTC
1,
°C
300
500
700
900
1100
1300
78slph48slph
(a)
ΦΦΦΦ
0.40 0.43 0.45 0.48 0.50 0.53 0.55
TC
2,
°C
300
500
700
900
1100
1300
108slph
78slph
48slph
(b)
Tad
Tad
Figure 6.2 Non-heat recirculation reactor (NRR): temperatures (a) at the inlet of the catalytic
monolith (TC1) and (b) at the exit of the catalytic monolith (TC2) and quenching (blowout) points
(arrows) at different flow rates (48, 78 and 108 slph) using the R1Pt400 catalyst. Points are
experimental data and lines just guide the eye.
Page 119
Development of micro-power generators
113
With decreasing equivalence ratio, the temperature at the inlet of the catalyst TC1 drops strongly
at all flow rates and more so at faster flows (108slph). In contrast, Ф does not significantly affect
the exit temperature of the catalyst. The weak variability of TC2, while the entrance zone is getting
colder with decreasing Φ, is rationalized with a shift of the hottest catalytic zone downstream in the
reactor.
At higher flow rates this phenomenon is significant and steady state exhibits a very cold inlet
zone: in particular, for the highest investigated flow rate (108slph), upon decreasing Φ from 0.5 to
0.48, the exit temperature increases, whereas the entrance temperature drops abruptly (from more
than 620 to 230 °C). This result reveals also that when a change in a parameter (in this case, Φ)
produces a very cold inlet zone, the reactor becomes less stable, as indicated with the high value of
Φc (0.48 at 108slph).
The critical equivalence ratio varies between 0.43 (for lower flow rates) and 0.48 (for higher
flow rates). The overall dependence on (the rather small variation of) flow rate is rather small. What
is interesting is that self-sustained combustion becomes narrower with increasing flow rate. One can
conclude that in the NRR, an increase in the flow rate decreases combustion stability, despite of the
higher power input. This is because of less preheating of the incoming gas with an associated lower
contact time of the reactants with the high temperature reactor zone. Based on these considerations,
loss in stability in the NRR is caused by incomplete fuel conversion and the system quenches via
blowout (Kaisare et al. 2008).
Figure 6.3 reports the results of combustion in the HRR. The data shows that the critical
equivalence ratio is significantly lower compared to that of the NRR and lies around 0.30-0.35. The
effect of flow-rate on Φc is reversed compared to the NRR. In particular, Φc appears independent of
flow rate at high flow rates and is lower for 108slph than for 48slph. Hence, autothermal operation
expands with increasing flow rate.
Temperature measurements in Figure 6.3 reveal, similarly to the NRR, much lower temperatures
than adiabatic reactor temperature. However, unlike the NRR, an increase in the flow rate increases
both TC1 and TC2, probably due to the increased adiabaticity of the reactor under experimental
conditions that result in complete propane conversion (see below). Moreover, in the HRR, TC1 is
higher than TC2, i.e., the maximum temperature of the catalyst is closer to the inlet under all
conditions investigated. As explained later, this is a result of heat recirculation that allows
stabilization of the reaction front further upstream, creating a wider operating window for self-
sustained combustion.
Page 120
Catalytic microcombustion for portable electric power generation
114
108slphT
C1,
°C
300
500
700
900
1100
1300
78slph
48slph
(a)
ΦΦΦΦ
0.30 0.35 0.40 0.45 0.50 0.55
TC
2,
°C
300
500
700
900
1100
1300
108slph
78slph
48slph
(b)T
ad
Tad
Figure 6.3 Heat recirculation reactor (HRR): temperatures (a) near the inlet of the catalytic
monolith (TC1) and (b) the exit of the catalytic monolith (TC2) along with extinction points (arrows)
at different flow rates using the R1Pt400 catalyst. Points are experimental data and lines just guide
the eye.
Like the NRR, the reaction front downstream when decreasing the equivalence ratio: the near
entrance temperature TC1 (Figure 6.3a) experiences a strong drop near quenching; for 78slph, for
example, the TC1’s drop is ~290 °C when varying Φ from 0.5 to quenching. In contrast, the
temperature at the exit of the catalyst (TC2 in Figure 6.3b) does not significantly change with
equivalence ratio: for 78slph, TC2’s drop is only ~40°C.
In the HRR, increasing the total flow rate or decreasing the equivalence ratio of the fuel/air
mixture does not affect the total fuel conversion. Figure 6.4 shows the propane conversion as a
function of flow rate (Figure 6.4a) and equivalence ratio (Figure 6.4b) in autothermal combustion in
the HRR for the R0.5PtLM400 catalyst. The results show that even with less amount of active
catalyst, the fuel is completely converted for an equivalence ratio equal to 0.5, and its conversion
Page 121
Development of micro-power generators
115
decreases only slightly with decreasing flow rate, remaining higher than 98% in all cases (Figure
6.4a). Figure 6.4a also shows that, in agreement with results discussed above for higher Pt content,
the increase in flow rate is accompanied with an increase in the near exit temperature. Decreasing
the flow rate below 36slph results in quenching as evidenced by a strong drop in both temperature
and fuel conversion. Despite the longer residence time, the decrease of the flow rate is detrimental
for the process because of the low power input compared to heat losses through the reactor wall (the
latter are essentially determined from the maximum temperature reached by the catalyst, which
changes slightly with varying flow rate). This particular instability mode occurs at nearly complete
fuel conversion and, according to published simulations, is described as extinction (Kaisare et al.,
2008).
When decreasing the equivalence ratio of the fuel/air mixture (Figure 6.4b), a more pronounced
decrease of fuel conversion occurs especially at lower flow rates. The changes in the critical
equivalence ratio are smaller than the composition increments employed here for a change to be
detected accurately. The lower critical equivalence ratio with increasing Pt content (compare Figs.
6.3 and 6.4) indicates kinetic limitations near extinction.
The experimental results presented above demonstrate a different quenching mode in the HRR
and NRR. In particular, blowout occurs in the NRR with increasing flow rate due to insufficient
preheating, reaction front shift toward the exit, and a low contact time in the hot temperature zone.
Under these conditions, most of the heat generated by combustion is lost through the exhaust gas. In
the HRR, the recirculation channel preheats the incoming reactants. As a result, complete fuel
conversion occurs even at higher flow rates. These experimental results underscore for the first time
that heat recirculation may change the quenching mode from blowout (NRR) to extinction (HRR).
The above analysis is further confirmed by comparing the HRR and NRR results in Figure 6.5.
As expected, the reaction zone in the HRR is upstream as evidenced from the higher inlet
temperature (TC1) and the lower exit temperature (TC2) compared to those of the NRR. Heat
recirculation allows stabilization of combustion upstream, prevents blowout, and allows self-
sustained combustion of fuel leaner mixtures, as evidenced with the much lower ΦC of the HRR.
Page 122
Catalytic microcombustion for portable electric power generation
116
Total Flow Rate, slph
35 45 55 65 75 85
Pro
pa
ne C
on
vers
ion
, %
0204060
80
85
90
95
100
Exit
Tem
pera
ture
, °C
350
400
450
500
550
Φ = 0.5Φ = 0.5Φ = 0.5Φ = 0.5
(a)
ΦΦΦΦ
0.35 0.40 0.45 0.50 0.55
Pro
pa
ne C
on
vers
ion
, %
0204060
80
85
90
95
100
Exit
Tem
pera
ture
, °C
350
400
450
500
550
78slph
72slph
60slph
(b)
Figure 6.4 Heat recirculation reactor (HRR) using the R0.5PtLM400 catalyst. Propane
conversion (left axis) and near exit gas temperature (right axis) vs. (a) flow rate for an equivalence
ratio of 0.5 and (b) equivalence ratio at different flow rates.
Page 123
Development of micro-power generators
117
HRR
TC
1,
°C
100
200
300
400
500
600
700
800
NRR
(a)
HRR
ΦΦΦΦ
0.30 0.35 0.40 0.45 0.50 0.55
TC
2,
°C
100
200
300
400
500
600
700
800
NRR
(b)
Figure 6.5 Comparison between the heat recirculation reactor (HRR, black filled circles) and
no-recirculation reactor (NRR, red filled triangles) using the R1Pt400 catalyst: (a) temperatures at
the inlet (TC1) and (b) at the exit of the catalytic monolith (TC2) and extinction points at 78slph.
6.2.2 Effect of thermal shields
Thermal shields are commonly used in high temperature combustion and partial oxidation to
prevent heat losses via radiation and flashback (Cimino et al., 2001, Henning and Schmidt, 2002). A
less obvious and discussed effect of thermal shields is that they increase the reactor exposed surface
and, consequently, the heat losses. In microsystems, this enhanced surface area has a detrimental
role in stability, at least of single channels (Kaisare and Vlachos, 2007). It is therefore unclear at
what reactor scale thermal shields actually benefit reactor stability. In addition, the question raised
is whether thermal shields are of any value in the HRR given that the recirculating channels behave
effectively as heat traps.
In order to understand the effect of thermal shields on combustion stability, experiments were
repeated by removing the shields (blank monoliths placed upstream and downstream the catalyst).
Page 124
Catalytic microcombustion for portable electric power generation
118
Figure 6.6 and Figure 6.7 compare respectively the HRR and NRR and results in terms of the
measured temperatures (at the same position in all cases).
NRR
TC
1,
°C
100
200
300
400
500
600
700
800(a)
ΦΦΦΦ
0.45 0.50 0.55
TC
2,
°C
100
200
300
400
500
600
700
800(b)
NRR-NoShields
NRR-1Shield
NRR
NRR-NoShieldsNRR-1Shield
Figure 6.6 Comparison between no-recirculation reactor (NRR) with and without thermal
shields using the R1PT400 catalyst: (a) temperatures at the inlet (TC1) and (b) at the exit of the
catalytic monolith (TC2) and extinction points at 78slph. NRR with both thermal shields (black filled
circles); NRR with no shields (red filled triangles); NRR with only one thermal shield downstream
(blue filled squares).
Removing both thermal shields is detrimental for combustion stability in the NRR (filled black
circles versus filled red triangles, see Figure 6.6). The critical equivalence ratio increases from
approximately 0.45 (with both shields) to 0.48 (absence of shields). The higher inlet temperature
(Figure 6.6a) and lower outlet temperature (Figure 6.6b) in the presence of shields suggests a
significant role of the shields in allowing stabilization of the reaction front further upstream.
Thermal shields upstream and downstream of the reactor may have multiple roles. A blank
Page 125
Development of micro-power generators
119
monolith upstream of the catalyst could increase the pre-heating length improving, as a
consequence, combustion efficiency and stability. At the same time, a blank monolith downstream
of the catalyst can trap heat decreasing the heat losses through the exhaust gas. Both these effects
could affect combustion. In order to understand which of the two shields prevails, combustion tests
have been carried out by removing only one shield (upstream). The results of Figure 6.6a (filled
blue squares) show that both the critical equivalence ratio and the temperatures are not significantly
affected by the presence of only the blank monolith downstream of the catalyst: the slightly larger
(up to ~50 °C) temperature lies within the range of the experimental error. On the basis of this
result, one may conclude that the role of the thermal shields in improving the stability of
combustion is to trap the heat, mainly by decreasing the sensible heat losses through the exit gas.
HRR
TC
1,
°C
100
200
300
400
500
600
700
800(a)
HRR
ΦΦΦΦ
0.30 0.35 0.40 0.45 0.50 0.55
TC
2,
°C
100
200
300
400
500
600
700
800(b)
HRR-NoShield
HRR-NoShield
Figure 6.7 Comparison between the heat recirculation reactor (HRR) with and without thermal
shields using the R1Pt400 catalyst: (a) temperatures at the inlet (TC1) and (b) at the exit of the
catalytic monolith (TC2) and extinction points at 78slph. HRR with both thermal shields (black filled
circles); HRR with no shields (red filled triangles).
Page 126
Catalytic microcombustion for portable electric power generation
120
For the HRR, shield removal shifts the reaction front downstream, as demonstrated from the
higher entrance (Figure 6.7a) and lower exit temperatures (Figure 6.7b) in the presence of both
thermal shields. Unlike the NRR, removal of both blank monoliths in the HRR does not affect the
critical equivalence ratio (within the composition increment taken). This result is consistent with the
role of the thermal shields previously described: in the HRR, most of the sensible heat is recovered
through the recirculation channels, minimizing the role of shields in combustion stability.
6.2.3 Effect of the monolith cell density
The effect of monolith cell density on HRR stability has been investigated using the R1Pt
catalysts. In particular 900 and 400 cpsi monoliths have been compared with the same overall
burner dimensions. Figure 6.8 compares the near entrance temperatures of the two catalysts at
autothermal conditions. The R1Pt900 (900 cpsi) substrate shows a critical equivalence ratio much
smaller than that of the R1Pt400 (0.22 vs. 0.32) under the same experimental conditions. To further
confirm the beneficial effect on combustion stability achieved with the higher cell density monolith,
it is worth mentioning that is not possible to stabilize combustion in the case of LaMnO3/γ-Al2O3
catalysts with 400 cpsi substrates while this is possible with 900 cpsi substrates (data not shown).
R1Pt900
ΦΦΦΦ
0.15 0.20 0.25 0.30 0.35 0.40 0.45 0.50 0.55
TC
1,
°C
100
200
300
400
500
600
700
800
900
R1Pt400
Figure 6.8 Effect of monolith porosity on heat recirculation reactor (HRR) combustion stability
in the case of R1Pt catalysts: temperature measurements at the inlet of the catalyst and extinction
points at 78slph. R1Pt900 (black circles); R1Pt400 (red triangles).
The reason for the enhanced stability could be related to the larger amount of catalyst deposited
and/or the faster mass transfer due to narrower channels. It is interesting to note that the higher the
Page 127
Development of micro-power generators
121
monolith density is, the lower the temperature near quenching is (e.g., TC1 ~200 °C vs. ~400°C for
900 and 400 cpsi monoliths, respectively). This finding may be important for low temperatures
applications, e.g., integration of microburners with thermoelectrics.
6.2.4 Effect of active phase
Figure 6.9 shows the effect of different catalysts (R1Pt900, R0.5Pt900, R0.5PtLM900 and
RLM900) on performance.
Pt/γ-Al2O3 catalysts (R1Pt900 and R0.5Pt900) exhibit the lowest ΦC and the platinum loading
affects significantly the operating range of autothermal propane/air combustion. By approximately
doubling the noble metal loading on alumina, the critical equivalence ratio decreases from ~0.27 to
0.22. The inlet temperature (TC1, in Figure 6.9) is approximately the same for equivalence ratios
higher than 0.35, where complete fuel conversion is expected for both systems, regardless of the
amount of Pt. For an equivalence ratio lower than 0.35, lower temperatures are observed in the 0.5-
Pt-900 catalysts. This evidence could be attributed to the lower activity of the R0.5Pt900 catalyst
compared to that of the R1Pt900, resulting in a lower generated power at the same equivalence ratio
and consequently in a higher ΦC.
ΦΦΦΦ
0.20 0.25 0.30 0.35 0.40 0.45 0.50 0.55
TC
1,
°C
100
200
300
400
500
600
700
800
900
R1Pt900
R0.5Pt900
R0.5PtLM900
RLM-900
Figure 6.9 Effect of the active phase on the heat recirculation reactor (HRR) combustion
stability: temperatures at the inlet of the catalyst and extinction points at 78slph. RLM900 (green
diamonds); R0.5PtLM900 (black circles); R1Pt900 (blue squares); R0.5Pt900 (red triangles).
The RLM900 catalyst (green diamonds in Figure 6.9) results in lower reactor stability (critical
equivalence ratio is ~0.42, much higher than that on Pt/γ-Al2O3 systems). Furthermore, for all
Page 128
Catalytic microcombustion for portable electric power generation
122
equivalence ratios, the inlet catalyst temperature is also significantly lower (for Φ = 0.5, by ~450°C)
than that on Pt/γ-Al2O3. The lower intrinsic activity of perovskite leads to stabilization of the
reaction zone much closer to the exit, leading a very low inlet temperature.
Figure 6.10 (black open circles) shows the thermal profile for the perovskite catalyst. TC1 is
compared with the other temperature measurements performed on the external quartz tube of the
HRR. In particular, the very high temperature measured at the end of the reactor, at the turn of the
gas flow direction, highlights that the hottest zone for RLM900 is near the exit.
The addition of ~0.6 wt% Pt to perovskite (R0.5PtLM900, black circles in Figure 6.9) enhances
the operating range of autothermal propane combustion compared to the RLM900 catalyst. In
particular, the critical equivalence ratio decreases from 0.42 (un-promoted perovskite) to 0.35 (Pt-
containing perovskite). Pt addition to the perovskite strongly increases TC1, resulting in the reaction
front moving upstream and, consequently, in a higher intrinsic activity. Figure 6.10 compares the
HRR thermal profile for R0.5PtLM900 catalyst (open blue squares) and RLM900 (open green
circles), providing further evidence of the change in the location of the reaction front.
Φ=0.5Φ=0.5Φ=0.5Φ=0.5
Reactor Lenght, cm
0 1 2 3 4 5 6 7 8 9 10 11
Tem
pe
ratu
re,
°C
100
200
300
400
500
600
700
800
900
R0.5PtLM900
RLM900
Catalyst
Shield
1
2
3
4
3
1
2
4
1 2
34
Figure 6.10 Thermal profile along the heat recirculation reactor (HRR): comparison between
RLM900 (green circles) and R0.5PtLM-900 (blue squares) at a total flow rate of 78slph and Φ=0.5.
Temperature at the inlet of the catalyst (position 1), on external quartz tube at the turn of the gas
flow direction (position 2), on external quartz tube at the catalyst (position 3), and the exit of the
HRR (position 4).
Page 129
Development of micro-power generators
123
The maximum temperature in the R0.5PtLM900 catalyst, which is approximately the same in the
promoted and un-promoted perovskites, has moved upstream. Furthermore, for an equivalence ratio
~0.5, the inlet temperature of the R0.5PtLM900 catalyst is comparable to that of Pt/γ-Al2O3 (Figure
6.9), resulting from complete conversion for all the Pt-based catalysts. For an equivalence ratio
lower than 0.5, Pt-LaMnO3 catalyst temperatures are lower than those of Pt/γ-Al2O3 with the same
platinum loading, consistent with the larger ΦC of the Pt-LaMnO3 catalysts. Pt exhibits lower
activity when dispersed on the perovskite matrix compared to alumina. Such a behaviour of the
mixed phase catalyst has already been observed in the case of hydrogen oxidation (see Chapter 4)
and was traced back to the different dispersion or migration of Pt inside the perovskite structure,
effectively reducing the amount of noble metal available for reaction.
Finally, it is worth mentioning that for all the tested 900 cpsi catalysts, despite different values of
ΦC, the near entrance temperature before quenching is ~200 °C. This temperature may indicate a
thermal threshold for self-sustainability of the process resulting from the balance of thermal power
generated and heat loss through the reactor wall.
6.3 Performances of electricity generators
2pTER and 3pTER are tested using R1Pt900. As already reported in the Chapter 3, in these
experiments thermal shields are not employed.
In the next two paragraphs the results are presented and discussed.
6.3.1 2pTER performances
In Figures 6.11, 6.12, 6.13 and 6.15 performances of propane fueled 2pTER generator are shown
with varying the total flow rate. A fuel mixture is sent to the device with an equivalent ratio equal to
0.5 and a total flow rate varying in the range of QTOT=80÷150slph.
Once ignited fuel is efficiently converted in the reactor and high temperatures are sustained by
the system (see Figure 6.11a). Due to the heat losses temperature level inside the catalyst is lower
than that under adiabatic conditions. TC1 measured in the case of 2pTER is compared with that
exhibited by HRR using R1Pt400. Even if the latter has been tested under different experimental
conditions (a 400cpsi monolith is employed and thermal shields are used) by such a comparison it is
possible to estimate the role on the thermal profile of thermoelectric integration with the combustor.
In order to validate the above-mentioned affirmation it is worth noting that at Φ=0.5 (i.e., far from
combustion quenching) thermal profile inside the reactor is not affected by the porosity of the
monolith (see Figure 6.8). TC1 detected in 2pTER is significantly lower than that measured in the
case of HRR (see Figure 6.11a). Considering a QTOT=78slph TC1 is 773 and 742°C respectively in
Page 130
Catalytic microcombustion for portable electric power generation
124
the case of HRR and 2pTER reactor, while at QTOT=108slph TC1 is respectively 814 and 755°C.
Such a result reveals the inevitable enhancement in the heat losses shown by such a coupling. Still,
analyzing TC1 trend in the case of 2pTER it is evident the presence of a maximum. For
80slph<QTOT<90slph, in fact, TC1 increases with the total flow rate while such a tendency is
inverted at QTOT>90slph. This behaviour is due to the twofold effect of the flow rate that provides
more input power but at the same time involves a decrease in the residence time (see Chapter 5).
Specifically, in a range of low gas velocity, such as to guarantee a sufficient contact time, a
temperature level enhancement is observed by increasing flow rate; nevertheless, in a range of gas
velocity not more compatible with the total fuel conversion, a shift of the reaction zone towards the
exit is observed thus causing a cooling of the reactor entrance. The presence of a maximum in TC1
exhibited by 2pTER with varying QTOT is consistent with the results obtained in the combustion test
on MQR using C1PtLM900 catalyst (see Figure 5.4) and suggests a changing in the dynamics of
combustion quenching from extinction (at low flow rate) to blowout (at high flow rate, Kaisare and
Vlachos, 2007, Kaisare et al., 2008). On the contrary, the same dependence of TC1 didn’t result in
combustion tests on HRR (see Figure 6.3 and Figure 6.11a). Specifically, the inlet temperature
monotonically increased with the total flow rare and, differently from tests on 2pTER, a maximum
wasn’t observed. Actually, HRR behaviour is consistent with a combustion quenching via
extinction in the whole field of QTOT investigated. Such a result reveals that the integration of a
thermoelectric module with HRR has caused a changing in the dynamics of combustion quenching.
In particular, 2pTER compared to HRR is less robust as regards combustion stability and is more
vulnerable to blowout.
The heat produced via combustion is transferred to thermoelectric module through the reactor
walls and a temperature gradient is generated between the hot and cold junctions. In Figure 6.11b
the temperatures of the hot and cold junctions of TEs are reported as a function of the flow rate. TEs
temperature is significantly lower than that of the monolith thus evidencing the high resistance to
heat transfer along the transverse direction of the device. In particular, under the investigated
conditions THOT and TCOLD maximum values are respectively 175 and 117°C. The temperatures of
thermoelectric junctions increase with QTOT due to the increase in the power released by
combustion. Nevertheless, hot junction temperature increase is steeper than that exhibited by the
cold one. THOT-TCOLD, in fact, increases with the flow rate and, specifically, it is 49 and 74°C
respectively at QTOT=80 and QTOT=150slph (see Figure 6.11b).
The thermal gradient generated between the hot and cold side of the thermoelectric module is
converted in an electrical potential according to Seebeck effect (see Chapter 1). Moreover, when the
module is coupled in series with a resistive load a current, i and an electric power, given by
Page 131
Development of micro-power generators
125
multiplying such a current by the electrical potential, are generated by the device (see Chapter 1 and
3). In Figure 6.12 the current, i and the electric power, PEL, are shown as a function of the electrical
potential, ∆V, with varying the total flow rate. Such a graph is obtained by changing the resistance
of the load, RL, thus simultaneously varying i and ∆V in the electrical circuit. In particular, by
decreasing RL, the detected electrical potential decreases too while the current increases. Analyzing
Figure 6.12a, at QTOT=150slph the detected current is 450 and 22 mA respectively at the minimum
and the maximum considered resistance of the load. Concerning ∆V, at the same RL values it is
respectively 0.2 and 2.2 V.
Considering Figure 6.12b, PEL shows a typical bell-like shape. Moreover, by increasing QTOT the
electrical power also increases due to the increase in the temperatures difference between the TEs
hot and cold junctions. The maximum value of PEL is not detected exactly in correspondence of RL
equal to the value of the internal resistance reported in literature (Rin≈4Ω, supplied by Hi-Z
Technology, Inc. and Rin≈5.3Ω measured by Federici et al., 2006); moreover, RL at which a
maximum electrical power is observed slightly changes with varying the flow rate of the fuel
mixture. Actually, by changing QTOT the system temperature changes too, as it has already reported;
however, a temperature variation affects the internal resistance of TEs thus altering RL value
corresponding to the maximum PEL. In the present experimental campaign the maximum PEL has
been detected at RL=4÷6Ω.
Table VI.2 Performances of Propane fueled (Φ=0.5) 2pTER and 3pTER generators run under
conditions guaranteeing maximum PEL.
QTOT
slph
TC1
°C
THOT
°C
TCOLD
°C
THOT-TCOLD
°C
PEL
W
PINPUT
W
η
%
∆V
V
i
mA
R
Ω
α
mV·K-1
2pTER
Max PEL 150 717 175 101 74 0.29 72 0.40 1.1 265 4.1 0.30
3pTER
Max PEL 110 697 158 93 65 0.20 52 0.38 1.1 186 5.8 0.34
In Table VI.2 are resumed the data measured in the case 2p-TER is run under conditions
guaranteeing the maximum electric power developed. In particular, in this table is pointed out the
Seebeck coefficient, α, exhibited in average by each thermocouple constituting HZ-2 module in the
combustion tests. The measured value, α≈0.30, is roughly in agreement with α value reported in
Page 132
Catalytic microcombustion for portable electric power generation
126
literature for HZ-2 thermocouple (α≈0.28, Federici et al., 2006) thus highlighting an acceptable
experimental error in the values of the quantities measured.
TC
1,
°C
650
700
750
800
850
THOT
Total Flow Rate, slph
40 60 80 100 120 140 160
Te
mp
era
ture
, °C
60
80
100
120
140
160
180
200
TH
OT-T
CO
LD,
°C
20
40
60
80
100
TCOLD
THOT-TCOLD
(a)
(b)
2pTER
HRR,R1Pt400
Figure 6.11 Performances of propane fueled (Φ=0.5) 2pTER generator with varying
QTOT=80÷150slph. (a) Temperature measured on the catalyst: T1 in the case of 2pTER (filled black
diamonds) and in the case of HRR using R1Pt400 catalyst (open blue diamonds); (b) Cold junction
(dark blue filled triangles) and hot junction (red filled circles) temperatures (left axis); temperature
difference between hot and cold junction (right axis, cyan filled squares).
Page 133
Development of micro-power generators
127
QTOT=80slph
∆∆∆∆V, Volt
0.0 0.5 1.0 1.5 2.0 2.5
PE
L,
W
0.00
0.05
0.10
0.15
0.20
0.25
0.30
0.35
QTOT
=150slphΦΦΦΦ=0.5
i, m
A
0
100
200
300
400
500
QTOT=80slph
QTOT
=150slph
ΦΦΦΦ=0.5 (a)
(b)
Figure 6.12 Propane fueled (Φ=0.5) 2pTER generator performances. (a) Current in the
electrical circuit and (b) electric power developed as a function of the potential differences at the
ends of the rheostat with varying the total flow rate. QTOT=80slph (dark pink circles); QTOT=90slph
(dark red circles); QTOT=100slph (dark green circles); QTOT=110slph (blue circles); QTOT=120slph
(pink circles); QTOT=140slph (red circles); QTOT=150slph (black circles).
In Figure 6.13 the maximum value of PEL (in correspondence with RL=4-6Ω) is reported as a
function of the flow rate and it is compared with the total power input (obtained by multiplying the
overall heating value of fuel mixture by the total flow rate). The ratio between PEL and PINPUT gives
the the overall efficiency of the device, η, that is also shown (see the righ axis of Figure 6.13). As
already reported, PEL increases by increasing QTOT. In particular, it is approximately 0.1 and 0.3W
respectively at QTOT=80 and QTOT=150slph. However, as it is expected, an increase in the total flow
rate determines a linear increase in the input power; specifically PINPUT is 38 and 72W respectively
at QTOT=80 and QTOT=150slph, resulting in an overall efficiency that, at the same QTOTs, is
respectively 0.24 and 0.4%. The enhancement of the overall efficiency is due to the steeper increase
Page 134
Catalytic microcombustion for portable electric power generation
128
(more than linear) in PEL compared to that of PINPUT by increasing the total flow rate. More
specifically, this behaviour is found up to QTOT=140slph; further increasing the total flow rate the
overall efficiency is unchanged attesting that under these conditions PEL increases linearly with
QTOT. Such a twofold dependance of PEL on QTOT (more than linear at QTOT<140slph, almost linear
at QTOT≥140slph) is ascribed to the shift of the reaction front (i.e., the hottest temperature zone)
towards the exit of the reactor with icreasing the total flow rate. Actually, at the highest QTOT the
combustion hot zone may be pushed out from the sphere of action of thermoelectric thus involving
a decrease in the in the generated electric power.
PINPUT
Total Flow Rate, slph
60 80 100 120 140 160
Po
we
r, W
0.0
0.1
0.2
0.3
0.4
0.5
20.0
40.0
60.0
80.0
100.0
η,
%η
, %
η,
%η
, %
0.0
0.2
0.4
0.6
0.8
1.0
PEL
ηηηη
Figure 6.13 Propane fueled (Φ=0.5) 2pTER generator performances. Overall device efficiency
with varying the total flow rate. Input power (red line, left axis); Electric power developed at
RL=Rin≈4÷6Ω (dark black triangles, left axis); Overall efficiency (open cyan squares, right axis).
In Figure 6.14 the performances of 2pTER are reported with varying the equivalence ratio of the
fuel mixture. In particular, compared to Φ=0.5 till now considered, the equivalence ratio is
decreased maintaining the same total flow rate, QTOT=140slph. By decreasing Φ the input power
decreases too. Despite of such a decrease, the produced electrical power is practically unchanged.
This result is ascribable to the shift of the reaction front (i.e., the hottest temperature zone) towards
the exit of the reactor with decreasing the equivalence ratio (see paragraph 6.2.1). Actually, the
combustion reaction front moving along the combustor may stabilize in a region in which the heat
exchange with thermoelectric module is more favourable thus determining a more efficient use of
Page 135
Development of micro-power generators
129
the power released by combustion and of the fuel. The maximum efficiency is detected at Φ=0.4
and it is about 0.5%. Under these conditions, PEL=0.27W, i=250mA and ∆V=1.1V.
Furthermore, it is not possible to sustain combustion at an equivalence ratio lower than Φ=0.4.
ΦC shown by 2pTER is thus much lower in comparison with that exhibited by HRR considering the
same catalyst (i.e., ΦC=0.22, see Figure 6.9). Even if HRR critical equivalence ratio was measured
at different experimental conditions, specifically at a significantly lower total flow rate (i.e,
QTOT=78slph) and with the use of thermal shields, the strongly lower ΦC also confirms the
worsening in combustion stability in consequence of the integration of TEs.
PINPUT
ΦΦΦΦ
0.38 0.40 0.42 0.44 0.46 0.48 0.50 0.52
Po
we
r, W
0.0
0.1
0.2
0.3
0.4
0.5
20.0
40.0
60.0
80.0
100.0
η,
%η
, %
η,
%η
, %
0.0
0.2
0.4
0.6
0.8
1.0
PEL
ηηηη
Figure 6.14 Propane fueled (QTOT=140slph) 2pTER generator performances. Overall device
efficiency with varying the equivalence ratio. Input power (red line, left axis); Electric power
developed at RL=Rin≈4÷6Ω (dark black triangles, left axis); Overall efficiency (open cyan squares,
right axis).
6.3.2 3pTER performances
2pTER performances show the feasibility of an electricity generator based on the coupling of a
combustor with a thermoelectric module. However, the low electrical power developed compared to
the total input power induces to find out a more efficient coupling configuration.
In Figure 6.15 the temperature of TEs hot junction is compared with that of the exhausted gas
(gas exiting from the device) as a function of the total flow rate in the case of 2pTER generator. It is
worth noting that TOUT is significantly higher that THOT; in particular, TOUT is 310 and 245°C at
QTOT=150 and QTOT=100slph respectively and, in all the range investigated it is 150°C higher than
Page 136
Catalytic microcombustion for portable electric power generation
130
THOT on average. Such a behaviour points out that much sensible heat may be still transferred
transversally to TEs and the electric power developed may ideally increase. In order to further
decrease the sensible power of the exhausted gas in advantage of the power lost through the reactor
walls the gas flow may be forced in an additional channel devoted to the counter current heat
exchange thus constituting the 3pTER.
Total Flow Rate, slph
60 80 100 120 140 160
Te
mp
era
ture
, °C
50
100
150
200
250
300
350
THOT
TOUT
Figure 6.15 Performances of propane fueled (Φ=0.5) 2pTER generator with varying
QTOT=80÷150slph. Temperature measured at the exit of the reactor (filled black circles) and on TEs
hot junction (red filled triangles).
The same experiments previously discussed for 2pTER have been carried out on 3pTER. In
Figures 6.16, 6.17 and 6.18 the performance of 3pTER are shown with varying the total flow rate of
the fuel mixture. In particular, in Figure 6.16a the temperature measured at the inlet of the monolith
is reported. Due to the heat losses temperature level inside the catalyst is lower than that expected
under adiabatic conditions. Moreover, TC1 detected in 3pTER is significantly lower than that
measured in the case of 2pTER under the same experimental conditions. In confirming with that, at
QTOT=78slph TC1 is 692 and 742°C respectively in the case of 3pTER and 2pTER reactor, while at
QTOT=110slph TC1 is respectively 697 and 755°C. Actually, 3pTER is a much more dissipative
system compared to 2pTER. The former, in fact, is constituted by a much larger aluminum tube
compared to that used in the case of 2pTER (in 3pTER Al tube is the external wall of the device, in
2pTER, instead, it is employed only to support TEs, see Chapter 3) thus exhibiting much higher
heat losses. Moreover, analyzing TC1 trend also in the case of 3pTER it is evident the presence of a
Page 137
Development of micro-power generators
131
maximum at around QTOT=90slph. Such a result confirms that the integration of a thermoelectric
module with HRR causes a changing in the dynamics of combustion quenching and, more
specifically, makes the combustion system more vulnerable as regards blowout.
T
C1
, °C
600
650
700
750
800
850
THOT
Total Flow Rate, slph
40 60 80 100 120 140 160
Te
mp
era
ture
, °C
40
60
80
100
120
140
160
180
TH
OT-T
CO
LD,
°C
20
40
60
80
100
TCOLD
THOT-TCOLD
(a)
(b)
3pTER
2pTER
Figure 6.16 Performances of propane fueled (Φ=0.5) 3pTER generator with varying
QTOT=50÷110slph. (a) Temperature measured on the catalyst: T1 in the case of 3pTER (filled black
diamonds) and in the case of 2pTER (filled blue hexagons); (b) Cold junction (dark blue filled
triangles) and hot junction (red filled circles) temperatures (left axis); temperature difference
between hot and cold junction (right axis, cyan filled squares).
In Figure 6.16b the temperatures of TEs hot and cold junctions are reported as a function of the
flow rate in the case of 3pTER. Under the investigated conditions THOT and TCOLD maximum values
are respectively 158 and 93°C. The temperatures of thermoelectric junctions increase with QTOT due
to the increase in the power released by combustion. Nevertheless, hot junction temperature
Page 138
Catalytic microcombustion for portable electric power generation
132
increase is steeper than that exhibited by the cold one. THOT-TCOLD, in fact, increases with the flow
rate and, specifically, it is 38 and 65°C respectively at QTOT=50 and QTOT=110slph (see Figure
6.16b).
In Figure 6.17 the current, i and the electric power, PEL, are shown as a function of the electrical
potential, ∆V, with varying the total flow rate. As reported previously, the simultaneous variation of
i and ∆V is obtained by varying the resistance of the rheostat (RL). Analyzing Figure 6.17a, at
QTOT=110slph the detected current is 390 and 18 mA respectively at the minimum and the
maximum considered resistance of the load. Concerning ∆V, at the same RL values it is respectively
0.2 and 1.8 V.
QTOT=50slph
∆∆∆∆V, Volt
0.0 0.2 0.4 0.6 0.8 1.0 1.2 1.4 1.6 1.8 2.0
PE
L,
W
0.00
0.05
0.10
0.15
0.20
0.25
QTOT
=110slphΦΦΦΦ=0.5
i, m
A
0
100
200
300
400
500
QTOT=50slph
QTOT
=110slph
ΦΦΦΦ=0.5(a)
(b)
Figure 6.17 Propane fueled (Φ=0.5) 3pTER generator performances. (a) Current in the
electrical circuit and (b) electric power developed at the ends of the rheostat with varying the total
flow rate. QTOT=50slph (dark green circles); QTOT=80slph (blue circles); QTOT=90slph (pink
circles); QTOT=100slph (red circles); QTOT=110slph (black circles).
Page 139
Development of micro-power generators
133
Considering Figure 6.17b, as it is expected PEL shows a typical bell-like shape (as already found
for 2pTER generator 3pTER exhibits the highest PEL in correspondence with RL=4÷6Ω) and it
increases by increasing QTOT. Resuming, the test performed on 3pTER generator have shown that
the maximum PEL is detected at the highest total flow rate investigated (QTOT=110slph) and it is
PEL=0.2W; under these conditions, i=186mA and ∆V=1.1V. In Table VI.2 the electrical
performances of 3pTER are reported and compared with those exhibited by 2pTER.
In Figure 6.18 the maximum PEL (in correspondence with RL=4÷6Ω) and the overall efficiency
obtained for 3pTER generator are reported as a function of the flow rate and they are compared
with the corresponding values exhibited by 2pTER. Concerning 3pTER performances, as already
reported, PEL increases by increasing QTOT. In particular, it is approximately 0.07 and 0.20W
respectively at QTOT=50 and QTOT=110slph. However, as it is expected, an increase in the total flow
rate determines a linear increase in the input power; specifically PINPUT is 24 and 52W respectively
at QTOT=50 and QTOT=110slph (data not shown), resulting in an overall efficiency that, at the same
QTOTs, is respectively 0.29 and 0.38%. The enhancement of the overall efficiency confirms that PEL
increases more than linearly (the increase is thus steeper than that exhibited by PINPUT) by increasing
the total flow rate. More specifically, this behaviour is found up to QTOT=100slph; further
increasing the total flow rate the overall efficiency slightly decreases revealing that under these
conditions PEL increases less than linearly with QTOT. Resuming, the tests performed on 3pTER
have shown that the highest efficiency is detected at QTOT=100slph and it is η=0.39%; under these
conditions, PEL=0.18W, i=260mA and ∆V=1.0V.
Comparing 2pTER and 3pTER performances (see Figure 6.18) it is worth noting that it is
possible to distinguish two regions in dependence on the total flow rate. In particular at
QTOT<110slph 3-pass generator shows higher electric power developed and overall efficiency while
at QTOT>110slph 2-pass generator exhibits higher performances. Such a behaviour reveals that
passing from a 2-pass to a 3-pass configuration is an effective tool to improve generator
performances. Based on this result, 3pTER allows to increase the heat transferred to TEs through
the reactor walls but maintaining exhausted gas temperature sufficiently high for an efficient
thermal to electrical power conversion. However, the obtained result highlights another important
issue in combustor-TEs coupling that was not taken into account up to now. As already reported, by
increasing the number of reactor gas passes the heat transferred to TEs increases too due to the
increase in the power lost through the reactor walls to the detriment of exhausted gas sensible
power. However, the heat effectively transferred to TEs is a part of the total power lost trough the
reactor walls (Federici et al., 2006): most of such a power is, in fact, transferred to the environment
thus not involving any improvement in the generator performances but only causing a worsening in
Page 140
Catalytic microcombustion for portable electric power generation
134
combustion stability. As a consequence, even if 3pTER is ideally more efficient than 2pTER it is
more vulnerable as regards blow out and it effectively exhibits higher performances only in a range
of low flow rate.
Moreover, 3pTER shows a ΦC≈0.5, much lower than that detected in the case of 2pTER
(ΦC≈0.4). Such an experimental evidence is a further confirmation of the lower robustness as
regards combustion stability exhibited by 3pTER.
As a result, in order to find out an optimum configuration in the design of a electricity generator
based on combustor-TEs coupling it is needed to consider the efficiency with which the power lost
through the reactor walls is transferred to TEs rather than to the environment and its dependence on
the number of reactor passes.
Total Flow Rate, slph
40 60 80 100 120 140 160
η,
η,
η,
η, %
0.0
0.1
0.2
0.3
0.4
0.5
3pTER 2pTER
PE
L,
W
0.0
0.1
0.2
0.3
0.4
0.5
3pTER
2pTER
(a)
(b)
Figure 6.18 Propane fueled (Φ=0.5) 3pTER generator performances with varying the total flow
rate. (a) Maximum PEL at RL=Rin≈4÷6Ω; (b) overall device efficiency. PEL obtained for 2pTER
(filled black triangles) and for 3pTER (filled red circles); Overall efficiency obtained for 2pTER
(filled black diamonds) and for 3pTER (filled red squares).
Page 141
Conclusions
135
CHAPTER 7
CONCLUSIONS
In the present Ph. D. thesis the main issues in catalytic micro-combustion have been
experimentally explored. The study has dealt with the development of novel micro-structured
combustors and has provided for an investigation on process efficiency, kinetics and operating
windows. Hydrogen, propane and methane based fuels have been taken into account; moreover,
hydrogen assisted combustion of methane is considered too. Platinum, perovskite and mixed phase
γ-alumina supported catalysts have been investigated. Still, different reactors have been designed:
particularly, single micro-channel and multi-channels monolithic reactors were employed
respectively in isothermal and autothermal combustion tests. Such a study has constituted the
background in the development of electricity generators constituted by catalytic microcombustors
integrated with thermoelectric converters. Particularly, micropower generators constituted by novel
2 and 3-pass heat recirculation quartz micro-combustors are investigated.
Micro-structured catalytic reactors have been developed starting from high thermally stable and
relatively cheap inert substrates in the shape of monoliths and platelets. Differently from monoliths
whose employment in catalytic combustion is well-established, planar substrates constitute an
innovative solution which is having a strong resonance in micro-system applications. A deposition
technique of catalytic layers on platelets has been set up; it is found a good repeatability in the
preparation of structured catalysts highly resistant and well anchored on substrate of different
materials and specifically of α-alumina and FeCralloy.
The combustion tests have been carried out taking into account two different configurations. In a
first kind of approach to the micro-combustion problem, thermal effects have been insulated from
fluid dynamics, mass transfer and reactive phenomena, so that combustion has been studied under
strongly diluted and temperature controlled conditions in isothermal planar reactors. For this kind of
reactor configuration the fluid dynamics is well known and has revealed a fully developed laminar
regime. Under these conditions mass transfer effects on the reaction rate have been evaluated
showing the absence of interphase and interparticle diffusive limitations up to a maximum
temperature of 800°C. In a second kind of approach to the problem, autothermal combustion tests
have been performed in order to understand the role of heat fluxes on combustion efficiency and
Page 142
Catalytic microcombustion for portable electric power generation
136
stability, as well as the role of thermal shocks of repeated ignition-extinction/blow-out cycles on the
catalytic micro-combustor stability and durability.
Concerning the active phase a great attention has been devoted to the development of relatively
cheap catalyst formulations alternatively to noble metals catalysts that, despite of the high cost and
the low chemical and thermal stability, are still widely studied. Supported perovskites,
LaMnO3/Al2O3 based catalysts have been the starting point due to the great chemical and thermal
stability and low cost. However, novel catalysts consisting of perovskites promoted by a very low
platinum amount have been investigated too, with the aim to enhance the mixed oxide activity but
maintaining stability and inexpensiveness typical of perovskite. The most significant results are
related to the higher activity of LaMnO3/Al2O3 compared to that of Pt/Al2O3 in methane
combustion; as a consequence, the promoting effect of platinum on perovskite is practically not
observed at all, neither any enhancement in activity has been visible. On the contrary, Pt/Al2O3
catalysts have exhibited significantly higher activity than LaMnO3/Al2O3 in hydrogen and propane
combustion thus rendering productive the promotion of perovskite with small amounts of platinum.
Under the investigated conditions hydrogen has been efficaciously converted at 200°C while total
methane conversion has not been achieved up to at a maximum temperature of 800°C, under
experimental conditions suggested by practical applications (flow-rates and thermal power
developed). However, by co-burning methane and hydrogen a strong enhancement of CH4
combustion rate has been measured and attributed to the activation of reactive paths in the
homogeneous phase. Particularly, by replacing about 40% of the energetic CH4 content with H2 a
total fuel conversion has been obtained at 800°C on unpromoted perovskite catalysts.
Autothermal experiments have revealed the strong non adiabaticity of microcombustors. Loss of
combustion stability has occurred either via extinction or blowout. In extinction, occurring at low
flow rates, stability is lost due to large heat losses compared to the power provided via combustion.
In blowout, occurring at the high flow rates, quenching is due to the low residence time, resulting in
incomplete fuel conversion and a considerable shift of the reaction front downstream. Experimental
results have revealed that Non-Recirculating-quartz-micro-Reactor (NRR) for propane combustion
has operated in the blowout regime and quenching has occurred due to lack of sufficient reactant
preheating. On the contrary, Heat-Recirculating-quartz-micro-Reactor (HRR) has enlarged the
operability limits of the process; in particular, heat recirculation has enhanced preheating of the
incoming gases, allowing stabilization of the reaction front upstream and preventing blowout. The
obtained results on quartz reactors have represented a relevant complement of another experimental
study reported in literature on heat recirculation in metallic reactors; consistently with some
Page 143
Conclusions
137
theoretical studies, it has been definitively confirmed that heat recovery is effective only in the limit
of low conductivity materials.
On the other hand, the results of the present experimental campaign have shown that the
enhancement of micro-combustor field of operability could be drastically affected by the type of
fuel too. Particularly, the results have shown that higher is the fuel reactivity wider is the window of
autothermal combustion. Propane combustion has exhibited a wide range of stability being
sustained without an external preheating. On the contrary, because of the high chemical stability,
methane combustion has shown a very narrow operating range. CH4, in fact, is efficaciously burnt
only by supplying heat to the combustor thus pre-heating reactants. Hydrogen assisted methane
combustion has been considered as a possible strategy to enhance CH4 combustion operating limits.
Obtained results, in fact, have shown that this fuel is more reactive than methane. Hydrogen
addiction to methane fuel produces a chemical synergy between the two fuel bringing about an
enhancing in the methane combustion rate. Moreover, results have shown that hydrogen thermally
assists methane combustion by lowering its catalytic ignition temperature. Despite of the higher
reactivity of CH4-H2 compared to methane, it has been found that the addiction of H2 to CH4 fuel
doesn’t play a role on autothermal operation limits.
Propane fueled heat recirculating reactors constituted by Pt/Al2O3 active phase have been
integrated with thermoelectric modules (TEs) thus showing the feasibility of electricity generators
based on combustion. A net positive electrical power of the order of 0.2÷0.3 W has been developed
being characterized by a maximum overall efficiency of 0.4%. The main issues involved in the
integration of the catalytic combustor with thermoelectric elements (TEs) have been discussed. In
particular, thermal management of the device has been studied in order to make as efficient as
possible such a coupling. At this proposal, the performances of the generator have been evaluated in
the case TEs are integrated with both a 2 and 3 pass combustors. A 2-pass generator has shown a
low efficiency in the heat transfer from combustor to TEs. By increasing the number of reactor
passes is an effective tool to increase efficiency but such a strategy also determines an increase in
the process heat losses thus worsening operation limits of the electricity generator.
Page 144
Literature cited
138
LITERATURE CITED
J. Ahn, C. Eastwood, L. Sitzki, P. Ronney; “Gas-phase and catalytic combustion in heat recirculating burner”;
Proceedings of the Combustion Institute, vol. 30 (2005): pp. 2463-2472.
M. Alifanti, N. Blangenois, M. Florea, B. Delmon; “Supported Co-based perovskites as catalysts for total oxidation
of methane”; Applied Catalysis A: General, vol. 280 (2005): pp. 255-265.
H. Arai e M. Machida; “Thermal stabilization of catalyst supports and their application to high-temperature catalytic
combustion”; Applied catalyisis A: General, vol 138 (1996): pp. 161-176.
H. Arai, T. Yamada, K. Eguchi, T. Seiyama; "Catalytic combustion of metahane over various perovskite-type
oxides"; Applied Catalysis, vol. 26 (1986): pp. 265-276.
S. Arnone, G. Busca, L. Lisi, F. Milella, G. Russo, M. Turco; “Catalytic combustion of methane over LaMnO3
perovskite supported on La2O3 stabilized alumina, a comparative study with Mn3O4, Mn3O4- Al2O3
spinel oxides”; Proceedings of the Combustion Institute, vol. 27 (1998): pp. 2293-2299.
J. A. Barnard, J. N. Bradley; "Flame and Combustion"; Chapman and Hall, London New York (1985).
R. Byron Bird, Warren E Stewart, Edwin N. Lightfoot; “Transport Phenomena”. John Wiley & Sons, New York
(1960).
A. I. Boukai, Y. Bunimovich, J. Tahir-Kheli, J.-K. Yu, W. A. Goddard III, J. R. Heath; “Silicon nanowires as
efficient thermoelectric materials; vol. 451 (2008): pp. 168- 171.
C. Bozo, N. Guilhaume, E. Garbowsky, M. Primet; “Combustion of methane on CeO2- ZrO2 based catalysts”;
Catalysis Today, vol. 59 (200): pp. 33-45.
T. V. Choudhary, S. Banerjee, V. R. Choudhary; “Catalysts for combustion of methane and lower alkanes”; Applied
Catalysis A: General, vol. 234 (2002): pp. 1-23.
F. Cifà, P. Dinka, P. Viparelli, S. Lancione, G. Benedetti, P. L. Villa, M. Viviani, P. Nanni; "Catalysts based on
BaZrO3 with different elements incorporated in the structure I: BaZr(1-x)PdxO3 systems for total
oxidation"; Applied Catalysis B: Environmental, vol. 46 (2003): pp. 463-471.
S. Cimino, L. Lisi, R. Pirone, G. Russo; “Dual-site Pd/perovskite monolithic catalysts for methane catalytic
combustion”; Ind. Eng. Chem. Res., vol. 43 (2004): pp. 6670-6679.
S. Cimino, L. Lisi, R. Pirone, G. Russo, M. Turco; “Methane combustion on perovskite-based structured catalysts”;
Catalysis Today, vol. 59 (2000): pp. 19-31.
S. Cimino, A. Di Benedetto, R. Pirone, G. Russo; “CO, H2 or C3H8 assisted catalytic combustion of methane over
supported LaMnO3 monoliths”; Catalysis Today, vol. 83 (2003): pp. 33-43.
S. Cimino, A. Di Benedetto, R. Pirone, G. Russo; “Transient behaviour of perovskite-based monolithic reactors in the
catalytic combustion of methane”; Catalysis Today, vol. 69 (2001): pp. 95-103.
S. Cimino, M. P. Casaletto, L. Lisi, G. Russo; "Pd-LaMnO3 as dual site catalysts for methane combustion"; Applied
Catalysis A: General, vol. 327 (2007): pp. 238-246.
Page 145
Literature cited
139
A. Civera, G. Negro, S. Specchia, G. Saracco, V.Specchia; "Optimal compositional and structural design of a
LaMnO3/ZrO2/Pd-based catalyst for methane combustion"; Catalysis Today, vol. 100 (2005): pp.
275-281.
P. Dagaut, A. Nicolle; "Experimental and detailed kinetic modelling study of hydrogen-enriched natural gas bled
oxidation over extended temperature and equivalence ratio ranges"; Proceedings of the Combustion
Institute 30 (2005): pp. 2631-2638.
B. De Collongue, E. Garbowski, M. Primet; “Catalytic combustion of methane over bulk and supported lanthanum
chromium oxide (LaCrO3) perovskites”; Journal of the Chemical Society, Faraday Transactions, vol.
87(15) (1991): pp. 2493-2499.
O. Demoulin, I. Seunier, M. Navez, P. Ruiz; "Influence of the addiction of H2 upon the behaviour and properties of a
Pd (2 wt%)/γ-Al2O3 catalyst and a comparison with the case of the Pt-based catalyst"; Applied
Catalysis A: General, vol. 300 (2006): pp. 41-49
W. Deng, J. F. Klemic, X. Li, M. A. Reed, A. Gomez; “ Liquid fuel microcombustor using microfabricated
multiplexed electrospray sources”; Proceedings of the Combustion Institute 31 (2007): pp. 2239-
2246.
M. Derudi, A. Villani, R. Rota; "Sustainability of mild combustion of hydrogen-containing hybrid fuels";
Proceedings of the Combustion Institute, vol. 31 (2007): pp. 3393-3400.
O. Deutschmann, L. I. Maier, U. Riedel, A. H. Stroemman, R. W. Dibble; "Hydrogen assisted catalytic combustion of
methane on platinum"; Catalysis Today, Vol. 59 (2000): pp. 141-150.
Z. H. Dughaish; “Lead telluride as thermoelectric material for thermoelectric power generation”; Physica B, vol. 322
(2002): pp. 205-253.
G. Ertl, H. Knoezinger, F. Schueth, J. Weitkamp; “Handbook of Heterogeneous Catalysis”, Vol. 3. Wiley-VCH
Verlag GmbH & Co. KGaA, Weinheim, Germany (2008).
L. Fabbrini, I. Rossetti, L. Forni; "La2O3 as primer for supporting La0.9Ce0.1CoO3±δ on cordieritic honeycombs";
Applied Catalysis B: Environmental, vol. 56 (2005): pp. 221-227.
J. A. Federici, D. G. Norton, T. Bruggemann, K. W. Voit, E. D. Wetzel, D. G. Vlachos; "Catalytic microcombustors
with integrated thermoelectric elements for portable power production"; Journal of Power Sources,
Vol. 161 (2006): pp. 1469-1478.
J. A. Federici, D. G. Vlachos, A computational fluid dynamics study of propane/air microflame stability in a heat
recirculation reactor. Combustion and Flame 153 (2008) 258-269
J. A. Federici, E. D. Wetzel, B. R. Geil, D. G. Vlachos; “Single channel and heat recirculation catalytic micro-
burners: an experimental and computational fluid dynamics study”; Proc. Combust. Inst. 32
(accepted).
A. C. Fernandez-Pello; "Micro-power generation using combustion: issues and approaches"; Proceedings of the
Combustion Institute, vol. 29 (2002): pp. 883-899.
L. Forni, I. Rosetti; “Catalytic combustion of hydrocarbons over perovskites”; Applied Catalysis B: Environmental,
vol. 38 (2002): pp. 29-37.
P. Gélin, L. Urfels, M. Primet, E. Tena; "Complete oxidation of methane at low temperature over Pt and Pd catalysts
for the abatement of lean-burnt natural gas fuelled vehicles emission: influence of water and sulphur
containing compounds"; Catalysis Today, vol. 83 (2003): pp. 45-57.
Page 146
Catalytic microcombustion for portable electric power generation
140
L. Giebeler, D. Kiebling, G. Wendt; “LaMnO3 perovskite supported noble metal. Catalysts for the total oxidation of
methane”; Chem. Eng. Technol., vol. 30 (7) (2007): pp. 889-894.
L. M. Goncalves, P. Alpuim, G. Min, D. M. Rowe, C. Couto, J. H. Correia; “Optimization of Bi2Te3 and Sb2Te3
thin films deposited by co-evaporation on polymide for thermoelectric applications”; Vacuum, vol.
82 (2008): pp: 1499-1502.
R. E Hayes, S. T. Kolaczkowski; “Introduction to Catalytic Combustion”. Gordon and Beach Science Publisher
(1997).
A. I. Hochbaum, R. Chen, R. D. Delgado, W. Liang, E. C. Garnett, M. Najarian, A. Majumdar; “Enhanced
thermoelectric performance of rough silicon nanowires”; Nature, vol. 451 (2008): pp. 163-167.
N. S. Kaisare, D. G. Vlachos, Optimal reactor dimensions for homogeneous combustion in small channels. Catalysis
Today 120 (2007) 96-106
N S. Kaisare, D. G. Vlachos, Extending the region of stable homogeneous micro-combustion through forced unsteady
operation. Proceedings of the Combustion Institute 31 (2007) 3293-3300
N. S. Kaisare, S. R. Deshmukh, D. G. Vlachos, Stability and performance of catalytic microreactors: simulations of
propane catalytic combustion on Pt. Chemical Engineering Science 63 (2008) 1098-1116
S. Karagiannidis, J. Mantzaras, G. Jackson, K. Boulouchos; "Hetero/homogeneous combustion and stability maps in
methane-fueled catalytic microreactor"; Proceedings of the Combustion Institute, vol. 31 (2007): pp.
3309-3317.
A. M. Karim, J. A. Federici, D.G. Vlachos; “Portable power production from methanol in an integrated
thermoeletric/microreactor system”; Journal of Power Sources, vol. 179(1) (2008): pp. 113-120.
N. I. Kim, S. Aizumi, T. Yokomori, S. Kato, T. Fujimori, K. Maruta; "Development and scale effect of small swiss-
roll combustors"; Proceedings of the Combustion Institute, vol. 31 (2007): pp. 3243-3250.
J. Kirchnerova, M. Alifanti, B. Delmon; “Evidence of phase cooperation in the LaCoO3-CeO2-Co3O4 catalytic system
in relation to activity in methane combustion”; Applied Catalysis A: General, vol. 231 (2002): pp.
65-80.
J. Kirchnerova, D. Klvana; “Performance of La1-xSrxAl1-y-y’FeyMgy’O3-δ perovskites in methane combustion: effect of
aluminium and magnesium content”; Catalysis Today, vol. 83 (2003): pp. 233-238.
B. Kucharczyk, W. Tylus; "Effec of Pd or Ag additive on the activity and stability of monolithic LaCoO3 perovskites
for catalytic combustion of methane"; Catalysis Today, vol. 90 (2004): pp. 121-126.
C. H. Kuo and P. D. Ronney; "Numerical modeling of non-adiabatic heat-recirculating combustors"; Proceedings of
the Combustion Institute, vol. 31 (2007): pp. 3277-3284.
K. Kusakabe, S. Morooka, H. Maeda; “Development of a microchannel catalytic reactor system”; Korean J. Chem.
Eng., vol. 18(3) (2001): pp. 271-276.
O. Levenspiel; "Chemical Reaction Engineering: second edition"; John Wiley & Sons, New York, Chichester,
Brisbane, Toronto, Singapore (1962).
W. Liu, M. F. Stephanopoulos; “Total oxidation of carbon monoxide and methane over transition metal-fluorite oxide
composite catalysts”; Journal of Catalysis, vol. 153 (1995): pp. 304-316.
M. Lyubovsky, L. L. Smith, M. Castaldi, H. Karim, B. Nentwick, S. Etemad, R. LaPierre, W. C. Pfefferle; "Catalytic
combustion over platinum group catalysts: fuel-lean versus fuel-rich operation"; Catalysis Today,
vol. 83 (2003): pp. 71-84.
Page 147
Literature cited
141
L. Marchetti, L. Forni; “Catalytic combustion of methane over perovskites”; Applied Catalysis B: Environmental,
vol. 15 (1998): pp. 179-187.
A. Mehra, X. Zhang, A. A. Ayon, I. A. Waitz, M. A. Schmidt, C. M. Spadaccini, A six-wafer combustion system for
a silicon micro gas turbine engine. Journal of Microelectromechanical systems 9 (2000) 517-527
C. M. Miesse, R. I. Masel, , C. D. Jensen, M. A. Shannon, M. Short, Sub-millimeter scale combustion. A. I. Ch. E.
Journal 50 No. 12 (2004) 3206-3213
A. Muhtaroglu, A. Yokochi, A. von Jouanne; “Integration of thermoelectrics and photovoltaics as auxiliary power
sources in mobile computing applications”; Journal of Power Sources, vol. 177 (2008): pp. 239-246.
J. G. McCarty, M. Gusman, D. M. Lowe, D. L. Hildenbrand, K. N. Lau; "Stability of supported metal and supported
metal oxide combustion catalysts"; Catalysis Today, Vol. 47 (1999): pp. 5-17.
D. G. Norton and D. G. Vlachos; "A CFD study of propane/air microflame stability"; Combustion and Flame, vol.
138 (2004): pp. 97-107.
D. G. Norton, E. D. Wetzel, D. G. Vlachos; "Fabrication of single-channel catalytic microburner: effect of
confinement on the oxidation of hydrogen/air mixtures"; Ind. Eng. Chem. Res., vol. 43 (2004): pp.
4833-4840.
D. G. Norton and D. G. Vlachos; "Hydrogen assisted self-ignition of propane/air mixtutures in catalytic
microburnes"; Proceedings of the Combustion Institute 30 (2005): pp. 2473-2480.
D. G. Norton, E. D. Wetzel, D. G. Vlachos; "Thermal management in catalytic microreactors"; Ind. Eng. Chem. Res.,
vol. 45 (2006): pp. 76-84.
M. O'Connel, A. K, Norman, C. F. Huttermann, M. A. Morris; “Catalytic oxidation over lanthanum-transition metal
perovskite materials”; Catalysis Today, vol. 47 (1999): pp. 123-132.
D. R. Palo, J. D. Holladay, R. T. Rozmiarek, C. E. Guzman-Leong, Y. Wang, J. Hu, Y.-H. Chin, R. A. Dagle, E. G.
Baker; “Development of a soldier portable fuel cell power system. Part I: A bread board methanol
fuel processor”; Journal of power sources, vol. 108 (2002): pp. 28-34.
R. H. Perry, D. W. Green; “Perry’s chemical engineers’ handbook”; Mc Graw Hill (Seventh Edition).
S. Petrovic, L. Karanovic, P. K. Stefanov, M. Zdujic, A. Terlecki-Baricevic; "Catalytic combustion of methane over
Pd-containing perovskite type oxides"; Applied Catalysis B: Environmental, vol. 58 (2005): pp. 133-
141.
K.Qiu and A. C. S. Hayden; “Development of a thermoelectric self-powered residential heating system”; Journal of
Power Sources, vol. 180 (2008): pp. 884-889.
S. B. Riffat, Xiaoli Ma; “Thermoelectrics: a review of present and potential applications”; Applied Thermal
Engineering, vol. 23 (2003): pp. 913-935.
P. D. Ronney; "Analysis of non-adiabatic heat-recirculating combustors"; Combustion and Flame, vol. 135 (2003):
pp. 421-439.
P. Sabia, M. de Joannon, S. Fierro, A. Tregrossi, A. Cavaliere; " Hydrogen-enriched methane mild combustion in a
well-stirred reactor"; Experimental Thermal and Fluid Science, vol. 31 (2007): pp. 469-475.
G. Saracco, G. Scibilia, A. Iannibello, G. Baldi; “Methane combustion on Mg-doped LaCrO3 perovskite catalysts”;
Applied Catalysis B: Environmental, vol. 8 (1996): pp. 229-244.
G. Saracco, F. Geobaldo, G. Baldi; “Methane combustion on Mg-doped LaCrO3 perovskite catalysts”; Applied
Catalysis B: Environmental, vol. 20 (1999): pp. 277-288.
T. Seiyama; “Total oxidation of hydrocarbons on perovskite oxides”; Catalysis Reviews, vol. 34 (1992): pp. 281-300.
Page 148
Catalytic microcombustion for portable electric power generation
142
R. W. Schefer, D. M. Wicksall, A. K. Agrawal; "Combustion of hydrogen-enriched methane in a lean premixed
swirl-stabilized burner"; Proceedings of the Combustion Institute 29 (2002): pp. 843-851.
C. M. Spadaccini, X. Zhang, C. P. Cadou, N. Miki, I. A. Waitz; "Preliminary development of a hydrocarbon-fueled
catalytic micro-combustor"; Sensors and Actuators A, vol. 103 (2003): pp. 219-224.
Y. Suzuki, J. Saito, N. Kasagi; “Development of micro catalytic combustor with Pt/Al2O3 thin films”; JSME
International Journal, Series B, vol. 47 (3) (2004): pp. 522-527.
L. G. Tejuca, J. L. G. Fierro, J. M. D. Tascon, Structure and reactivity of perovskite-type oxides. Advances in
Catalysis 36 (1989) 237-328.
M. Uenishi, M. Tanigushi, H. Tanaka, M. Rimura, Y. Nishihata, J. Mizuki, T. Kobayashi; "Redox behaviour of
palladium at star-up in the Perovskite-type LaFePdOx automotive catalysts showing a self-
regenerative function"; Applied Catalysis B: Environmental, vol. 57 (2005): pp. 267-273.
M. Valentini, G. Groppi, C. Cristiani, M. Levi, E. Tronconi, P. Forzatti; "The deposition of γ-Al2O3 layers on ceramic
and metallic supports for the preparation of structured catalysts"; Catalysis Today, vol. 69 (2001): pp.
307-314.
G. Veser; "Experimental and theoretical investigation of H2 oxidation in a high-temperature catalytic microreactor";
Chemical Engineering Science, vol. 56 (2001): pp. 1265-1273.
J. Vican, B. F. Gajdeczko, F. L. Dryer, D. L. Milius, I. A. Aksay, R. A. Yetter; "Development of a microreactor as a
thermal source for microelectromechanical systems power generation"; Proceedings of the
Combustion Institute, vol. 29 (2002): pp. 909-916.
C. B. Vining; “Desperately seeking silicon”; Nature, vol. 451 (2008): pp. 132-133.
M. Wagner, G. Span, S. Holzer, T. Grasser; “Thermoelectric power generation using large-area Si/SiGe pn-junctions
with varying Ge content”; Semicond. Sci. Technol., vol. 22 (2007): pp. S173-S176.
X. Wang, J. Zhu, H. Bau, R. J. Gorte; "Fabrication of micro-reactors using tape-casting methods"; Catalysis Letters,
vol. 77, No. 4 (2001): pp. 173-177.
F. Weinberg; “Optimising heat recirculating combustion systems for thermoelectric converters”; Combustion and
Flame, vol. 138 (2004): pp. 401-403.
F. J. Weinberg, D. M. Rowe, G. Min; “Novel high performance small-scale thermoelectric power generation
employing regenerative combustion systems”; J. Phys. D: Appl. Phys. 35 (2002): pp. L61-L63.
Wierzba, A. Depiac; “Catalytic oxidation of lean homogeneus mixtures of hydrogen/hydrogen-methane in air”;
International Journal of Hydrogen Energy, vol. 29 (2004): pp. 1303-1307.
W. M. Yang, S. K. Chou, C. Shu, Z. W. Li, H. Xue; "Study of catalytic combustion and its effect on
microthermophotovoltaic power generator"; Journal of Physics D: Applied Physics, vol. 38 (2005):
pp. 4252-4255.
W. M. Yang, S. K. Chou, C. Shu, Z. W. Li, H. Xue; "Development of microthemophotovoltaic system"; Applied
Physics Letters, vol. 81-27 (2002): pp. 5255-5257.
S. Zhao, J. Zhang, D. Weng, X. Wu; "A method to form well-adhered γ-Al2O3 layers on FeCrAl metallic supports";
Surface and Coating Technology, Vol. 167 (2003): pp. 97-105.
M. F. M. Zwinkels, O. Haussner, P. Govind Menon, S. G. Jaras; "Preparation and characterization of LaCrO3 and
Cr2O3 methane combustion catalysts supported on LaAl11O18- and Al2O3- coated monoliths";
Catalysis Today, vol. 47 (1999): pp. 73-82.