Page 1
Utah State University
Systems, Materials, and
Structural Health Laboratory
1560 Canyon Road
Logan, UT 84322, USA
Director: Marc Maguire, Ph.D.
Tel: (435) 797-1139
Email: [email protected]
Double Shear Testing of Innovative
Structural Solutions Concrete Sandwich
Wall Assembly
SMASH LAB REPORT NO. SMASH.19.01
SUBMITTED: April 26, 2019
SUBMITTED BY: Marc Maguire, PhD
Page 2
USU SMASH LAB Report No. SMASH.AC422.19.01 April 30, 2019
Page 2 of 24
http://www.cee.usu.edu/pages/smash-lab
Standards Referenced
ICC-ES AC422 Acceptance criteria for semicontinuous fiber-reinforced grid connectors used in
combination with rigid insulation in concrete sandwich panel construction,
International Code Council Evaluation Service, 2016 (“AC422”).
ASTM C31 Standard practice for making and curing concrete test specimens in the field,
ASTM International, 2018 (“ASTM C31”).
ASTM C33 Standard specification for concrete aggregates, ASTM International, 2013
(“ASTM C33”).
ASTM C39 Standard test method for compressive strength of cylindrical concrete specimens,
ASTM International, 2014 (“ASTM C39”).
ASTM C150 Standard specification for portland cement, ASTM International, 2017 (“ASTM
C150”).
ASTM C303 Standard test method for dimensions and density of preformed clock and board-
type thermal insulation, ASTM International, 2007 (“ASTM C303”).
ACI 211.1 Standard practice for selecting proportions for normal, heavyweight, and mass
concrete, American Concrete Institute, 1991 (Reapproved 2009) (“ACI 211.1”).
Scope of Report
This report presents the results of double shear testing of 4 in insulation version of the Innovative Structural
Solutions (Innstruct) insulation and steel shear connectors system for concrete and rigid foam composite
sandwich wall panels (SWP). This double shear testing provides a basis for comparison to other product on
the market as well as providing shear strength and failure mode information. Testing is performed on a
variation of AC422 testing which is the only testing procedure available for component testing of sandwich
wall panel connector systems. Testing was performed at the Utah State University (USU) Systems,
Materials and Structural Health Laboratory (SMASH Lab) for Innstruct. Per the contract, the scope of work
was limited to:
1. Fabricate and test five total double shear specimens (based on a variation of AC422) for 4 in.
insulation thickness at approximately 3500 psi to simulate lifting concrete strengths in a tilt-up
application.
2. Report results of the proposed testing.
Page 3
USU SMASH LAB Report No. SMASH.AC422.19.01 April 30, 2019
Page 3 of 24
http://www.cee.usu.edu/pages/smash-lab
Product Description and Installation
This section details basic information about Innstruct panels with respect to the double shear testing and
anticipated field fabrication. The panel assembly (Figure 1) comprises nominally 9 gauge wires connected
through a 4 in. thick by 2 ft wide by 2 ft tall expanded polystyrene (EPS) sheet that are welded to a nominally
11 gauge wire mesh. Mesh properties were not provided by the manufacturer and not tested by the lab. The
assembly is produced in Morgan, UT using an automated process that projects the wires through the
insulation and welds these wires to both layers of facing wire mesh.
Figure 1. Innstruct 4 in. panel assembly
Page 4
USU SMASH LAB Report No. SMASH.AC422.19.01 April 30, 2019
Page 4 of 24
http://www.cee.usu.edu/pages/smash-lab
These and similar panels have been used routinely throughout the world since the 1960s in shotcrete – and
other – applications, but rarely in the tilt-up application. For a tilt-up application, it is envisioned that the
first layer of concrete is cast, then the panel is installed with appropriate splice mesh and any additional
reinforcement required by the engineering design of the wall, then the second layer of concrete is cast with
appropriate reinforcing to produce a three layer sandwich wall that can be tilted up into place upon reaching
the required strength.
Sampling
All Innstruct panels used for the testing described herein were delivered by Hal Fronk of Innstruct to the
SMASH lab.
Specimen Fabrication
Connector shear tests were performed using double-shear specimens similar to those described in Section
4.4.2 of AC422 and similar to those of other sandwich wall panel connectors in the literature. Double shear
specimens consisted of three wythes of concrete and two wythes of rigid foam insulation, as shown in
Figure 2. The thicknesses of the outer concrete wythes, the foam wythes, and the center concrete wythe
were 3 in, 4 in, and 6 in, respectively. Each wythe measured 24 in wide and 24 in long. The completed
specimen measured 20 × 24 × 24 in.
Specimens were prepared by casting a 3 in. layer of concrete, placing the insulation over it and casting the
6 in. center wythe, then placing the second insulation assembly followed by another 3 in. layer of concrete.
Concrete was allowed to cure until reaching 3500 psi, a common lifting strength for tilt-up applications.
The specimen setup allows the connectors to be evaluated in similar wythe strengths, thicknesses and
maximum thickness insulation values to those in tilt-up sandwich construction.
Page 5
USU SMASH LAB Report No. SMASH.AC422.19.01 April 30, 2019
Page 5 of 24
http://www.cee.usu.edu/pages/smash-lab
Figure 2. Double-shear specimen
Test Procedures
Double-shear specimens were tested as shown in Figure 3. The outer concrete wythes were supported on
stainless steel bearing surfaces with low friction polytetrafluoroethylene (PTFE) pads. Specimens were
instrumented with a load cell to measure the applied force, and with four linear variable differential
transformers (LVDT)—two on each side of the specimen—to measure the displacement of each outer
concrete wythe relative to the center concrete wythe. Load was applied parallel to the connector rows and
concentric to the test specimen using a servo-hydraulic actuator with advance rate of 0.05 in/min. The
applied force was measured using a load cell. Test specimens, supports, and loading were all symmetric
about the center plane of the test specimen.
6 Ties @ 4" O.C.
3"
4"
6"
4"
3"
1'-8"
2'
2'
2'
3" 6" 3"
2'
4"
1'-8"
4"
Page 6
USU SMASH LAB Report No. SMASH.AC422.19.01 April 30, 2019
Page 6 of 24
http://www.cee.usu.edu/pages/smash-lab
Figure 3. Connector shear test loading apparatus
Concrete
Concrete conformed to the requirements of Section 4.1 of AC422. Mixture proportions were in general
accordance with ACI 211.1. Coarse and fine aggregates met the specifications of ASTM C33. Cement met
the specifications of ASTM C150. Ready-mix concrete was delivered by Staker Parson (Smithfield, UT).
Cylindrical specimens were cast at the same time as double shear specimens for the purpose of compressive
strength determination. Cylindrical specimens measuring 4 in in diameter and 8 in in length were cast and
field-cured in accordance with the specifications of ASTM C31. Concrete compressive strength was
evaluated in accordance with the specifications of ASTM C39 at the SMASH Lab. Three concrete cylinders
were tested in compression on the day that connector shear tests were performed. The cylinder strengths
were 3,240 psi, 3,810 psi, and, 3,790 psi, for an average concrete compressive strength of 3,610 psi for the
five double shear tests.
Summary of Test Results
Double shear testing was performed on April 6, 2019. Specimens were loaded until the sensors maxed out
at approximately 2 in. displacement. A photo of Specimen 1 after load was removed can be found in Figure
4 where large deformations are present.
Page 7
USU SMASH LAB Report No. SMASH.AC422.19.01 April 30, 2019
Page 7 of 24
http://www.cee.usu.edu/pages/smash-lab
Figure 4. Example Post-Failure Specimen 1
Load versus deformation relationships are presented in Figure 5 and Figure 6. The curves show a nearly
linear portion followed by an initial peak and resulting drop in strength. Following this drop in strength, all
specimens held considerable strength through large deformations and gain more strength until reaching a
second peak that is often higher than the first after 1.5 in. of relative displacement.
Page 8
USU SMASH LAB Report No. SMASH.AC422.19.01 April 30, 2019
Page 8 of 24
http://www.cee.usu.edu/pages/smash-lab
Figure 5. Full Load versus Displacement curve for all double shear specimens
Figure 6. Small Displacement Load versus Displacement curve for all double shear specimens
Design values obtained from these tests are strength (Fmax) and the secant stiffness to 0.5*Fmax (K0.5). These
design values are summarized in Table 1. Fmax is 9.4 kip on average with a 4.6% coefficient of variation
(COV), which is very low. K0.5 is 493 kip/in. on average with a COV of 36% which is high. A high COV
is anticipated for this value because the insulation was allowed to bond to the concrete because of access
and fabrication making it impossible to debond the specimen. Design strength and stiffness values presented
0.00
2.00
4.00
6.00
8.00
10.00
12.00
14.00
0.00 0.50 1.00 1.50 2.00 2.50 3.00
Fo
rce T
hro
ug
h O
ne L
ayer
(kip
s)
Relative Shear Displacement (in.)
1 2 3 4 5
0.00
2.00
4.00
6.00
8.00
10.00
12.00
14.00
0.00 0.02 0.04 0.06 0.08 0.10
Fo
rce T
hro
ug
h O
ne L
ayer
(kip
s)
Relative Shear Displacement (in.)
1 2 3 4 5
Page 9
USU SMASH LAB Report No. SMASH.AC422.19.01 April 30, 2019
Page 9 of 24
http://www.cee.usu.edu/pages/smash-lab
herein can be used to design sandwich panels using the generalized methodologies for full size sandwich
panels are outlined in Olsen et al. (2017). Verification that these measured shear deformation properties
and methods can predict full scale behavior is recommended.
Table 1. Summary of Design Values
Specimen #
Fmax
(kip) K0.5
(kip/in)
1 9.5 294
2 8.8 396
3 9.8 764
4 9.7 448
5 9.1 562
Average 9.4 493
COV 0.046 0.36
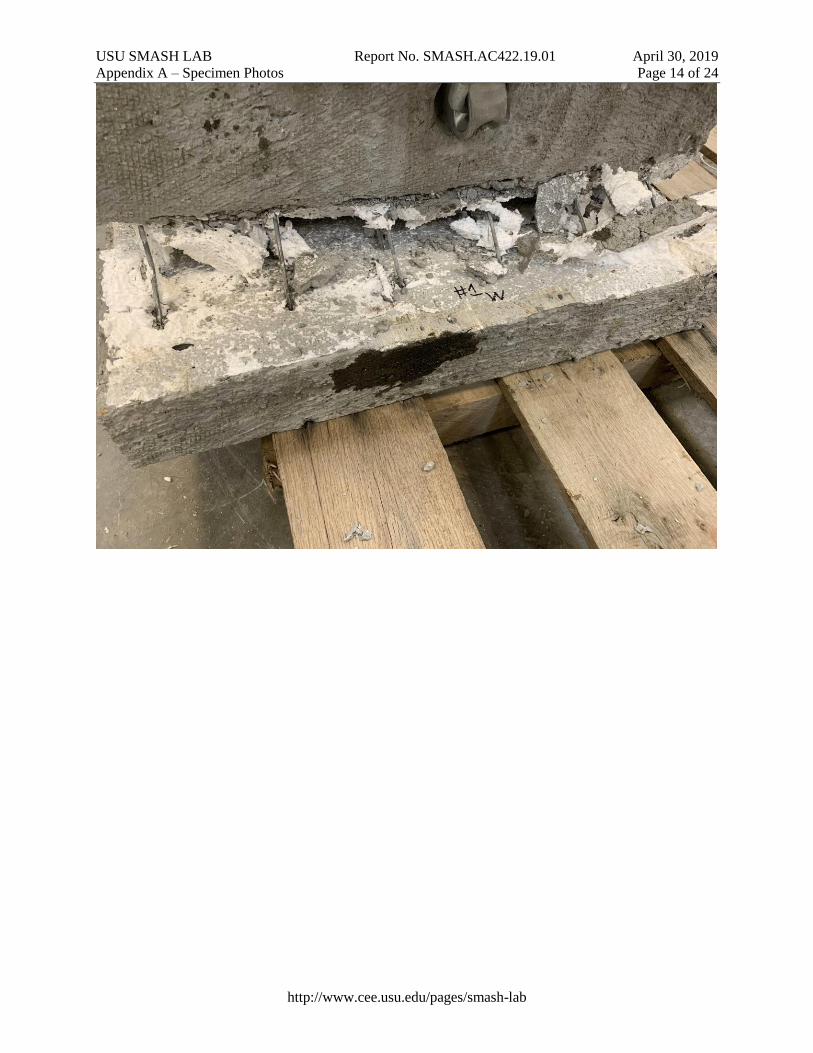
Upon inspection of the specimen failure modes, it appears the peak occurs upon buckling of the
compression wires which then were bent back the through large deformations, then contributed to strength
through tension causing the second peak which seems to correspond to final tension failure (seemly at the
weld) of the tension wires (see Figure 7).
Figure 7. Specimen 1 failure mode typical of all double shear tests
Conclusion
Based on the tests and results described herein, the maximum strength per a 2ft x 2ft section of panel can
resist an average of 9.4 kips shear force with a COV of 4.6%. The elastic stiffness of the same 2ft x 2ft
section results in 493 kip/in. with a COV of 36%. While there are no codified design procedures for concrete
Ruptured tension wire
Buckled
Compression
Wire
Page 10
USU SMASH LAB Report No. SMASH.AC422.19.01 April 30, 2019
Page 10 of 24
http://www.cee.usu.edu/pages/smash-lab
sandwich wall panels exhibiting partial composite action, these values can be used in established analysis
procedures in Olsen et al. (2017). A spreadsheet loading the values derived in this report along with several
other systems can be found at the following link:
https://app.box.com/s/pligrbbc4niojvjdattnpiwteg9tg619
This spreadsheet can be used to obtain percent composite action for various limit states as well as cracking
moment, deflection and ultimate strength prediction and is based on the fundamental mechanics-based
methods outlined in Olsen et al. (2017). This spreadsheet is not intended for design purposes, but as a
demonstration tool. This spreadsheet is also periodically updated as new connector information is gained
and analysis methods modified.
References
Olsen, J., Al-Rubaye, S., Sorensen., T., Maguire, M., (2017) “Developing a General methodology for
Evaluating Composite Action in Insulated Wall Panels. Report to the Prestressed/Precast Concrete
Institute. Chicago, IL.
Page 11
USU SMASH LAB Report No. SMASH.AC422.19.01 April 30, 2019
Appendix A – Specimen Photos Page 11 of 24
http://www.cee.usu.edu/pages/smash-lab
Specimen 1
Page 12
USU SMASH LAB Report No. SMASH.AC422.19.01 April 30, 2019
Appendix A – Specimen Photos Page 12 of 24
http://www.cee.usu.edu/pages/smash-lab
Page 13
USU SMASH LAB Report No. SMASH.AC422.19.01 April 30, 2019
Appendix A – Specimen Photos Page 13 of 24
http://www.cee.usu.edu/pages/smash-lab
Page 14
USU SMASH LAB Report No. SMASH.AC422.19.01 April 30, 2019
Appendix A – Specimen Photos Page 14 of 24
http://www.cee.usu.edu/pages/smash-lab
Page 15
USU SMASH LAB Report No. SMASH.AC422.19.01 April 30, 2019
Appendix A – Specimen Photos Page 15 of 24
http://www.cee.usu.edu/pages/smash-lab
Page 16
USU SMASH LAB Report No. SMASH.AC422.19.01 April 30, 2019
Appendix A – Specimen Photos Page 16 of 24
http://www.cee.usu.edu/pages/smash-lab
Specimen 2
Page 17
USU SMASH LAB Report No. SMASH.AC422.19.01 April 30, 2019
Appendix A – Specimen Photos Page 17 of 24
http://www.cee.usu.edu/pages/smash-lab
Page 18
USU SMASH LAB Report No. SMASH.AC422.19.01 April 30, 2019
Appendix A – Specimen Photos Page 18 of 24
http://www.cee.usu.edu/pages/smash-lab
Page 19
USU SMASH LAB Report No. SMASH.AC422.19.01 April 30, 2019
Appendix A – Specimen Photos Page 19 of 24
http://www.cee.usu.edu/pages/smash-lab
Specimen 3
Page 20
USU SMASH LAB Report No. SMASH.AC422.19.01 April 30, 2019
Appendix A – Specimen Photos Page 20 of 24
http://www.cee.usu.edu/pages/smash-lab
Specimen 4
Page 21
USU SMASH LAB Report No. SMASH.AC422.19.01 April 30, 2019
Appendix A – Specimen Photos Page 21 of 24
http://www.cee.usu.edu/pages/smash-lab
Page 22
USU SMASH LAB Report No. SMASH.AC422.19.01 April 30, 2019
Appendix A – Specimen Photos Page 22 of 24
http://www.cee.usu.edu/pages/smash-lab
Page 23
USU SMASH LAB Report No. SMASH.AC422.19.01 April 30, 2019
Appendix A – Specimen Photos Page 23 of 24
http://www.cee.usu.edu/pages/smash-lab
Page 24
USU SMASH LAB Report No. SMASH.AC422.19.01 April 30, 2019
Appendix A – Specimen Photos Page 24 of 24
http://www.cee.usu.edu/pages/smash-lab
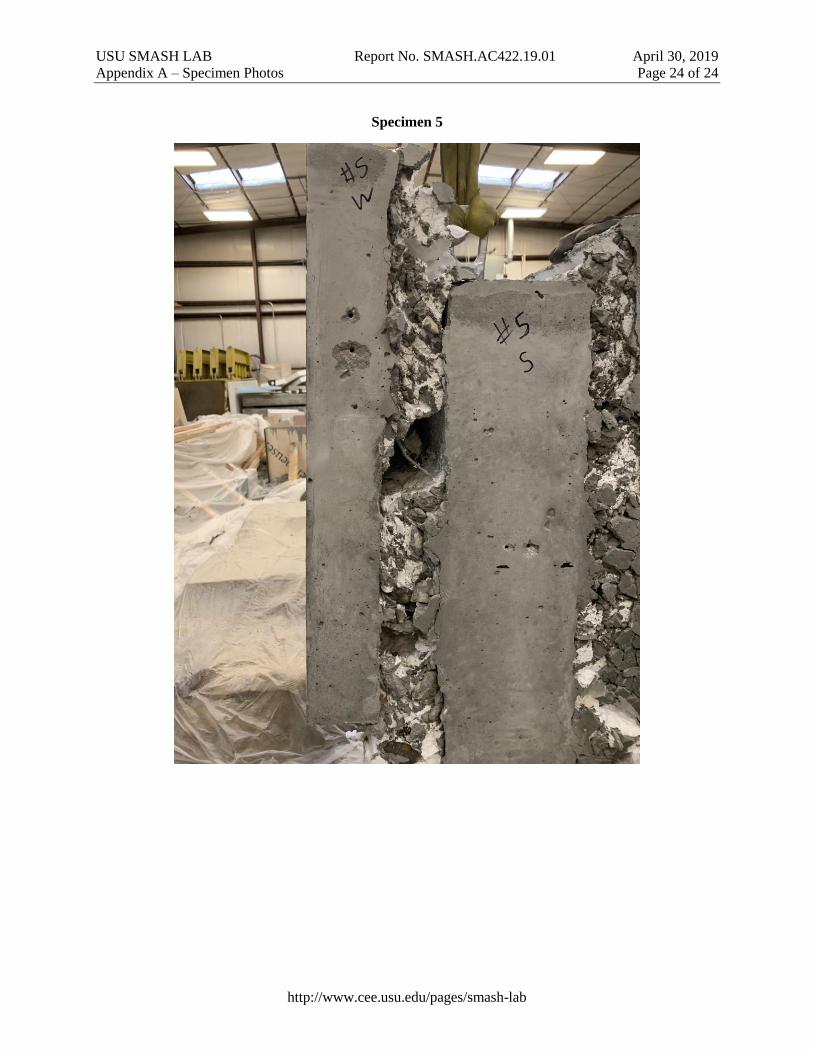
Specimen 5