2015-16 School Accountability Report Card for Douglas J. Miller Elementary School Page 1 of 13 Douglas J. Miller Elementary School School Accountability Report Card Reported Using Data from the 2015-16 School Year Published During 2016-17 By February 1 of each year, every school in California is required by state law to publish a School Accountability Report Card (SARC). The SARC contains information about the condition and performance of each California public school. Under the Local Control Funding Formula (LCFF) all local educational agencies (LEAs) are required to prepare a Local Control and Accountability Plan (LCAP), which describes how they intend to meet annual school-specific goals for all pupils, with specific activities to address state and local priorities. Additionally, data reported in an LCAP is to be consistent with data reported in the SARC. • For more information about SARC requirements, see the California Department of Education (CDE) SARC Web page at http://www.cde.ca.gov/ta/ac/sa/. • For more information about the LCFF or LCAP, see the CDE LCFF Web page at http://www.cde.ca.gov/fg/aa/lc/. • For additional information about the school, parents/guardians and community members should contact the school principal or the district office. DataQuest DataQuest is an online data tool located on the CDE DataQuest Web page at http://dq.cde.ca.gov/dataquest/ that contains additional information about this school and comparisons of the school to the district and the county. Specifically, DataQuest is a dynamic system that provides reports for accountability (e.g., test data, enrollment, high school graduates, dropouts, course enrollments, staffing, and data regarding English learners). Internet Access Internet access is available at public libraries and other locations that are publicly accessible (e.g., the California State Library). Access to the Internet at libraries and public locations is generally provided on a first-come, first-served basis. Other use restrictions may include the hours of operation, the length of time that a workstation may be used (depending on availability), the types of software programs available on a workstation, and the ability to print documents. About This School Contact Information (School Year 2016-17) School Contact Information School Name------- Douglas J. Miller Elementary School Street------- 7345 Mountain Ridge Drive City, State, Zip------- Bakersfield, CA 93313 Phone Number------- 661.836.6689 Principal------- Dan Bickham E-mail Address------- [email protected]Web Site------- http://www.pbvusd.k12.ca.us/Domain/17 CDS Code 15633620119099
Transcript
2015-16 School Accountability Report Card for Douglas J. Miller Elementary School Page 1 of 13
Douglas J. Miller Elementary School
School Accountability Report Card
Reported Using Data from the 2015-16 School Year
Published During 2016-17
By February 1 of each year, every school in California is required by state law to publish a School Accountability Report Card (SARC). The SARC contains information about the condition and performance of each California public school. Under the Local Control Funding Formula (LCFF) all local educational agencies (LEAs) are required to prepare a Local Control and Accountability Plan (LCAP), which describes how they intend to meet annual school-specific goals for all pupils, with specific activities to address state and local priorities. Additionally, data reported in an LCAP is to be consistent with data reported in the SARC. • For more information about SARC requirements, see the California Department of Education (CDE) SARC Web page at
http://www.cde.ca.gov/ta/ac/sa/. • For more information about the LCFF or LCAP, see the CDE LCFF Web page at http://www.cde.ca.gov/fg/aa/lc/. • For additional information about the school, parents/guardians and community members should contact the school principal or
the district office. DataQuest DataQuest is an online data tool located on the CDE DataQuest Web page at http://dq.cde.ca.gov/dataquest/ that contains additional information about this school and comparisons of the school to the district and the county. Specifically, DataQuest is a dynamic system that provides reports for accountability (e.g., test data, enrollment, high school graduates, dropouts, course enrollments, staffing, and data regarding English learners). Internet Access Internet access is available at public libraries and other locations that are publicly accessible (e.g., the California State Library). Access to the Internet at libraries and public locations is generally provided on a first-come, first-served basis. Other use restrictions may include the hours of operation, the length of time that a workstation may be used (depending on availability), the types of software programs available on a workstation, and the ability to print documents.
About This School Contact Information (School Year 2016-17)
School Contact Information
School Name------- Douglas J. Miller Elementary School
School Description and Mission Statement (School Year 2016-17)
Douglas J. Miller Elementary School opened in 2009. As the newest addition in the Panama Buena Vista Union School District, we proudly work to further "Excellence in Education." Located in southwest Bakersfield, CA- Miller Elementary is home to over 1,050 students Transitional Kindergarten through Sixth grade. Our namesake is more than a namesake. Douglas J.Miller, a former Superintendent of the Panama Buena Vista Union School District, built a legacy on investing in our most precious resources- children. Even today, Doug Miller, along with his wife Martha, continue to invest in children through their active involvement at school. Our mission is to work collaboratively as a staff and with parents to ensure that all of our students learn at the highest levels. Miller Elementary is continuously working to improve student learning. We are following a Learning Center Model which differs from the traditional school model in how we respond when children don't learn. Our "Response to Intervention" is designed to support students by offering additional, intensive interventions. We strive to teach students Respect, Responsibility, and Honesty. As "Miller Mustangs," we are committed to "Leading Through Reading" and developing life - time learners. Student Enrollment by Grade Level (School Year 2015-16)
Grade Number of
Level Students
Kindergarten 177
Grade 1 121
Grade 2 126
Grade 3 120
Grade 4 139
Grade 5 116
Grade 6 142
Total Enrollment 941
2015-16 School Accountability Report Card for Douglas J. Miller Elementary School Page 3 of 13
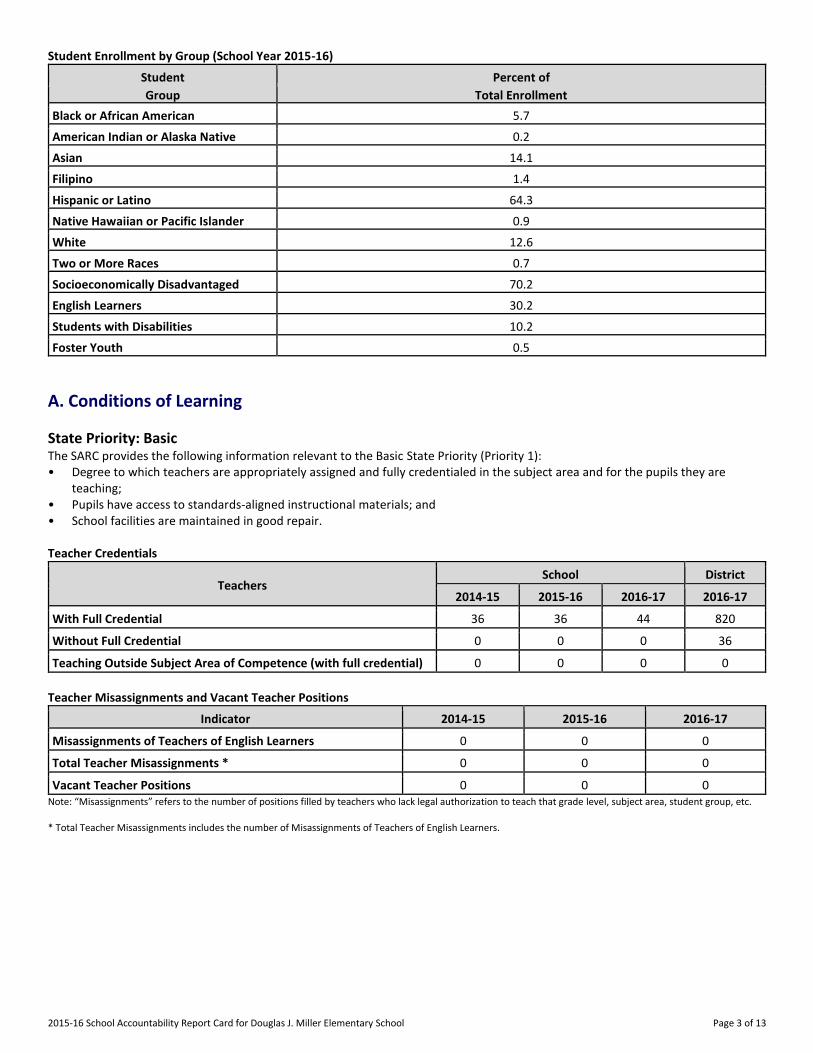
Student Enrollment by Group (School Year 2015-16)
Student Percent of
Group Total Enrollment
Black or African American 5.7
American Indian or Alaska Native 0.2
Asian 14.1
Filipino 1.4
Hispanic or Latino 64.3
Native Hawaiian or Pacific Islander 0.9
White 12.6
Two or More Races 0.7
Socioeconomically Disadvantaged 70.2
English Learners 30.2
Students with Disabilities 10.2
Foster Youth 0.5
A. Conditions of Learning
State Priority: Basic The SARC provides the following information relevant to the Basic State Priority (Priority 1): • Degree to which teachers are appropriately assigned and fully credentialed in the subject area and for the pupils they are
teaching; • Pupils have access to standards-aligned instructional materials; and • School facilities are maintained in good repair. Teacher Credentials
Teachers School District
2014-15 2015-16 2016-17 2016-17
With Full Credential 36 36 44 820
Without Full Credential 0 0 0 36
Teaching Outside Subject Area of Competence (with full credential) 0 0 0 0
Teacher Misassignments and Vacant Teacher Positions
Indicator 2014-15 2015-16 2016-17
Misassignments of Teachers of English Learners 0 0 0
Total Teacher Misassignments * 0 0 0
Vacant Teacher Positions 0 0 0 Note: “Misassignments” refers to the number of positions filled by teachers who lack legal authorization to teach that grade level, subject area, student group, etc. * Total Teacher Misassignments includes the number of Misassignments of Teachers of English Learners.
2015-16 School Accountability Report Card for Douglas J. Miller Elementary School Page 4 of 13
Core Academic Classes Taught by Highly Qualified Teachers (School Year 2015-16)
Location of Classes Percent of Classes In Core Academic Subjects
Taught by Highly Qualified Teachers Not Taught by Highly Qualified Teachers
This School 100.0 0.0
All Schools in District 100.0 0.0
High-Poverty Schools in District 100.0 0.0
Low-Poverty Schools in District 100.0 0.0 Note: High-poverty schools are defined as those schools with student eligibility of approximately 40 percent or more in the free and reduced price meals program. Low-poverty schools are those with student eligibility of approximately 39 percent or less in the free and reduced price meals program. Quality, Currency, Availability of Textbooks and Instructional Materials (School Year 2016-17) Year and month in which data were collected: 11/2015 All grade levels have access to Rigby reading books. This is for small group reading instruction and intervention. Students in 2nd - 6th grade utilize the Curriculum Associates Ready Common Core books for Math and Reading Language Arts. This is to help clarify and assess standards that are being taught in the classroom. Grade levels have access to Moby Max, Lexia Core 5, Reflex Math, Engaged New York, Raz-Kids, Accelerated Reader, Reading Rainbow, Scholastic News and various on line resources. In addition, all grade levels use Core Literature books to help enhance learning. Students have access to 95% Group materials in class and as a part of our Walk to Learn model. 95% Group materials are used to supplement ELA instruction. They are also used during intervention blocks to address the specific needs of students two or more years behind grade level.
Subject Textbooks and Instructional Materials/
Year of Adoption
From Most Recent
Adoption?
Percent of Students Lacking Own
Assigned Copy
Reading/Language Arts Adopted 2010: Macmillan McGraw-Hill, "Treasures" (K-6)
Yes 0
Mathematics Adopted 2014: Houghton Mifflin Harcourt "2015 California GO Math” K-8
History-Social Science Adopted 2006: Scott Foresman, “History-Social Science for California” (K-5); Glencoe “Discovering Our Past: Ancient Civilizations” (6th)
Yes 0
School Facility Conditions and Planned Improvements (Most Recent Year)
Miller School provides a safe and clean environment for learning. A scheduled maintenance program is administered by the District to ensure that all classrooms and facilities are maintained to a degree of adequacy that provides for good learning. Ongoing repairs and modifications to the physical plant exceed California Building and Safety Codes. The District’s Coordinator of Safety and Risk Management verifies quarterly that OSHA requirements are met. The exterior grounds are well lit and the perimeter of the school facility is fenced for student protection and safety. A team of custodians ensures classrooms and campus grounds are kept clean and safe. The restrooms are cleaned, sanitized and secured at the end of each school day with 100% of the toilets in operating condition. Grounds and playground equipment are inspected regularly for potential hazards.
2015-16 School Accountability Report Card for Douglas J. Miller Elementary School Page 5 of 13
School Facility Good Repair Status (Most Recent Year)
School Facility Good Repair Status (Most Recent Year) Year and month of the most recent FIT report: 9/15/2016
Year and month of the most recent FIT report: 9/15/2016
Overall Rating Exemplary Good Fair Poor
X
B. Pupil Outcomes
State Priority: Pupil Achievement The SARC provides the following information relevant to the State priority: Pupil Achievement (Priority 4): • Statewide assessments (i.e., California Assessment of Student Performance and Progress [CAASPP] System, which includes the
Smarter Balanced Summative Assessments for students in the general education population and the California Alternate Assessments [CAAs] for English language arts/literacy [ELA] and mathematics given in grades three through eight and grade eleven. The CAAs have replaced the California Alternate Performance Assessment [CAPA] for ELA and mathematics, which were eliminated in 2015. Only eligible students may participate in the administration of the CAAs. CAA items are aligned with alternate achievement standards, which are linked with the Common Core State Standards [CCSS] for students with significant cognitive disabilities); and
• The percentage of students who have successfully completed courses that satisfy the requirements for entrance to the University of California and the California State University, or career technical education sequences or programs of study
CAASPP Test Results in English Language Arts/Literacy (ELA) and Mathematics for All Students
Subject
Percent of Students Meeting or Exceeding the State Standards (grades 3-8 and 11)
School District State
2014-15 2015-16 2014-15 2015-16 2014-15 2015-16
English Language Arts/Literacy 33 39 39 46 44 48
Mathematics 24 28 27 31 34 36 Note: Percentages are not calculated when the number of students tested is ten or less, either because the number of students in this category is too small for statistical accuracy or to protect student privacy.
2015-16 School Accountability Report Card for Douglas J. Miller Elementary School Page 6 of 13
CAASPP Test Results in ELA by Student Group Grades Three through Eight and Grade Eleven (School Year 2015-16)
Student Group Grade
Number of Students Percent of Students
Enrolled Tested Tested Standard Met or
Exceeded
All Students 3 120 118 98.3 43.2
4 145 142 97.9 33.8
5 124 121 97.6 47.5
6 140 140 100.0 33.6
Male 3 61 59 96.7 33.9
4 69 69 100.0 27.5
5 55 54 98.2 35.2
6 70 70 100.0 34.3
Female 3 59 59 100.0 52.5
4 76 73 96.0 39.7
5 69 67 97.1 57.6
6 70 70 100.0 32.9
Black or African American 6 14 14 100.0 28.6
Asian 3 17 16 94.1 62.5
4 18 18 100.0 33.3
5 23 23 100.0 60.9
6 21 21 100.0 42.9
Hispanic or Latino 3 85 84 98.8 40.5
4 98 96 98.0 28.1
5 76 73 96.0 40.3
6 90 90 100.0 30.0
White 4 15 14 93.3 64.3
5 15 15 100.0 60.0
6 14 14 100.0 42.9
Socioeconomically Disadvantaged 3 77 76 98.7 38.2
4 106 103 97.2 27.2
5 90 88 97.8 47.1
6 105 105 100.0 30.5
English Learners 3 31 29 93.5 6.9
4 36 34 94.4 2.9
5 28 27 96.4 7.7
6 34 34 100.0
Students with Disabilities 3 14 14 100.0
4 21 21 100.0 19.1
6 20 20 100.0 5.0
2015-16 School Accountability Report Card for Douglas J. Miller Elementary School Page 7 of 13
Note: ELA test results include the Smarter Balanced Summative Assessment and the CAA. The “Percent Met or Exceeded” is calculated by taking the total number of students who met or exceeded the standard on the Smarter Balanced Summative Assessment plus the total number of students who met the standard on the CAAs divided by the total number of students who participated in both assessments. Double dashes (--) appear in the table when the number of students is ten or less, either because the number of students in this category is too small for statistical accuracy or to protect student privacy. Note: The number of students tested includes all students who participated in the test whether they received a score or not; however, the number of students tested is not the number that was used to calculate the achievement level percentages. The achievement level percentages are calculated using only students who received scores.
CAASPP Test Results in Mathematics by Student Group Grades Three through Eight and Grade Eleven (School Year 2015-16)
Student Group Grade
Number of Students Percent of Students
Enrolled Tested Tested Standard Met or
Exceeded
All Students 3 120 118 98.3 42.4
4 145 142 97.9 31.0
5 124 120 96.8 17.5
6 140 140 100.0 23.6
Male 3 61 59 96.7 33.9
4 69 69 100.0 31.9
5 55 54 98.2 24.1
6 70 70 100.0 27.1
Female 3 59 59 100.0 50.9
4 76 73 96.0 30.1
5 69 66 95.7 12.1
6 70 70 100.0 20.0
Black or African American 6 14 14 100.0 7.1
Asian 3 17 16 94.1 43.8
4 18 18 100.0 50.0
5 23 23 100.0 21.7
6 21 21 100.0 28.6
Hispanic or Latino 3 85 84 98.8 41.7
4 98 96 98.0 22.9
5 76 72 94.7 13.9
6 90 90 100.0 22.2
White 4 15 14 93.3 64.3
5 15 15 100.0 26.7
6 14 14 100.0 35.7
Socioeconomically Disadvantaged 3 77 76 98.7 40.8
4 106 103 97.2 25.2
5 90 87 96.7 11.5
6 105 105 100.0 23.8
English Learners 3 31 29 93.5 6.9
4 36 34 94.4 5.9
2015-16 School Accountability Report Card for Douglas J. Miller Elementary School Page 8 of 13
Student Group Grade
Number of Students Percent of Students
Enrolled Tested Tested Standard Met or
Exceeded
5 28 26 92.9
6 34 34 100.0
Students with Disabilities 3 14 14 100.0
4 21 21 100.0 14.3
6 20 20 100.0 5.0
Note: Mathematics test results include the Smarter Balanced Summative Assessment and the CAA. The “Percent Met or Exceeded” is calculated by taking the total number of students who met or exceeded the standard on the Smarter Balanced Summative Assessment plus the total number of students who met the standard on the CAAs divided by the total number of students who participated in both assessments. Double dashes (--) appear in the table when the number of students is ten or less, either because the number of students in this category is too small for statistical accuracy or to protect student privacy. Note: The number of students tested includes all students who participated in the test whether they received a score or not; however, the number of students tested is not the number that was used to calculate the achievement level percentages. The achievement level percentages are calculated using only students who received scores.
CAASPP Test Results in Science for All Students
Subject
Percent of Students Scoring at Proficient or Advanced (meeting or exceeding the state standards)
Science (grades 5, 8, and 10) 68 38 51 61 53 53 60 56 54 Note: Science test results include California Standards Tests (CSTs), California Modified Assessment (CMA), and California Alternate Performance Assessment (CAPA) in grades five, eight, and ten. Note: Scores are not shown when the number of students tested is ten or less, either because the number of students in this category is too small for statistical accuracy or to protect student privacy.
CAASPP Test Results in Science by Student Group Grades Five, Eight, and Ten (School Year 2015-16)
Student Group
Total Enrollment
# of Students with Valid Scores
% of Students with Valid Scores
% of Students Proficient or
Advanced
All Students 124 120 96.8 50.8
Male 55 54 98.2 48.2
Female 69 66 95.7 53.0
Asian 23 23 100.0 47.8
Hispanic or Latino 76 72 94.7 44.4
White 15 15 100.0 80.0
Socioeconomically Disadvantaged 90 87 96.7 44.8
English Learners 28 26 92.9 19.2 Note: Science test results include CSTs, CMA, and CAPA in grades five, eight, and ten. The “Proficient or Advanced” is calculated by taking the total number of students who scored at Proficient or Advanced on the science assessment divided by the total number of students with valid scores. Note: Scores are not shown when the number of students tested is ten or less, either because the number of students in this category is too small for statistical accuracy or to protect student privacy.
2015-16 School Accountability Report Card for Douglas J. Miller Elementary School Page 9 of 13
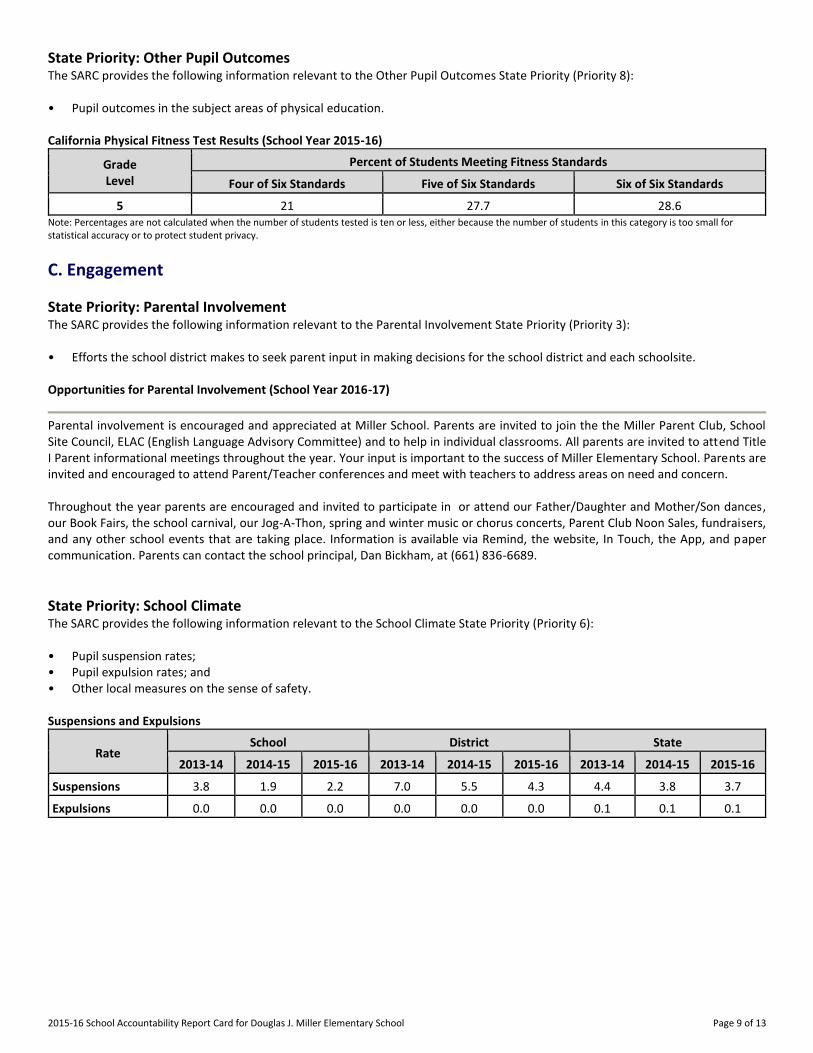
State Priority: Other Pupil Outcomes The SARC provides the following information relevant to the Other Pupil Outcomes State Priority (Priority 8): • Pupil outcomes in the subject areas of physical education. California Physical Fitness Test Results (School Year 2015-16)
Grade Level
Percent of Students Meeting Fitness Standards
Four of Six Standards Five of Six Standards Six of Six Standards
---5--- 21 27.7 28.6 Note: Percentages are not calculated when the number of students tested is ten or less, either because the number of students in this category is too small for statistical accuracy or to protect student privacy.
C. Engagement
State Priority: Parental Involvement The SARC provides the following information relevant to the Parental Involvement State Priority (Priority 3): • Efforts the school district makes to seek parent input in making decisions for the school district and each schoolsite. Opportunities for Parental Involvement (School Year 2016-17)
Parental involvement is encouraged and appreciated at Miller School. Parents are invited to join the the Miller Parent Club, School Site Council, ELAC (English Language Advisory Committee) and to help in individual classrooms. All parents are invited to attend Title I Parent informational meetings throughout the year. Your input is important to the success of Miller Elementary School. Parents are invited and encouraged to attend Parent/Teacher conferences and meet with teachers to address areas on need and concern. Throughout the year parents are encouraged and invited to participate in or attend our Father/Daughter and Mother/Son dances, our Book Fairs, the school carnival, our Jog-A-Thon, spring and winter music or chorus concerts, Parent Club Noon Sales, fundraisers, and any other school events that are taking place. Information is available via Remind, the website, In Touch, the App, and paper communication. Parents can contact the school principal, Dan Bickham, at (661) 836-6689.
State Priority: School Climate The SARC provides the following information relevant to the School Climate State Priority (Priority 6): • Pupil suspension rates; • Pupil expulsion rates; and • Other local measures on the sense of safety. Suspensions and Expulsions
2015-16 School Accountability Report Card for Douglas J. Miller Elementary School Page 10 of 13
School Safety Plan (School Year 2016-17)
Miller Elementary has procedures and expectations to ensure a positive learning environment for all students. We believe in the motto of Respect, Responsibility, and Honesty. We believe that discipline is a process that uses teaching, modeling and other appropriate strategies to maintain the behaviors necessary to ensure a safe, orderly and productive learning environment by changing unacceptable behavior to acceptable behavior. Parents and students are informed of discipline policies at the beginning of each school year through classroom orientation as well as the Miller Parent Handbook. We encourage good attendance because of its significant impact on student learning. Students with excessive tardies, truancies, or unexcused absences are subject to disciplinary action including detention and mandatory parent conferences. Miller establishes guidelines to provide students with a meaningful, productive, and enjoyable school experience. Appropriate behavior is encouraged through praise and motivational incentives as well as assertive discipline and conflict resolution tools to further develop personal growth. Expulsions occur only when required by law or when all other alternatives are exhausted. Our School Safety Plan was reviewed, discussed updated and adopted on 10/20/16 by our site council made up of parents and staff. This plans provides all of our safeguards regarding our students. This includes earthquake, fire, lock down, shelter in place, an others. Our staff is aware of their roles in the event of an emergency and will respond accordingly. As outlined in our Safe Schools Plan, the safety committee has addressed concerns for the safe coming and going of our students. Staff receive in-service in emergency protocol and CPR. The District provides on-going training in CPR/First Aid as part of its staff development program. Fire and/or disaster drills occur monthly and a complete school site disaster plan has been prepared and is in place and available for public review. Identifying tags are issued to substitute teachers, volunteers, and other visitors as they register in our office. The gates on the perimeter of the school playground are locked during school hours and staff members are trained to activate lock down procedures in the event of an emergency. Our positive partnership with local law enforcement is evident in their quick response time when concerns arise. Designated staff members carefully supervise students on the playground and in the cafeteria. Scheduled certificated supervision of students begins officially at 7:20 a.m. when the school opens and supervision ends at 2:45 p.m. One parent discussed a web based accounting system that is similar to one used in another district. That information was then passed on to district personnel.
D. Other SARC Information
The information in this section is required to be in the SARC but is not included in the state priorities for LCFF. Federal Intervention Program (School Year 2016-17)
Indicator School District
Program Improvement Status In PI In PI
First Year of Program Improvement 2013-2014 2011-2012
Year in Program Improvement* Year 1 Year 3
Number of Schools Currently in Program Improvement N/A 9
Percent of Schools Currently in Program Improvement N/A 75.0 Note: Cells with N/A values do not require data.
2015-16 School Accountability Report Card for Douglas J. Miller Elementary School Page 11 of 13
Average Class Size and Class Size Distribution (Elementary)
Grade Level
2013-14 2014-15 2015-16
Avg. Class Size
Number of Classes Avg. Class Size
Number of Classes Avg. Class Size
Number of Classes
1-20 21-32 33+ 1-20 21-32 33+ 1-20 21-32 33+
K
31 5 24 6 24 6
1
31 4 24 5 24 5
2
31 4 26 4 26 4
3
27 1 4 26 1 4 26 1 4
4
32 4 31 3 31 3
5
33 1 1 29 5 29 5
6
26 1 1 3 30 4 30 4
Other
33 1 Number of classes indicates how many classes fall into each size category (a range of total students per class).
Academic Counselors and Other Support Staff (School Year 2015-16)
Title Number of FTE
Assigned to School Average Number of Students per
Academic Counselor
Academic Counselor------- 0 0
Counselor (Social/Behavioral or Career Development) 0 N/A
Library Media Teacher (Librarian) 0 N/A
Library Media Services Staff (Paraprofessional) 1 N/A
Psychologist------- 1 N/A
Social Worker------- 0 N/A
Nurse------- 1 N/A
Speech/Language/Hearing Specialist 1 N/A
Resource Specialist------- 2 N/A
Other------- N/A Note: Cells with N/A values do not require data. *One Full Time Equivalent (FTE) equals one staff member working full time; one FTE could also represent two staff members who each work 50 percent of full time.
Expenditures per Pupil and School Site Teacher Salaries (Fiscal Year 2014-15)
Level
Expenditures Per Pupil Average Teacher Salary Total
Supplemental/ Restricted
Basic/ Unrestricted
School Site------- $7,560.00 $1,849.00 $5,711.00 $65,082.18
District------- N/A N/A $4,900.00 $67,421
Percent Difference: School Site and District N/A N/A 16.6 -3.5
State------- N/A N/A $5,677 $75,137
Percent Difference: School Site and State N/A N/A 0.6 -13.4 Note: Cells with N/A values do not require data.
2015-16 School Accountability Report Card for Douglas J. Miller Elementary School Page 12 of 13
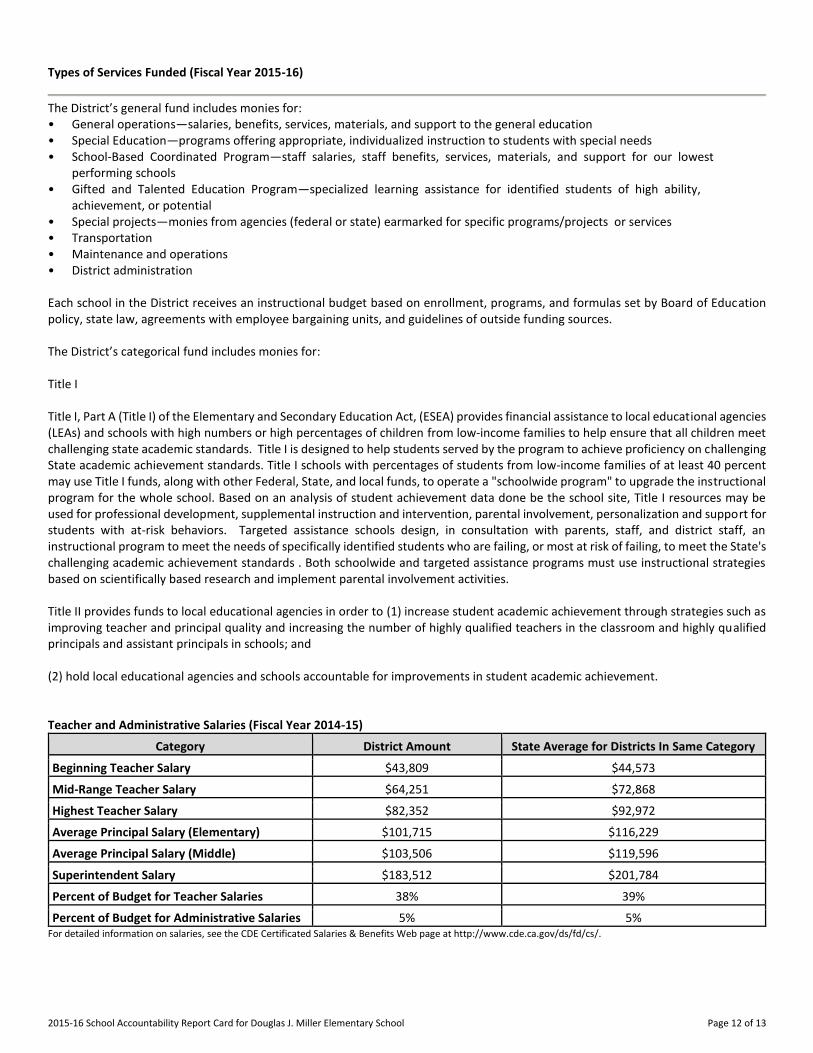
Types of Services Funded (Fiscal Year 2015-16)
The District’s general fund includes monies for: • General operations—salaries, benefits, services, materials, and support to the general education • Special Education—programs offering appropriate, individualized instruction to students with special needs • School-Based Coordinated Program—staff salaries, staff benefits, services, materials, and support for our lowest
performing schools • Gifted and Talented Education Program—specialized learning assistance for identified students of high ability,
achievement, or potential • Special projects—monies from agencies (federal or state) earmarked for specific programs/projects or services • Transportation • Maintenance and operations • District administration Each school in the District receives an instructional budget based on enrollment, programs, and formulas set by Board of Education policy, state law, agreements with employee bargaining units, and guidelines of outside funding sources. The District’s categorical fund includes monies for: Title I Title I, Part A (Title I) of the Elementary and Secondary Education Act, (ESEA) provides financial assistance to local educational agencies (LEAs) and schools with high numbers or high percentages of children from low-income families to help ensure that all children meet challenging state academic standards. Title I is designed to help students served by the program to achieve proficiency on challenging State academic achievement standards. Title I schools with percentages of students from low-income families of at least 40 percent may use Title I funds, along with other Federal, State, and local funds, to operate a "schoolwide program" to upgrade the instructional program for the whole school. Based on an analysis of student achievement data done be the school site, Title I resources may be used for professional development, supplemental instruction and intervention, parental involvement, personalization and support for students with at-risk behaviors. Targeted assistance schools design, in consultation with parents, staff, and district staff, an instructional program to meet the needs of specifically identified students who are failing, or most at risk of failing, to meet the State's challenging academic achievement standards . Both schoolwide and targeted assistance programs must use instructional strategies based on scientifically based research and implement parental involvement activities. Title II provides funds to local educational agencies in order to (1) increase student academic achievement through strategies such as improving teacher and principal quality and increasing the number of highly qualified teachers in the classroom and highly qualified principals and assistant principals in schools; and (2) hold local educational agencies and schools accountable for improvements in student academic achievement. Teacher and Administrative Salaries (Fiscal Year 2014-15)
Category District Amount State Average for Districts In Same Category
Beginning Teacher Salary $43,809 $44,573
Mid-Range Teacher Salary $64,251 $72,868
Highest Teacher Salary $82,352 $92,972
Average Principal Salary (Elementary) $101,715 $116,229
Average Principal Salary (Middle) $103,506 $119,596
Superintendent Salary $183,512 $201,784
Percent of Budget for Teacher Salaries 38% 39%
Percent of Budget for Administrative Salaries 5% 5% For detailed information on salaries, see the CDE Certificated Salaries & Benefits Web page at http://www.cde.ca.gov/ds/fd/cs/.
2015-16 School Accountability Report Card for Douglas J. Miller Elementary School Page 13 of 13
Professional Development (Most Recent Three Years)
Professional Development Focus areas include Technology, 95% Group Intervention for MTSS, Direct Interactive Instruction, Classroom Management, Common Core Standards Implementation, Grade Level Focus Groups, DIBELS, as well as PBIS and AVID implementation. Areas were selected based on a district-wide survey reflecting on student achievement and areas of additional need from the teacher point of view. Professional development is delivered through Staff Development Days, Grade Level Focus Groups, conference attendance, and District workshops with teacher release time. Professional Readiness and Educational Program days (Prep Days) which include one (1) hour each week release time, is also provided for teachers to receive school site staff development and work with their collaborative teams. Teachers attend multi-day seminars with presenters and follow-up coaching is provided to support Direct Interactive Instruction and to develop standards-based common core lessons. Teachers are also supported by curriculum specialists, categorical program specialists, BTSA Induction mentors, and Academic Coaches.