Munich Personal RePEc Archive The Occupations and Human Capital of U.S. Immigrants Todd Schoellman Clemson University 23. March 2009 Online at http://mpra.ub.uni-muenchen.de/14236/ MPRA Paper No. 14236, posted 24. March 2009 05:14 UTC
Transcript
MPRAMunich Personal RePEc Archive
The Occupations and Human Capital ofU.S. Immigrants
Todd Schoellman
Clemson University
23. March 2009
Online at http://mpra.ub.uni-muenchen.de/14236/MPRA Paper No. 14236, posted 24. March 2009 05:14 UTC
This paper estimates the multi-dimensional human capital endowments of im-
migrants by characterizing their occupational decisions. This approach allows for
estimation of physical skill and cognitive ability endowments, which are difficult to
measure directly. Estimation implies that immigrants as a whole are abundant in
cognitive ability and scarce in experience/training and communication skills. Coun-
terfactual estimates of the wage impacts of immigration are skewed: the largest gain
from preventing immigration is 3.2% higher wages, but the largest loss is 0.3% lower
wages. Crowding of immigrants into select occupations plays a minor role in explain-
ing these impacts; occupations’ skill attributes explain the bulk.
∗Thanks to Curtis Simon, Kevin Murphy, Lutz Hendricks and seminar participants at the Clemson BagLunch, UNC - Chapel Hill, and the 2009 Econometric Society Winter Meetings for helpful comments onearly work. Also, thanks to Sherry Meador for research assistance and to Tom Mroz for generous adviceand use of computational resources. The usual disclaimer applies.†Address: John E. Walker Department of Economics, Clemson University, Clemson, SC 29642. E-mail:
After reaching an historic low in 1970, the immigrant share of the U.S. population has risen
steadily. Today there are four times as many immigrants as 1970, comprising 12.6% of the
population.1 The boom and bust cycle of immigration has led to renewed interest in its
effects on the United States, particularly its effects on labor market outcomes for native
workers.
A major focus of the existing research is on the skills of these immigrants. If workers
with different skill sets are imperfect substitutes in production, and immigration changes the
aggregate supply of workers with different skill sets, then immigrants affect relative wages
in the economy. Card (2001) looks at how immigrants affect the relative supply of six broad
occupation groups and estimates an upper bound for wage losses of 1-3%; Borjas (2003)
looks at how immigrants affect the relative supply of forty experience-schooling categories
and estimates an upper bound wage loss of 8.9%. In both cases, losses are concentrated
among the low-skilled workers and less prevalent among the high-skilled workers.
In this paper I estimate the multi-dimensional human capital endowment of immigrants
from different countries using their observed occupational choices. An individual’s occupa-
tion reveals a great deal of information about their likely skills: their education, cognitive
ability, training, physical strength, coordination, and so on. By observing the occupational
choices of many immigrants from a single country, it is possible to quantify this informa-
tion. The primary advantage of inferring skills is that I can estimate endowments of skills
that are difficult to measure directly: here, cognitive ability and physical skills. It is then
possible to estimate the importance of immigration to the aggregate supplies of these skills,
and evaluate the wage effects of immigration in a more multidimensional skill space.
To quantify the information available in occupational choices, I present a model of labor
markets similar to Lazear (2003). Human capital is a vector of different attributes such as
physical skills, education, or cognitive ability. Workers have heterogeneous endowments of
human capital drawn from distributions that vary by their country of birth. Occupations
are differentiated by how intensively they use each of the available skills. Markets are
competitive, so occupations offer higher wages to workers with higher endowments of the
skills they use intensively. Workers respond to these wages by sorting into occupations that
use their abundant skills intensively.
I estimate workers’ propensity to choose occupations as a function of the skill intensity
characteristics of the occupations. Data on adult immigrants and their occupational choices
1Migration Policy Institute (2009), using Census and ACS data.
2
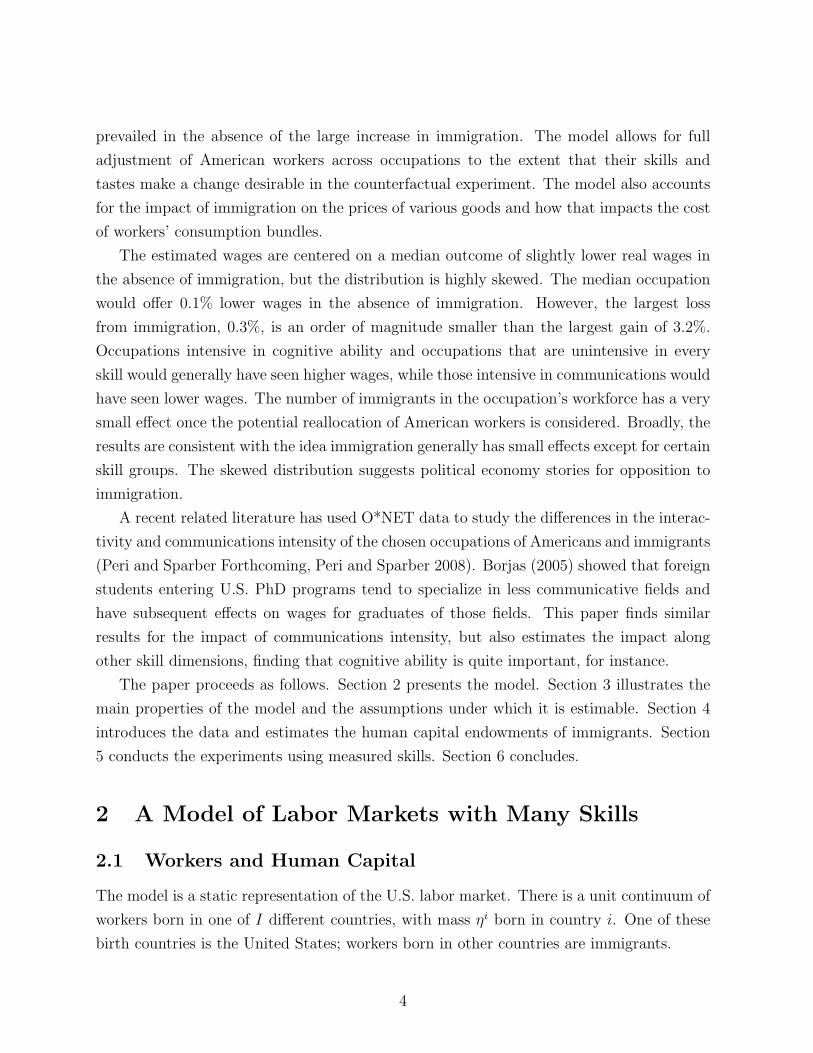
is drawn from the 2000 U.S. Census, which offers a large, representative sample. Figure 1
is a histogram showing that immigrants’ occupational choices are likely to be informative.
It groups occupations into bins by the fraction of their workforce that is foreign-born.
Immigrants are 8.6% of the sample, but the fraction foreign-born in a given occupation
ranges from 0.6% to 46%.
<5%10-15%
20-25%
30-35%
40-45%
>50%
0.0
0.1
0.2
0.3
0.4
0.5
% Immigrant
Fra
ctio
n of
Occ
upat
ions
Figure 1: Fraction of Workers Foreign Born, by Occupation
Data on the skill characteristics of occupations is drawn from the O*NET 12.0 database,
the successor to the older Dictionary of Occupational Titles (DOT).2 From the over 250
occupation attributes I construct skill intensity measures for five dimensions of skills: ed-
ucation, training and experience, cognitive ability, physical skills, and language and com-
muncation skills. Using different assumptions on the underlying distribution of skills for
immigrants I show that they are broadly abundant in cognitive ability and scarce in com-
munications skills and training and experience. There are interesting composition effects
underlying these aggregate measures: immigrants from developing countries tend to have
more physical skills, and unauthorized immigrants have much lower cognitive ability, for
instance.
The worker’s occupational decision is embedded into a tractable general equilibrium
model, allowing for counterfactual experiments simulating the outcomes that would have
2Information on the characteristics of occupations has been used elsewhere to measure the specificityor generality of skills to occupations (Spitz-Oener 2006, Gathmann and Schonberg 2008), the effects ofcomputerization on workers (Autor, Levy, and Murnane 2003), and the rise in the returns to broadlydefined sets of skills (Ingram and Neumann 2006). In addition to the immigration-related papers discussedbelow, O*NET data have previously been used to study the types of tasks that have been or could beoutsourced (Jensen and Kletzer 2007, Blinder 2007, Costinot, Oldenski, and Rauch 2009, Ritter 2008).
3
prevailed in the absence of the large increase in immigration. The model allows for full
adjustment of American workers across occupations to the extent that their skills and
tastes make a change desirable in the counterfactual experiment. The model also accounts
for the impact of immigration on the prices of various goods and how that impacts the cost
of workers’ consumption bundles.
The estimated wages are centered on a median outcome of slightly lower real wages in
the absence of immigration, but the distribution is highly skewed. The median occupation
would offer 0.1% lower wages in the absence of immigration. However, the largest loss
from immigration, 0.3%, is an order of magnitude smaller than the largest gain of 3.2%.
Occupations intensive in cognitive ability and occupations that are unintensive in every
skill would generally have seen higher wages, while those intensive in communications would
have seen lower wages. The number of immigrants in the occupation’s workforce has a very
small effect once the potential reallocation of American workers is considered. Broadly, the
results are consistent with the idea immigration generally has small effects except for certain
skill groups. The skewed distribution suggests political economy stories for opposition to
immigration.
A recent related literature has used O*NET data to study the differences in the interac-
tivity and communications intensity of the chosen occupations of Americans and immigrants
(Peri and Sparber Forthcoming, Peri and Sparber 2008). Borjas (2005) showed that foreign
students entering U.S. PhD programs tend to specialize in less communicative fields and
have subsequent effects on wages for graduates of those fields. This paper finds similar
results for the impact of communications intensity, but also estimates the impact along
other skill dimensions, finding that cognitive ability is quite important, for instance.
The paper proceeds as follows. Section 2 presents the model. Section 3 illustrates the
main properties of the model and the assumptions under which it is estimable. Section 4
introduces the data and estimates the human capital endowments of immigrants. Section
5 conducts the experiments using measured skills. Section 6 concludes.
2 A Model of Labor Markets with Many Skills
2.1 Workers and Human Capital
The model is a static representation of the U.S. labor market. There is a unit continuum of
workers born in one of I different countries, with mass ηi born in country i. One of these
birth countries is the United States; workers born in other countries are immigrants.
4
Workers have two sources of heterogeneity. First, they have idiosyncratic tastes for each
of the J different occupations in which they can work; denote their tastes by ε = (εj)Jj=1.
Tastes are assumed to be draws from a common distribution with cdf G(ε), defined on
(0,∞)J . Second, they have idiosyncratic skill endowments, H. H is an S-dimensional
vector rather than a scalar, H = (h1, h2, ..hS). Each s denotes a specific type of human
capital, which I call a skill, although it may also include abilities, training, or any of the
other common notions of human capital. Human capital endowments are drawn from a
distribution that varies by country of birth, with conditional cdf F (H|i). This distribution
is the object of interest. Skills may vary by country of birth due to differences in early
lifetime environments or due the effects of self-selection and U.S. policy selection acting on
the pool of foreign-born workers. Let F (H) denote the unconditional distribution in the
population. Both the conditional and unconditional distributions are defined on (0,∞)S.
In choosing their occupation, workers take into account both the wages they will earn
and their tastes for the work they will be asked to perform. Taste draws are normalized to
represent compensating wage differentials, and workers maximize the weighted product of
wages and tastes,
φ log(W j(H)) + log(εj) (1)
As long as F and G are both continuous, this problem will generally have a unique solution.
Let the indicator dj(H, ε) be a dummy variable taking a value of 1 if j is the solution to
this problem and a value of 0 otherwise. Workers inelastically supply a single unit of labor
to their chosen profession. They spend their wages on consumption C(H, ε).
2.2 Occupations and Firms
Each of the J occupations in the economy uses all the available skills of workers, but
occupations vary in how intensively they use the skills. Occupation j has skill intensity
parameters (ωjs)Ss=1. A worker employed in this occupation produces output:
AjΠSs=1(hs)
ωjs
where Aj is occupation j’s general productivity which affects all workers equally.3 ωjs is
occupation j’s s-intensity, the rate at which it uses a worker’s endowment of skill s.
3A linear production technology is equivalent to a setup with capital markets that holds K/Y constantacross steady states. It is controversial in the literature whether capital adjusts completely in response toimmigration; see for instance Borjas (2003) and Ottaviano and Peri (2007).
5
The output of each occupation is a differentiated intermediate commodity used in pro-
ducing the aggregate final goods bundle. The economy has a large number of price-taking
firms. Firms specialize in hiring workers in a single occupation and producing the differen-
tiated output specific to that occupation. For example, law firms hire lawyers and produce
legal services. Firms hire Lj(H) workers of type H at the prevailing wage W j(H). They
sell the output in a competitive market at price P j. Their hiring and production decisions
maximize profits for each possible type of labor they can hire:
P jAjLj(H)ΠSs=1(hs)
ωjs − Lj(H)W (H) (2)
Y j =∫Y j(H)dF (H) is the total production of occupational output j.
Finally, there exists a single price-taking final goods producer. The producer faces prices
P j and purchases quantities of occupational outputs Xj. It aggregates the occupational
outputs using a CES production function with elasticity of substitution ψ. It sells its
output Y to consumers. The price of the final good is normalized to be the numeraire of
the economy. Then the final goods producer maximizes profits:[J∑j=1
(Xj)1−1/ψ
]ψ/(ψ−1)
−J∑j=1
XjP j (3)
2.3 Equilibrium
For the purposes of conducting counterfactual experiments, it is necessary to define the
equilibrium conditions of the economy. There are three sets of market clearing conditions
for this economy: one condition for output, one condition for each of the occupational goods
markets, and one condition for each type of human capital. They are given by:
Y =
∫ ∫c(H, ε)dF (H)dG(ε) (4)
Xj =
∫Y j(H)dF (H) ∀j (5)
Lj(H) =
∫dj(H, ε)dF (H)dG(ε) ∀j,H (6)
An equilibrium in this economy is a set of prices (P j, R,W (H)), allocations for the
workers, (c(H), dj(H, ε)), allocations for intermediate goods firms, (Lj(H), Y j(H)), and
allocations for the final goods producer (Y,Xj) that satisfy the following conditions:
1. Taking wages as given, workers maximize their objective (1).
6
2. Taking prices as given, intermediate firms maximize profits, (2).
3. Taking prices as given, the final goods producer maximizes profits, (3)
4. Markets clear, (4) - (6).
3 Equilibrium Predictions
The equilibrium has two main predictions which are useful for the results that follow. First,
labor market outcomes are characterized by specialization driven by endowments, similar
to the Heckscher-Ohlin theory of trade. Workers who are more skill s-abundant are more
likely to choose occupations that are s-intensive. The random draws of preferences make
the results easier to characterize by changing binary outcomes to continuous probabilities
of choosing occupations. Further, the random draws suggest a way to estimate the human
capital endowments using logits. The second prediction is that aggregate prices and wages
are affected by the aggregate supply of different combinations of human capital. This result
gives the counterfactual experiments their interest, by linking the wage effects of immigrants
to their impact on the aggregate skill distribution.
3.1 Allocation of Workers to Occupations
In equilibrium, the wage offered to worker H if she chooses occupation j is given by:
W j(H) = P jAjΠSs=1(hs)
ωjs (7)
Workers choose the occupation j that maximizes the product of wages and the idiosyn-
cratic preference for occupation j. I rewrite this as maximization in logs:
φ log(Aj) + φ log(P j) +S∑s=1
φωjs log(hs) + log(εj)
This discrete choice equation can be estimated under a variety of assumption on the
cdf’s F and G. However, throughout this paper I specialize to a particular choice for G,
given in Assumption 1.
Assumption 1 – Distribution of Preferences
log(εj) is distributed i.i.d according to the Type-I extreme value distribution.
7
The extreme value distribution means that the problem fits in the probabilistic choice
framework or random utility model of McFadden (1974). It allows for clean propositions
about the behavior of the model to motivate the estimation. However, the driving consid-
eration here is computational burden. Logit models are well-known to be more practical
than alternatives such as multinomial probits for estimation with large sample sizes or large
number of choices; I have both. Additionally, since I consider mixed as well as conditional
logits in Section 4, I can test whether the usual restrictions of the conditional logit (includ-
ing IIA) bind here. Given a worker’s human capital H, the likelihood that worker chooses
occupation j′ is given by:
q(j′|H) =
[P j′Aj
′ΠSs=1h
ωj′ss
]φ∑J
j=1
[P jAjΠS
s=1hωj
ss
]φ (8)
Alternatively, the probability that a worker with human capital H chooses j over j′ is
given by [W j(H)/W j′(H)]φ. Hence, φ indexes the relative importance of pecuniary and
non-pecuniary factors for occupational choices. For φ = 1, workers are twice as likely to
choose a job that pays twice as well. As φ becomes larger, a given wage difference becomes
more important and the higher-paying occupation is increasingly likely to be chosen. One
convenient result of using the logit framework is that it is straightforward to give the
comparative statics results. For this model the key comparative static is how changes in a
worker’s skill abundance affects her probability of matching in each of the J occupations.
Proposition 1 – Abundance-Intensity Matching
A marginal increase in log(hs) makes a worker more likely to work in occupations that are
more s-intensive than the expected local alternative and less likely to work in occupations
that are less s-intensive than the expected local alternative.
The proposition comes directly from the usual marginal effects equation in a conditional
logit model.4 It is the analogue to a comparative advantage in trade: an increase in s-
abundance makes a worker more likely to choose s-intensive occupations. With multiple
choices and idiosyncratic preferences, an occupation is s-intensive if its intensity parameter
ωjs is higher than the probability-weighted local alternative for a given worker.
For a marginal change it is possible to hold prices and wages constant. An important
and related question is what would happen to prices and wages if all workers became more
4The exact equation is ∂q(j′|H)∂ log(hs) = φq(j′|H)
[ωj′
s −∑J
j=1 ωjsq(j|H)
]
8
s-abundant. Proposition 1 is inherently partial equilibrium, so it offers little guidance to
these questions. The next section provides a general equilibrium result.
3.2 Prices and Wages in General Equilibrium
The wages offered to workers who choose two different occupations will in general depend on
the prices offered for the output of those occupations, as can be seen by equation (7). Prices
are determined in general equilibrium to allocate labor across occupations in a way that is
consistent with the final goods producer’s demand given his CES production function. The
primary determinant of the prices is the abundance of different types of skills. One would
expect that an abundance of skill type H would lower the prices and wages of occupations
in which H-endowed workers have a comparative advantage. In the the case where all
workers have the same human capital vector H, this is easily shown. The relative prices of
any two goods in this economy are given by:
P j
P j′=
[AjΠS
s=1hωj
ss
Aj′ΠSs=1h
ωj′ss
]−(1+φ)/(ψ+φ)
(9)
Proposition 2 follows directly from equation (9).
Proposition 2 – Skill Abundance, Prices, and Wages
Suppose there are two economies: in the former, all workers have human capital H, while
in the latter, all workers have human capital H ′. Let workers with human capital H have a
comparative advantage in occupation j instead of j′, in the sense thatΠS
s=1hω
js
s
ΠSs=1h
ωj′s
s
>ΠS
s=1(h′s)ω
js
ΠSs=1(h′
s)ωj′s
.
Then if technologies Aj are the same in the two economies, the relative prices and wages
of j will be lower in the economy with human capital H than in the economy with human
capital H ′.
Aggregate skill abundance affects wages and prices. Since immigrants have different
skills than the average American-born workers, they affect the aggregate skill abundance
in the U.S. and hence wages and prices.
4 Empirical Strategy
If there were widely available information on the human capital dimensions of interest, it
would be possible to use those measures to test the model’s sorting predictions, and to
9
estimate the impact of immigrants on wages. But for several measures, such as physical
skills or cognitive ability, there is little or no information. Instead, I use the model to
estimate the implied human capital endowments of workers. The U.S. Census gives occu-
pational choices for large samples of immigrants from many countries. I combine this data
with the O*NET database, which contains a wealth of information on the characteristics of
occupations. It is possible to infer the skill endowments of workers from a given country by
measuring the skill intensities of the occupations they do and do not choose. For measures
of human capital where proxies are available, I use those proxies as an exogenous check on
my constructed measures. I also show that the model-generated wages provide a reasonable
match to the data, suggesting that the model is measuring the wage mechanism.
4.1 Data
The data for this project are taken from two sources. Data on the occupations and charac-
teristics of immigrants come from the 5% sample of the 2000 U.S. Census, drawn from
the IPUMS-USA system (Ruggles, Sobek, Alexander, Fitch, Goeken, Hall, King, and
Ronnander 2004). The Census asks every respondent to list their country of birth. For
privacy reasons, it aggregates this data so that no birthplace with fewer than 10,000 im-
migrants is reported separately. After aggregation, there are observations for 131 different
birthplaces, including the United States. Some of the birthplaces are nonstandard; for in-
stance, there are response categories for Czechoslovakia, the Czech Republic, and Slovakia,
since immigrants may have departed before or after the split. I preserve every statistical
entity which is separately identified, and refer to them as countries as a shorthand.5
The reason for focusing on country of birth is to estimate the results of different environ-
ments and sorting processes. To ensure that workers are exposed to their birth-country’s
environment, I use only workers who immigrate at age 18 or later. Other immigrants have
endowments that are plausibly a mixture of birth country and U.S. environments. I also
include only those who worked in the previous year and are no older than 65. The re-
sulting sample is quite large, with half a million immigrants and five million Americans;
there at least 139 workers from every country. Finally, the Census provides information on
the occupation of workers based on the Standard Occupation Classification (SOC) system,
although they merge some occupations together. The Census version of the SOC includes
476 occupations.
5There are two exceptions to this policy. First, I merge the United Kingdom together; second, I excludeNorth Korea, the USSR, and Russia, since it is not possible to identify them separately from other countries.The count of 131 already includes these reductions in sample size.
10
Data on the underlying characteristics of occupations are derived from the O*NET
database version 12.6 The O*NET database project is the continuation of occupational
characteristic descriptions that used to be provided in the Dictionary of Occupational Ti-
tles (DOT), which was last updated in 1991.7 It is carried out in partnership with the
U.S. Department of Labor. The database includes information on six broad aspects of
occupations: their worker characteristics, worker requirements, experience requirements,
occupational requirements, workforce characteristics, and occupation-specific information.
The O*NET database includes information on 812 SOC occupations. I use the provided
crosswalk to merge O*NET information into Census occupation codes. When two or more
occupations are merged I weight their underlying characteristics using the employment
weights taken from the May 2004 Occupational Employment Statistics Survey from the
BLS; earlier surveys did not measure employment for some of the necessary disaggregated
statistics.8 There are 453 matched occupations with all the necessary information.
The O*NET database contains data on over 250 attributes for each occupation, rated
either by professional analysts or current incumbents to the occupation. Some of these
attributes are not useful for the task at hand (exposure to radiation in the job, or artistic
interest of the workers). After removing these, there is still a large number of detailed,
highly correlated attributes (including ability requirements for four different measures of
vision: near, far, night, and peripheral). Rather than work with these many attributes from
the bottom up, this paper takes a top-down approach. The goal is to measure broad dimen-
sions of skill intensity and skill endowment. The previous literature has focused mostly on
education, experience, and linguistic skills; the O*NET database provides sufficient infor-
mation to pursue these dimensions here. To these, it adds enough attributes on cognitive
ability and physical skill intensity to measure skills along these two new dimensions. There
is not enough information to measure other potentially relevant dimensions, such as ability
to speak multiple languages or internal motivation.
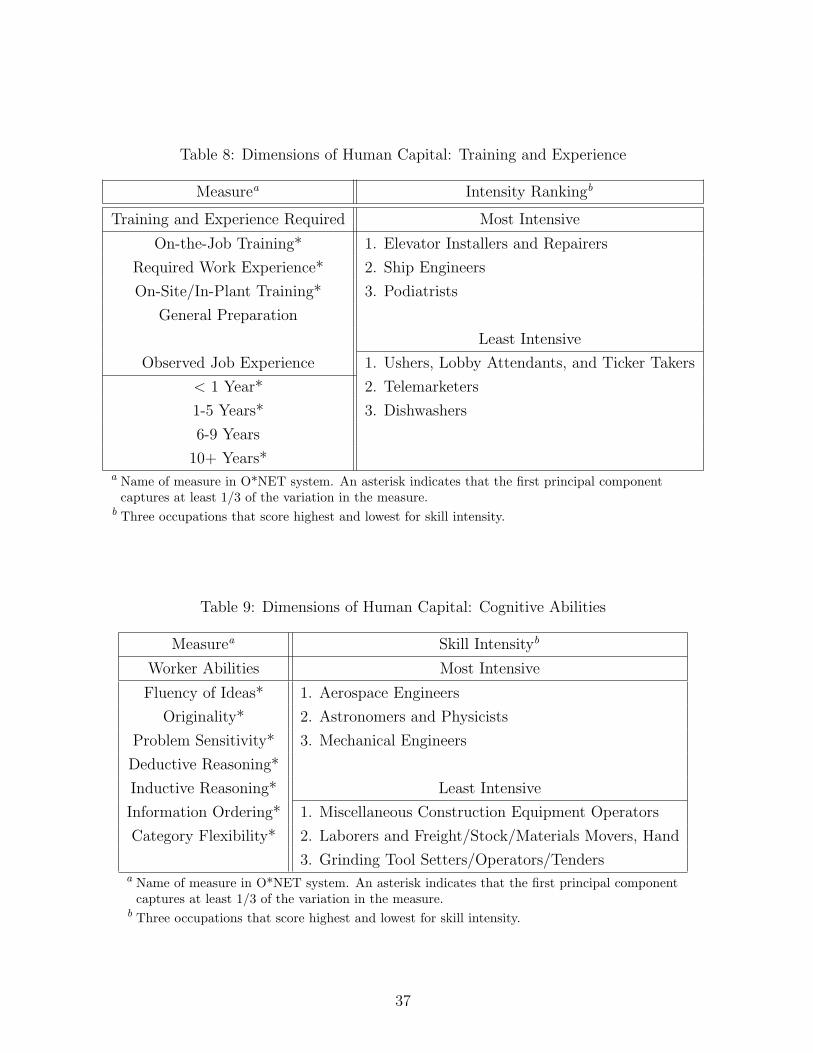
For each skill dimension I select between seven and twenty-eight attributes in the
O*NET Database. I treat these attributes as proxies for the true underlying skill intensity.
Education intensity is constructed using data on requirements for knowledge of subjects
taught primarily in high school and college. Experience/training intensity is constructed
using data on requirements for training done in different contexts and observed experi-
ence levels. Cognitive ability intensity is constructed using measures of ability to reason
6Occupational Information Network (O*NET) and US Department of Labor/Employment and TrainingAdministration (USDOL/ETA) (2007).
7U.S. Department of Labor, Employment, and Training Administration (1991).8Bureau of Labor Statistics (2004).
11
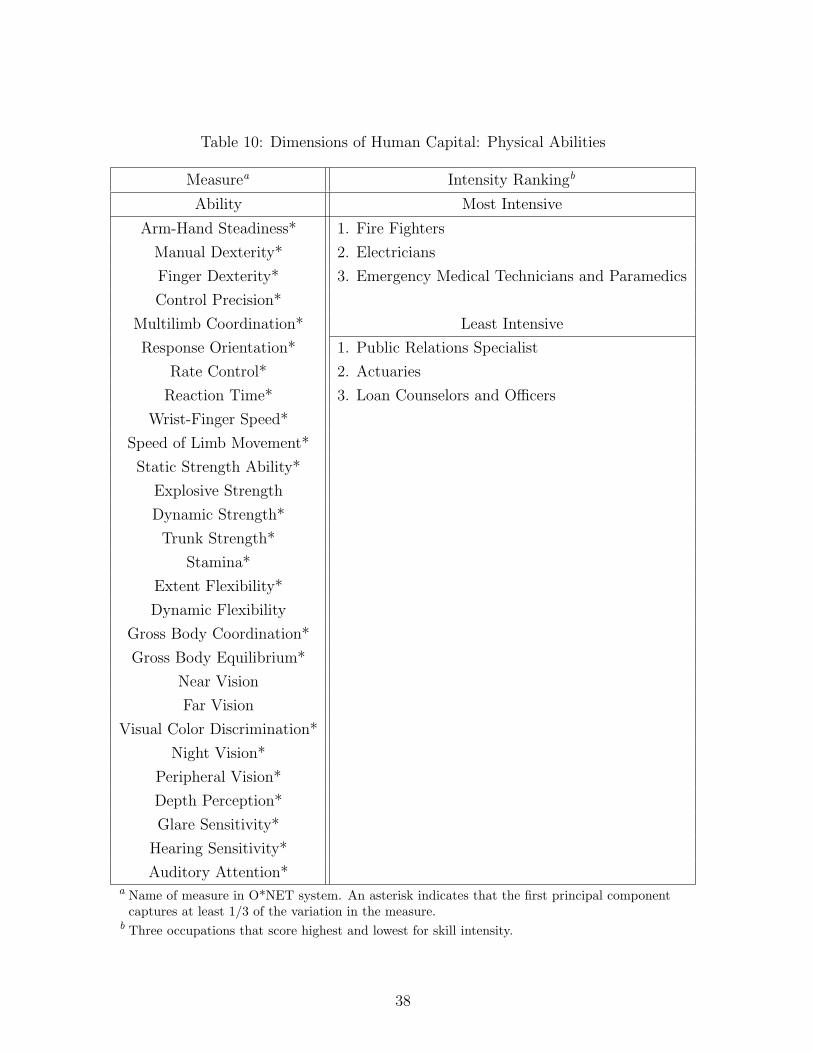
and think originally. Physical skill intensity is constructed using measures of strength, co-
ordination, and dexterity; it measures physical skills rather than pure physical strength.
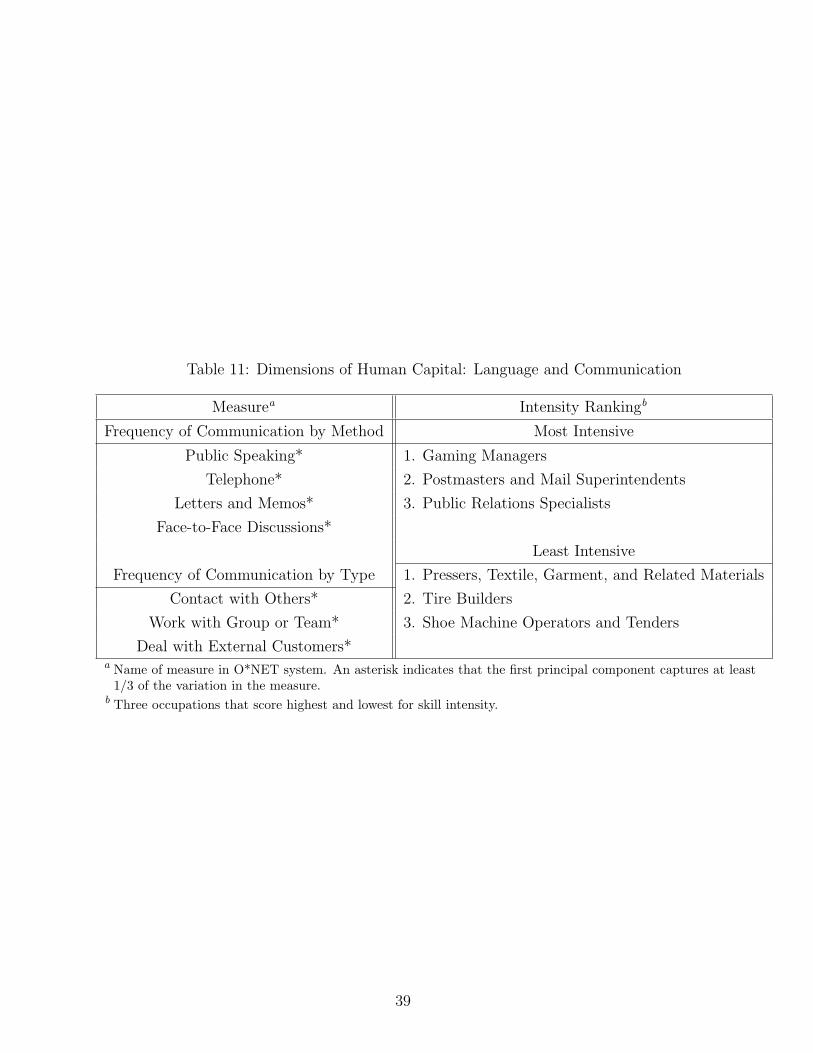
Communication intensity is constructed using measures of frequency and types of commu-
nication required. Appendix A provides further details. I use principal component analysis
(PCA) to extract the first principal component, the one-dimensional variable that captures
the highest fraction of the variation in the set of proxies. The first component normalized
to lie on the [0, 1] interval is used as ωjs for the rest of the paper.
I provide three checks on the constructed intensity measures. Tables 7 - 11 provide the
comprehensive list of data used to construct each skill intensity, as well as the highest and
lowest scoring occupations along each dimension. Visual inspection suggests the rankings
of occupations are reasonable. Section 4.2 shows that workers’ observable proxies for skill
endowment correlate well with the skill intensities of their chosen occupations, i.e., educated
workers choose occupations identified by this process as education-intensive. Section 4.4
shows that the skill intensities lead to reasonable model-predicted wages, and that the main
qualitative results are robust to many details of the construction of the ωjs.
4.2 Checks on Intensity Measures
According to Proposition 1, workers who are more s-abundant should choose occupations
that are s-intensive. Here, I test whether the prediction holds using the constructed mea-
sures of skill intensity. The Census provides some proxies for the skill endowments of
workers. I implement the test by regressing:
ωjs = b1 + b2h̃s + e
where ωjs is the constructed skill intensity of the worker’s chosen occupation and h̃s is the
proxy for skill endowment. I then test whether b2 > 0.
For each of the skills I find a Census variable that proxies for abundance. Educational
attainment is a straightforward indicator of education and knowledge. Likewise, the Census
includes a measure of self-assessed English language proficiency, which I use as a measure
of communication skills. I use potential experience as a measure of experience and training.
The other dimensions are more limited. The Census also includes three dummy variables on
disability status: I use (lack of) vision or hearing disability as a measure of physical skills,
and (lack of) difficulty remembering as a measure of cognitive skills. I use the same sample
as for the previous section. Tests other than communication use only Americans to avoid
complications such as comparing Swedish and Kenyan education; the communications tests
12
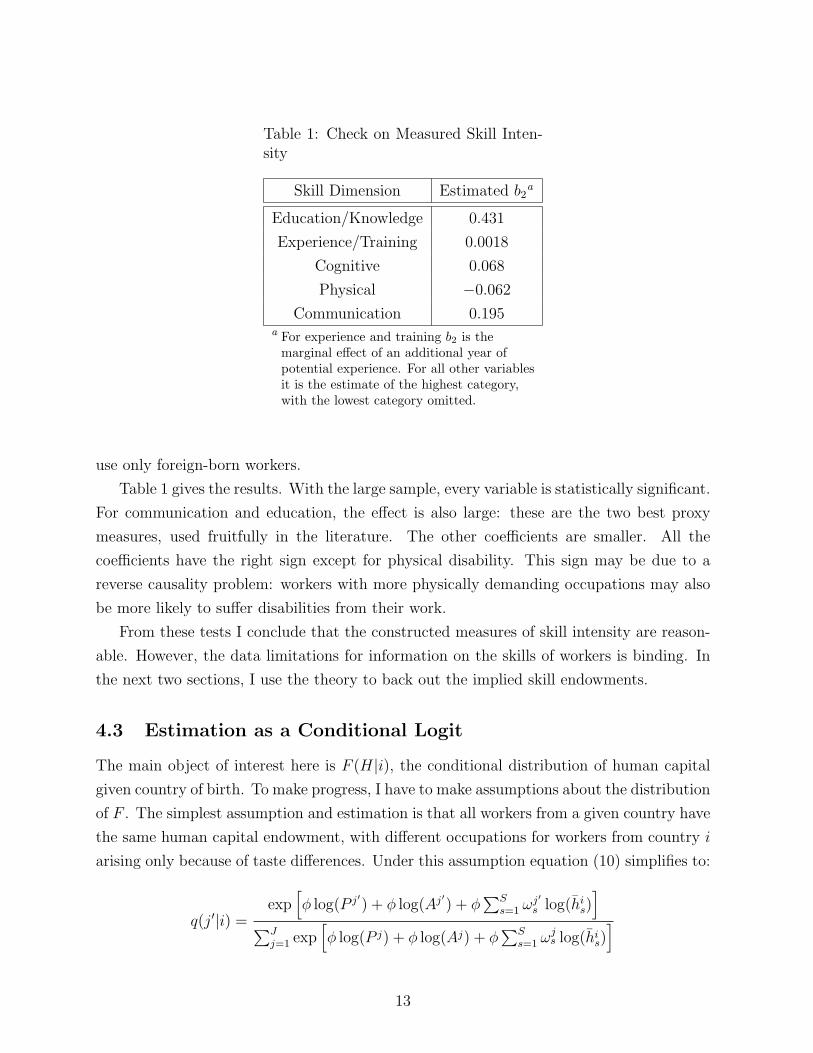
Table 1: Check on Measured Skill Inten-sity
Skill Dimension Estimated b2a
Education/Knowledge 0.431
Experience/Training 0.0018
Cognitive 0.068
Physical −0.062
Communication 0.195a For experience and training b2 is the
marginal effect of an additional year ofpotential experience. For all other variablesit is the estimate of the highest category,with the lowest category omitted.
use only foreign-born workers.
Table 1 gives the results. With the large sample, every variable is statistically significant.
For communication and education, the effect is also large: these are the two best proxy
measures, used fruitfully in the literature. The other coefficients are smaller. All the
coefficients have the right sign except for physical disability. This sign may be due to a
reverse causality problem: workers with more physically demanding occupations may also
be more likely to suffer disabilities from their work.
From these tests I conclude that the constructed measures of skill intensity are reason-
able. However, the data limitations for information on the skills of workers is binding. In
the next two sections, I use the theory to back out the implied skill endowments.
4.3 Estimation as a Conditional Logit
The main object of interest here is F (H|i), the conditional distribution of human capital
given country of birth. To make progress, I have to make assumptions about the distribution
of F . The simplest assumption and estimation is that all workers from a given country have
the same human capital endowment, with different occupations for workers from country i
arising only because of taste differences. Under this assumption equation (10) simplifies to:
q(j′|i) =exp
[φ log(P j′) + φ log(Aj
′) + φ
∑Ss=1 ω
j′s log(h̄is)
]∑J
j=1 exp[φ log(P j) + φ log(Aj) + φ
∑Ss=1 ω
js log(h̄is)
]
13
This function has the form of a conditional logit (McFadden 1974). As is standard for a con-
ditional logit, it is not possible to estimate a full set of prices and skill endowments because
of collinearity. However, I can identify a set of related parameters: φ log(P j) + φ log(Aj) +
φ∑S
s=1 ωjs log(h̄USs ) for each occupation, and φ log(h̄is) − φ log(h̄USs ) for every country and
skill. Note that the second set of estimated parameters is a constant times the log of the skill
ratio between the average immigrant and the average American, which is exactly the object
of interest. Additionally, I restrict φ log(P 453)+φ log(A453)+φ∑S
s=1 ω453s log(h̄USs ) = 0. The
choice of numeraire has already pinned down prices, so this normalization pins down the
levels of the A through setting A453.
Estimation is performed via maximum likelihood. The likelihood ratio index for the test
comparing the model to an alternative specification with only occupation-specific dummies
is 0.00464. In the next section I show how to use the out of sample wage predictions to pin
down φ and to test the fit of the model.
4.4 Estimates and Wage Comparisons
The model estimates the probability that workers born in country i choose occupation j
as a function of occupation j’s technological intensity characteristics, implicitly assuming
that better matches∑S
s=1 ωjs log(his) result in higher wage offers, leading to the observed
occupational choices. As a check on the fit of the model and the constructed measures of
skill intensity, I compare actual wage differences to the normalized, model-predicted wage
difference φ log(W i,j) − φ log(WUS,j). For the data I use average log-wages for country
of birth-occupation cells with 30 or more workers, estimated from the 2000 U.S. Census;
using cells with 5 or more workers yields similar but slightly noisier results. There are
3,483 remaining data points in the sample. φ is set to 6.04 for the rest of the paper so
that the variance of within-occupation wage differences is the same in the model and the
data. Recall that φ is the parameter governing the relative importance of pecuniary to
non-pecuniary factors; this value implies that a worker is 99% likely to choose a job that
pays twice as well.9
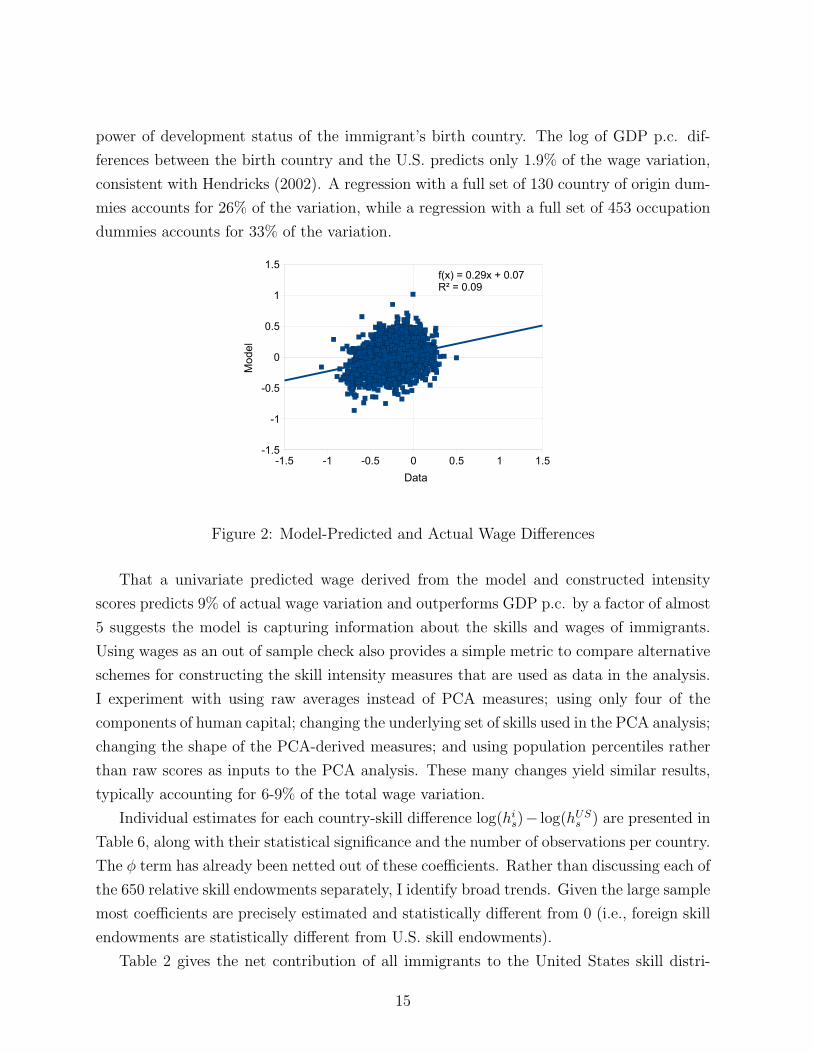
Figure 2 plots the model-implied versus data wage differences. The raw correlation is
0.30. Interpreted as a regression, the model-predicted wages are a statistically significant
regressor accounting for 9% of the total variation. A useful comparison is the predictive
9By comparison, the same conditional logit can be estimated using five measures of exposure to differenton the job hazards. While exposure to hazards should impact wages, it is less likely to explain much ofthe occupational choices of immigrants. Indeed, to match the variability of wages in this alternative casewould require φ = 3.3, indicating that a job that pays twice as well is only 91% likely to be chosen. In thiscase, other factors than those included in the logit play a much more important role.
14
power of development status of the immigrant’s birth country. The log of GDP p.c. dif-
ferences between the birth country and the U.S. predicts only 1.9% of the wage variation,
consistent with Hendricks (2002). A regression with a full set of 130 country of origin dum-
mies accounts for 26% of the variation, while a regression with a full set of 453 occupation
dummies accounts for 33% of the variation.
-1.5 -1 -0.5 0 0.5 1 1.5-1.5
-1
-0.5
0
0.5
1
1.5f(x) = 0.29x + 0.07R² = 0.09
Data
Mod
el
Figure 2: Model-Predicted and Actual Wage Differences
That a univariate predicted wage derived from the model and constructed intensity
scores predicts 9% of actual wage variation and outperforms GDP p.c. by a factor of almost
5 suggests the model is capturing information about the skills and wages of immigrants.
Using wages as an out of sample check also provides a simple metric to compare alternative
schemes for constructing the skill intensity measures that are used as data in the analysis.
I experiment with using raw averages instead of PCA measures; using only four of the
components of human capital; changing the underlying set of skills used in the PCA analysis;
changing the shape of the PCA-derived measures; and using population percentiles rather
than raw scores as inputs to the PCA analysis. These many changes yield similar results,
typically accounting for 6-9% of the total wage variation.
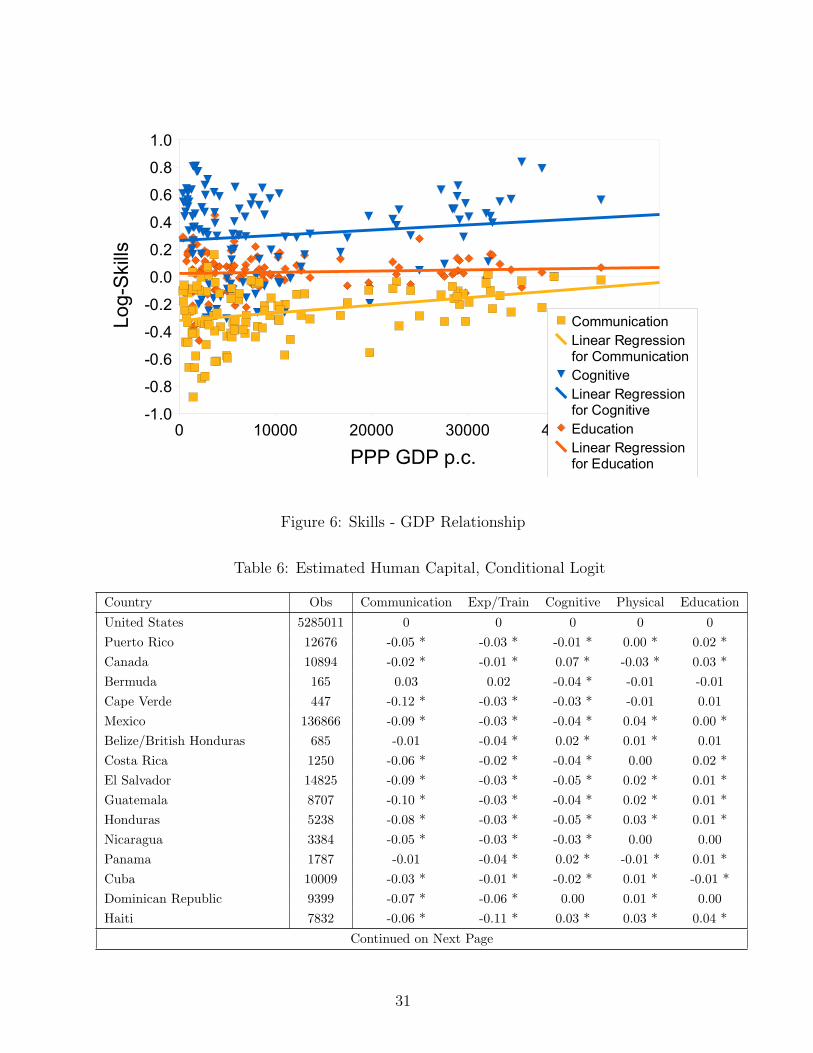
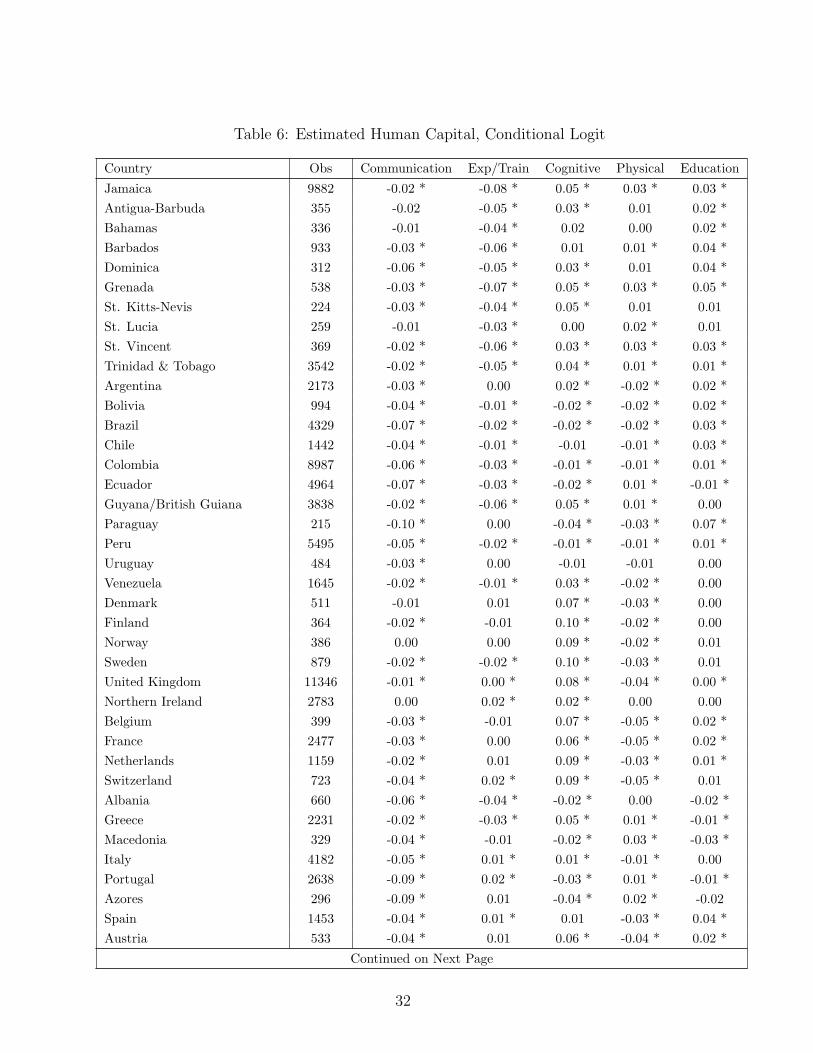
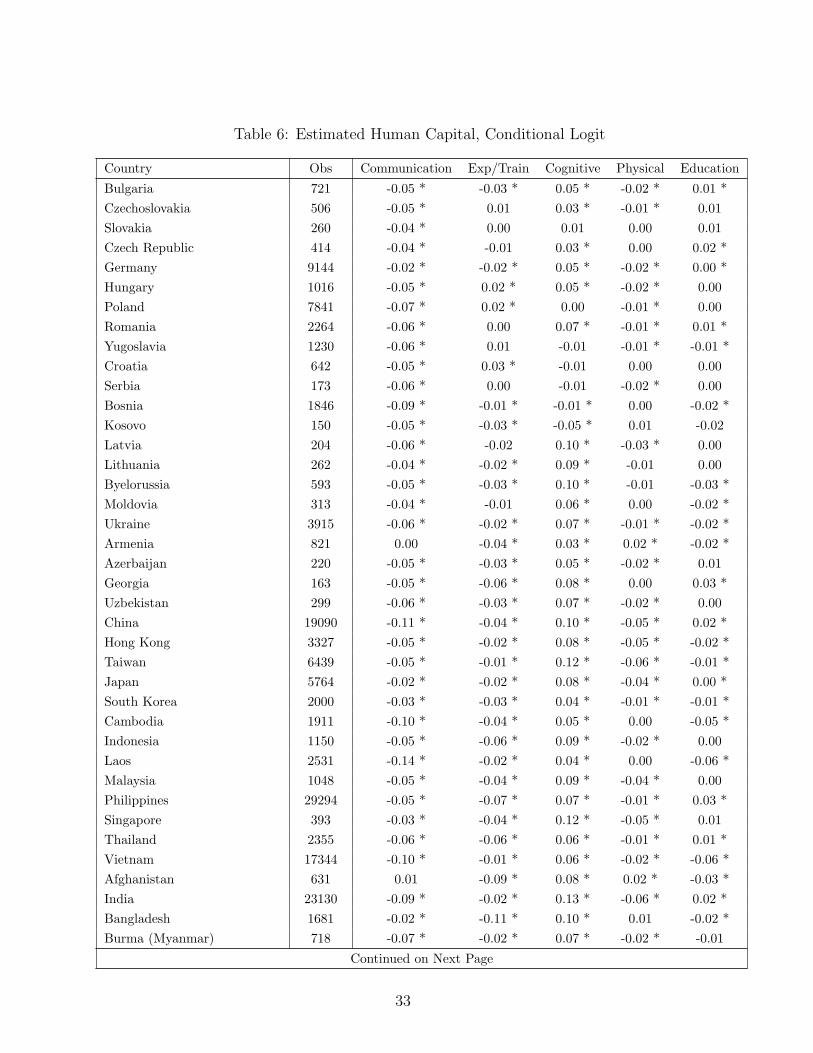
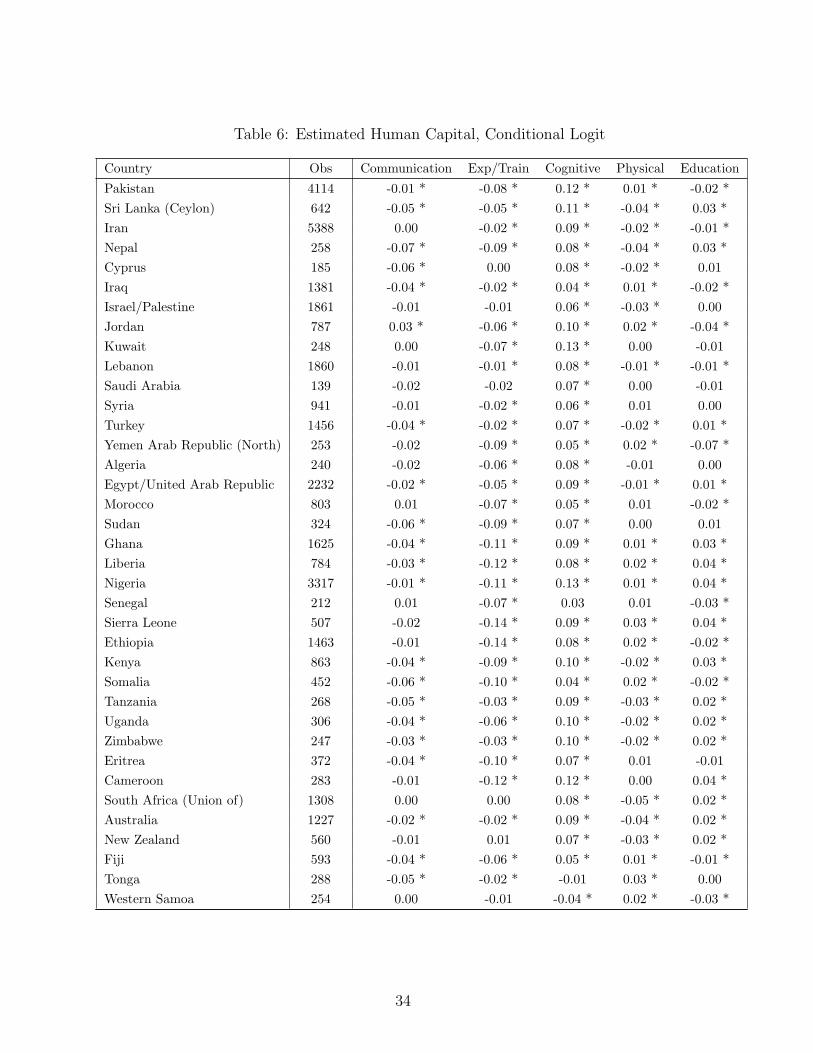
Individual estimates for each country-skill difference log(his)− log(hUSs ) are presented in
Table 6, along with their statistical significance and the number of observations per country.
The φ term has already been netted out of these coefficients. Rather than discussing each of
the 650 relative skill endowments separately, I identify broad trends. Given the large sample
most coefficients are precisely estimated and statistically different from 0 (i.e., foreign skill
endowments are statistically different from U.S. skill endowments).
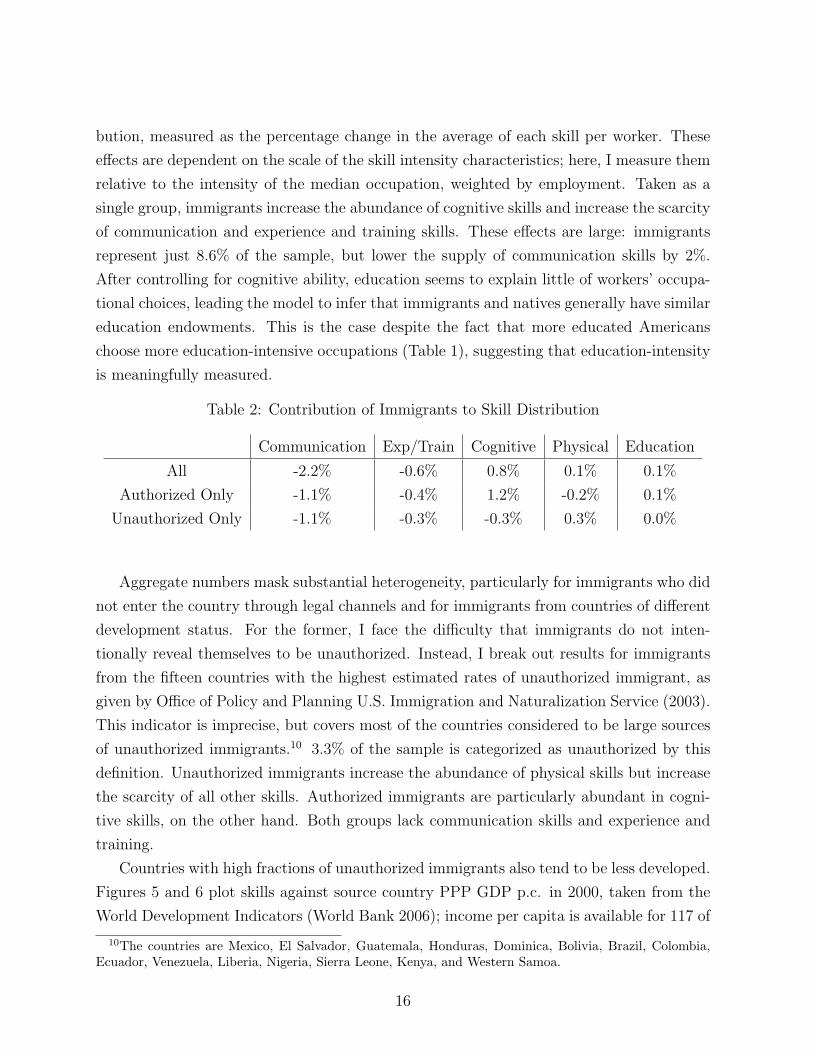
Table 2 gives the net contribution of all immigrants to the United States skill distri-
15
bution, measured as the percentage change in the average of each skill per worker. These
effects are dependent on the scale of the skill intensity characteristics; here, I measure them
relative to the intensity of the median occupation, weighted by employment. Taken as a
single group, immigrants increase the abundance of cognitive skills and increase the scarcity
of communication and experience and training skills. These effects are large: immigrants
represent just 8.6% of the sample, but lower the supply of communication skills by 2%.
After controlling for cognitive ability, education seems to explain little of workers’ occupa-
tional choices, leading the model to infer that immigrants and natives generally have similar
education endowments. This is the case despite the fact that more educated Americans
choose more education-intensive occupations (Table 1), suggesting that education-intensity
is meaningfully measured.
Table 2: Contribution of Immigrants to Skill Distribution
Communication Exp/Train Cognitive Physical Education
All -2.2% -0.6% 0.8% 0.1% 0.1%
Authorized Only -1.1% -0.4% 1.2% -0.2% 0.1%
Unauthorized Only -1.1% -0.3% -0.3% 0.3% 0.0%
Aggregate numbers mask substantial heterogeneity, particularly for immigrants who did
not enter the country through legal channels and for immigrants from countries of different
development status. For the former, I face the difficulty that immigrants do not inten-
tionally reveal themselves to be unauthorized. Instead, I break out results for immigrants
from the fifteen countries with the highest estimated rates of unauthorized immigrant, as
given by Office of Policy and Planning U.S. Immigration and Naturalization Service (2003).
This indicator is imprecise, but covers most of the countries considered to be large sources
of unauthorized immigrants.10 3.3% of the sample is categorized as unauthorized by this
definition. Unauthorized immigrants increase the abundance of physical skills but increase
the scarcity of all other skills. Authorized immigrants are particularly abundant in cogni-
tive skills, on the other hand. Both groups lack communication skills and experience and
training.
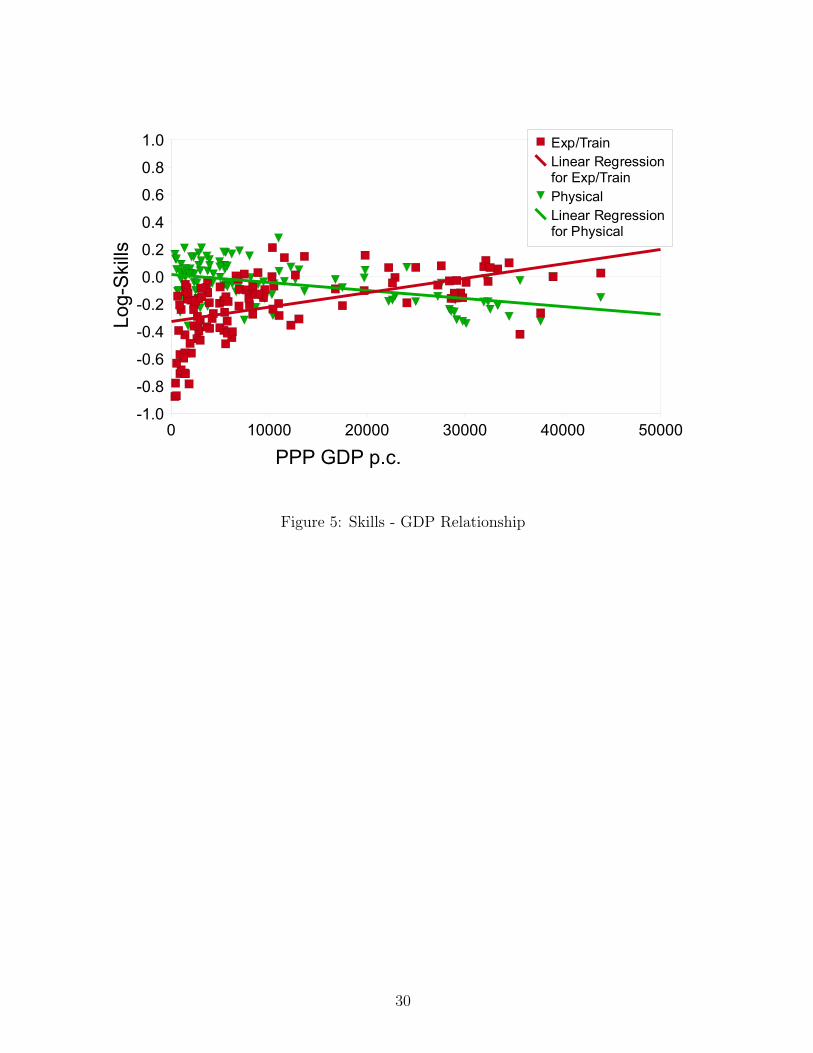
Countries with high fractions of unauthorized immigrants also tend to be less developed.
Figures 5 and 6 plot skills against source country PPP GDP p.c. in 2000, taken from the
World Development Indicators (World Bank 2006); income per capita is available for 117 of
10The countries are Mexico, El Salvador, Guatemala, Honduras, Dominica, Bolivia, Brazil, Colombia,Ecuador, Venezuela, Liberia, Nigeria, Sierra Leone, Kenya, and Western Samoa.
16
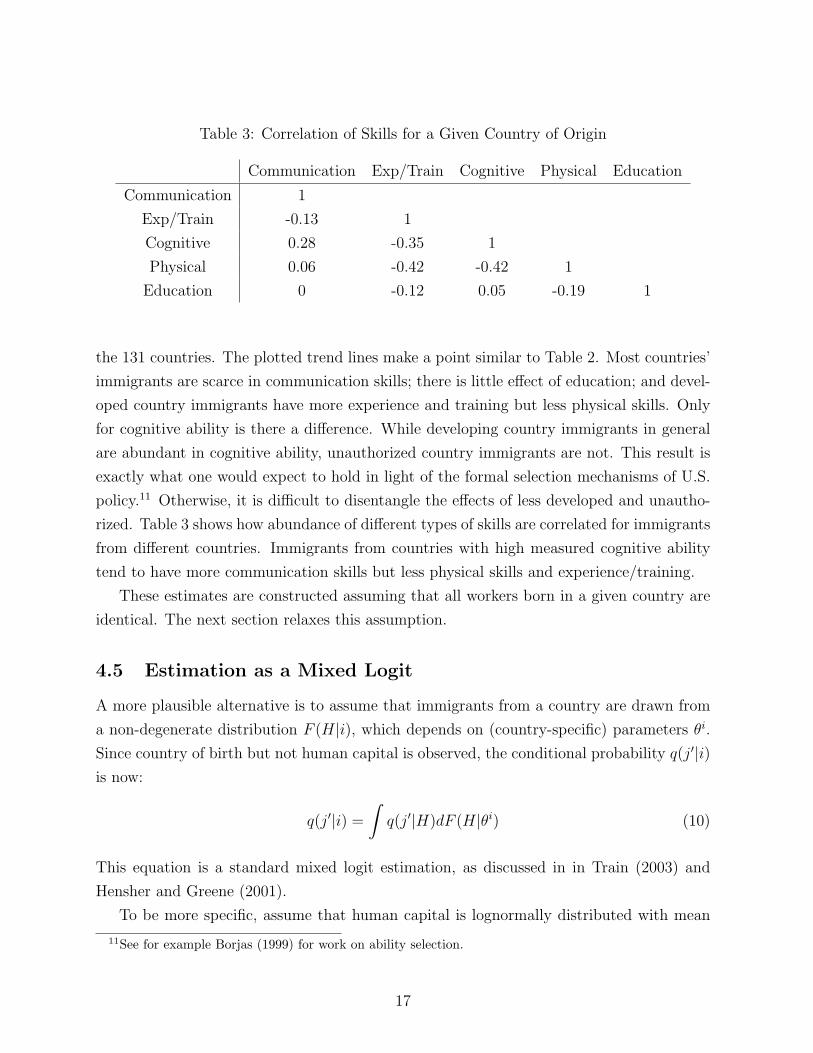
Table 3: Correlation of Skills for a Given Country of Origin
Communication Exp/Train Cognitive Physical Education
Communication 1
Exp/Train -0.13 1
Cognitive 0.28 -0.35 1
Physical 0.06 -0.42 -0.42 1
Education 0 -0.12 0.05 -0.19 1
the 131 countries. The plotted trend lines make a point similar to Table 2. Most countries’
immigrants are scarce in communication skills; there is little effect of education; and devel-
oped country immigrants have more experience and training but less physical skills. Only
for cognitive ability is there a difference. While developing country immigrants in general
are abundant in cognitive ability, unauthorized country immigrants are not. This result is
exactly what one would expect to hold in light of the formal selection mechanisms of U.S.
policy.11 Otherwise, it is difficult to disentangle the effects of less developed and unautho-
rized. Table 3 shows how abundance of different types of skills are correlated for immigrants
from different countries. Immigrants from countries with high measured cognitive ability
tend to have more communication skills but less physical skills and experience/training.
These estimates are constructed assuming that all workers born in a given country are
identical. The next section relaxes this assumption.
4.5 Estimation as a Mixed Logit
A more plausible alternative is to assume that immigrants from a country are drawn from
a non-degenerate distribution F (H|i), which depends on (country-specific) parameters θi.
Since country of birth but not human capital is observed, the conditional probability q(j′|i)is now:
q(j′|i) =
∫q(j′|H)dF (H|θi) (10)
This equation is a standard mixed logit estimation, as discussed in in Train (2003) and
Hensher and Greene (2001).
To be more specific, assume that human capital is lognormally distributed with mean
11See for example Borjas (1999) for work on ability selection.
17
µi and diagonal variance-covariance matrix Σi for all immigrants. This functional form
delivers that wages will be lognormal, roughly consistent with the data. Variation in skills
by country of origin could be due to differences in endowments, or to different human
capital accumulation decisions. I maintain the assumption that all American-born workers
share a common human capital vector, so the estimated parameters represent the mean
and variance of each country’s immigrants for each skill dimension, relative to the common
American skill. In this case, different immigrants from the same country will choose different
occupations because they vary in their tastes and in their human capital.
I use simulated maximum likelihood with 600 Halton draws to estimate; using 750 does
not change the results appreciably. The mixed logit estimates for the means µi closely
agree with the conditional logit estimates based on the assumption that all workers share a
common mean. The correlation between estimates is 0.96 for education, and nearly 1 for the
other four factors. Hence, average estimates of skills are reasonably robust to accounting
for heterogeneity. This fact motivates me to use the conditional logit estimates for the
counterfactual analysis.
The estimates of the σi, the standard deviation of skills for a given source country, reveal
the amount of variability of skills by country. To control for scale, the results are given
as the estimated coefficient of variation for the median country. The results are highest
for education (1.55) and experience/training (0.9), and smaller for physical skills (0.63),
communication skills (0.50), and cognitive ability (0.49). There is particular variability
in the education of immigrants from less-skilled countries. These findings indicate that
treating immigrants from a country as a single group may be less appropriate for education
than for the emphasis areas of physical skills and cognitive ability, since for education
within-country variability is often larger than the average native-immigrant difference.
5 Counterfactual Experiments Using Measured Skills
The estimates from the previous section suggest immigrants raise the average level of cog-
nitive ability and lower the average level of communications skills and experience/training.
Further, there is substantial heterogeneity in the bundles of skills offered by immigrants
from different countries. In this section I conduct two counterfactual experiments simu-
lating the distributions of wages that would have prevailed if no immigrants had entered
the sample, and if only unauthorized immigrants had not entered the sample. As before
I note that the second experiment corresponds closely to excluding some immigrants from
less developed countries, and I do not try to take a stand on exactly which effect the results
18
represent.
Both experiments account for the reallocation of native workers across occupations in
the absence of some or all of the immigrants. For labor markets that experience employ-
ment losses prices and wages tend to rise, attracting some native workers. The magnitude
of the price and wage increase depends in part on the elasticity of substitution ψ: as goods
become better substitutes, prices and wages change by less. The degree to which native
inflows balance immigrant outflows is determined by the skill characteristics of the occupa-
tion: natives are less likely to substitute into occupations with unusual skill characteristics
because they would earn low wages. I report real wages, adjusted for changes in the cost of
the consumption bundle. Both experiments use the results of the conditional logit estima-
tion; the counterfactuals are easier with the point estimates rather than distributions, and
the mean mixed logit estimates are highly correlated with the conditional logit estimates.
The last important question is how to determine ψ. The most relevant previous esti-
mates are an elasticity of 2.5 between professionals and non-professionals (Chiswick 1978);
an elasticity of substitution of 4.1 between blue and white collar workers (Dougherty 1972);
and an elasticity of 5-10 between six broad occupation categories (Card 2001).12 Since oc-
cupations here are more finely coded than in Card’s work, the elasticity is likely be higher.
Results are presented for a range of ψ from 2.5 - 40, with 10 taken to be an intermedi-
ate baseline. The major qualitative features of interest do not vary within the range of
reasonable ψ, although the exact quantitative magnitudes are sensitive to this parameter.
5.1 Distributional Implications
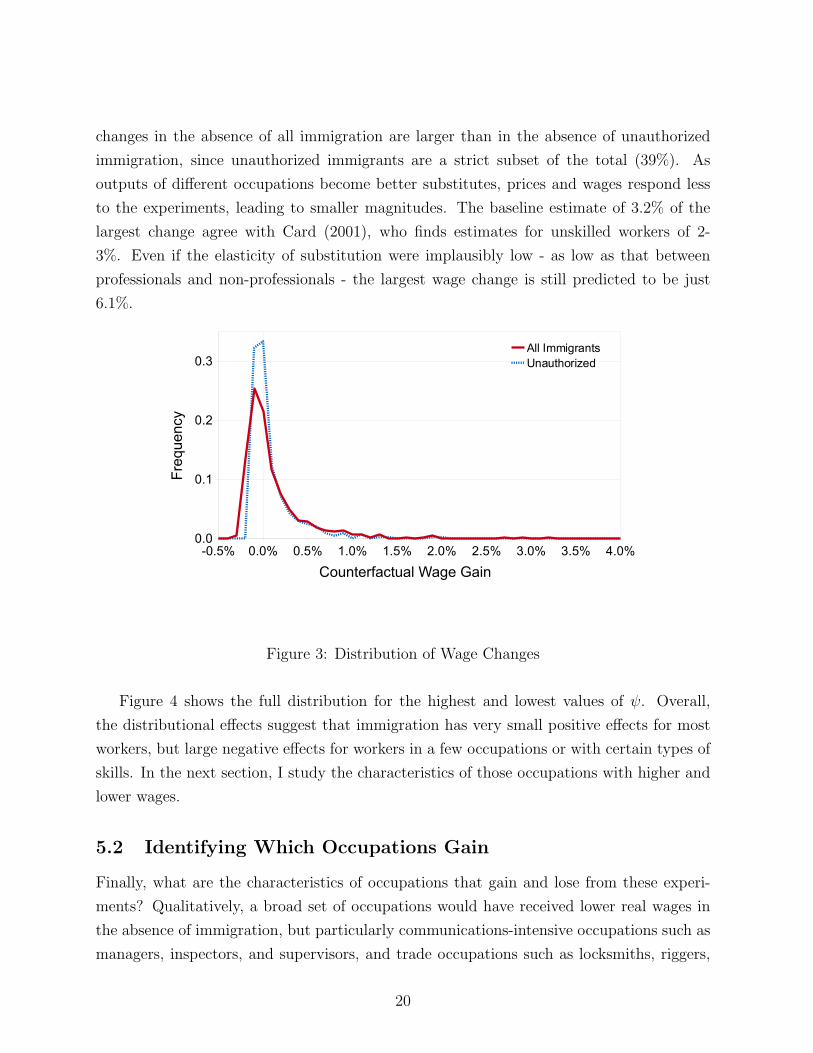
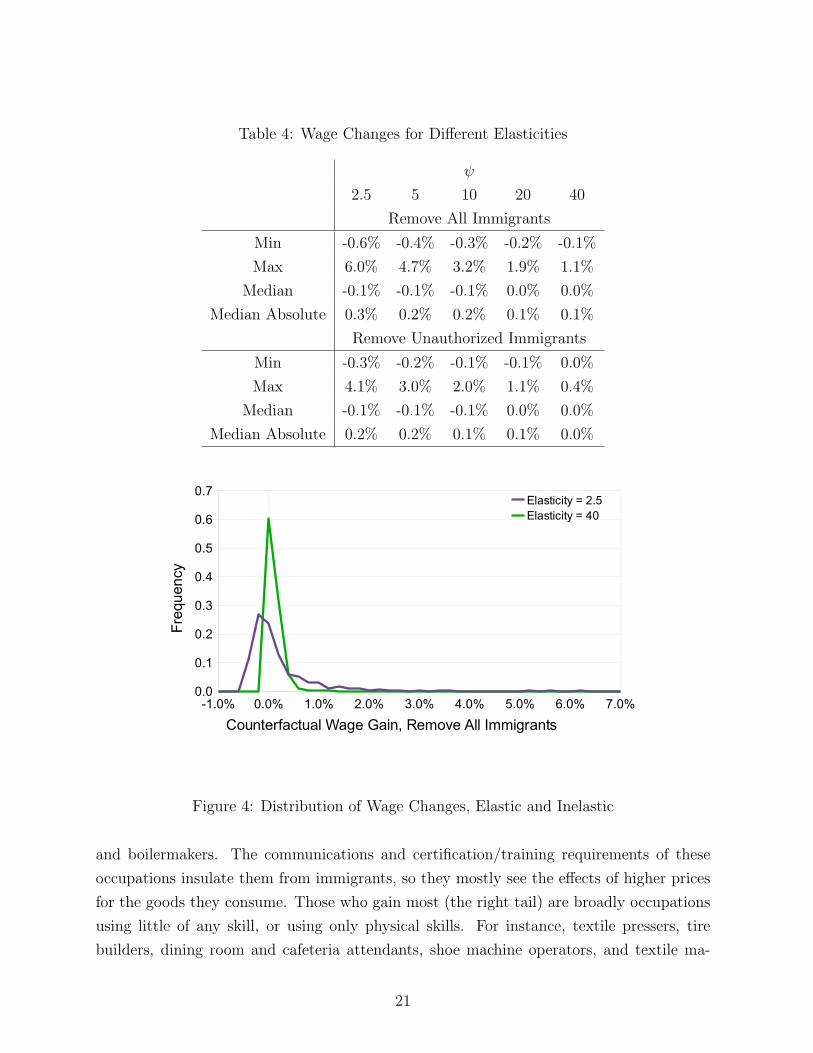
The distribution of real wage gains from preventing immigration is strongly skewed. This
effect shows up most clearly in Figure 3, which plots the distribution of wage changes across
occupations for the baseline case where ψ = 10. The median outcome for both experiments
is a slight real wage loss, but the length of the right tail far outweighs the length of the left
tail.
More precise figures are given in Table 4, for a wide range of ψ. For ψ = 10 the outcome
for the median occupation is a slight wage decline of 0.1% in the absence of all immigration
or unauthorized immigration. The largest wage decline is an order of magnitude smaller
than the largest wage increase: 0.3% versus 3.2% for all immigrants, and 0.1% versus
2.0% for unauthorized immigrants. The shape is constant across both experiments and
across a wide range of elasticities of substitution. The magnitudes, however, vary. Wage
12See also Hamermesh (1993), which overviews much of the literature estimating labor demand elasticities.
19
changes in the absence of all immigration are larger than in the absence of unauthorized
immigration, since unauthorized immigrants are a strict subset of the total (39%). As
outputs of different occupations become better substitutes, prices and wages respond less
to the experiments, leading to smaller magnitudes. The baseline estimate of 3.2% of the
largest change agree with Card (2001), who finds estimates for unskilled workers of 2-
3%. Even if the elasticity of substitution were implausibly low - as low as that between
professionals and non-professionals - the largest wage change is still predicted to be just
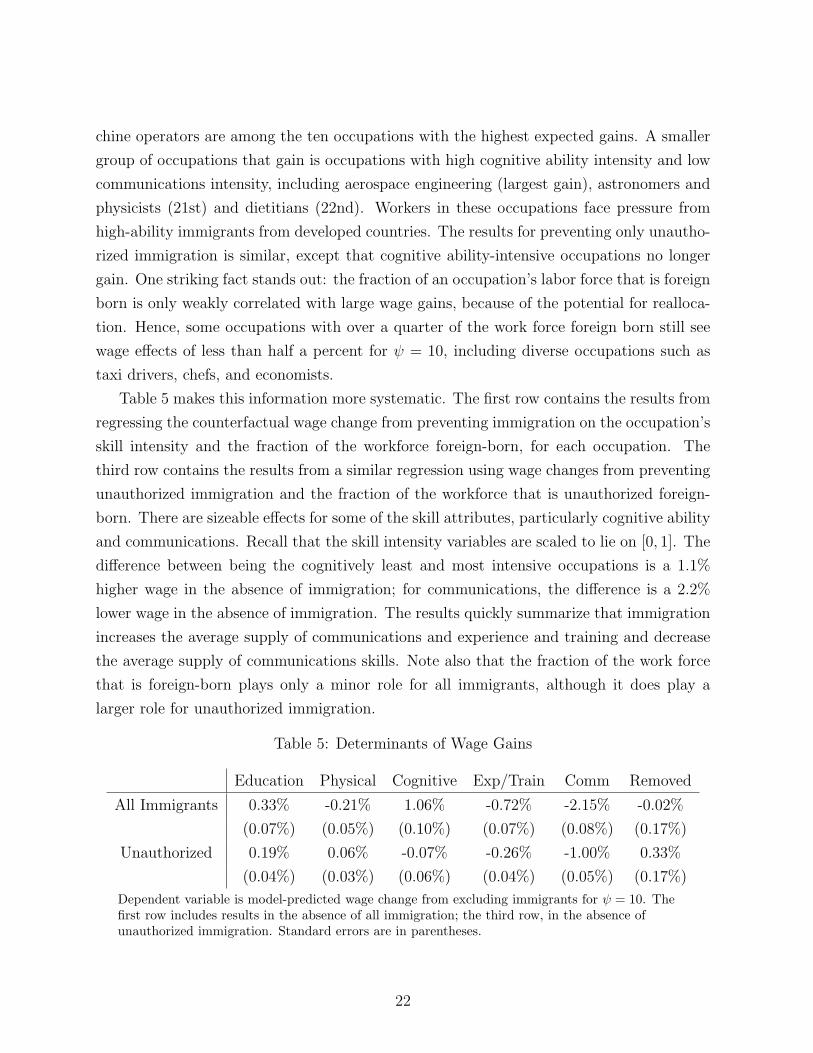
Dependent variable is model-predicted wage change from excluding immigrants for ψ = 10. Thefirst row includes results in the absence of all immigration; the third row, in the absence ofunauthorized immigration. Standard errors are in parentheses.
22
The identities of winners and losers from immigration fits well with recent research,
although my results are at a more disaggregated level. Peri and Sparber (Forthcoming)
find that immigration induces American workers to specialize in interactive occupations -
similar to the communications-intensive occupations here. My findings are similar, subject
to the caveat that for some workers and occupations, there are no good substitutes available:
the occupations similar to aerospace engineer are also not communications-intensive. They
also find interesting results about how new cohorts of immigrants impact the wages of
older cohorts, which I do not disentangle. Finally, Peri and Sparber (2008) and Borjas
(2005) both show that high-skill immigration affects the wages and career decisions of
high-skilled Americans: again, the theme is that it pushes them to study “soft” subjects
in graduate school, which are more writing, language, and communications-intensive. My
results add to this previous literature that occupations with formal experience and training
requirements are also effective for avoiding competition from immigrants; and that the
formal U.S. selection mechanism has resulted in a large net inflow of cognitive abilities.
6 Conclusion
This paper has proposed a theory of labor markets where workers vary in their endow-
ment of a vector of skills, and occupations vary in their intensity over the vector of skills.
Comparative advantage leads workers to match their endowments to occupations that are
appropriately skill-intensive. I use the model to estimate the human capital endowments of
workers born in 130 countries over 5 dimensions. Immigrants are net suppliers of cognitive
ability, but are scarce in experience/training and particularly communications skills. They
cause a highly skewed impact to the distribution of wages, reflecting their contributions to
the skill distribution.
The wage effects of immigration are moderate, even though they miss several factors
that may limit them further. They assume a conservatively low elasticity of substitution
across occupations. They ignore, for instance, the ability of Americans to export excess
goods as predicted in a Heckscher-Ohlin framework - not all aerospace engineering services
are consumed in the United States. They also assume that the endowments of Americans
are fixed, but as Peri and Sparber (2008) and Borjas (2005) have shown, Americans change
their schooling and human capital accumulation decisions as well. However, it does rest on
full adjustment of the capital stock, as opposed to Borjas (2003); if the capital stock does
not adjust, the effects would be larger.
A skewed distribution of wage impacts naturally suggests political economy stories for
23
government policy with respect to immigration, particularly with respect to unauthorized
immigrants and the highly-skilled immigrants in the science occupations. For example, it
may help explain why the allocation of H1-B visas is set “low”. This subject is left for
future research.
24
References
Autor, D. H., F. Levy, and R. J. Murnane (2003): “The Skill Content of Recent
Technological Change: An Empirical Exploration,” The Quarterly Journal of Economics,
118(4), 1279–1333.
Blinder, A. S. (2007): “How Many U.S. Jobs Might be Offshorable?,” CEPS Working
Paper No. 142.
Borjas, G. J. (1999): “The Economic Analysis of Immigration,” in Handbook of Labor
Economics, ed. by O. Ashenfelter, and D. Card, vol. 3A, pp. 1697–1760. Elsevier Science,
North-Holland Publishers.
(2003): “The Labor Demand Curve Is Downward Sloping: Reexamining the
Impact of Immigration on the Labor Market,” Quarterly Journal of Economics, 118,
1335–1374.
(2005): “The Labor-Market Impact of High-Skill Immigration,” The American
Economic Review, 95(2), 56–60.
Bureau of Labor Statistics (2004): “Occupational Employment Statistics,” Available
online at http://www.bls.gov/oes/oes_2004_m.htm.
Card, D. (2001): “Immigrant Inflows, Native Outflows, and the Local Labor Market
Impacts of Higher Immigration,” Journal of Labor Economics, 19(1), 22–64.
Chiswick, C. (1978): “The Growth of Professional Occupations in U.S. Manufacturing,
1900-73,” in Research in Human Capital and Development, ed. by I. Sirageldin. JAI
Press, Greenwich, Conn.
Costinot, A., L. Oldenski, and J. E. Rauch (2009): “Adaptation and the Boundary
of Multinational Firms,” NBER Working Paper 14668.
Dougherty, C. R. S. (1972): “Estimates of Labor Aggregation Functions,” Journal of
Political Economy, 80, 1101–1119.
Gathmann, C., and U. Schonberg (2008): “How General is Human Capital? A Task-
Based Approach,” Working Paper, Stanford University.
Hamermesh, D. (1993): Labor Demand. Princeton University Press.
25
Hendricks, L. (2002): “How Important Is Human Capital for Development? Evidence
from Immigrant Earnings,” The American Economic Review, 92(1), 198–219.
Hensher, D. A., and W. H. Greene (2001): “The Mixed Logit Model: The State of
Practice and Warnings for the Unwary,” Mimeo, New York University.
Ingram, B. F., and G. R. Neumann (2006): “The returns to skill,” Labour Economics,
13, 35–59.
Jensen, J. B., and L. G. Kletzer (2007): “Measuring Tradable Services and the Task
Content of Offshorable Services Jobs,” Working Paper.
Lazear, E. P. (2003): “Firm-Specific Human Capital: A Skill-Weights Approach,” NBER
Working Paper No. w9679.
McFadden, D. (1974): “Conditional Logit Analysis of Qualitative Choice Analysis,” in
Frontiers in Econometrics, ed. by P. Zarembka, pp. 105–142. New York: Academic Press.
Migration Policy Institute (2009): “Foreign-Born Population and Foreign Born as
Percentage of the Total US Population, 1850 to 2007,” Available online at http://www.
migrationpolicy.org.
Occupational Information Network (O*NET) and US Department of
Labor/Employment and Training Administration (USDOL/ETA) (2007):
“Database 12.0,” Available online at http://www.onetcenter.org/overview.html.
Office of Policy and Planning U.S. Immigration and Naturalization Service
(2003): “Estimates of the unauthorized immigrant population residing in the United
States: 1990 to 2000,” Available online at http://www.dhs.gov/xlibrary/assets/
statistics/publications/Ill\_Report\_1211.pdf.
Ottaviano, G. I., and G. Peri (2007): “The Effects of Immigration on U.S. Wages and
Rents: A General Equilibrium Approach,” Working Paper.
Peri, G., and C. Sparber (2008): “Highly-Educated Immigrants and Native Occupa-
tional Choice,” Working Paper.
(Forthcoming): “Task Specialization, Comparative Advantages, and the Effects
of Immigration on Wages,” American Economic Journal: Applied Micro.
26
Ritter, M. (2008): “Offshoring, Trade in Tasks and Occupational Specificity of Human
Capital,” Working Paper, University of Toronto.
Ruggles, S., M. Sobek, T. Alexander, C. A. Fitch, R. Goeken, P. K. Hall,
M. King, and C. Ronnander (2004): “Integrated Public Use Microdata Series: Ver-
sion 3.0 [Machine-readable database],” Minneapolis, MN: Minnesota Population Center
[producer and distributor], http://www.ipums.org.
Spitz-Oener, A. (2006): “Technical Change, Job Tasks, and Rising Educational De-
mands: Looking outside the Wage Structure,” Journal of Labor Economics, 24(2), 235–
270.
Train, K. (2003): Discrete Choice Models with Simulation. Cambridge University Press.
U.S. Department of Labor, Employment, and Training Administration (1991):
“Dictionary of Occupational Titles: Revised Fourth Edition,” Washington DC: 1991.
World Bank (2006): World Development Indicators.
27
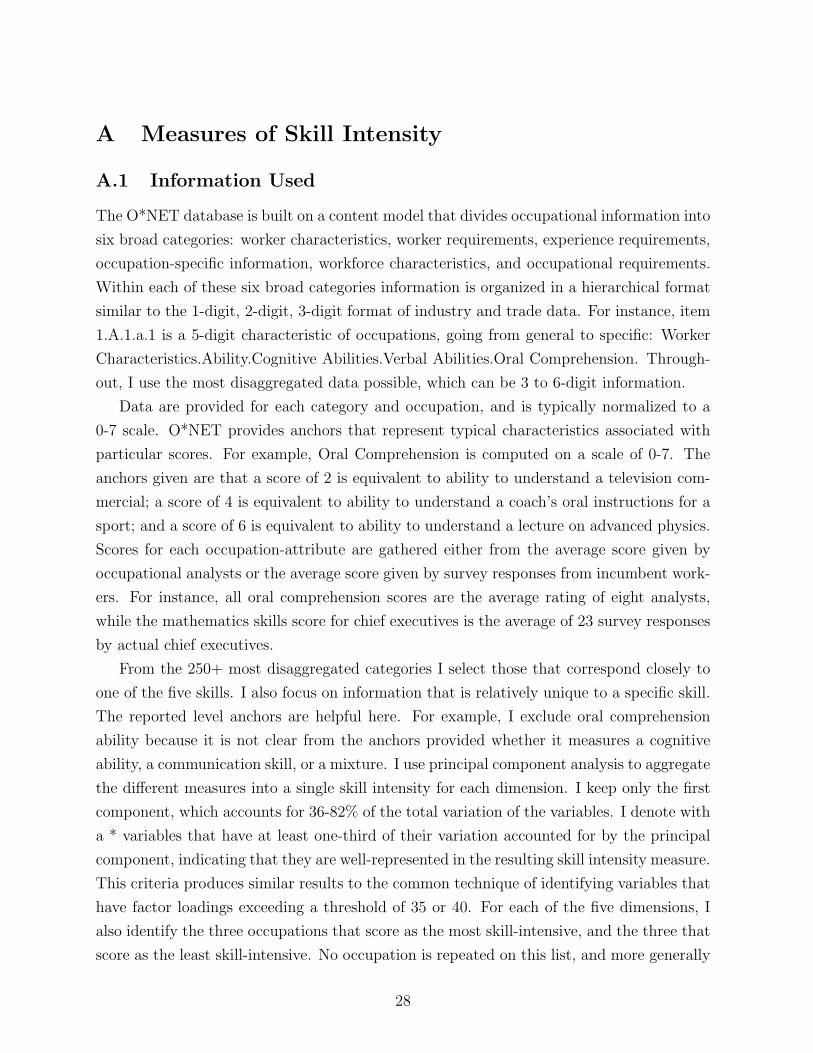
A Measures of Skill Intensity
A.1 Information Used
The O*NET database is built on a content model that divides occupational information into
six broad categories: worker characteristics, worker requirements, experience requirements,
occupation-specific information, workforce characteristics, and occupational requirements.
Within each of these six broad categories information is organized in a hierarchical format
similar to the 1-digit, 2-digit, 3-digit format of industry and trade data. For instance, item
1.A.1.a.1 is a 5-digit characteristic of occupations, going from general to specific: Worker