Page 1
Gender bias against female children in India: Regional differences and their
implications for MDGs
P. Arokiasamy∗ Jalandhar Pradhan
∗∗
Abstract
The millennium development goals accorded highest priorities for achieving gender
equality and women’s empowerment. South Asian countries and India are societies with
strong patriarchal norms, a high degree of son preference and pervasive gender
discriminations. Using National family health survey (1998-99) data, this paper adopts a
multiple indicator approach to study gender bias on the basis of a series of female by
male ratios with respect to school attendance, use of preventive and curative health care
services and child nutrition status. Marked gender differences are demonstrated with
respect to each of these indicators. However the gender bias indices of immunization
coverage and school attendance indicate consistent sex differences, suggesting
systematic neglect of female children. Considerable inequalities amongst the states are
also demonstrated. Except south Indian states the odds of female children being
underweight, and discriminated against in preventive and curative care and in school
attendance are significant.
Key words: gender, bias, regional, inequalities, goals, implication
∗ Reader, International Institute for Population Sciences (IIPS), Deonar, Mumbai-400088
E mail- [email protected] . ∗∗ Research Officer, International Institute for Population Sciences (IIPS), Deonar, Mumbai-400088.
E mail- [email protected]
Page 2
2
Gender bias against female children in India: Regional Differences and
their implications for MDGs
Introduction
Millennium development goals highlight the priority accorded to gender equality and
women’s right as core issues of development. Achieving goals relating to gender equality and
gender empowerment are critical for achieving all the major MDGs. However, South Asian
countries and India are societies with strong patriarchal norms and high degree of son
preference. Consequently, gender discriminations are pervasive. This has been a long
recognised problem with resurgence of research interest on the subject. Extremely high
levels of gender discrimination against females have been reported in the provision of health
care, nutrition, education and resource allocation in northern and western states of India. For
instance, the natural biological laws of human reproduction of mankind for balancing its
natural sex ratio, has been distorted by man-made norms, customs, traditions, religious beliefs
and more recently by sophisticated medical technology to result lower sex ratio in India.
In India, there has been a steady decline of sex ratio from 972 in 1901 to 933 females
per 1000 males in 2001. From 1961 to 1991, sex ratios for children under age 10 became
more masculine all across India (Bhat, 1989; Das Gupta and Bhat, 1997; Desai, 1994; El-
Badry, 1969; Miller, 1989; Parasuraman and Roy, 1991). In South Asia and India traditions,
values and customs crusted over time have resulted in the insatiable desire for sons. Sons are
preferred over daughters for a number of economic, social and religious reasons, including
financial support, old age security, property inheritance, dowry, family lineage, prestige and
power, birth and death rituals and beliefs about religious duties and salvation (Dyson and
Moore, 1983; Arnold et al, 2002; Kishore, 1993;Das Gupta, 1987; Das Gupta and Mari Bhat,
1997; Basu, 1989, Chen et al, 1981; Levene, 1987; Miller, 1981; Caldwell and Caldwell,
1990). Consequently, women and girls are accorded lower status in the Indian society.
Women in India face discrimination in terms of several political, and economic opportunities
as a result of their inferior status. Majority of women cannot inherit parental property and
political and employment participation are very limited. Gender inequalities prevail in work,
education, allocation of food, health care and fertility choices. On the other hand, at the
family level women are exclusively burdened with household chores- cooking, cleaning,
collecting fuel and water and carring elderly and children (Arokiasamy, 2003).
Page 3
3
Pathways of gender bias
Education and employment:
The economic and social rates of returns of education are quite high, and on the whole, higher
for women than for men. In patrilineal and patrilocal communities daughter’s education is
viewed as a waste, because expected returns from educated daughters do not exceed the costs,
then female education as an investment becomes unattractive to parents. Yet in most
developing countries, women are relatively less educated than men. Girls are either not sent
to schools or do not receive the same quality and level of education, as do boys. In India, the
gender inequality in enrolments is worse at the secondary and tertiary level than at the
primary level. Although benefits of women's education is well recognised, a number of
barriers contribute to the gender gaps, with varying intensities across the states.
Child mortality:
In the absence of a biological basis, evidence of excess female child mortality is an important
indicator of gender inequalities. A recent review of demographic health survey findings
revealed that 27 out of 44 DHS countries had higher girls than boys mortality for children
aged 1-4, although the average excess female mortality in 44 countries overall was only 2
percent (Arnold, 1997). In India, the levels of excess female child mortality as a result of son
preference have increased during the last several decades (SRS). NFHS-1 (1992-93) indicates
that child mortality for girls in India as a whole, at 42.0 per 1000, was 43 percent higher than
for boys at 29.4 per 1000 (International Institute for Population Sciences, IIPS, 1995). The
corresponding figure from NFHS-2 was 42 per 1000,which was 49 percent higher than boys
at 28.
Nutrition:
Girls are more likely to be malnourished than boys in both northern and southern states
(Arnold et al, 1998; Sen and Sen Gupta 1983; Pebley and Amin, 1991, Wedley, 1993).
Gender differentials in nutritional status are reported during infancy, with discriminatory
breastfeeding and supplementation practices. Infant girls are breastfed less frequently, for
shorter duration, and over shorter periods than boys (Wyon and Gordon, 1971; Kielmann et
al., 1981; Das Gupta, 1987). However, national family health survey indicated some variable
evidences where boys and girls are about equally likely to be stunted, underweight but boys
were slightly more likely than girls to be wasted (Mishra et al, 1999).
Page 4
4
Health care provision:
A frequent debate in the demographic literature focuses on the origin of differences in
morbidity and mortality of children, in particular, the relative role of biological and
behavioural factors (Lopez and Ruzicka, 1981;Preston, 1976; Langford, 1984; Waldrom,
1983;Hill and Upchurch, 1995;United Nations, 1998). Overall, biological factors are
considered to be less important, while discrimination of girls in nutrition, preventive and
curative health care seeking have an impact on morbidity and mortality. Female selective
infanticide is an extreme form of societal discrimination, but its prevalence is very very small
to make a significant impact on excess female mortality. Sex selective abortion is another
severe form of gender discrimination, which recent studies have documented.
Differentials in treatment of children by sex is known to be directly linked to the differences
in mortality of boys and girls (D’Souza and Chen, 1980; Das Gupta, 1987). Gender
differences in health care between girls and boys are the direct consequence of discrimination
against females in seeking health care. In India, discrimination of girls in both preventive
(immunization) and curative (treatment of illness) care are also reported with varying degrees
amongst the states. Studies have recognised this as the main pathway for excess female child
mortality. Even when such discrimination is not fatal, it can still produce greater frailty
among survivors and thus is an important child health issue in itself (Mosely and Becker,
1991;Mosley and Chen, 1984). Poor health has implication for surviving girls. Their poor
health in reproductive years may be perpetuated across generations (Merchant and Kurz,
1992).
Studies across India have found that boys are much more likely than girls to be taken to a
health facility when sick (Caldwell, Reddy and Caldwell, 1982; Das Gupta, 1987; Ganatra
and Harve, 1994; Govindasamy and Ramesh, 1996;Kishor, 1995). Boys had higher
immunization rates than did girls in all except Goa and Karnataka, although the extent of this
difference varied by states (Kurz and Johnson-Welch, 1997).
Regional inequalities
A major area of concern and focus in India is the remarkable degree of within regional
commonalties and across region contrasts in culture, gender bias, development and
demography. Several researchers have recognised a cultural divide between north and south
Indian states. North Indian kinship structure with exogamous marriage system favour strong
Page 5
5
patriarchal value and lower female autonomy compared to south Indian kinship structure of
endogenous marriage system (Dyson and Moore, 1983; Karve, 1965; Sopher, 1980).
Though, recent studies have found some blurring of north- south disparity in gender
discrimination.
The main objective of this analysis is to examine the regional differences in gender bias
against female children. A multiple indicator approach is used unlike, earlier studies, which
have focused on selective or individual indicators when dealing with the issue of gender bias
against female children. Recognising several pathways of gender bias which cumulatively
contribute to excess female mortality and gender inequalities, gender biases are examined on
five sub domains namely, school attendance, nutrition, immunization, treatment and child
mortality. The levels of gender bias on two available indicators of immunization and school
attendance from the two sets of data NFHS and MICS are also compared in order to see the
consistency of the two estimates. Accordingly, gender biases are examined. The levels of
gender bias in adult literacy and work participation are also compared with the gender biases
indices for children.
Data and methods of analysis
In this analysis, we use the national family health survey-2 (NFHS, 1998-99) data set (which
is similar to demographic health survey (DHS), conducted in Asia, Africa and Latin America
as well as multiple indicator survey (MICS-2000). The NFHS provides information on
fertility, fertility preferences, child mortality and child health indicators. The survey also
collected data on health related measures such as immunization; morbidities i.e. diarrhoea,
respiratory infections, and fever; treatment seeking for these diseases; and anthropometric
indicators of nutritional status such as height and weight, for children under age 3.
In this analysis, information on treatment of children if the child had fever, cough and
diarrhoea are used. On preventive care, information on whether the child was fully
immunized or not with respect to the recommended expanded programme on immunization
(EPI) vaccines that includes BCG, three doses of DPT and Polio and Measles are used. On
education the information on school attendance rate is used. The extent of gender bias against
female children has been examined based on sex differences on all these five dimensions. On
nutrition, data on weight, height and breastfeeding are used.
Page 6
6
Methods of measuring gender bias in health, nutrition and treatment seeking
A multiple indicator approach is used to study state level gender bias. Five sub indices of
gender bias are generated on five dimensions of sex differences in school attendance,
nutritional status, immunization, and treatment seeking for illness and child mortality. The
indices calculations are described below.
We define six indices of gender biases on school attendance, nutrition, immunization, disease
incidence, treatment of illness, child mortality and overall index of gender bias.
1.Sex ratio in school attendance
Index of gender bias in schooling:2
21 RRRs
+=
where, )106(Pr
)106(Pr1
yearsschoolattendingboysofoportion
yearsschoolattendinggirlsofoportionR
−
−=
)1411(Pr
)1411(Pr2
yearsschoolattendingboysofoportion
yearsschoolattendinggirlsofoportionR
−
−=
2. Sex ratio in nutritional status
Index of gender bias in nutrition: 4
6543 RRRRRn
+++=
where, )(
)(3
monthsinboysforingbreastfeedofdurationMedian
monthsingirlsforingbreastfeedofdurationMedianR =
ageforweightofmediantheofdeviationstandard2ofthresholdthebelowGirlsofProportion
ageforweightofmediantheofdeviationstandard2ofthresholdthebelowboysofProportionR4
−−−
−−−=
ageforofmediantheofdeviationstandard2ofthresholdthebelowGirlsofProportion
ageforofmediantheofdeviationstandard2ofthresholdthebelowboysofProportionR5
−−−
−−−=
height
height
height
height
−−−
−−−=
forweightofmediantheofdeviationstandard2ofthresholdthebelowGirlsofProportion
forweightofmediantheofdeviationstandard2ofthresholdthebelowboysofProportionR6
Page 7
7
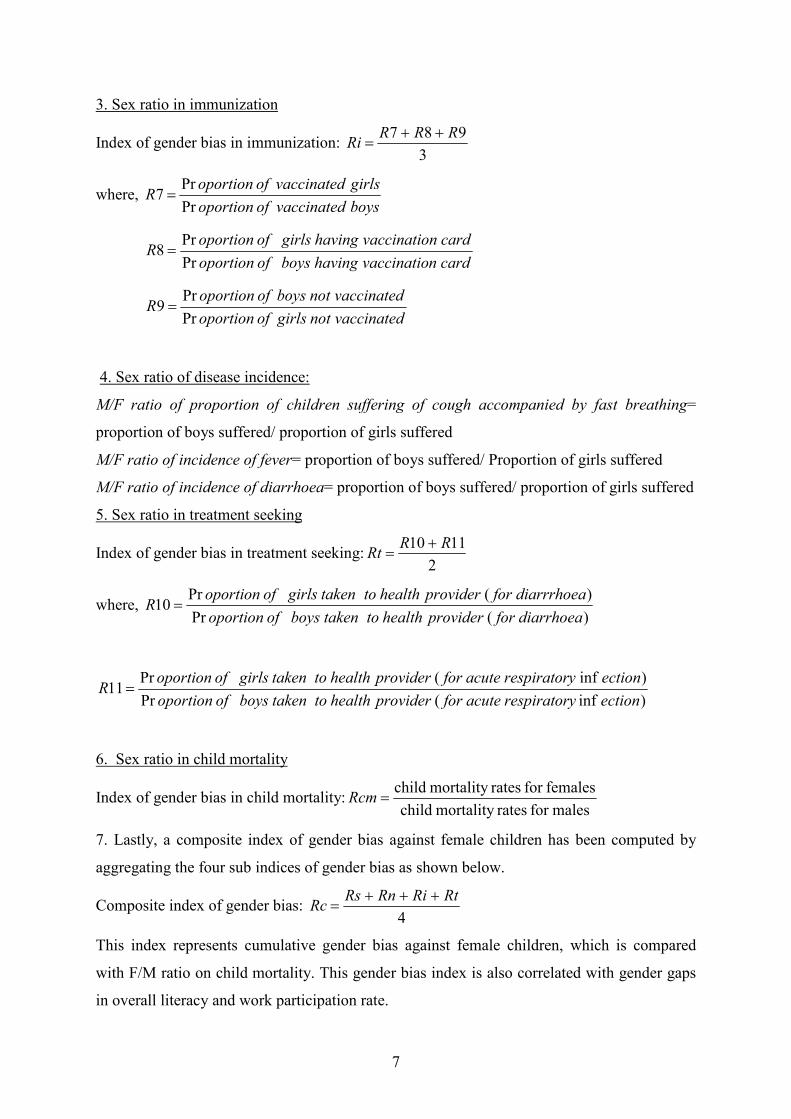
3. Sex ratio in immunization
Index of gender bias in immunization: 3
987 RRRRi
++=
where, boysvaccinatedofoportion
girlsvaccinatedofoportionR
Pr
Pr7 =
cardnvaccinatiohavingboysofoportion
cardnvaccinatiohavinggirlsofoportionR
Pr
Pr8 =
vaccinatednotgirlsofoportion
vaccinatednotboysofoportionR
Pr
Pr9 =
4. Sex ratio of disease incidence:
M/F ratio of proportion of children suffering of cough accompanied by fast breathing=
proportion of boys suffered/ proportion of girls suffered
M/F ratio of incidence of fever= proportion of boys suffered/ Proportion of girls suffered
M/F ratio of incidence of diarrhoea= proportion of boys suffered/ proportion of girls suffered
5. Sex ratio in treatment seeking
Index of gender bias in treatment seeking:2
1110 RRRt
+=
where, )(Pr
)(Pr10
diarrhoeaforproviderhealthtotakenboysofoportion
diarrrhoeaforproviderhealthtotakengirlsofoportionR =
)inf(Pr
)inf(Pr11
ectionyrespiratoracuteforproviderhealthtotakenboysofoportion
ectionyrespiratoracuteforproviderhealthtotakengirlsofoportionR =
6. Sex ratio in child mortality
Index of gender bias in child mortality:malesfor ratesmortality child
femalesfor ratesmortality child=Rcm
7. Lastly, a composite index of gender bias against female children has been computed by
aggregating the four sub indices of gender bias as shown below.
Composite index of gender bias: 4
RtRiRnRsRc
+++=
This index represents cumulative gender bias against female children, which is compared
with F/M ratio on child mortality. This gender bias index is also correlated with gender gaps
in overall literacy and work participation rate.
Page 8
8
Multivariate analyses
Logistic regression models are used to assess the net effect of variable sex of the child on
health, nutrition, treatment, and school attendance, by controlling for related demographic
and socio-economic status variables. Five logistic models have been estimated with
dependent variables child a) attending school, b) nutritional status below –2SD, c) fully
immunized, and d) child with diarrhoea was taken to a health provider and e) child with ARI
was taken to a health provider. Since our primary aim is to examine the extent of gender bias,
only sex wise odds ratios have been estimated adjusting for other variables. The odds of
female children being discriminated against, controlling for several covariates such as,
women’s age and education level, standard of living index of the household, caste and
residence.
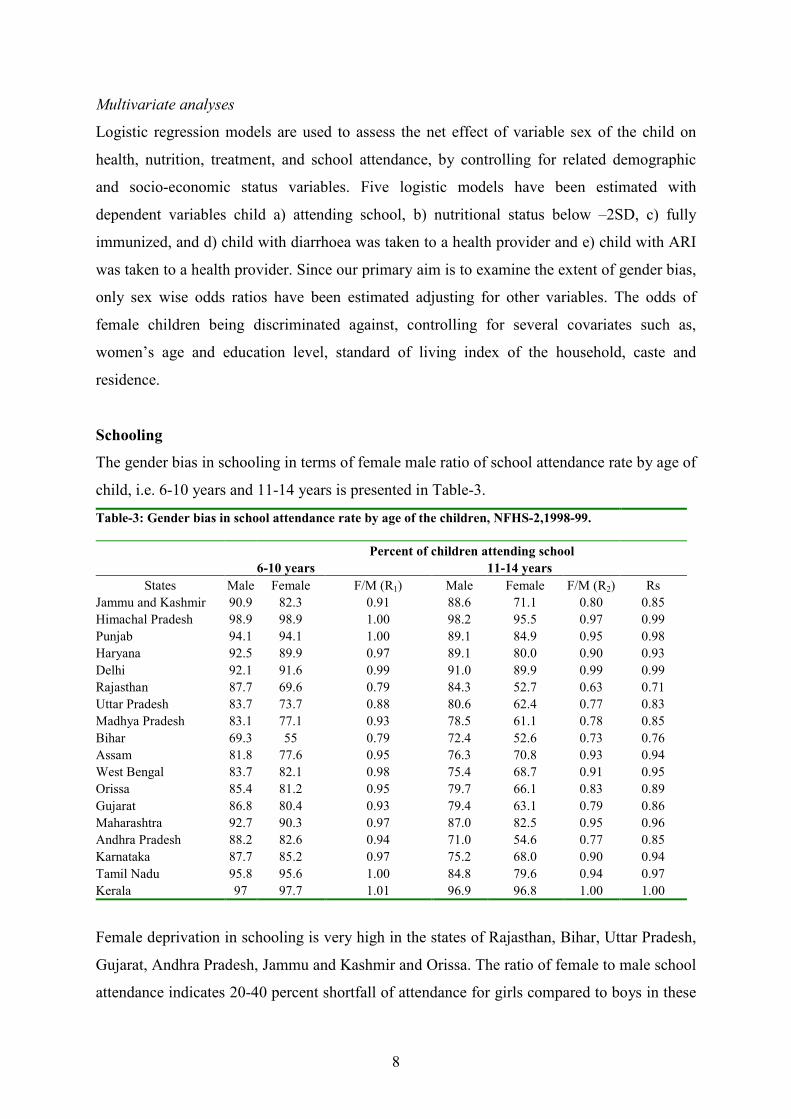
Schooling
The gender bias in schooling in terms of female male ratio of school attendance rate by age of
child, i.e. 6-10 years and 11-14 years is presented in Table-3.
Table-3: Gender bias in school attendance rate by age of the children, NFHS-2,1998-99.
Percent of children attending school
6-10 years 11-14 years
States Male Female F/M (R1) Male Female F/M (R2) Rs
Jammu and Kashmir 90.9 82.3 0.91 88.6 71.1 0.80 0.85
Himachal Pradesh 98.9 98.9 1.00 98.2 95.5 0.97 0.99
Punjab 94.1 94.1 1.00 89.1 84.9 0.95 0.98
Haryana 92.5 89.9 0.97 89.1 80.0 0.90 0.93
Delhi 92.1 91.6 0.99 91.0 89.9 0.99 0.99
Rajasthan 87.7 69.6 0.79 84.3 52.7 0.63 0.71
Uttar Pradesh 83.7 73.7 0.88 80.6 62.4 0.77 0.83
Madhya Pradesh 83.1 77.1 0.93 78.5 61.1 0.78 0.85
Bihar 69.3 55 0.79 72.4 52.6 0.73 0.76
Assam 81.8 77.6 0.95 76.3 70.8 0.93 0.94
West Bengal 83.7 82.1 0.98 75.4 68.7 0.91 0.95
Orissa 85.4 81.2 0.95 79.7 66.1 0.83 0.89
Gujarat 86.8 80.4 0.93 79.4 63.1 0.79 0.86
Maharashtra 92.7 90.3 0.97 87.0 82.5 0.95 0.96
Andhra Pradesh 88.2 82.6 0.94 71.0 54.6 0.77 0.85
Karnataka 87.7 85.2 0.97 75.2 68.0 0.90 0.94
Tamil Nadu 95.8 95.6 1.00 84.8 79.6 0.94 0.97
Kerala 97 97.7 1.01 96.9 96.8 1.00 1.00
Female deprivation in schooling is very high in the states of Rajasthan, Bihar, Uttar Pradesh,
Gujarat, Andhra Pradesh, Jammu and Kashmir and Orissa. The ratio of female to male school
attendance indicates 20-40 percent shortfall of attendance for girls compared to boys in these
Page 9
9
states. Comparatively, the shortfall in female schooling is 5-10 percent in the states of Assam,
Punjab, Gujarat, Maharashtra, Karnataka, and Tamil Nadu. The F/M ratios for school
attendance indicate lesser differences for the age group 6-10 year but more pronounced
differences in the ages 10+ years, due to higher dropout rate for girls compared to boys in the
later stage. While the gap in primary enrolment is a first stage, girls not being sent to school,
discontinuation of girls at middle and second level is the second stage of discrimination of
girls is one of the important pathways of gender bias against female children.
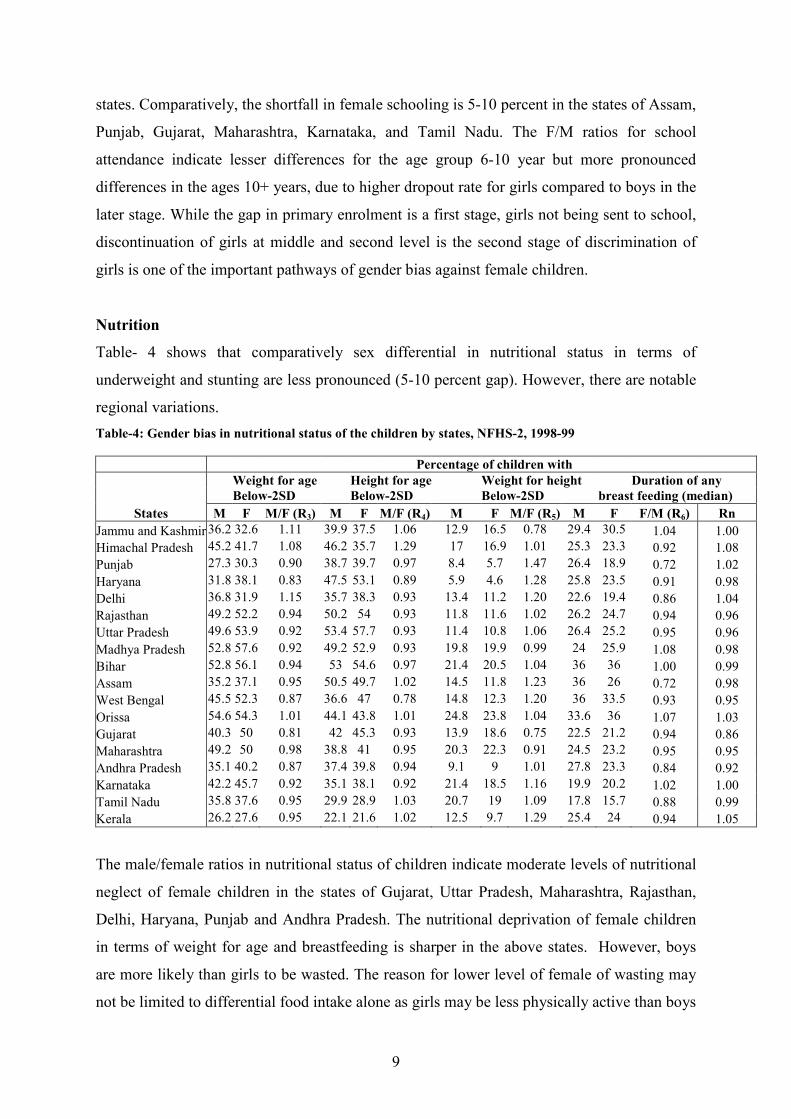
Nutrition
Table- 4 shows that comparatively sex differential in nutritional status in terms of
underweight and stunting are less pronounced (5-10 percent gap). However, there are notable
regional variations.
Table-4: Gender bias in nutritional status of the children by states, NFHS-2, 1998-99
Percentage of children with
Weight for age Height for age Weight for height Duration of any
Below-2SD Below-2SD Below-2SD breast feeding (median)
States M F M/F (R3) M F M/F (R4) M F M/F (R5) M F F/M (R6) Rn
Jammu and Kashmir 36.2 32.6 1.11 39.9 37.5 1.06 12.9 16.5 0.78 29.4 30.5 1.04 1.00
Himachal Pradesh 45.2 41.7 1.08 46.2 35.7 1.29 17 16.9 1.01 25.3 23.3 0.92 1.08
Punjab 27.3 30.3 0.90 38.7 39.7 0.97 8.4 5.7 1.47 26.4 18.9 0.72 1.02
Haryana 31.8 38.1 0.83 47.5 53.1 0.89 5.9 4.6 1.28 25.8 23.5 0.91 0.98
Delhi 36.8 31.9 1.15 35.7 38.3 0.93 13.4 11.2 1.20 22.6 19.4 0.86 1.04
Rajasthan 49.2 52.2 0.94 50.2 54 0.93 11.8 11.6 1.02 26.2 24.7 0.94 0.96
Uttar Pradesh 49.6 53.9 0.92 53.4 57.7 0.93 11.4 10.8 1.06 26.4 25.2 0.95 0.96
Madhya Pradesh 52.8 57.6 0.92 49.2 52.9 0.93 19.8 19.9 0.99 24 25.9 1.08 0.98
Bihar 52.8 56.1 0.94 53 54.6 0.97 21.4 20.5 1.04 36 36 1.00 0.99
Assam 35.2 37.1 0.95 50.5 49.7 1.02 14.5 11.8 1.23 36 26 0.72 0.98
West Bengal 45.5 52.3 0.87 36.6 47 0.78 14.8 12.3 1.20 36 33.5 0.93 0.95
Orissa 54.6 54.3 1.01 44.1 43.8 1.01 24.8 23.8 1.04 33.6 36 1.07 1.03
Gujarat 40.3 50 0.81 42 45.3 0.93 13.9 18.6 0.75 22.5 21.2 0.94 0.86
Maharashtra 49.2 50 0.98 38.8 41 0.95 20.3 22.3 0.91 24.5 23.2 0.95 0.95
Andhra Pradesh 35.1 40.2 0.87 37.4 39.8 0.94 9.1 9 1.01 27.8 23.3 0.84 0.92
Karnataka 42.2 45.7 0.92 35.1 38.1 0.92 21.4 18.5 1.16 19.9 20.2 1.02 1.00
Tamil Nadu 35.8 37.6 0.95 29.9 28.9 1.03 20.7 19 1.09 17.8 15.7 0.88 0.99
Kerala 26.2 27.6 0.95 22.1 21.6 1.02 12.5 9.7 1.29 25.4 24 0.94 1.05
The male/female ratios in nutritional status of children indicate moderate levels of nutritional
neglect of female children in the states of Gujarat, Uttar Pradesh, Maharashtra, Rajasthan,
Delhi, Haryana, Punjab and Andhra Pradesh. The nutritional deprivation of female children
in terms of weight for age and breastfeeding is sharper in the above states. However, boys
are more likely than girls to be wasted. The reason for lower level of female of wasting may
not be limited to differential food intake alone as girls may be less physically active than boys
Page 10
10
or may be less prone to nutritional inadequacy, given their relative lower requirements.
Although, nutritional neglect cumulatively indicates lesser gender gaps, long-term nutritional
inadequacy tend to have many negative consequences such as increasing risk of disease,
deterioration in physical and mental health and intergenerational impact of nutritional
inadequacy.
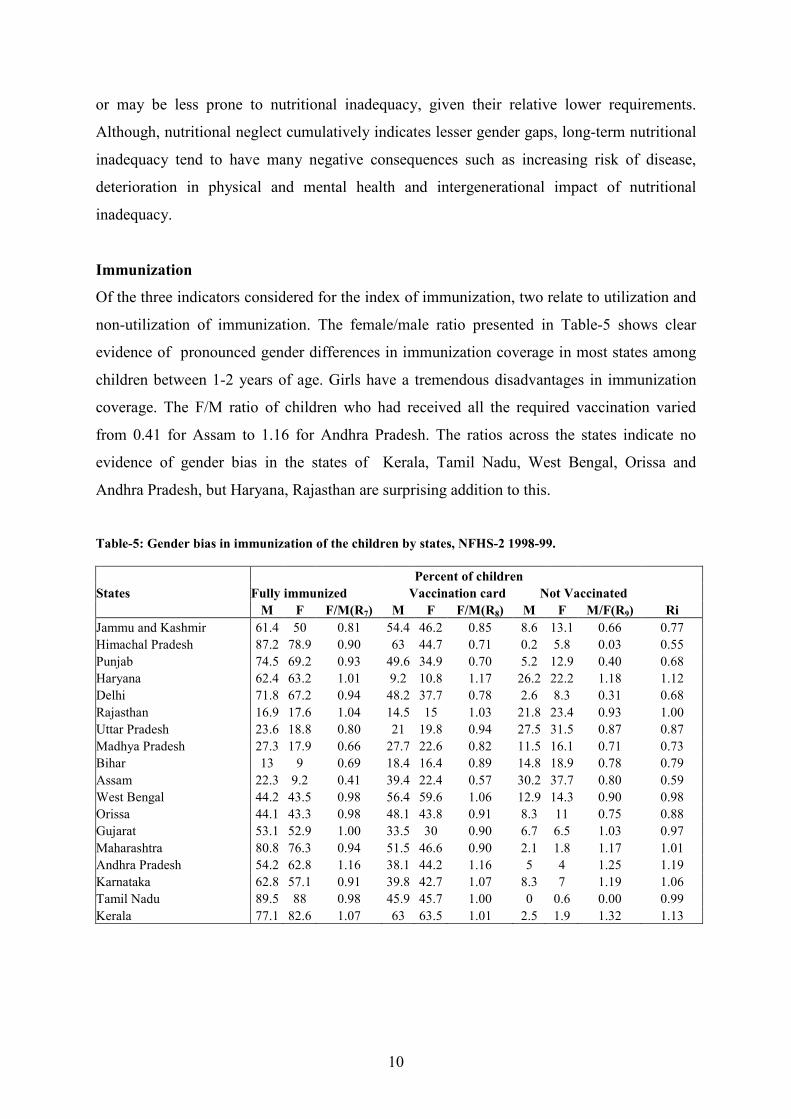
Immunization
Of the three indicators considered for the index of immunization, two relate to utilization and
non-utilization of immunization. The female/male ratio presented in Table-5 shows clear
evidence of pronounced gender differences in immunization coverage in most states among
children between 1-2 years of age. Girls have a tremendous disadvantages in immunization
coverage. The F/M ratio of children who had received all the required vaccination varied
from 0.41 for Assam to 1.16 for Andhra Pradesh. The ratios across the states indicate no
evidence of gender bias in the states of Kerala, Tamil Nadu, West Bengal, Orissa and
Andhra Pradesh, but Haryana, Rajasthan are surprising addition to this.
Table-5: Gender bias in immunization of the children by states, NFHS-2 1998-99.
Percent of children
States Fully immunized Vaccination card Not Vaccinated
M F F/M(R7) M F F/M(R8) M F M/F(R9) Ri
Jammu and Kashmir 61.4 50 0.81 54.4 46.2 0.85 8.6 13.1 0.66 0.77
Himachal Pradesh 87.2 78.9 0.90 63 44.7 0.71 0.2 5.8 0.03 0.55
Punjab 74.5 69.2 0.93 49.6 34.9 0.70 5.2 12.9 0.40 0.68
Haryana 62.4 63.2 1.01 9.2 10.8 1.17 26.2 22.2 1.18 1.12
Delhi 71.8 67.2 0.94 48.2 37.7 0.78 2.6 8.3 0.31 0.68
Rajasthan 16.9 17.6 1.04 14.5 15 1.03 21.8 23.4 0.93 1.00
Uttar Pradesh 23.6 18.8 0.80 21 19.8 0.94 27.5 31.5 0.87 0.87
Madhya Pradesh 27.3 17.9 0.66 27.7 22.6 0.82 11.5 16.1 0.71 0.73
Bihar 13 9 0.69 18.4 16.4 0.89 14.8 18.9 0.78 0.79
Assam 22.3 9.2 0.41 39.4 22.4 0.57 30.2 37.7 0.80 0.59
West Bengal 44.2 43.5 0.98 56.4 59.6 1.06 12.9 14.3 0.90 0.98
Orissa 44.1 43.3 0.98 48.1 43.8 0.91 8.3 11 0.75 0.88
Gujarat 53.1 52.9 1.00 33.5 30 0.90 6.7 6.5 1.03 0.97
Maharashtra 80.8 76.3 0.94 51.5 46.6 0.90 2.1 1.8 1.17 1.01
Andhra Pradesh 54.2 62.8 1.16 38.1 44.2 1.16 5 4 1.25 1.19
Karnataka 62.8 57.1 0.91 39.8 42.7 1.07 8.3 7 1.19 1.06
Tamil Nadu 89.5 88 0.98 45.9 45.7 1.00 0 0.6 0.00 0.99
Kerala 77.1 82.6 1.07 63 63.5 1.01 2.5 1.9 1.32 1.13
Page 11
11
Another indicator considered as children who had not received any vaccination at all
were possibly from households with very little access to health care and poor socio-economic
condition. The M/F ratios of children not given vaccination ranged from 0.03 in Himachal
Pradesh to 1.32 in Kerala. The ratio value of above one indicates female advantage in the
states of Maharashtra, Andhra Pradesh, Karnataka and Kerala with Haryana and Gujarat as
surprising addition to this group. Female disadvantage is indicated in the rest of the states at
varying levels.
The value attached to the safe keeping of vaccination cards may be considered as an
indication of interest shown by the parents, especially the mother, in the health and well
being of the individual child. So the third indicator considered as gender disparity
(female/male ratio) in terms of the possession of the vaccination card. The ratios varied from
0.57 to 1.17 across the states. The ratio value above one in West Bengal, Andhra Pradesh,
Karnataka, Tamil Nadu and Kerala indicates that female children were in advantageous
position with Haryana and Rajasthan to this group. Varying levels of female child
disadvantage is seen for rest of the states.
The overall index of gender bias in immunization shows very high levels of female
neglect the ratio value lower than one by 20-45 percent in the states of Assam, Himachal
Pradesh, Punjab, Madhya Pradesh, Bihar, and Jammu and Kashmir. Moderate levels of
female neglect the ratio value lower than one by 5-20 percent are indicated in the states of
Uttar Pradesh, Orissa. Again Rajasthan, Haryana, Gujarat, Delhi and West Bengal are
surprising omissions here. However, the ratios for the indicators i.e. school attendance,
nutrition and treatment seeking, show significant degree of gender bias in these states. The
index value indicates no evidence of female child neglect in the south Indian states.
Incidence of illness by sex
When examining gender bias in treatment of illness, as a prior it is important to examine sex
difference in illness. The linkage between severity and duration of infection, the medical
treatment received, its timing and case fatality rates by sex are clearly complex (Faveau,
Koening and Wojtyniak, 1991). Diarrhoeal disease, Malaria and Acute Respiratory Infections
are leading causes of infant and child mortality in developing countries and in India, but
incidence of these diseases vary by sex. The NFHS-2 asked question on fever, cough
accompanied by breathing, diarrhoea with blood also. However these data have several
Page 12
12
limitations and recall biases. Mothers might not be sure exactly when their child was ill.
Underreporting of illness increases with the length of the recall period. Recall biases also
tend to vary across the Indian states for the different symptoms due to varying levels of
literacy and awareness levels of diseases and treatment seeking. These are likely to affect
male-female comparisons. Second, if the sex of the child affects the perceived severity of the
condition, the data obtained about boys and girls will be affected differently. Apparently
lower female morbidity might result from a bias against reporting incidence of sickness
among female children although the question asked is exactly same (Hill and Upchurch,
1994). Moreover, if mothers classify girls as ill, only when they have more severe disease
than boys, that differences could affect treatment seeking. Given such biases it is necessary to
first to examine sex differences in incidence of illness.
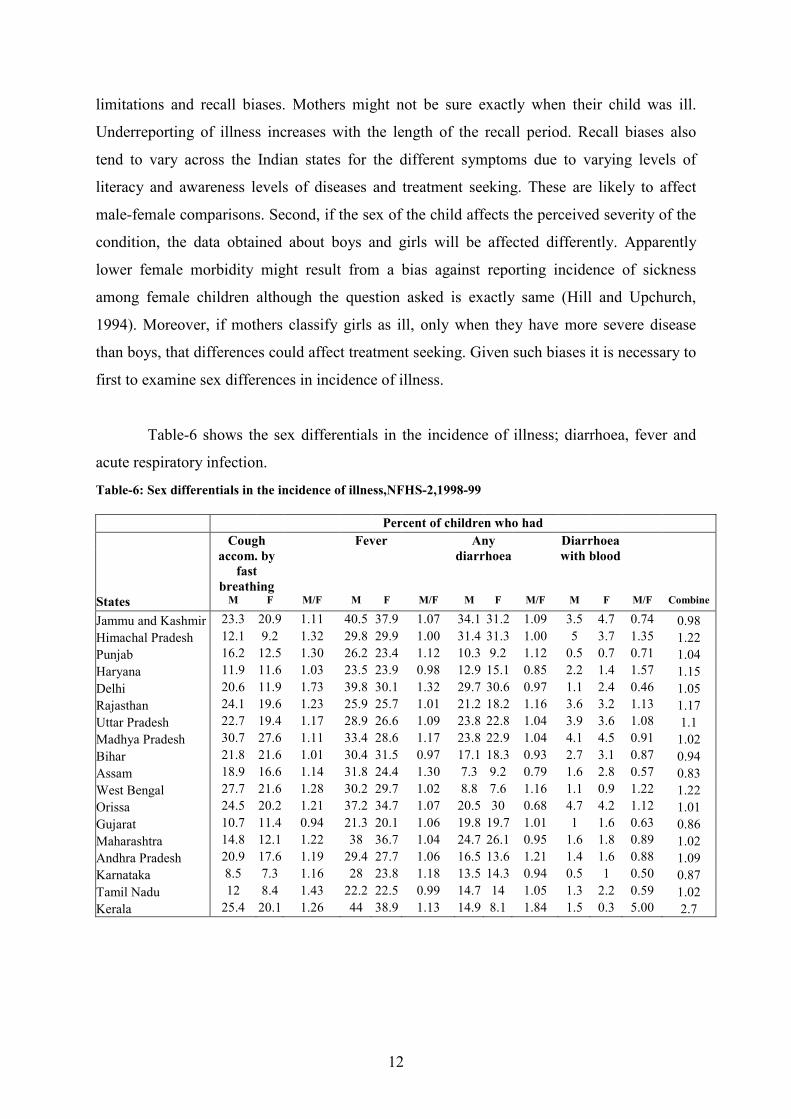
Table-6 shows the sex differentials in the incidence of illness; diarrhoea, fever and
acute respiratory infection.
Table-6: Sex differentials in the incidence of illness,NFHS-2,1998-99
Percent of children who had
Cough
accom. by
fast
breathing
Fever
Any
diarrhoea
Diarrhoea
with blood
States M F M/F M F M/F M F M/F M F M/F Combine
Jammu and Kashmir 23.3 20.9 1.11 40.5 37.9 1.07 34.1 31.2 1.09 3.5 4.7 0.74 0.98
Himachal Pradesh 12.1 9.2 1.32 29.8 29.9 1.00 31.4 31.3 1.00 5 3.7 1.35 1.22
Punjab 16.2 12.5 1.30 26.2 23.4 1.12 10.3 9.2 1.12 0.5 0.7 0.71 1.04
Haryana 11.9 11.6 1.03 23.5 23.9 0.98 12.9 15.1 0.85 2.2 1.4 1.57 1.15
Delhi 20.6 11.9 1.73 39.8 30.1 1.32 29.7 30.6 0.97 1.1 2.4 0.46 1.05
Rajasthan 24.1 19.6 1.23 25.9 25.7 1.01 21.2 18.2 1.16 3.6 3.2 1.13 1.17
Uttar Pradesh 22.7 19.4 1.17 28.9 26.6 1.09 23.8 22.8 1.04 3.9 3.6 1.08 1.1
Madhya Pradesh 30.7 27.6 1.11 33.4 28.6 1.17 23.8 22.9 1.04 4.1 4.5 0.91 1.02
Bihar 21.8 21.6 1.01 30.4 31.5 0.97 17.1 18.3 0.93 2.7 3.1 0.87 0.94
Assam 18.9 16.6 1.14 31.8 24.4 1.30 7.3 9.2 0.79 1.6 2.8 0.57 0.83
West Bengal 27.7 21.6 1.28 30.2 29.7 1.02 8.8 7.6 1.16 1.1 0.9 1.22 1.22
Orissa 24.5 20.2 1.21 37.2 34.7 1.07 20.5 30 0.68 4.7 4.2 1.12 1.01
Gujarat 10.7 11.4 0.94 21.3 20.1 1.06 19.8 19.7 1.01 1 1.6 0.63 0.86
Maharashtra 14.8 12.1 1.22 38 36.7 1.04 24.7 26.1 0.95 1.6 1.8 0.89 1.02
Andhra Pradesh 20.9 17.6 1.19 29.4 27.7 1.06 16.5 13.6 1.21 1.4 1.6 0.88 1.09
Karnataka 8.5 7.3 1.16 28 23.8 1.18 13.5 14.3 0.94 0.5 1 0.50 0.87
Tamil Nadu 12 8.4 1.43 22.2 22.5 0.99 14.7 14 1.05 1.3 2.2 0.59 1.02
Kerala 25.4 20.1 1.26 44 38.9 1.13 14.9 8.1 1.84 1.5 0.3 5.00 2.7
Page 13
13
Result indicates that boys have higher incidence of cough in all the states except Gujarat.
The incidence of fever is also reported to be higher for males in most states. However, the
reported incidence of diarrhoea with blood is higher for females compared to males. With
respect to the incidence of all the three diseases, girls have lower reported incidence
compared to boys. In general, the prevalence in terms of incidence of illness is higher for
boys.
Treatment seeking
An important way in which gender bias manifests is that girls tend not to be taken for health
care as often or as early in their illness as boys because girls may receive less attention from
parents. Also first-born girls tend to receive better health care than their younger sisters.
Women and girl children particularly girls face the greatest problem in acquiring adequate
health care. The neglect of girls in the use of curative health services is an important link that
directly account for female mortality disadvantage.
Analyses tend to examine whether among those children who were sick are there sex
differentials in being treated at all or type of treatment received. However, sex differentials in
the source of treatment are more helpful to explain sex differential in mortality. Also this
relationship is confounded by sex differentials in the timing of use of different providers and
with the severity of the conditions. For instance, girls might be taken to professional health
provider only after their conditions have deteriorated too far for treatment to save their lives.
In Uttar Pradesh, northern India, boys were taken to city hospitals when warranted while girls
saw less qualified doctors (Khan et al., 1991). Basu (1989) examined both the source and
type of treatment in conjunction. Her study focused on two groups of children aged less than
12 years living in a resettlement slum in New Delhi; the parent of one group had migrated
from Uttar Pradesh and those of other from Tamil Nadu. In addition to sex differences in both
groups in the proportion of illness receiving no treatment, the northern Indian girls were more
likely to receive non-professional treatment than boys. Therefore, the sex differentials in
proportion being treated by a professional health provider are more crucial.
The data on the timing of use of different health services have not been collected in
this survey. So we examine the sex differences in treatment of children. The F/M ratio in the
proportion of children, who were taken to health provider is presented in Table 7.
Page 14
14
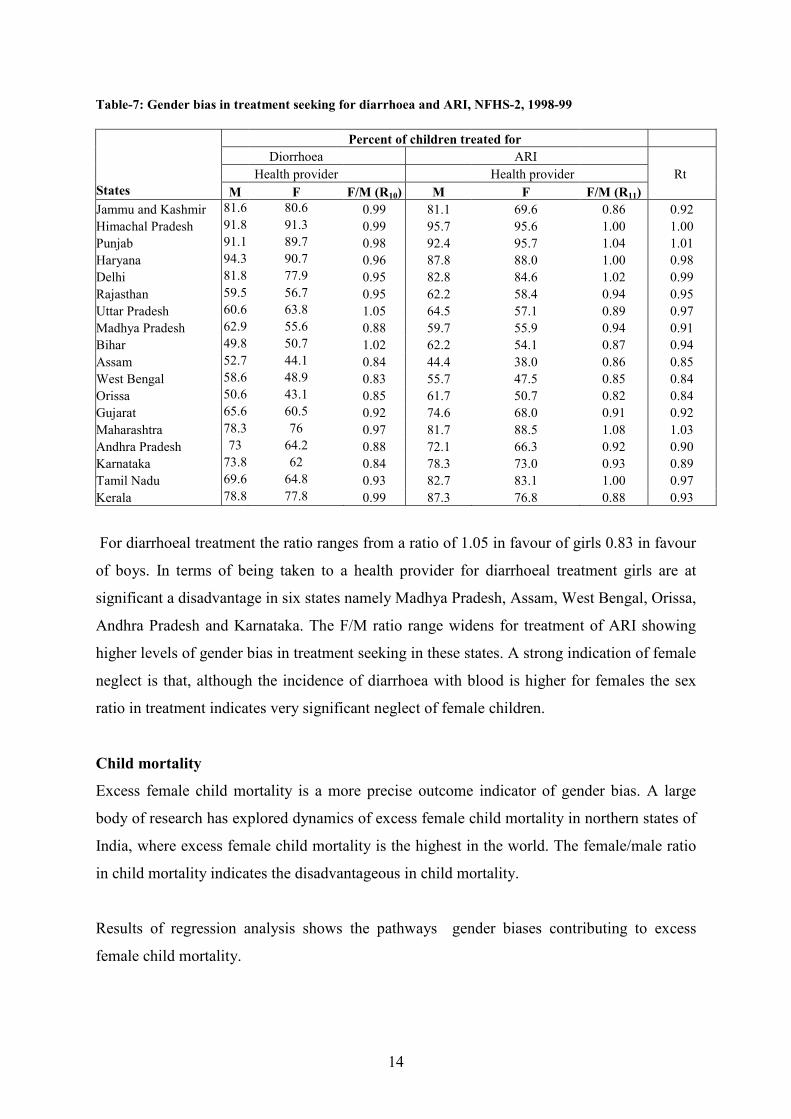
Table-7: Gender bias in treatment seeking for diarrhoea and ARI, NFHS-2, 1998-99
Percent of children treated for
Diorrhoea ARI
Health provider Health provider Rt
States M F F/M (R10) M F F/M (R11)
Jammu and Kashmir 81.6 80.6 0.99 81.1 69.6 0.86 0.92
Himachal Pradesh 91.8 91.3 0.99 95.7 95.6 1.00 1.00
Punjab 91.1 89.7 0.98 92.4 95.7 1.04 1.01
Haryana 94.3 90.7 0.96 87.8 88.0 1.00 0.98
Delhi 81.8 77.9 0.95 82.8 84.6 1.02 0.99
Rajasthan 59.5 56.7 0.95 62.2 58.4 0.94 0.95
Uttar Pradesh 60.6 63.8 1.05 64.5 57.1 0.89 0.97
Madhya Pradesh 62.9 55.6 0.88 59.7 55.9 0.94 0.91
Bihar 49.8 50.7 1.02 62.2 54.1 0.87 0.94
Assam 52.7 44.1 0.84 44.4 38.0 0.86 0.85
West Bengal 58.6 48.9 0.83 55.7 47.5 0.85 0.84
Orissa 50.6 43.1 0.85 61.7 50.7 0.82 0.84
Gujarat 65.6 60.5 0.92 74.6 68.0 0.91 0.92
Maharashtra 78.3 76 0.97 81.7 88.5 1.08 1.03
Andhra Pradesh 73 64.2 0.88 72.1 66.3 0.92 0.90
Karnataka 73.8 62 0.84 78.3 73.0 0.93 0.89
Tamil Nadu 69.6 64.8 0.93 82.7 83.1 1.00 0.97
Kerala 78.8 77.8 0.99 87.3 76.8 0.88 0.93
For diarrhoeal treatment the ratio ranges from a ratio of 1.05 in favour of girls 0.83 in favour
of boys. In terms of being taken to a health provider for diarrhoeal treatment girls are at
significant a disadvantage in six states namely Madhya Pradesh, Assam, West Bengal, Orissa,
Andhra Pradesh and Karnataka. The F/M ratio range widens for treatment of ARI showing
higher levels of gender bias in treatment seeking in these states. A strong indication of female
neglect is that, although the incidence of diarrhoea with blood is higher for females the sex
ratio in treatment indicates very significant neglect of female children.
Child mortality
Excess female child mortality is a more precise outcome indicator of gender bias. A large
body of research has explored dynamics of excess female child mortality in northern states of
India, where excess female child mortality is the highest in the world. The female/male ratio
in child mortality indicates the disadvantageous in child mortality.
Results of regression analysis shows the pathways gender biases contributing to excess
female child mortality.
Page 15
15
Table-8: Overall gender bias in immunization, schooling, nutrition, treatment seeking and child mortality, 1998-99
Indices of gender bias Work
Literacy 7+ Participation
States Ri Rs Rn Rt Rc Rcm Lr(F/M) Rate( Wr)(F/M)
Jammu and Kashmir 0.77 0.85 1.00 0.92 0.89 1.48 0.64 0.44
Himachal Pradesh 0.55 0.99 1.08 1.00 0.90 1.03 0.79 0.80
Punjab 0.68 0.98 1.02 1.01 0.92 4.03 0.84 0.35
Haryana 1.12 0.93 0.98 0.98 1.00 2.19 0.71 0.54
Delhi 0.68 0.99 1.04 0.99 0.92 1.26 0.86 0.18
Rajasthan 1.00 0.71 0.96 0.95 0.90 1.78 0.58 0.67
Uttar Pradesh 0.87 0.83 0.96 0.97 0.91 1.85 0.61 0.34
Madhya Pradesh 0.73 0.85 0.98 0.91 0.87 1.34 0.65 0.64
Bihar 0.79 0.76 0.99 0.94 0.87 1.39 0.56 0.39
Assam 0.59 0.94 0.98 0.85 0.84 0.79 0.78 0.42
West Bengal 0.98 0.95 0.95 0.84 0.93 1.29 0.78 0.33
Orissa 0.88 0.89 1.03 0.84 0.91 0.94 0.67 0.47
Gujarat 0.97 0.86 0.86 0.92 0.90 1.25 0.73 0.51
Maharashtra 1.01 0.96 0.95 1.03 0.99 1.29 0.78 0.61
Andhra Pradesh 1.19 0.85 0.92 0.90 0.96 1.67 0.72 0.62
Karnataka 1.06 0.94 1.00 0.89 0.97 1.13 0.75 0.56
Tamil Nadu 0.99 0.97 0.99 0.97 0.98 1.24 0.78 0.54
Kerala 1.13 1.00 1.05 0.93 1.03 0.75 0.93 0.30
Levels of excess female child mortality indicates positive relation with levels of gender gap
in school attendance. The nutritional neglect of girl children also shows positive link with
excess female mortality. Gender bias in immunization similarly shows positive
correspondence with excess female child mortality. Composite index is not showing any clear
association with the level of child mortality.
Multivariate analyses
The above indices of gender bias against female children in terms of these multiple indicators
are based on unadjusted differences. Therefore, logistic regression analyses have been used to
examine the net effects of gender bias in various domains of neglect. Results of logistic
regression models are presented in Table-8 with dichotomous categories of ‘yes’ and ‘no’, for
four dependent variables, namely children fully immunized, underweight, school attendance,
treated for diarrhoea and treated for ARI. The odds of female child receiving care in yes
category with male as reference are estimated controlling for background variables such as
women’s age, education, household standard of living, place of residence and Caste. An odds
ratio of 1.00 indicates that the odds of that outcome are the same for boys and girls.
Page 16
16
Table-9: Logistic regression analysis of gender bias by selected variables, NFHS-2, 1998-99
Ref-Male
Odds of female child being
States Attending Taken to Taken to
fully immunized school (6-14) Underweight health provider(Dia) health provider (ARI)
Jammu and Kashmir 0.67 0.73*** 0.83 0.86 0.60**
Himachal Pradesh 0.59 0.88* 0.84 0.82 1.38
Punjab 0.68** 0.84** 1.16 0.99 0.84
Haryana 1.25 0.65** 1.22 0.92 1.26
Delhi 0.63** 1.06 0.79 0.65 1.53
Rajasthan 1.13 0.43*** 1.06 0.89 0.72**
Uttar Pradesh 0.79 0.53** 1.1 1.19 0.74**
Madhya Pradesh 0.58*** 0.46** 1.12 0.74* 0.86
Bihar 0.68 0.60*** 1.12 1.02 0.71**
Assam 0.35*** 1.1 1.13 0.52 0.72
West Bengal 0.96 0.75** 1.30** 0.55 0.76
Orissa 1.12 0.84* 0.97 0.79 0.68**
Gujarat 0.99 0.75** 1.36** 0.78 0.79
Maharashtra 0.77 0.83** 0.94 0.86 1.07
Andhra Pradesh 1.39 0.57* 1.16 0.57 0.56**
Karnataka 0.79 0.69* 1.05 0.57 0.66
Tamil Nadu 0.98 0.84* 0.99 0.76 1.01
Kerala 1.37 0.94 1.03 0.92 0.73
***<0.01,**<0.05,*<0.1
Table-10: Socio-economic and demographic features of major states of India.
Expectation birth State Birth rate
(2000)
Death rate
(2000)
1996-98
IMR Male Female
Per capita
income
Percentage
Below
poverty line
Andhra Pradesh 21.3 8.2 65 61.2 63.5 14878 15.8
Assam 26.9 9.6 75 56.6 57.1 9792 36.1
Bihar 31.9 8.8 62 60.4 58.4 4813 42.6
Gujarat 25.2 7.5 62 60.9 62.9 18685 14.1
Haryana 26.9 7.5 67 63.7 64.6 21551 8.7
Himachal Pradesh 22.1 7.2 60 64.6 65.2 17786 7.6
Jammu* 19.6 6.2 50 - - 12373 -
Karnataka 22.0 7.8 57 61.6 64.9 16654 20.0
Kerala 17.9 6.4 14 70.4 75.9 17709 12.7
Madhya Pradesh 31.2 10.2 88 55.6 55.2 11626 37.4
Maharashtra 20.9 7.5 48 64.1 66.6 22604 25.0
Orissa 24.3 10.5 96 57.1 57.0 8733 47.2
Punjab 21.5 7.3 52 66.7 68.8 23254 6.2
Rajasthan 31.2 8.4 79 59.1 60.1 13046 15.3
Tamil Nadu 19.2 7.9 51 63.2 65.1 18623 21.1
West Bengal 32.8 10.3 83 58.1 56.9 14894 27.0
Uttar Pradesh 20.6 7.0 51 62.2 63.6 9323 31.2
In most states, the odds of female children receiving immunization are significantly lower.
Besides Kerala, the surprising exceptions are, Haryana, Rajasthan, Orissa, Andhra Pradesh,
where odds ratios are greater than one but not significant. Steeply lower odds ratios are
Page 17
17
indicated in the states of Punjab, Delhi, Madhya Pradesh and Assam, indicate that gender bias
is very strong in these states.
The odds of females being underweight are significantly higher in a majority of states.
Strong nutritional deprivations among females are noticed in the states of West Bengal,
Gujarat, Haryana, Punjab and Andhra Pradesh.
A stronger evidence of gender discrimination is found with respect to treatment
seeking for Acute Respiratory Infection. The odds of female children being taken to a health
provider is about 20-45 percent lower in the states of Jammu and Kashmir, Rajasthan, Uttar
Pradesh, Bihar, Orissa, and Andhra Pradesh. The patterns of sex differentials in treatment
seeking for diarrhoea similarly indicate evidences of a strong gender bias.
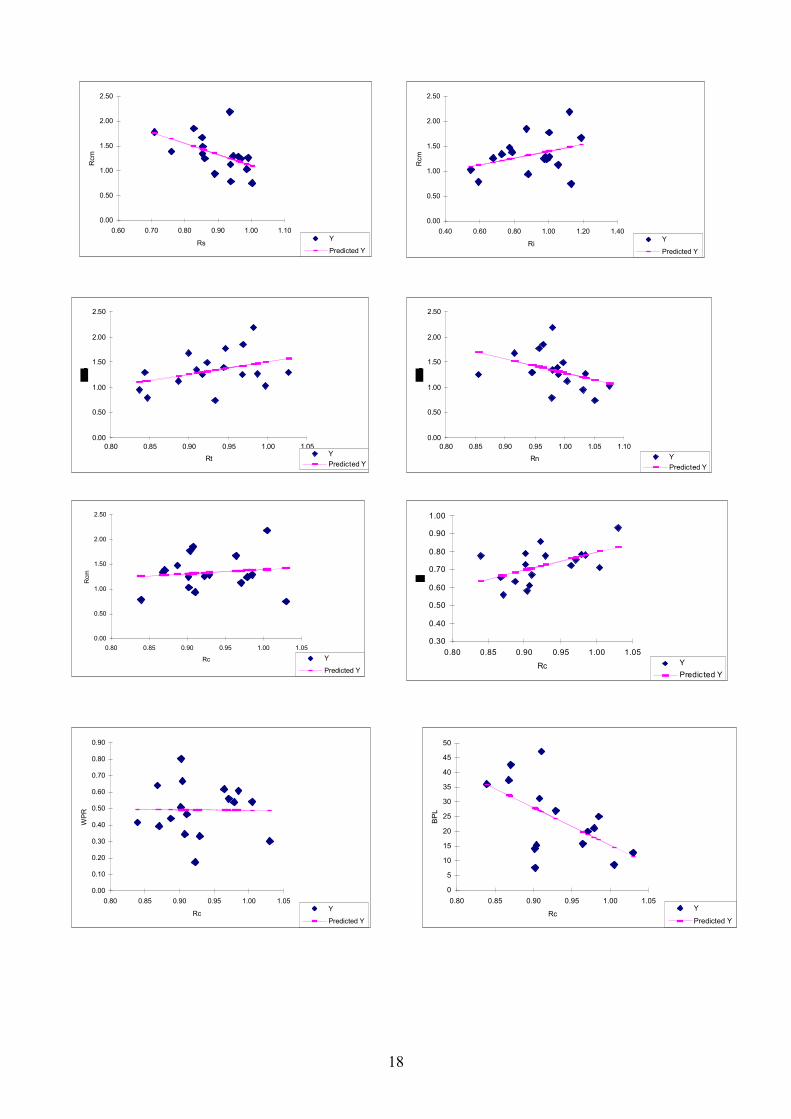
Socio economic condition and gender bias
The relationship of various sub-indices and composite indices of gender bias with female
disadvantage in child mortality and development indicators are examined by using bi-variate
linear regression plots.
Levels of excess female child mortality indicate positive relation with levels of gender
gap in school attendance and nutritional neglect of female children. Gender bias in
immunization similarly shows positive correspondence with excess female child mortality.
Neglect in treatment, however indicates an opposite trend. This needs to be looked into
further. Reporting bias may be a reason. Composite index shows no clear association with the
level of child mortality.
The composite index of female bias indicates a strong positive relation
(correspondence) with the gender gap in adult literacy and poverty ratio. Per-capita income of
the states shows a good correspondence with the composite gender bias index. However,
female/male ratio in work participation indicates no relation with the composite index of
gender bias.
Page 18
18
0.00
0.50
1.00
1.50
2.00
2.50
0.60 0.70 0.80 0.90 1.00 1.10
Rs
Rcm
Y
Predicted Y
0.00
0.50
1.00
1.50
2.00
2.50
0.40 0.60 0.80 1.00 1.20 1.40
Ri
Rcm
Y
Predicted Y
0.00
0.50
1.00
1.50
2.00
2.50
0.80 0.85 0.90 0.95 1.00 1.05
RtY
Predicted Y
0.00
0.50
1.00
1.50
2.00
2.50
0.80 0.85 0.90 0.95 1.00 1.05 1.10
Rn Y
Predicted Y
0.00
0.50
1.00
1.50
2.00
2.50
0.80 0.85 0.90 0.95 1.00 1.05
Rc
Rcm
Y
Predicted Y
0.30
0.40
0.50
0.60
0.70
0.80
0.90
1.00
0.80 0.85 0.90 0.95 1.00 1.05
RcY
Predicted Y
0.00
0.10
0.20
0.30
0.40
0.50
0.60
0.70
0.80
0.90
0.80 0.85 0.90 0.95 1.00 1.05
Rc
WPR
Y
Predicted Y
0
5
10
15
20
25
30
35
40
45
50
0.80 0.85 0.90 0.95 1.00 1.05
Rc
BPL
Y
Predicted Y
Page 19
19
Conclusion
The four sub indices of gender bias and the composite (cumulative) index provide a
comprehensive base to conclude about the extent of gender bias across the states. This
cumulative index shows a significant degree of gender bias against female children in most
north and north central states of India (Table-9). However, gender bias indices relating to
immunization coverage indicate more striking levels of discrimination of female children.
Index of immunization and school attendance indicate consistent and sharper sex differences
suggesting systematic neglect of girls. In the south Indian states and Maharashtra, gender bias
is marginal with Kerala showing favourable condition for females.
A comparison of gender bias in terms of this composite index and female
disadvantage in child mortality indicates good correspondence for a majority of the states.
However, in the states of Haryana, Assam, and Orissa the two ratios of composite index of
gender bias and that of child mortality indicate opposite conditions. Secondly, while F/M
ratios of child mortality indicate greater degree of gender inequalities, the ratio of composite
index shows a narrower range of gender inequalities across the states. The intensity of
gender bias or the lack of it is further highlighted in the chart showing a summary of gender
bias patterns across the states. The chart documents that gender inequalities are well
highlighted for immunization, school attendance, treatment, child mortality, and composite
index of gender bias.
The extent of gender bias demonstrated in this analysis has serious implication for
achieving millennium development goals. The path to halving and further eliminating female
discrimination in school attendance, nutrition, health care use and female disadvantage in
child mortality appear to be long in India. Reaching millennium development goals in states
with overall grading of intense gender bias, will take longer than what is now envisaged. This
is a major issue of concern in the bigger northern states. In relation to each of the millennium
development indicators, specific policy focus is required for narrowing gender differentials.
Page 20
20
References
Amin, S. 1990. “The effect of women’s status on sex differentials in infant and child
mortality in south Asia.” Genus 46(3-4): 55-69.
Arokiasamy, P. 2003. “ Gender preference, contraceptive use and frtility: Regional and
development influence.” International journal of population geography.
Arnold, F., M. K. Choe, and T.K. Roy. 1998. “Son Preference, the family building process
and child mortality in India.” Population studies 52:301-15
Arnold, F.1992. “Sex preferences and its demographic and health implications.” International
family planning prospective 18: 93-101.
-----------1997. Gender preferences for children. DHS comparative studies no. 23. Calverton,
MD: Macro international.
Basu, A. M. and K. Basu. 1991. “Women’s economic roles and child survival: the case of
India.” Health transition review 1(1): 83-103.
Basu, A.M. 1989. “ Is discrimination in food really necessary for explaining sex differentials
in childhood mortality?” Population studies 43: 193-210
Bhat, P. N. M. 1989. “Mortality and fertility in India, 1981-1961:A reassessment.” Pp. 73-
118 in India’s historical demography: studies in famine, disease and society, edited
by T. Dyson. London: Curzon.
Caldwell, P.and J. C. Caldwell.1990. Gender implication for survival in South Asia. Health
transition working paper no.7. Canberra: National centre for epidemiology and
population health, Australian national university.
D’Souza, S. and L.C Chen.1980. “Sex differentials in mortality in Bangladesh.” Population
and development review 6: 257-70.
Das Gupta, M. 1987. “ Selective discrimination against female children in rural Punjab,
India.” Population and development review13: 377-400.
Das Gupta, M. and P. N. M. Bhat.1997. “Fertility decline and increased manifestation of sex
bias in India.” Population studies 51:307-15.
Desai, S. 1994. Gender inequalities and demographic behaviour: India. New York:
Population council.
Dyson, T. and M. Moore. 1983. “ On kinship structure, female autonomy, and demographic
behaviour in India.” Population development review 9: 35-60.
El- Badry, M.A. 1969. “ Higher female than male mortality in some countries of south Asia:
A digest.” American statistical association journal 64: 1234-44.
Page 21
21
Goodkind, David. 1996. “On substituting sex preference strategies in east Asia: Does parental
sex selection reduce post natal discrimination.” Population development review
22(11): 111-25.
Govindasamy, P. and B.M. Ramesh. 1996. “ Maternal education and gender bias in child care
practice in India.” Paper presented at the annual meeting of the population association
of America, New Orleans, May 9-11.
Hill, K. and D.M. Upchurch. 1995. “ Gender differences in child health: Evidence from the
demographic and health surveys.” Population development review 21: 127-51.
International institute for population sciences (IIPS). 1995. National family health survey
(MCH and family planning) India 1992-93. Bombay: IIPS.
Karve, I.1965. Kinship organisation in India. Bombay: Asia publishing house.
Kishor, S.1993. “May god give son to all: Gender and child mortality in India.” American
sociological review 58:247-65.
----------.1995. “Gender differentials in child mortality: A review of the evidence.” Pp. 19-54
in women’s health in India: Risk and vulnerability, edited by M. Das Gupta, L. C.
Chen, and T. N.
Koenig, M. A. and S. D’Souza. 1986. “Sex differences in childhood mortality in rural
Bangladesh.” Social science medicine 22: 15-22.
Langford, C. M. 1984. “ Sex differentials in mortality in Sri Lanka: Changes since the 1920s.
Journal of biosocial science 16:399-410.
Langsten, R. and K. Hill. 1998. The accuracy of mother’s reports of child vaccination:
Evidence from rural Egypt. Social science medicine 46:1205-12.
Lopez, A. D. and Ruzicka, L.T. (eds). 1981. Sex differentials in mortality. Australian
National University, Canberra.
Miller, B. D. 1981. The endangered sex: Neglect of female children in rural north India.
Ithaca, NY: Cornell university press.
Mosley, W.H. and L.C. Chen. 1984. “An analytical framework for the study of child survival
in developing countries.” Population and development review (Suppl.) 10: 25-45.
Murthi, M. A. Guio, and J. Dreze.1995. “ Mortality, fertility and gender bias in India: A
district level analysis.” Population and development review 21: 745-81.
Parasuraman, S. and T.K. Roy. 1991. “Some observations of the 1991 census population of
India.” Journal of family welfare 37:62-68.
Pebley, A. R. and S. Amin. 1991. “ The impact of Public health intervention on sex
differentials in childhood mortality in rural Punjab, India.” Health transition review
1:143-69.
Page 22
22
Preston, S. H. 1976. “ Mortality pattern in national population, Chapter 6, Cause of death
responsible for variation in sex mortality differential, Pp. 120-162.AcademicPress,
New York.
Sen, A and S. Sengupta. 1983. “ Malnutrition of rural children and the sex bias.” Economic
and political weekely, May18: 855-64.
United Nations. 1998. “Too young to die: Genes or gender?” United nations, Population
division, New York.
Waldron, I. 1983. “ Sex differences in human mortality: The role of genetic factors. Social
science medicine 17(6): 321-33.
Wyon, G., and J.E. Gordon.1971. “The Khana study: Population problem in rural Punjab.”
Cambridge, MA: Harvard University press.