Centre for Competitive Advantage in the Global Economy
Department of Economics
June 2013 No.135
The Invisible Hand and the Bank Trade:
Seigniorage, Risk-shifting and More
Marcus Miller and Lei Zhang
The Invisible Hand and the Banking Trade:seigniorage, risk-shifting, and more∗
Marcus Miller†and Lei Zhang‡
March 2013
Abstract
The classic Diamond-Dybvig model of banking assumes perfectcompetition and abstracts from issues of moral hazard, hardly appro-priate when considering modern UK banking. We therefore modify theclassic model to incorporate franchise values due to market power; andrisk-taking by banks with limited liability. We go further to show howthe capacity of franchise values to mitigate risk taking may be under-mined by the bailout option; with explicit analytical results providedfor the case of extreme risk-aversion. After a brief discussion of howthis may impact on the distribution of income, we outline the ways inwhich the Vickers Report seeks to remedy these problems.
∗Acknowledgments: We are grateful for comments received from Ken Binmore, HeraklesPolemarchakis, Thijs van Rens and Michael McMahon, and from those at a Bank ofEngland seminar, in particular Dmitry Kuvshinov and David Miles. Thanks are due toHan Xu and Katie Roberts for research assistance, funded by ESRC CAGE.†University of Warwick, Department of Economics, UK. Email: mar-
[email protected]‡University of Warwick, Department of Economics, UK; and School of Economics,
There are few ways a man may be more innocently employed than ingetting money. Samuel Johnson (1775, letter to his printer)
1 Introduction
This quotation from the illustrious lexicographer was penned shortly beforeAdam Smith published his metaphor of the Invisible Hand. Yet it seemsto express the same sentiment – that the pursuit of profit may be good foreconomic welfare. Adam Smith cited the butcher, the brewer and the bakerto make his point; but should the same logic not apply to the banker? Tojudge from the textbooks, it should.
In the classic paper by Diamond and Dybvig (1983), for example, it isshown how banks can provide liquidity insurance to their customers whileat the same time providing finance for longer term investors; and that themagic of maturity transformation (that raises the expected utility of all itscustomers) can be achieved under a zero profit constraint.1 As Stiglitz (2012)argues forcefully in The Price of Inequality, however, a less benign view ofthe operations of banks is called for in the light of the recent North Atlanticfinancial crisis – involving not only the US and the UK but also Iceland andIreland, countries whose economies were ravaged by losses in banking.
In this spirit, we modify the model of Diamond and Dybvig to includeimperfect competition and excess risk-taking. The monopoly profits impliedby the former can be thought of as the seigniorage collected by private bankswho have the licence to create money; while excess risk-taking is used tosymbolise the problems of moral hazard in an industry where bankers canallocate funds without depositors being aware of what is being done withtheir money.2 An alternative – and less flattering – characterisation of themoral hazard problem is that offered by Gertler et al. (2010) and Gertler andKaradi (2012), where the hidden action taken by bank managers is to divertprofits to their own benefit3.
It has been argued, however, that seigniorage profits may have the ben-eficial side effect of checking moral hazard; that the prospect of losing onesbanking licence will inhibit excess risk-taking by big banks who see them-selves as Too Big To Gamble. This optimistic line of reasoning is, we believe,fatally flawed because it ignores the leverage that large banks can exert on
1It is, of course, subject to the curse of coordination failure (in the form of bank runs);but this can be handled by a Lender of Last Resort or by deposit insurance.
2See Allen and Gale (2007), Chapter 9 for the asset price implications of agency prob-lems of this kind.
3i.e., it is a model of looting to use the terminology of Akerlof and Romer (1993).
2
society to provide bailouts. If the market power that yields seigniorage alsomeans that the bank is Too Big to Fail, then it will exacerbate rather thancuring excess risk-taking4.
The paper proceeds as follows. After a brief review of the high concentra-tion and profitability characteristic of recent UK banking, we use a graphicalexposition of the Diamond-Dybvig model – and a focus on a monopoly bank– to show how restricted competition allows banks to raise profits and col-lect seigniorage, essentially by restricting the supply of money so that themarginal cost matches marginal (not average) revenue. The incentive forrisk-shifting due to limited liability is discussed next; and the impact thatmonopoly profits augmented by risk-taking can have on income inequality isillustrated using Lorenz curves.
Using an example with extremely risk-averse depositors to illustrate thenotion that banks may be Too Big To Gamble5, the incentive to play safeso as to keep ones licence is set against the temptation to take on excessrisk. For the same type of depositors, we then show how bailout prospects(that effectively insure the banking licence) can undermine prudence as banksbecome Too Big To Fail. (Noss and Sowerbutts (2012) have used empiricalmethods to estimate the option value of bailout prospects for UK banks:in the same vein, explicit results for the value of prospective bailout in oursimple model are presented in an Annex.)
We argue heuristically that, when regulatory capital is plotted againstmarket concentration, these contrary effects of market power will producea U-shaped prudential frontier. Finally, this framework is used to appraisethe proposals in the Vickers report (Independent Commission on Banking,2011), designed both to promote competition in British banking and to getthe taxpayer ”off the hook” by reducing risk-taking.
2 Some key features of UK Banking
Historically, UK bank balance-sheets have stood at half one years GDP. Butbanking has grown much faster than GDP in recent times – to about twiceGDP by 1988 and five times by 2008 (Haldane et al., 2010, p.84). The keyplayers are universal banks which combine retail & commercial banking withwholesale & investment activities; and the industry is highly concentrated.
4In 2008, for example, a UK High Street bank tried to buy Lehman Brothers New Yorkbefore bankruptcy (a gamble that was blocked at the last minute by the Chancellor of theExchequer).
5Numerical examples of low and high risk- taking call for regulatory capital require-ments that stand comparison with those proposed by Miles et al. (2012).
3
This is especially true of the retail and commercial sector where the top fivebanks account for almost 85% of current accounts, 82% of residential mort-gages and handle 91% of the customers from Small and Medium Enterprises(Independent Commission on Banking, 2011, p.21-22).
The increase in balance sheets described above was accompanied by adramatic rise in measured value added, especially profits. For 30 years afterWorld War II, financial intermediation had accounted for around 1.5% ofeconomy wide profits on average: but by 2008, its share of profits had risento 15%. Those in the industry argued that this resulted from financial inno-vation and financial engineering; and, since the doubling of leverage from thelate 1990s until just before the crisis was accompanied by a halving of thefraction of risk-weighted assets, it seemed plausible that banks were expand-ing their business and profits without taking excessive risk. But subsequentdevelopments tell a very different story. As Vickers (2011, p.2) remarked:“One of the roles of financial institutions and markets is efficiently to man-age risks. Their failure to do so - and indeed to amplify rather than absorbshocks from the economy at large - has been spectacular.” Two insolventUK mortgage banks had to be nationalised; and two universal banks werebailed-out with taxpayers money. Capital support provided by the Treasurytotalled £70b (5% of GDP) by the end of 2009; and these operations wereaccompanied by Quantitative Easing (bond purchases) to the tune of £200b(14% of GDP) by the Bank of England. Adding in other measures, such asguarantees and collateral swaps, Alessandri and Haldane (2009, p.24) calcu-late that total emergency financial support provided by the Central Bankand the Treasury amounted to almost three quarters of one years GDP!
3 Adding Seigniorage and Gambling to a Clas-
sic Model of Banking
The classic model of banking, Diamond and Dybvig (1983), focuses on theefficiency of banks in providing liquidity insurance to customers. In its basicform, as presented in Allen and Gale (2007, Chpater 3) for example, banksare assumed to be perfectly competitive and free of moral hazard problems.This is where we start, before looking at the profits that may be collected bya monopoly bank. (By analogy with the seigniorage that the state derivesfrom its monopoly in supplying notes and coin, this revenue flow will bereferred to as private seigniorage.)
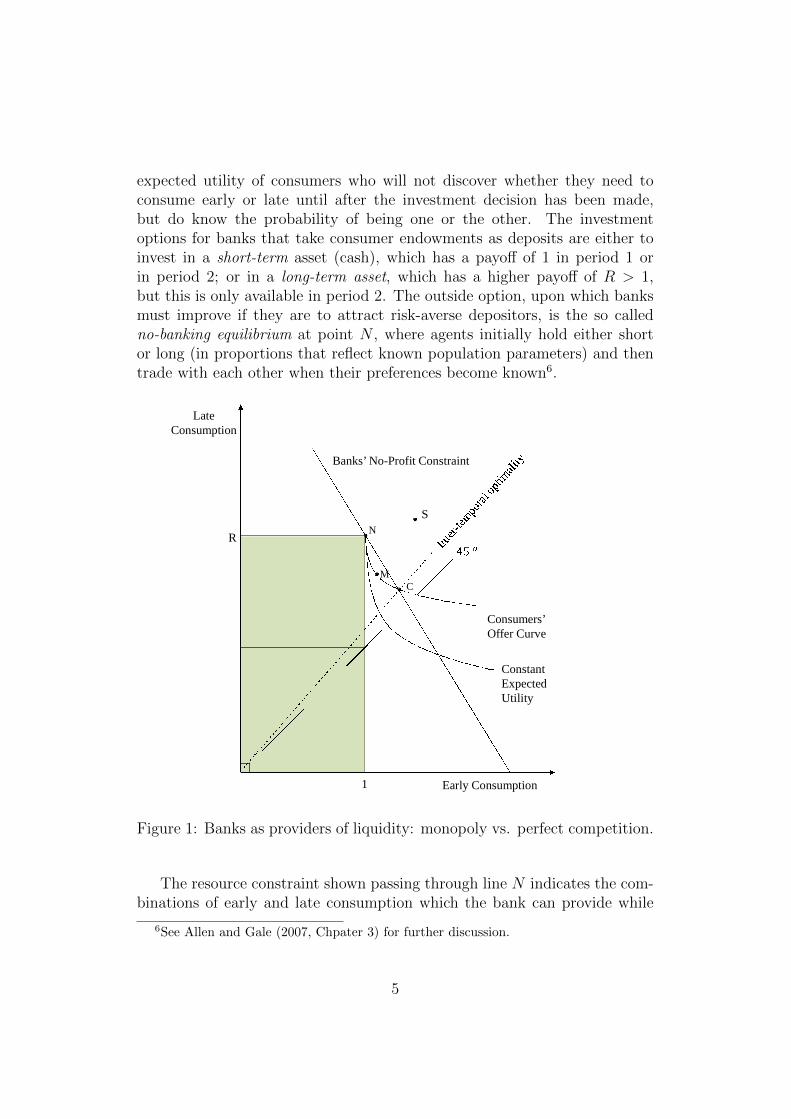
For convenience we proceed diagrammatically, using Figure 1 where theaxes measure early and late consumption. The indifference curve shows the
4
expected utility of consumers who will not discover whether they need toconsume early or late until after the investment decision has been made,but do know the probability of being one or the other. The investmentoptions for banks that take consumer endowments as deposits are either toinvest in a short-term asset (cash), which has a payoff of 1 in period 1 orin period 2; or in a long-term asset, which has a higher payoff of R > 1,but this is only available in period 2. The outside option, upon which banksmust improve if they are to attract risk-averse depositors, is the so calledno-banking equilibrium at point N , where agents initially hold either shortor long (in proportions that reflect known population parameters) and thentrade with each other when their preferences become known6.
M
N
C
Early Consumption
Consumers’Offer Curve
LateConsumption
R
1
ConstantExpectedUtility
Banks’ No-Profit Constraint
S
Figure 1: Banks as providers of liquidity: monopoly vs. perfect competition.
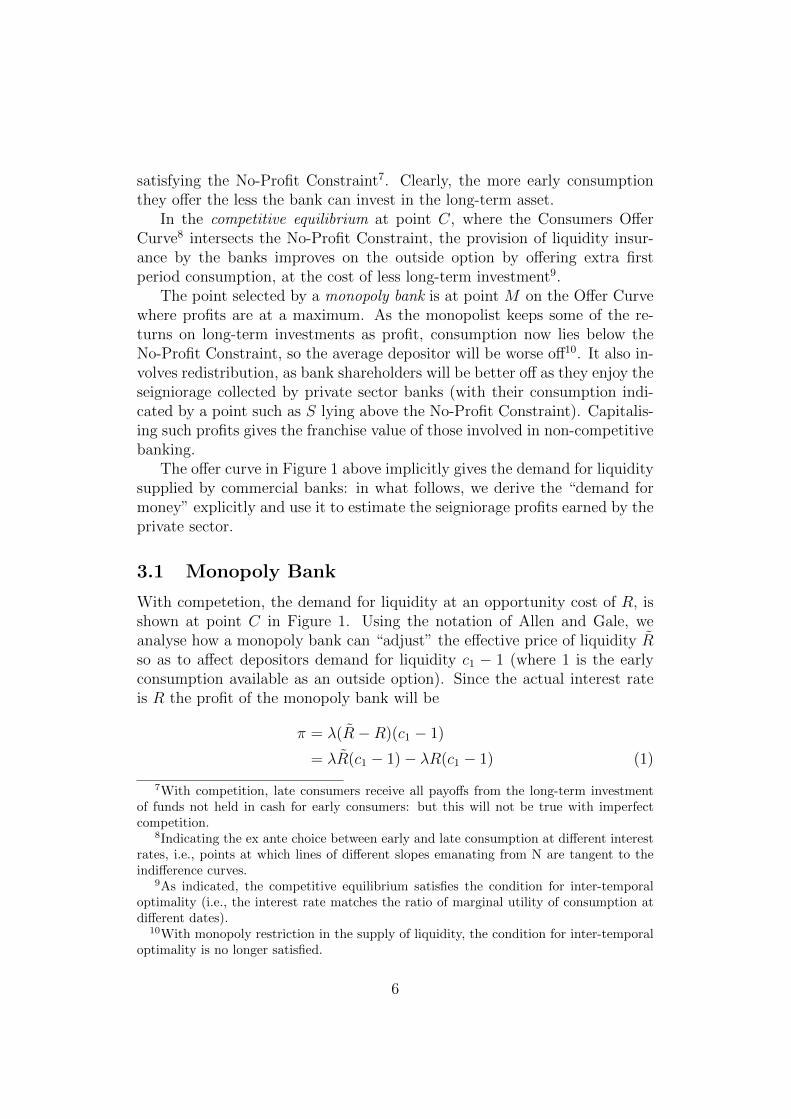
The resource constraint shown passing through line N indicates the com-binations of early and late consumption which the bank can provide while
6See Allen and Gale (2007, Chpater 3) for further discussion.
5
satisfying the No-Profit Constraint7. Clearly, the more early consumptionthey offer the less the bank can invest in the long-term asset.
In the competitive equilibrium at point C, where the Consumers OfferCurve8 intersects the No-Profit Constraint, the provision of liquidity insur-ance by the banks improves on the outside option by offering extra firstperiod consumption, at the cost of less long-term investment9.
The point selected by a monopoly bank is at point M on the Offer Curvewhere profits are at a maximum. As the monopolist keeps some of the re-turns on long-term investments as profit, consumption now lies below theNo-Profit Constraint, so the average depositor will be worse off10. It also in-volves redistribution, as bank shareholders will be better off as they enjoy theseigniorage collected by private sector banks (with their consumption indi-cated by a point such as S lying above the No-Profit Constraint). Capitalis-ing such profits gives the franchise value of those involved in non-competitivebanking.
The offer curve in Figure 1 above implicitly gives the demand for liquiditysupplied by commercial banks: in what follows, we derive the “demand formoney” explicitly and use it to estimate the seigniorage profits earned by theprivate sector.
3.1 Monopoly Bank
With competetion, the demand for liquidity at an opportunity cost of R, isshown at point C in Figure 1. Using the notation of Allen and Gale, weanalyse how a monopoly bank can “adjust” the effective price of liquidity Rso as to affect depositors demand for liquidity c1 − 1 (where 1 is the earlyconsumption available as an outside option). Since the actual interest rateis R the profit of the monopoly bank will be
π = λ(R−R)(c1 − 1)
= λR(c1 − 1)− λR(c1 − 1) (1)
7With competition, late consumers receive all payoffs from the long-term investmentof funds not held in cash for early consumers: but this will not be true with imperfectcompetition.
8Indicating the ex ante choice between early and late consumption at different interestrates, i.e., points at which lines of different slopes emanating from N are tangent to theindifference curves.
9As indicated, the competitive equilibrium satisfies the condition for inter-temporaloptimality (i.e., the interest rate matches the ratio of marginal utility of consumption atdifferent dates).
10With monopoly restriction in the supply of liquidity, the condition for inter-temporaloptimality is no longer satisfied.
6
where the first term indicates the revenue to the bank obtained by raisingthe “price” to R, and the second indicates the cost of holding cash reservesto meet the requirements for early consumers.
Assuming CRRA utility with risk aversion γ > 1, the demand functionof depositors can be written as
c1 − 1 =R− R1/γ
R1/γ + λR/(1− λ)≡ f(R), R ≤ R ≤ Rγ. (2)
Given R ≤ R ≤ Rγ, the demand function is downward-sloping in R, i.e.,f ′(R) < 0.
The liquidity demand under perfect competition is the when the price ofliquidity is equal to the marginal cost R = R, i.e.,
cc1 − 1 =R− R1/γ
R1/γ + λR/(1− λ). (3)
What if the supply is restricted under conditions of imperfect competi-tion? Consider specifically the case of a monopolist who rations the quantityof liquidity so as to maximise profits, i.e., maximises (1) subject to (2). Thisyields the first order condition (FOC)
λ[(R−R) + (c1 − 1)(∂R/∂c1)] = 0.
Hence we may write
R−R + (c1 − 1)/f ′(R) = 0, (4)
where the second term in (4) reflects the fact that the bank takes into accountthat price adjustment can affect demand for liquidity.
Replacing c1 − 1 in (4), using (2), one has
R−R + f(R)/f ′(R) = 0. (5)
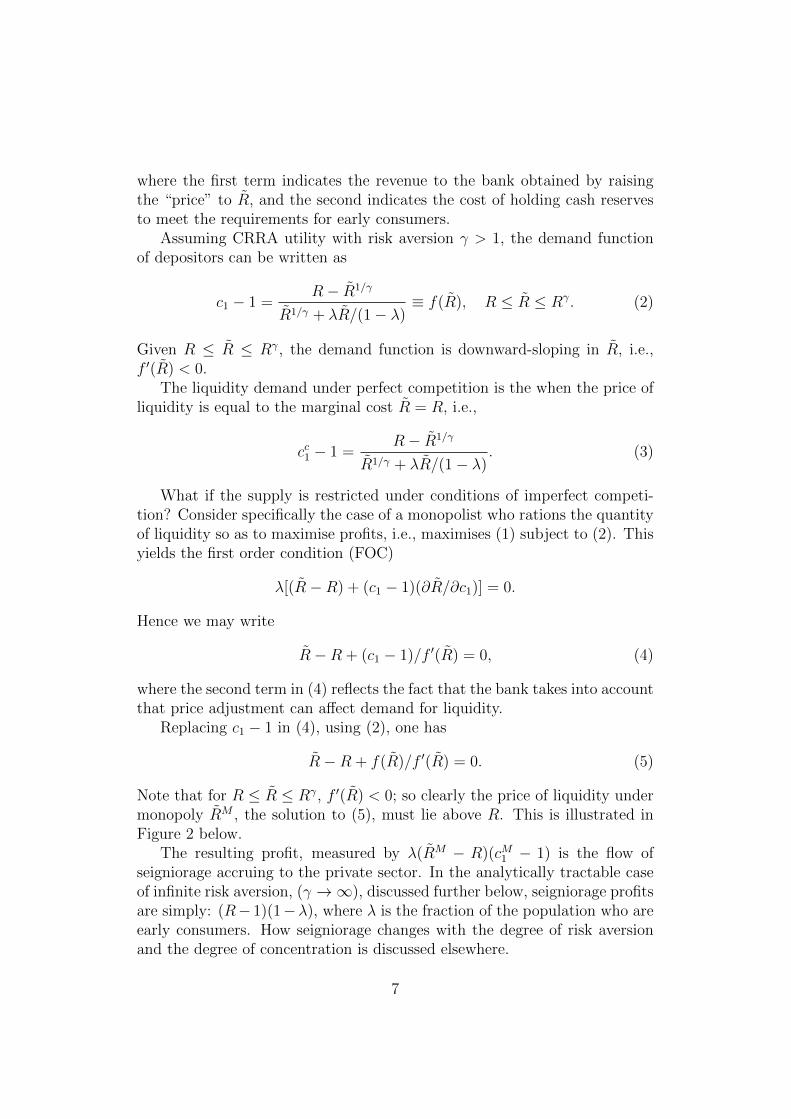
Note that for R ≤ R ≤ Rγ, f ′(R) < 0; so clearly the price of liquidity undermonopoly RM , the solution to (5), must lie above R. This is illustrated inFigure 2 below.
The resulting profit, measured by λ(RM − R)(cM1 − 1) is the flow ofseigniorage accruing to the private sector. In the analytically tractable caseof infinite risk aversion, (γ →∞), discussed further below, seigniorage profitsare simply: (R− 1)(1−λ), where λ is the fraction of the population who areearly consumers. How seigniorage changes with the degree of risk aversionand the degree of concentration is discussed elsewhere.
7
Figure 2: The demand for money and the flow of private seigniorage.
How, with oligopoly, equilibrium will lie between C and M in Figure 2is discussed in detail in Miller et al. (2013). It is easy to see, however,that increasing the number of banks will take equilibrium from monopoly tocompetition.
In the Cournot-Nash equilibrium with two banks, with each maximisingits profits conditional on the supply of the other, the supply of liquidity willexpand beyond that of the monopolist, as suggested in Figure 3.
4 Bank profits: productivity miracle or mi-
rage?
Of the extraordinary expansion of US banking in the lead-up to the financialcrisis, Reinhart and Rogoff (2009, p.210) remarked:
The size of the US financial sector more than doubled, from anaverage of 4% of GDP in the mid-1970s to almost 8% of GDP by2007 Leaders in the financial sector argued that in fact their highreturns were the result of innovation and genuine value-added
8
ଵ− 1
Demand
Marginal revenue
෨
Marginal cost
ଵ − 1
Figure 3: Seigniorage flow with duopoly.
products, and they tended to grossly understate the latent riskstheir firms were undertaking.
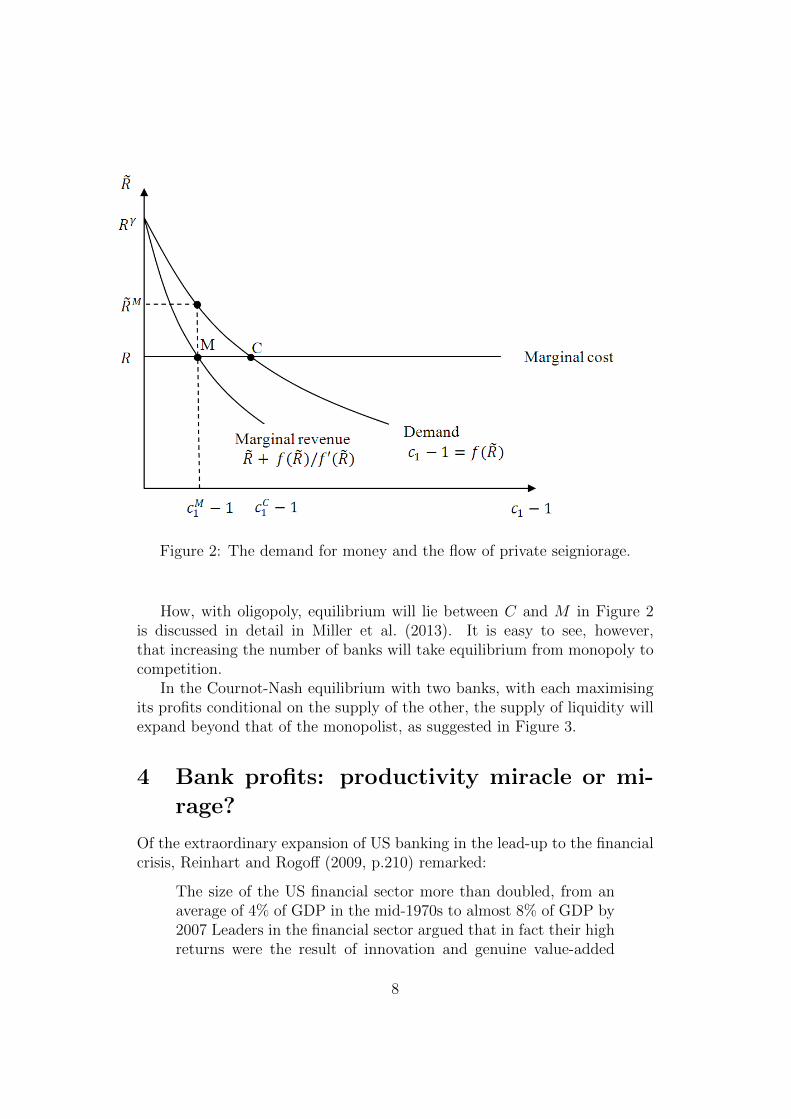
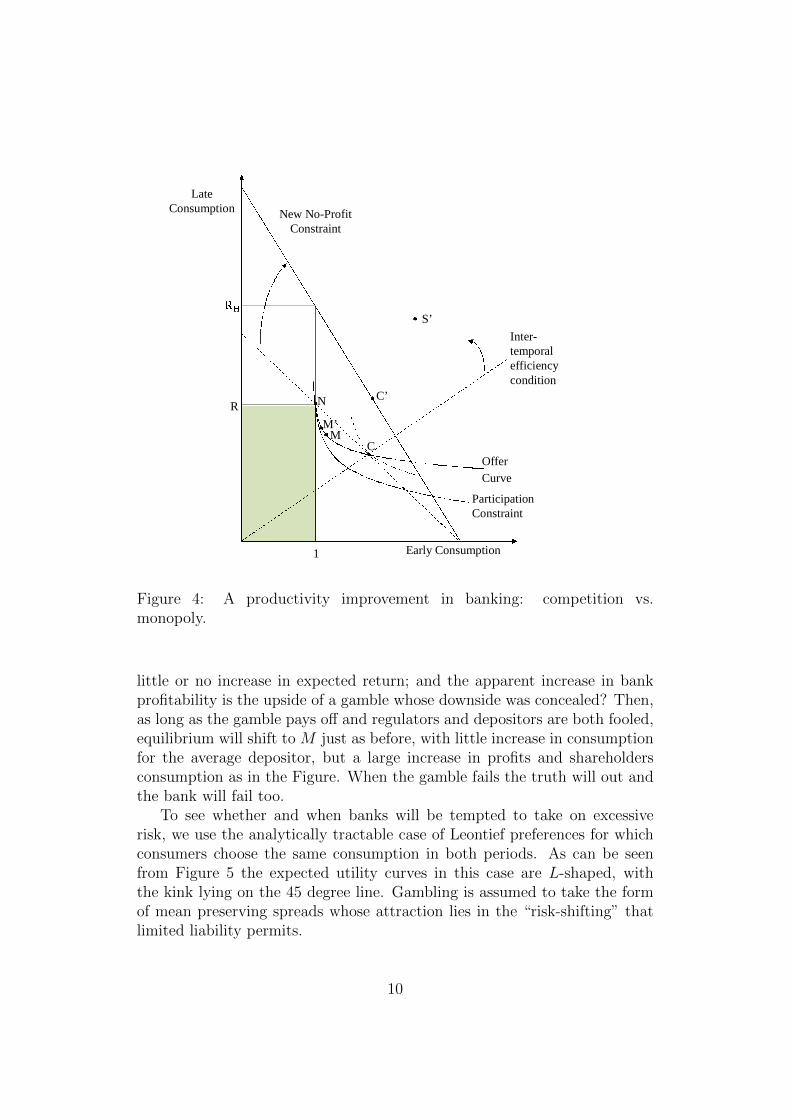
This parallels closely what we have reported above for the UK. But, be-fore looking at the profits that might be expected to arise from excessiverisk-taking (given limited liability), consider first the case of a genuine im-provement in the return to long term investment available only to banks –a productivity miracle that raises the return available to banks – but notoutsiders – from R to RH .
How this affects profits and liquidity provision is indicated in Figure 4,where the No-Profit Constraint swivels clockwise, but the Intertemporal Op-timisation schedule swivels the other way. As a consequence, the competi-tive bank equilibrium shifts from C to C ′, with no increase in profits. Withmonopoly banking, however, consumers gain much less. Since the productiv-ity gain is, by assumption, not available outside banking, there is no changein the outside option, so equilibrium moves from M to M ′ along the existingoffer curve. Profits will increase greatly.
So far so good: but what if the so-called productivity increase is a mirage?What if – along the lines suggested by Reinhart and Rogoff – there was
9
LateConsumption
Early Consumption
N
MM’
C
New No-ProfitConstraint
Inter-temporalefficiencycondition
Offer
Curve
1
R
ParticipationConstraint
C’
S’
Figure 4: A productivity improvement in banking: competition vs.monopoly.
little or no increase in expected return; and the apparent increase in bankprofitability is the upside of a gamble whose downside was concealed? Then,as long as the gamble pays off and regulators and depositors are both fooled,equilibrium will shift to M just as before, with little increase in consumptionfor the average depositor, but a large increase in profits and shareholdersconsumption as in the Figure. When the gamble fails the truth will out andthe bank will fail too.
To see whether and when banks will be tempted to take on excessiverisk, we use the analytically tractable case of Leontief preferences for whichconsumers choose the same consumption in both periods. As can be seenfrom Figure 5 the expected utility curves in this case are L-shaped, withthe kink lying on the 45 degree line. Gambling is assumed to take the formof mean preserving spreads whose attraction lies in the “risk-shifting” thatlimited liability permits.
10
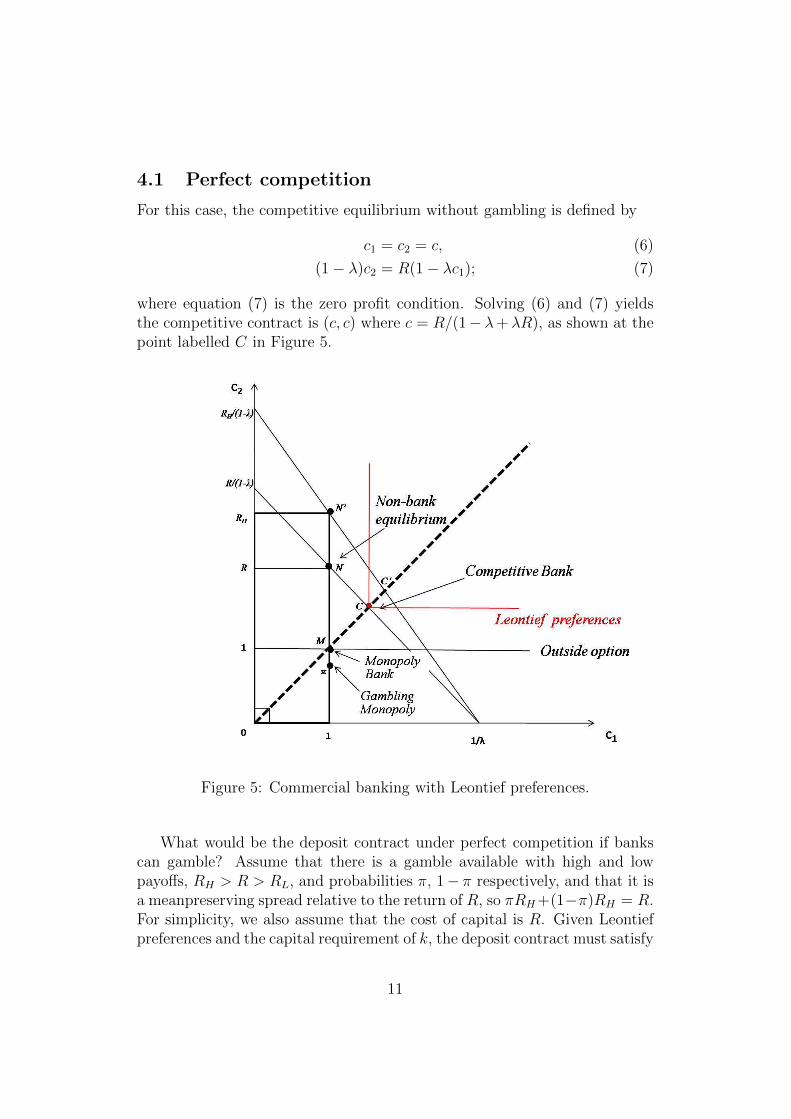
4.1 Perfect competition
For this case, the competitive equilibrium without gambling is defined by
c1 = c2 = c, (6)
(1− λ)c2 = R(1− λc1); (7)
where equation (7) is the zero profit condition. Solving (6) and (7) yieldsthe competitive contract is (c, c) where c = R/(1− λ+ λR), as shown at thepoint labelled C in Figure 5.
Figure 5: Commercial banking with Leontief preferences.
What would be the deposit contract under perfect competition if bankscan gamble? Assume that there is a gamble available with high and lowpayoffs, RH > R > RL, and probabilities π, 1− π respectively, and that it isa meanpreserving spread relative to the return of R, so πRH+(1−π)RH = R.For simplicity, we also assume that the cost of capital is R. Given Leontiefpreferences and the capital requirement of k, the deposit contract must satisfy
where the first term on the LHS of (8) represents expected payoff to the bankin the high state and the second term reflects limited liability, i.e., in the badstate, the bank loses at most its capital.
Solving for the deposit contract using (6) and (8) yields
cG = [RH + (RH −R/π)k]/(1− λ+ λRH). (9)
To avoid gambling under perfect competition, one has to choose k such thatc ≥ cG. This implies the critical capital requirement of
kC =π(1− λ)(RH −R)
(R− πRH)(1− λ+ λR). (10)
4.2 Monopoly
A monopolist will maximise profits by increasing the cost of liquidity suppliedto its customers. In the case of extreme risk aversion where long returns areR, profits will be at a maximum at the point shown as M , where the secondperiod consumption is reduced to 1 and the consumer is no better off thanin the non-bank equilibrium, shown at point N .
How much seigniorage will the monopoly bank collect? Monopoly profitsmeasured at date 2 defined as: ΠM ≡ R(1 − λc1) − (1 − λ)c2. So giventhe contract of (cm, cm) where cm = 1, we can write the flow of seigniorageaccruing to the bank as
ΠM = (1− λ)(R− 1). (11)
When this is capitalised at a discount rate of δ, this provides the franchisevalue of the monopoly bank, namely
V ≡ ΠM
1− δ=
(1− λ)(R− 1)
1− δ. (12)
What if the monopolist can increase profits by risk taking? With themonopoly contract of (1,1) as before, the expected monopoly profit (mea-sured at date 2) will be:
ΠG ≡ π[(1− λc1)RH − (1− λ)c2] + (1− π) · 0
soΠG = π(1− λ)(RH − 1). (13)
12
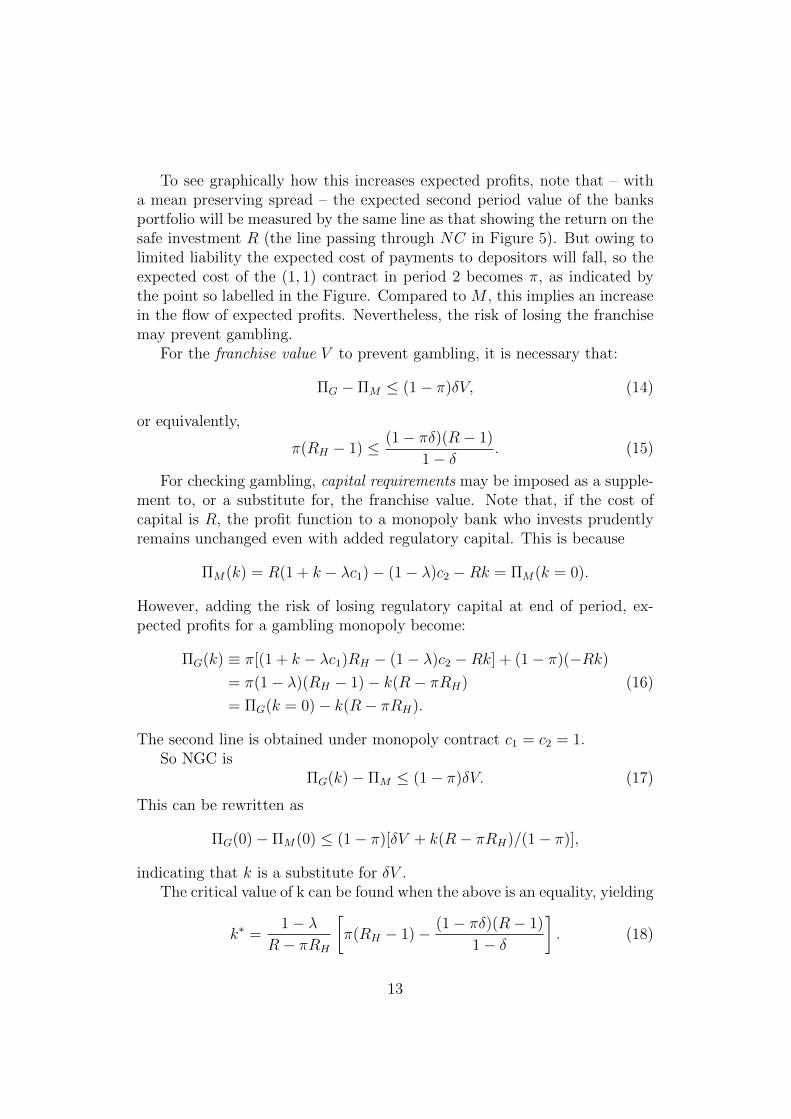
To see graphically how this increases expected profits, note that – witha mean preserving spread – the expected second period value of the banksportfolio will be measured by the same line as that showing the return on thesafe investment R (the line passing through NC in Figure 5). But owing tolimited liability the expected cost of payments to depositors will fall, so theexpected cost of the (1, 1) contract in period 2 becomes π, as indicated bythe point so labelled in the Figure. Compared to M , this implies an increasein the flow of expected profits. Nevertheless, the risk of losing the franchisemay prevent gambling.
For the franchise value V to prevent gambling, it is necessary that:
ΠG − ΠM ≤ (1− π)δV, (14)
or equivalently,
π(RH − 1) ≤ (1− πδ)(R− 1)
1− δ. (15)
For checking gambling, capital requirements may be imposed as a supple-ment to, or a substitute for, the franchise value. Note that, if the cost ofcapital is R, the profit function to a monopoly bank who invests prudentlyremains unchanged even with added regulatory capital. This is because
ΠM(k) = R(1 + k − λc1)− (1− λ)c2 −Rk = ΠM(k = 0).
However, adding the risk of losing regulatory capital at end of period, ex-pected profits for a gambling monopoly become:
The second line is obtained under monopoly contract c1 = c2 = 1.So NGC is
ΠG(k)− ΠM ≤ (1− π)δV. (17)
This can be rewritten as
ΠG(0)− ΠM(0) ≤ (1− π)[δV + k(R− πRH)/(1− π)],
indicating that k is a substitute for δV .The critical value of k can be found when the above is an equality, yielding
k∗ =1− λ
R− πRH
[π(RH − 1)− (1− πδ)(R− 1)
1− δ
]. (18)
13
4.3 Monopoly with Bailout prospect
A monopoly bank may well be able to count on a bailout by the authorities,where the bank loses its regulatory capital but retains its franchise. Let theprobability of such a bailout be denoted as β, where β can range from 0 to1. For the discounted franchise value δV to prevent gambling it is necessarythat:
ΠG(k)− ΠM ≤ (1− π)(1− β)δV. (19)
Note that a greater prospect of bailout calls for higher k. When β = 0, theabove NGC reverts to that without bailout. When β = 1, the critical levelof capital requirements becomes
k∗B =1− λ
R− πRH
[π(RH − 1)− (R− 1)] > k∗. (20)
Similar calculations may of course be repeated for oligopoly cases.In the Table that follows, franchise values, etc. are computed for gambles
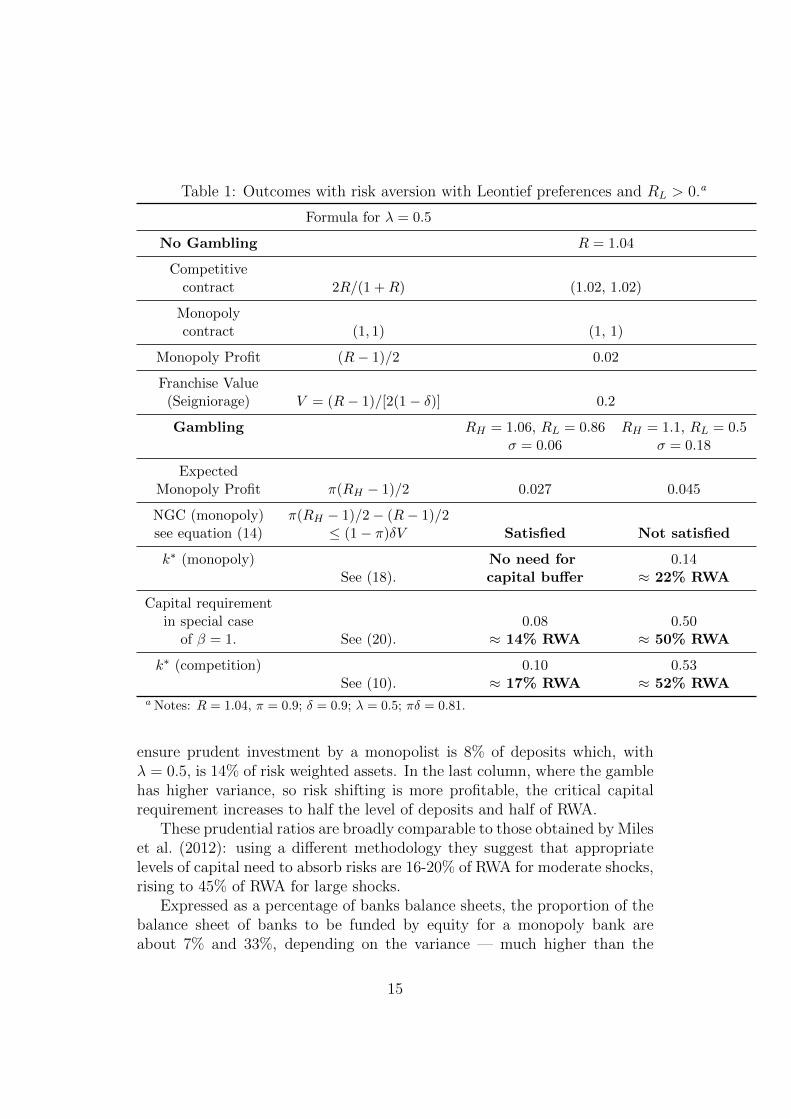
involving “tail risk” as discussed in Foster and Young (2010). For the twopoint process being considered π ≥ 0.9 is sufficient for tail risk; and we setthat π = 0.9. In both cases the gambles have an expected return equal tothe safe rate which is set at 1.04, as in Foster and Young (2010). But wedepart from their assumption that the downside is zero. As the upside inthe first case we consider is 1.06 and in the second 1.10, so for a probabilityπ = 0.9 the downside returns are 0.86 and 0.50 respectively. For convenience,we assume that λ = 0.5 and the appropriate formulae are given in column 2.The numerical results are shown in columns 3 and 4 of the table.
It may be interesting to start by considering the incentives for gamblingby competitive banks and the capital requirements needed to check them, seeKuvshinov (2011) for such calculations in respect of the model of Hellmannet al. (2000). Without regulation, free competitive banking would result incontracts which mimic those available to alpha investors who can obtainRH
for sure, namely 2RH/(RH + 1), instead of2R/(1 +R). If such gambling is tobe checked, the attractive offers that gambling permits, see (8) above, need tobe brought down to what prudent investment allows by capital requirementsset at the level as indicated earlier in equation (10). The numerical resultsfor low and higher variance gambles shown in the bottom line of the Tableare capital ratios of 10% or 53% of deposits respectively, which, with λ = 0.5correspond to ratios of 17% and 52% of RWA respectively.
Notice that, for the parameters we use, the critical capital requirementsfor monopoly with bailout (k∗B) are only a little smaller than those for com-petitive banks (kC) - compare the last two rows of the Table. Thus for thelow variance gamble in the third column, the capital requirement needed to
14
Table 1: Outcomes with risk aversion with Leontief preferences and RL > 0.a
Formula for λ = 0.5
No Gambling R = 1.04
Competitivecontract 2R/(1 +R) (1.02, 1.02)
Monopolycontract (1, 1) (1, 1)
Monopoly Profit (R− 1)/2 0.02
Franchise Value(Seigniorage) V = (R− 1)/[2(1− δ)] 0.2
a Notes: R = 1.04, π = 0.9; δ = 0.9; λ = 0.5; πδ = 0.81.
ensure prudent investment by a monopolist is 8% of deposits which, withλ = 0.5, is 14% of risk weighted assets. In the last column, where the gamblehas higher variance, so risk shifting is more profitable, the critical capitalrequirement increases to half the level of deposits and half of RWA.
These prudential ratios are broadly comparable to those obtained by Mileset al. (2012): using a different methodology they suggest that appropriatelevels of capital need to absorb risks are 16-20% of RWA for moderate shocks,rising to 45% of RWA for large shocks.
Expressed as a percentage of banks balance sheets, the proportion of thebalance sheet of banks to be funded by equity for a monopoly bank areabout 7% and 33%, depending on the variance — much higher than the
15
4% suggested by the ICB and a fortiori the 3% by the Basel Committee onbank supervision. Our results are more in line with the recommendations ofAdmati and Hellwig (2013): they want to cut bank leverage down to singlefigures with an equity ratio of 20-30%.
5 Gambling and Gini Coefficient
In the Price of Inequality, Stiglitz emphasises how rent-seeking in the finan-cial sector has skewed the income distribution to the benefit of high earn-ers. In the model being used here, it is evident that bank concentrationwill lead to an increase in the Gini coefficient compared with competitivebanking: and this effect will become much more pronounced with gambling.This is illustrated by the stylised Lorenz curves in Figure 6, where σ repre-sents the fraction of the population owning shares in the all-deposit bank.11
Where ω represents the consumption bundle available to depositors undermonopoly banking, and ω(1 + µ) is the consumption available to the deposi-tors who are also shareholders enjoying the monopoly premium, µ, in this caseω = 1/(1+σµ) and the Gini coefficient12 turns out to be (1−σ)σµ/(1+σµ).When the bank gambles, the premium paid to owner-managers will of courserise, say to µ, shifting the Lorenz curve to ˜OLP in the figure.
In discussing whether the contribution of financial sector is Miracle orMirage, Haldane et al. (2010, p.79-80) report that the share of financialintermediation in employment in UK is around 4%, and that:
the measured productivity miracle in finance has been reflectedin the returns to both labour and capital, if not in the quantityof these factors employed. For labour, financial intermediation isat the top of the table, with the weekly earnings roughly doublethe whole economy median. This differential widened during thiscentury, roughly mirroring the accumulation of leverage withinthe financial sector.
Using the above formula, a doubling of consumption opportunities forthose in finance would add about 4% to the Gini coefficient, i.e. abouthalf the rise in Gini coefficient for the UK from 1986 when the Big Bangtook place, to just before the crisis in 2007. (Focusing more narrowly onInvestment Banking, however, the Financial Times reports compensationrunning at 6 times the median income in both US and UK.13)
11See Miller et al. (2011) for details.12i.e., the area OLP divided by O1P in the diagram.13FT 17th, 2011, Feb Bankers pay: time for deep cuts.
16
Figure 6: Rising incomes in financial services and income inequality.
6 Bailouts, Moral Hazard and Crisis
Hellmann et al. (2000) discuss how the loss of franchise, like the loss of reg-ulatory capital, may inhibit the incentive to gamble. In their case, franchisevalues were generated by the regulator fixing a ceiling on deposit rates, butwhat if franchise values derive from concentration in the banking industry, asis being assumed here? If the authorities are in fact willing to bailout largebanks, this will pose a serious problem of moral hazard as high franchisevalues will effectively be insured by official action.
This problem has been analysed above by comparing competition andmonopoly where it is assumed, as a special case, that the monopolist is sureto be bailed out — is definitely “Too Big To Fail” (TBTF). The interestingresult obtained was that regulatory capital required to check gambling wasnot too different for these polar extremes of concentration. If we assumethat the willingness of the authorities to bailout banks only kicks in abovea certain level of concentration, then franchise values will work to reducegambling below this level, but moral hazard will act the other way abovethis level.
17
6.1 The U-shaped Prudential Frontier
How the concentration of market power and seigniorage profits in bankingmay at first mitigate moral hazard — and then promote it, as banks becomeTBTF — is shown in Figure 7, with regulatory capital plotted on the verticalaxis and concentration on the horizontal (measured by the reciprocal of thenumber of banks).
B
Regulatory
Capital, %
Concentration, 1/N
L
UK
k0
M
Gambling
Crisis
Zone a b
R
Prudent Banking
Figure 7: TBTG, TBTF and the U -shaped region of prudent banking.
For a given low-variance risky investment prospect, the region of pruden-tial banking, where regulatory capital and/or franchise values are sufficientto prevent gambling, is defined by the U -shaped curve LBR. The section LBof the no-gambling boundary shows how franchise values may substitute forregulatory capital so long as there is no prospect of a bailout. But as bailoutsbecome increasingly likely when concentration increases beyond point M , theincentive to gamble changes the curvature of the boundary beyond B.
To see why the NGC is U -shaped, consider the incentive effects of in-creased concentration at a given degree of leverage, i.e., by moving from leftto right along the dotted line in the Figure. It is evident that the capitalrequirement, k0, is insufficient to check risk-shifting for perfectly competitive
18
banks protected by limited liability; but as the level of concentration increases(and franchise values grow to absorb more losses), prudent behaviour will beobserved at point a in the Figure as banks become TBTG. With bailoutsincreasingly likely for very large banks, however, the government effectivelybegins to insure banks against loss of franchise as concentration moves be-yond point b. (For a monopoly bank, indeed, there is no risk of losing itsfranchise). At some point therefore, the incentive effects of franchise valuewill be overwhelmed by the temptation to gamble by banks that are TBTF;who are motivated to take on excessive risk.
6.2 The Crisis Zone
If the U -shaped NGC actually matched the gambles in prospect, and the UKbanking industry lies above it, as indicated in the Figure, there should beno crisis. As in Hellmann et al. (2000), the regulatory regime will be so de-signed that gambling is not incentive compatible in this rational expectationsequilibrium.
What if banks are able to take much higher risks unknown to the regula-tor? In that case, the U -shaped NGC will shift upwards, as indicated by thedotted schedule, leaving UK banking system in the area labelled Crisis Zone,where the expectations of the regulators are inconsistent with the activitiesof banks. Innovation which allows banks to mimic high returns temporarilyby financial engineering is not sustainable in the long run, however, as Fosterand Young point out; and crisis will occur as a tail risk phenomenon. Withexpectations lagging behind the reality, the regulators are in line for a nastyshock.
If - thanks to rapid financial innovation - the banking system is in thecrisis zone and the relevant authorities are unaware of the excessive risksbeing taken, this could be characterised as regulatory failure. Given limitedliability, there are definite incentives for risk-taking (so investors keep theupside of gambles but walk away from the downside); and we see it ratheras a problem of moral hazard. With bailouts, moreover, these incentivesare greatly strengthened: banks that would have behave prudently, despitefree access to risky investments, will be tempted to take risks if bailouts areexpected - a classic example where insurance against failure leads to hiddenactions that makes failure more likely.
How is this moral hazard to be checked, while avoiding negative exter-nalitieis of banking collapse? In the next section, we discuss how the Vickersreport seeks to ensure that the banking system no longer lies in such a crisisregion.
19
7 Regulatory Reform in the UK: the Vickers
report
On options for reform, consider the 2011 report by the Independent Com-mission on Banking (ICB) chaired by Sir John Vickers.
To change the strategic relation between the state and banks, the threatof severe externalities triggered by unpremeditated bank closure must bethwarted. For retail banks, the means to this end recommended in the Re-port effectively include (a) improved ex ante monitoring of risk-taking; (b) agreat reduction of risks that may be taken; (c) substantially increased loss-absorbing capacity on the part of the bank to cover what risk remains; and,additionally, (d) better resolution procedures should a retail bank need to bereconstituted.
In more detail, the key thing to note is that the report recommendschanges in market structure as well as balance sheet restrictions. In partic-ular, structural separation is recommended in the form of a retail ring-fencedesigned to isolate and contain banking activities vital to the economy soas to ensure they can be maintained in the event of bank failure withoutgovernment solvency support. Hence, ring-fenced banks would be restrictedto taking retail deposits, providing payments services and supplying creditto households and businesses14, i.e., they would be constrained to abide bywhat Adam Smith would think of as the “principles of the banking trade”!
Ring-fenced banks will in fact be banned from a very considerable rangeof the activities currently conducted by universal banks15. This is not thecomplete separation mandated by the Glass-Steagall Act in the USA, how-ever, as banks inside the fence can stay linked with those outside, subjectto arms length dealing and other restrictions. In addition steps are recom-mended to increase competition on the High Street - more transparency ofcosts and transferability of accounts, in particular.
Balance sheet requirements involve substantial loss-absorbing capacity inthe form of equity and convertible bonds so as to avoid claims on the taxpayerfollowing bank insolvency.
As regards monitoring and transparency, ring-fenced banks would be morestraightforward than some existing banking structures and thus easier tomanage, monitor and regulate.
Heuristically, these recommendations can be shown as in Figure 8, which
14ICB (2011, para. 3.1)15Depending on how the liabilities to large corporations are taken inside the fence, the
ring fence might include between a sixth and a third of the total assets of the UK bankingsector of over 6 trillion (relative to GDP of £1.4 trillion).
20
refers only to banks within the ring-fence. Some of the measures shouldact to expand the region of Prudential Banking (beyond that in the earlierFigure 7, indicated here by the dashed U-shape); others to shift the locus ofa ring-fenced bank into this enlarged area.
Regulatory
Capital
PrudentBanking
Concentration
L′L′
R′
Higher capital
requirements
and more
competition
Reducedincentive
to Bailout
Risk Prohibition& Monitoring
LL
R
Figure 8: Checking risk-taking in ring-fenced banks.
The prohibition of many risky assets - two thirds of the current portfolioof UK banks, in fact - should move the U -curve downwards, as indicated bythe shift from L to L in the No Gambling frontier. Improved monitoring –backed by a threat of losing ones licence if caught - should further reduce theregion of excess risk by making the frontier slope down more steeply from L.Steps to move ring-fenced banks towards Prudential Banking include both adecisive increase in the level of capital required for the operation of a ring-fenced bank and steps to increase competition among High Street banks, asindicated by the arrow pointing NW in the Figure.
The effect of the planned reforms would be to:
put the UK banking system of 2019 on an altogether differentbasis from that of 2007. In many respects, however, it would berestorative of what went before in the recent past better cap-
21
italised, less leveraged banking more focussed on the needs ofsavers and borrowers in the domestic economy. ICB (2011, p.18)
Although the government plans to implement the principal recommen-dations of the Report, there is considerable lobbying pressure to allow forrisk-taking inside the fence, with retail banks providing simple derivatives,for example. If permitted, this will surely undermine the principles of struc-tural separation, Wolf (2012). It has been argued by the Parliamentary Com-mission on Banking Standards (2012) that the threat of Glass-Steagall, i.e.,complete separation between investing and commercial banking16, should beheld as a sword of Damocles above the banks to ensure implementation.
8 Conclusion: back to banking basics?
Adam Smith himself would surely have been disturbed by recent develop-ments in British banking. His concern over the tendency of businesses to col-lude and appropriate consumer surplus by monopoly pricing is well known.And as for risk-taking, he warned in the Wealth of Nations that:
To depart on any occasion from [the principles of the bankingtrade], in consequence of some flattering speculation of extraor-dinary gain, is almost always extremely dangerous and frequentlyfatal to the banking company which attempts it. (Book V, Ch 1,Article 1.)
Banking in Britain before the crisis was alas! no example of the benignoperation of the invisible hand at work. The reforms advocated by the ICB intheir Final Report are however designed to offset these distorted incentives.If they succeed in eliminating the features that we have added to capturecurrent distortions, then the basic model could be back in business!
16What the Commission refers to as an electrified ring-fence!
22
References
Admati, A. and Hellwig, M. (2013). The Banker’s New Clothes: What’sWrong with Banking and What to Do About It, Princeton NJ: PrincetonUniversity Press.
Akerlof, G. and Romer, P. (1993). Looting: The economic underworld ofbankruptcy for profit, Brookings Papers on Economic Activity 24(2): 1–74.
Alessandri, P. and Haldane, A. (2009). Banking on the state.URL: http://www.bankofengland.co.uk/publications/speeches/2009/speech409.pdf
Allen, F. and Gale, D. (2007). Understanding Financial Crises, New York:Oxford University Press.
Diamond, D. and Dybvig, P. (1983). Bank runs, deposit insurance, andliquidity, Journal of Political Economy 91(3): 401–419.
Foster, D. P. and Young, P. (2010). Gaming performance fees by portfoliomanagers, The Quarterly Journal of Economics 125(4): 1435–1458.
Gertler, M. and Karadi, P. (2012). QE 1 vs. 2 vs. 3...a framework for analyz-ing large scale asset purchases as a monetary policy tool, Central Banking:Before, During and After the Crisis.
Gertler, M., Kiyotaki, N. and Queralto, A. (2010). Financial crises, bankrisk exposure and government financial policy.URL: http://www.princeton.edu/∼kiyotaki/papers/GertlerKiyotakiQueraltoJune7wp.pdf
Haldane, A., Brennan, S. and Madouros, V. (2010). What is the Contributionof the Financial Sector: Miracle or Mirage? in The Future of Finance: theLSE report, London: LSE., chapter 2, pp. 87–120.
Hellmann, T. F., Murdock, K. C. and Stiglitz, J. E. (2000). Liberalization,moral hazard in banking, and prudential regulation: Are capital require-ments enough?, American Economic Review 90(1): 147–165.
Independent Commission on Banking (2011). Final report: Recommenda-tions.
Kuvshinov, D. (2011). The optimal capital requirement for uk banks: a moralhazard perspective, Master’s thesis, University of Warwick. MSc Disserta-tion, Department of Economics, University of Warwick.
23
Miles, D., Yang, J. and Marcheggiano, G. (2012). Optimal bank capital,Economic Journal Early view: June.
Miller, M., Zhang, L. and Li, H. (2011). When bigger isn’t better: bailoutsand bank behaviour, CEPR Discussion Papers No. 8602 (September).CEPR, London.
Miller, M., Zhang, L. and Li, H. (2013). When bigger isn’t better: bailoutsand bank behaviour, Oxford Economic Papers forthcoming.
Noss, J. and Sowerbutts, R. (2012). The implicit subsidy of banks.URL: http://www.bankofengland.co.uk/publications/Documents/fsr/fs paper15.pdf
Parliamentary Commission on Banking Standards (2012). First report paper98 hc 848.
Reinhart, C. and Rogoff, K. (2009). This Time It’s Different: Eight Centuriesof Financial Folly, Princeton: Princeton University Press.
Stiglitz, J. (2012). The Price of Inequality, London: Penguin Group.
Vickers, J. (2011). How to regulate the capital and corporate structures ofbanks?, Speech. Speech to LBS.
Wolf, M. (2012). Seven ways to clean up our banking ‘cesspit’.URL: http://www.ft.com/cms/s/0/7a95df3e-cb50-11e1-b896-00144feabdc0.html#axzz2OCNumb26
Wolf, M. (2013). Why bankers are intellectually naked.URL: http://www.ft.com/cms/s/2/39c38b74-715d-11e2-9b5c-00144feab49a.html#axzz2OCNumb26
24
A Derivation of bank’s profit function
The profit of the bank is defined as
Π = (1− λc1)R− (1− λc2). (A.1)
The cost of liquidity R is defined as R ≡ U ′(c1)/U′(c2). Using CRRA utility,
In a recent working paper from the Bank of England, Noss and Sowerbutts(2012) provide empirical estimates of the value of bailout prospects for banksin the UK. In our simple model we use here, it is straightforward to obtain thevalue analytically by taking the difference of bank values with and withoutbailout.
To value a monopoly bank which is gambling without bailout, solve:
W = ΠG(k) + πδW.
So
W =ΠG(k)
1− πδ=π(1− λ)(RH − 1)− (R− πRH)k
1− πδ,
where ΠG(k) is given by (16).To value bank with bailout, solve
W b = ΠG(k) + [π + (1− π)β]δW b,
25
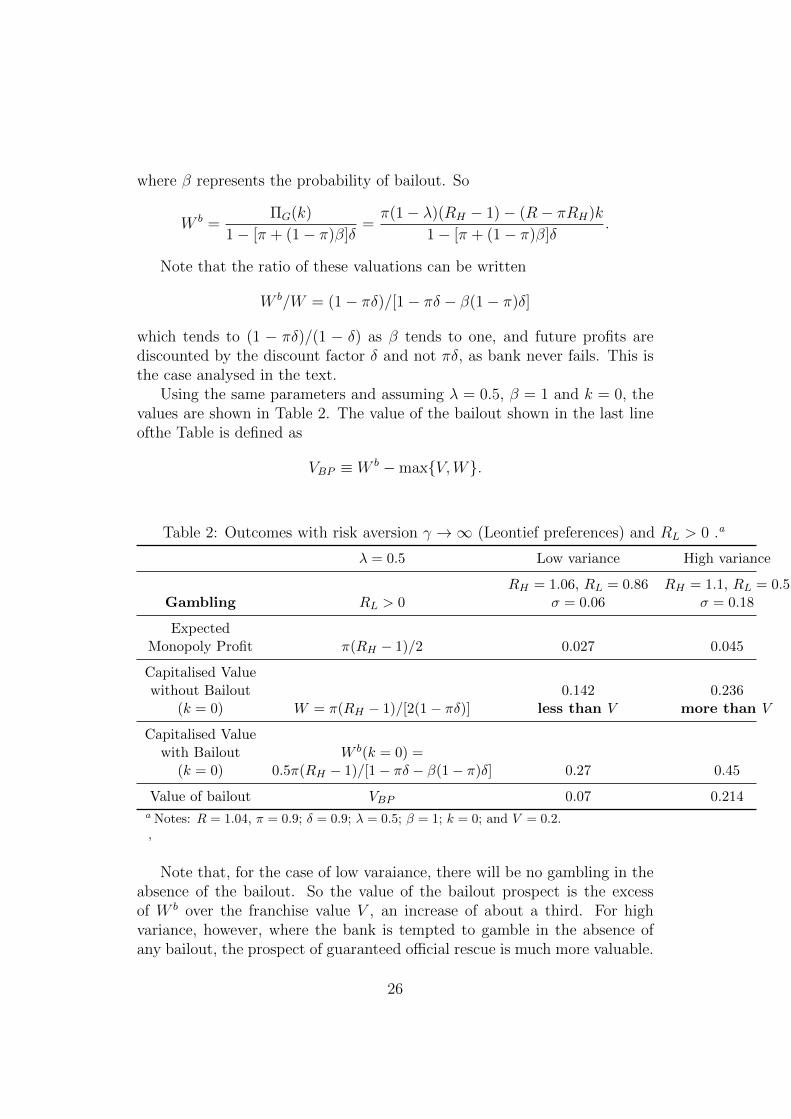
where β represents the probability of bailout. So
W b =ΠG(k)
1− [π + (1− π)β]δ=π(1− λ)(RH − 1)− (R− πRH)k
1− [π + (1− π)β]δ.
Note that the ratio of these valuations can be written
W b/W = (1− πδ)/[1− πδ − β(1− π)δ]
which tends to (1 − πδ)/(1 − δ) as β tends to one, and future profits arediscounted by the discount factor δ and not πδ, as bank never fails. This isthe case analysed in the text.
Using the same parameters and assuming λ = 0.5, β = 1 and k = 0, thevalues are shown in Table 2. The value of the bailout shown in the last lineofthe Table is defined as
VBP ≡ W b −max{V,W}.
Table 2: Outcomes with risk aversion γ →∞ (Leontief preferences) and RL > 0 .a
(k = 0) W = π(RH − 1)/[2(1− πδ)] less than V more than V
Capitalised Valuewith Bailout W b(k = 0) =
(k = 0) 0.5π(RH − 1)/[1− πδ − β(1− π)δ] 0.27 0.45
Value of bailout VBP 0.07 0.214a Notes: R = 1.04, π = 0.9; δ = 0.9; λ = 0.5; β = 1; k = 0; and V = 0.2.,
Note that, for the case of low varaiance, there will be no gambling in theabsence of the bailout. So the value of the bailout prospect is the excessof W b over the franchise value V , an increase of about a third. For highvariance, however, where the bank is tempted to gamble in the absence ofany bailout, the prospect of guaranteed official rescue is much more valuable.
26
It more or less doubles the value of the bank from 0.24 to 0.45, substantiallymore than twice the franchise value. Both cases illustrate what Martin Wolfsays in his review of Admati and Hellwig (2013) on where he argues that“financial fragility is a feature of the system, not a bug. ... The public have,willy nilly, become risk-bearers of last resort. Protected by this generosity,bankers gain vastly on the upside while shifting the downside on to others.At worst, they can devour a states fiscal capacity.” (Wolf, FT, March 17,2013)