Page 1
Downstream processing of cell culture-derived animal
viruses
Dina de Jesus Marinheiro Antunes
Thesis to obtain the Master of Science Degree in
Biotechnology
Supervisors: Prof. Maria Raquel Murias dos Santos Aires Barros
Dr. Miguel Agostinho Sousa Pinto de Torres Fevereiro
Examination Committee
Chairperson: Prof. Luís Joaquim Pina da Fonseca
Supervisor: Dr. Miguel Agostinho Sousa Pinto de Torres Fevereiro
Member of the Committee: Dr. Ana Margarida Ferreira Henriques de Oliveira Mourão
July, 2014
Page 3
3
Dedicated to
Querida Mãe e Pai (Dear Mom and Dad)
"Nós nunca nos realizamos. Somos dois abismos - um poço fitando o céu."
Fernando Pessoa
Page 5
i
Acknowledgments
All my friends say that one of my major defects, which I totally disagree (I am a little bit stubborn…), is
saying “Obrigada” (Thank you) too often. This word has its origin from the latim obligatus, participle of
the verb obligare, which means connect, attach. When we mention it, we feel connected, even for a
moment, to some favor someone did. And I am glad to have a section in my Dissertation where I can
finally say this beautiful word how many times I want. And tie me to the people.
“Obrigada”
This dissertation would not have been possible without the guidance and cooperation of several
people who contributed with their invaluable assistance in the formulation, development and
completion of this study. First and foremost, I would like to show my greatest gratitude to Dr. Miguel
Fevereiro, who provided an inspiring environment to work in and taught me the real sense of “negative
thinking”. He showed that it is possible (believe me!) to be an exceptional Director, teacher, researcher
and vet, with a LOT of work, love and engagement. Thanks for the “meatball” story!
I would also like to thank Professor Raquel Aires-Barros for her supervision and motivation. Once, I
called on her for an important decision and she backed me up. Professor Raquel also taught me that it
is achievable being a full Professor, president of Teaching Council, course coordinator and supervisor.
I could not have imagined having better mentors for my Master’s studies and for my life.
Besides my advisors, I am very grateful to Dr. Ana Azevedo, who had contributed immensely to my
personal and professional life. She had supported me when I was “less happy” with her fruitful advices
and opinions. Particularly, her way of being and teaching was preponderant in my decision to work in
this field and in this IST research group. More importantly, she demonstrated her faith in my ability to
rise and do the necessary work. In reviewing my writings, she offered precious comments. Thank you
with my whole heart.
A special thanks to my college’s psychologist who did not allowed me to study economics and has
changed my life showing me this wonderful world of science and nature’s sublimity.
It has been a privilege to work with such a dynamic group of people that continually impress me with
their knowledge and kindness specifically André Nascimento, António Grilo, Dragana Barros, Edith
Espitia, Inês Pinto, Isabel Pinto, Maria João Jacinto, Raquel Santos, Rimenys Carvalho, Ruben
Soares, Sara Rosa and Sandra Bernardo. I am particularly indebted to Raquel Santos for her
gentleness, time, interest, and helpful comments reviewing my Dissertation. I must share my grade
with you! Sara Rosa, thank so much for allowing me to get through anytime, anywhere; your
collaboration and friendship helped me to develop as a researcher. I thank you for your unique
insights and perspectives.
I would also like to recognize members of the INIAV lab namely, Dr. Fernanda Ramos, Dr. Margarida
Duarte, Dr. Margarida Mourão, Dr. Sílvia Barros, Dr. Teresa Fagulha, Dr. Tiago Luís, “Janeco”, Mrs.
Cristina, Mr. Ferreira, Mrs. Fátima, Mrs. Rosário and Mrs. São. Thanks to São especially for helping
me a lot with the tissue culture work.
I would like to acknowledge people from support services, namely Mrs. Conceição from the
Bioengineering department who helped me with bureaucratic issues and Mrs. Rosa and Ricardo
Page 6
ii
Pereira technician who provided me material and conditions to work with in the lab as soon as I
needed. Having everything prepared to work is priceless. Thank you!
I am also very lucky with my friends who have infused my life with joy, culture, excitement and in the
case of the choir, with music: Albertina Soares, Andreia Ponte, Andreia Sobreiro, Ana Raquel Silva,
Bia Moita, Carina Fernandes, Filipa Nascimento, Joana Fernandes, Lurdes Silva, maestro Luís Filipe,
Miriam Iracema, Sónia Rodrigues, Xinanda and all the choir friends. I am very grateful to Sílvia Lopes
for her friendship since I was a little child. Thank you for sharing these years with me, for your infinite
support throughout everything.
There are some people far away, unfortunately, in my life (physically…) namely Adriana Soprano,
Andrzej Koczut, Marina Salles, Marta Cipinska and Nithin Reddy. I am grateful for you, my
backpacking buddies, for the time we spent together, and our memorable trips into the mountains,
lakes, castles… culture and memories. Life will not keep us away, I promise you. You are always in
my heart.
Last but not the least… I would like to express my heartfelt gratitude to my parents for raising me with
all the sacrifice and work in order to provide me the best education and life quality. Both fight everyday
against many adversities which are a result of their renounces for their children. There is no way to
pay this. No tears, hours of care and company, money, hugs and much less a thesis to compensate
them. I hope God will show me a way to reward. If not, some of their teachings and kindness to use
with my successors. Obrigada.
Many thanks my older brothers for educating me when my parents were fighting for us. I know that I
stole a big part of your childhood and youth. And we have only one in our lives… I promise that you
can always count on me. Every morning I wake up wishing for being like you, one day. Obrigada.
Concerning the youngest, I gratefully acknowledge our scientific discussions, for encouraging me and
cheering me up. Despite being the youngest, I have a lot of respect for his knowledge and intelligence.
As older sister in this case, I influenced some of his choices. I am very proud of the final result.
Obrigada.
Last year, my family was expanded with the emergence of a brother-in-law. He gained not only a
place in my heart but also in my holy family. Thank you for your support when I have needed.
Obrigada.
There is not an only day in which I do not thank for this blessed family. Obrigada.
I would also like to give a special thanks to Gustavo, who has increased exponentially my capacity to
dream and believe and is willing to trudge with me in this challenging path of research, science and
love. Obrigada.
Gratidão, Gratidão, Gratidão.
Page 7
iii
Resumo
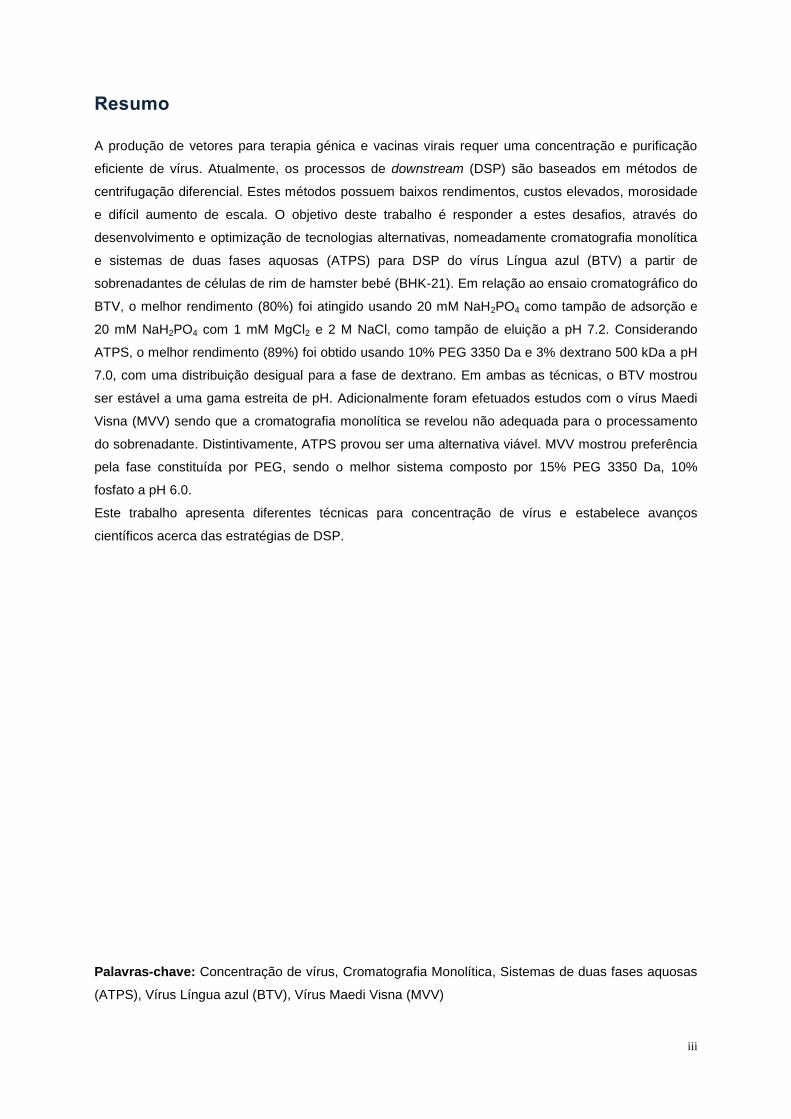
A produção de vetores para terapia génica e vacinas virais requer uma concentração e purificação
eficiente de vírus. Atualmente, os processos de downstream (DSP) são baseados em métodos de
centrifugação diferencial. Estes métodos possuem baixos rendimentos, custos elevados, morosidade
e difícil aumento de escala. O objetivo deste trabalho é responder a estes desafios, através do
desenvolvimento e optimização de tecnologias alternativas, nomeadamente cromatografia monolítica
e sistemas de duas fases aquosas (ATPS) para DSP do vírus Língua azul (BTV) a partir de
sobrenadantes de células de rim de hamster bebé (BHK-21). Em relação ao ensaio cromatográfico do
BTV, o melhor rendimento (80%) foi atingido usando 20 mM NaH2PO4 como tampão de adsorção e
20 mM NaH2PO4 com 1 mM MgCl2 e 2 M NaCl, como tampão de eluição a pH 7.2. Considerando
ATPS, o melhor rendimento (89%) foi obtido usando 10% PEG 3350 Da e 3% dextrano 500 kDa a pH
7.0, com uma distribuição desigual para a fase de dextrano. Em ambas as técnicas, o BTV mostrou
ser estável a uma gama estreita de pH. Adicionalmente foram efetuados estudos com o vírus Maedi
Visna (MVV) sendo que a cromatografia monolítica se revelou não adequada para o processamento
do sobrenadante. Distintivamente, ATPS provou ser uma alternativa viável. MVV mostrou preferência
pela fase constituída por PEG, sendo o melhor sistema composto por 15% PEG 3350 Da, 10%
fosfato a pH 6.0.
Este trabalho apresenta diferentes técnicas para concentração de vírus e estabelece avanços
científicos acerca das estratégias de DSP.
Palavras-chave: Concentração de vírus, Cromatografia Monolítica, Sistemas de duas fases aquosas
(ATPS), Vírus Língua azul (BTV), Vírus Maedi Visna (MVV)
Page 9
v
Abstract
The production of gene therapy vectors and viral vaccines requires an efficient concentration and
purification of viral particles. Presently, virus downstream procedures are based in differential
centrifugation methods. Such methods are characterized by low yields, high costs, time-consuming
and difficult scale up. The goal of this thesis is to address these current challenges, by developing and
optimizing alternative technologies, namely monolithic chromatography and aqueous two-phase
systems (ATPS) for the concentration and purification of Bluetongue virus (BTV) from baby hamster
kidney cells (BHK-21) culture supernatants. Concerning the chromatographic assay, the best yield
(80%) was achieved using 20 mM NaH2PO4 with 1 mM MgCl2 as adsorption buffer and 20 mM
NaH2PO4 with 1 mM MgCl2 and 2 M NaCl as elution buffer, both at pH 7.2. Regarding ATPS, the best
yield (89%) was obtained using 10% PEG 3350 Da and 3% dextran 500 kDa at pH 7.0 with an uneven
distribution of BTV being observed in the dextran-rich phase. In both techniques, BTV showed a
narrow zone of pH stability. Additionally, preliminary studies were performed with Maedi Visna virus
(MVV) and it was observed that monolithic chromatography was not suitable for processing the culture
supernatants. Distinctively, ATPS proved to be a viable alternative. MVV exhibited a top phase
preference with the highest recoveries obtained with 15% PEG 3350 Da, 10% phosphate at pH 6.0.
MVV also presented a narrow working pH range.
This work presents different techniques for virus concentration and advance scientific understanding
of the viral downstream processing strategies.
Keywords: Aqueous two-phase systems (ATPS), Bluetongue Virus (BTV), Maedi Visna Virus (MVV),
Monolithic chromatography, Virus concentration
Page 11
vii
List of Contents
Acknowledgments .................................................................................................................................. i
Resumo.................................................................................................................................................. iii
Abstract .................................................................................................................................................. v
List of Tables ........................................................................................................................................ ix
List of Figures ....................................................................................................................................... xi
List of Abbreviations ........................................................................................................................... xv
Nomenclature ..................................................................................................................................... xvii
1. Introduction .................................................................................................................................... 1
1.1. State-of-the art ......................................................................................................................... 1
1.2. Objectives ................................................................................................................................ 2
2. Literature review ............................................................................................................................ 3
2.1. Viruses: General remarks and applications ............................................................................. 3
2.1.1. Understanding Bluetongue virus: virology, pathogenesis and epidemiology ........................... 5
2.1.2. Maedi Visna virus: a model to study human immunodeficiency virus (HIV) ............................ 7
2.2. Bioprocess design to develop viruses .................................................................................... 10
2.2.1. Manufacturing technology ...................................................................................................... 10
2.2.2. Downstream processing ......................................................................................................... 11
2.2.2.1. Cell culture harvest ............................................................................................................... 12
2.2.2.2. Intermediate Purification ....................................................................................................... 13
2.2.2.3. Polishing step ....................................................................................................................... 17
3. Materials and Methods .................................................................................................................... 25
3.1. Culture expansion and virus inoculation..................................................................................... 25
3.2. MVV pre-purification by polyethylene glycol-NaCl precipitation ................................................. 25
3.3. Viruses concentration by density gradient centrifugation ........................................................... 25
3.4. Supernatants ultrafiltration/diafiltration ....................................................................................... 26
3.5. Viruses concentration and purification by Chromatography ...................................................... 26
3.6. BTV concentration and purification by Aqueous Two-Phase Systems...................................... 27
3.7. Analytical Methods ..................................................................................................................... 27
4. BTV Results and Discussion ...................................................................................................... 33
4.1. Production of cell culture-derived BTV .................................................................................. 33
4.2. BTV analytical methods establishment ................................................................................. 35
4.3. Feedstock characterization .................................................................................................... 36
4.4. Feedstock diafiltration ............................................................................................................ 39
4.5. Chromatography using monolithic supports .......................................................................... 42
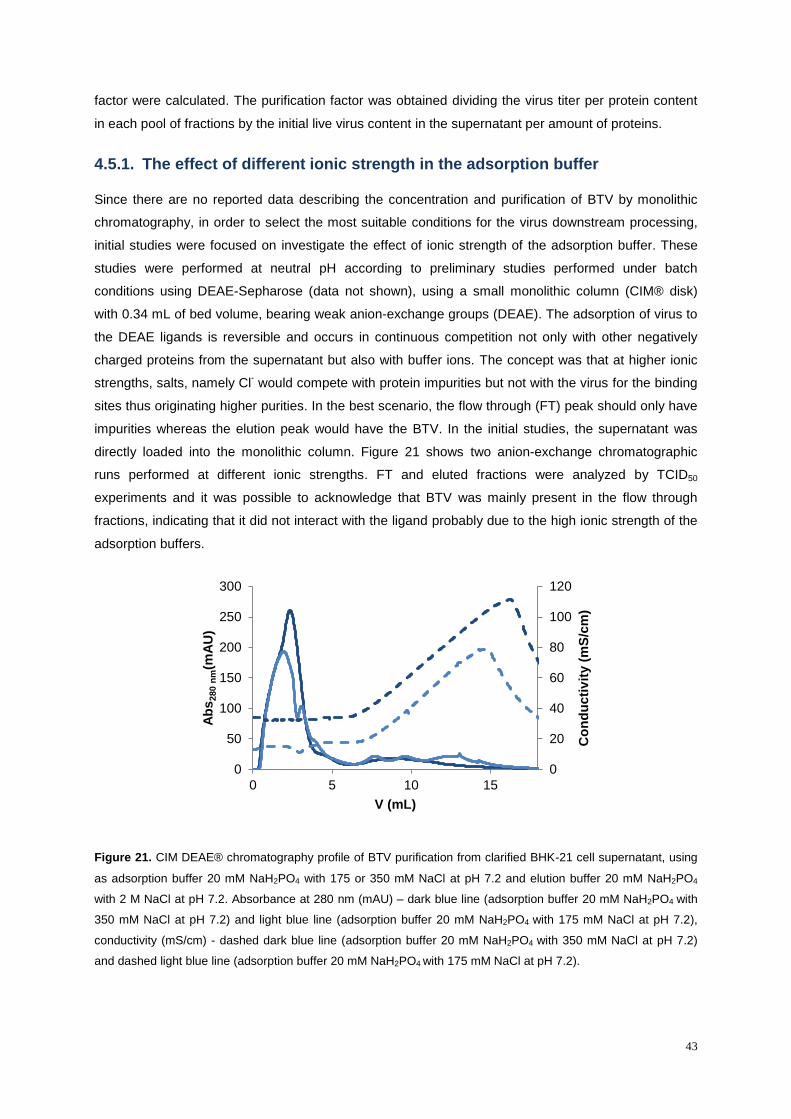
4.5.1. The effect of different ionic strength in the adsorption buffer ................................................ 43
4.5.2. The effect of the ion exchange ligand ................................................................................... 44
Page 12
viii
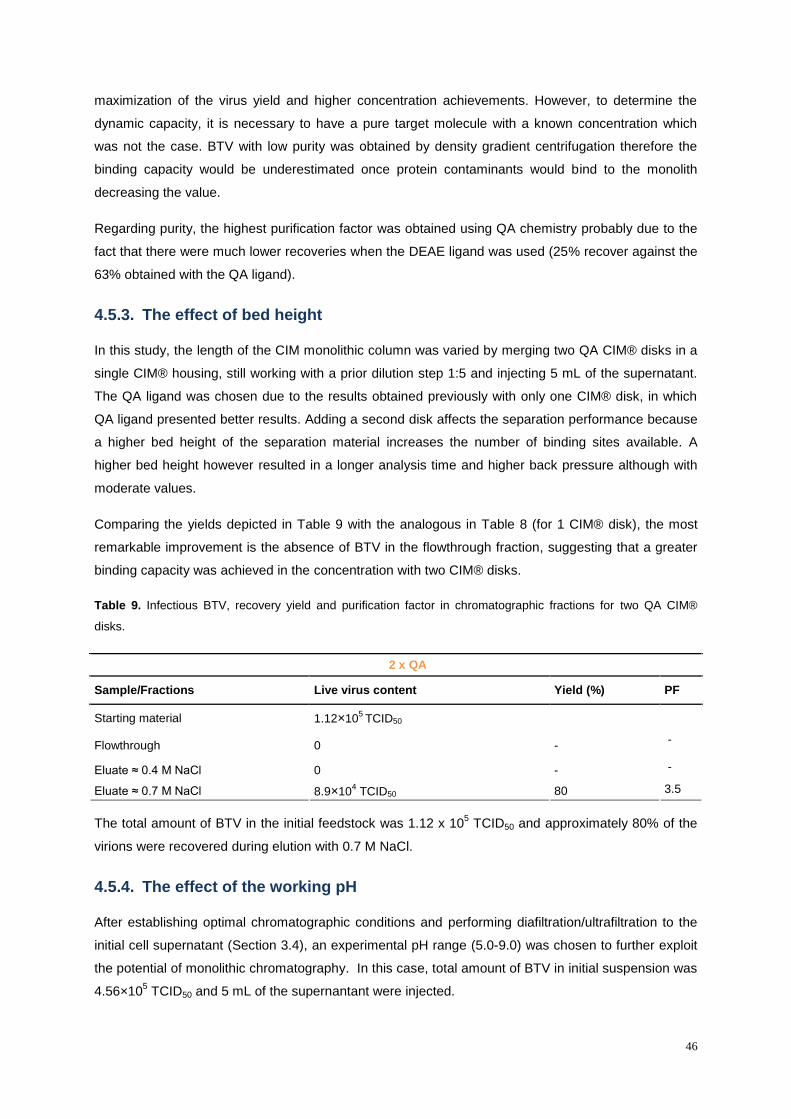
4.5.3. The effect of bed height ......................................................................................................... 46
4.5.4. The effect of the working pH ................................................................................................. 46
4.5.5. The effect of the working flow rate ........................................................................................ 48
4.5.6. The effect of different load volumes ...................................................................................... 48
4.6. Monolithic chromatography VS Density gradient centrifugation........................................... 49
4.7. BTV concentration and purification using two-phase systems .............................................. 52
4.7.1. Initial studies with PEG 3350/dextran 60-90 kDa .................................................................. 52
4.7.2. Studies with PEG 3350 Da/Dextran 500 kDa ........................................................................ 57
4.7.4. Studies with PEG 1000 Da .................................................................................................... 63
4.8. Comparison between ATPS and Density Gradient Centrifugation ........................................ 64
5. MVV Results and Discussion ..................................................................................................... 67
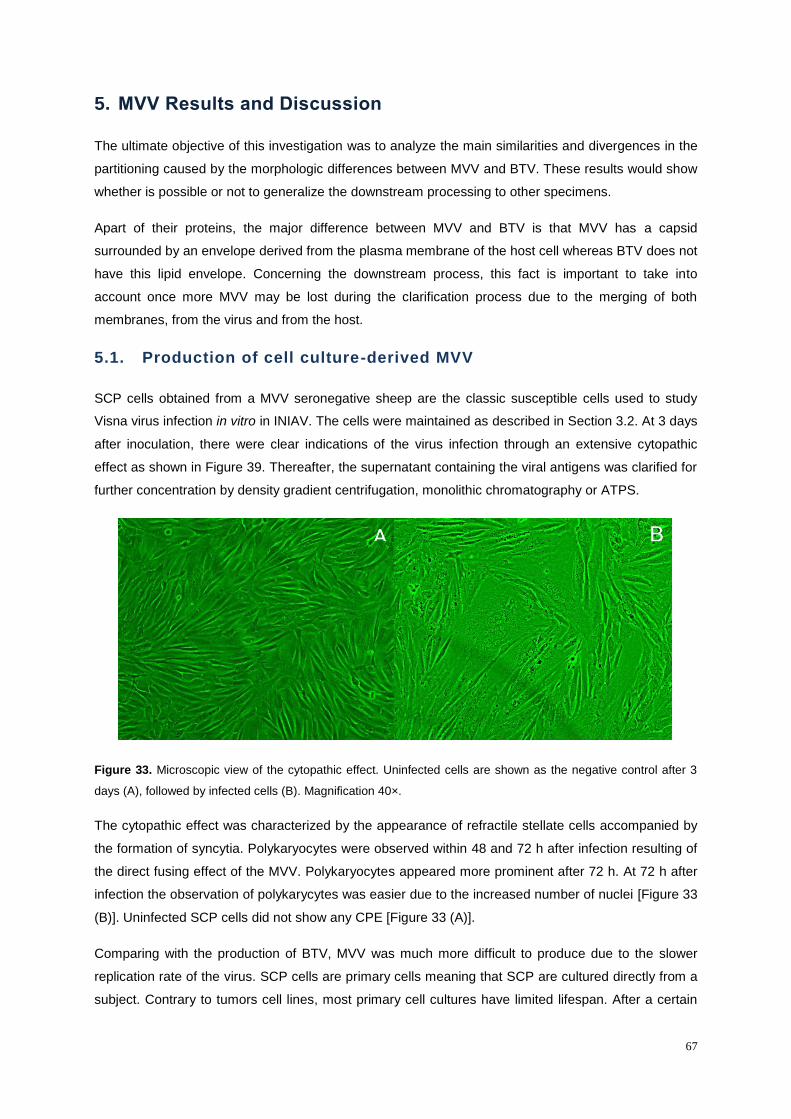
5.1. Production of cell culture-derived MVV ..................................................................................... 67
5.2. MVV analytical methods establishment ..................................................................................... 68
5.3. Feedstock characterization ........................................................................................................ 69
5.4. Feedstock diafiltration ................................................................................................................ 71
5.5. Chromatography using monolithic supports .............................................................................. 72
5.6. MVV concentration using two-phase systems ........................................................................... 73
5.6.2. Studies with PEG 3350 Da/Dextran 500 kDa .......................................................................... 75
5.6.3. Studies with PEG 3350 Da/phosphate .................................................................................... 76
5.6.4. Studies with PEG 1000 Da ...................................................................................................... 77
6. Conclusions and future perspectives ....................................................................................... 79
7. References ................................................................................................................................... 83
8. Annexes ........................................................................................................................................ 91
Page 13
ix
List of Tables
Table 1. Examples of some viruses: name, features and structure. Content from (SIB Swiss Institute
of Bioinformatics, 2014). .......................................................................................................................... 4
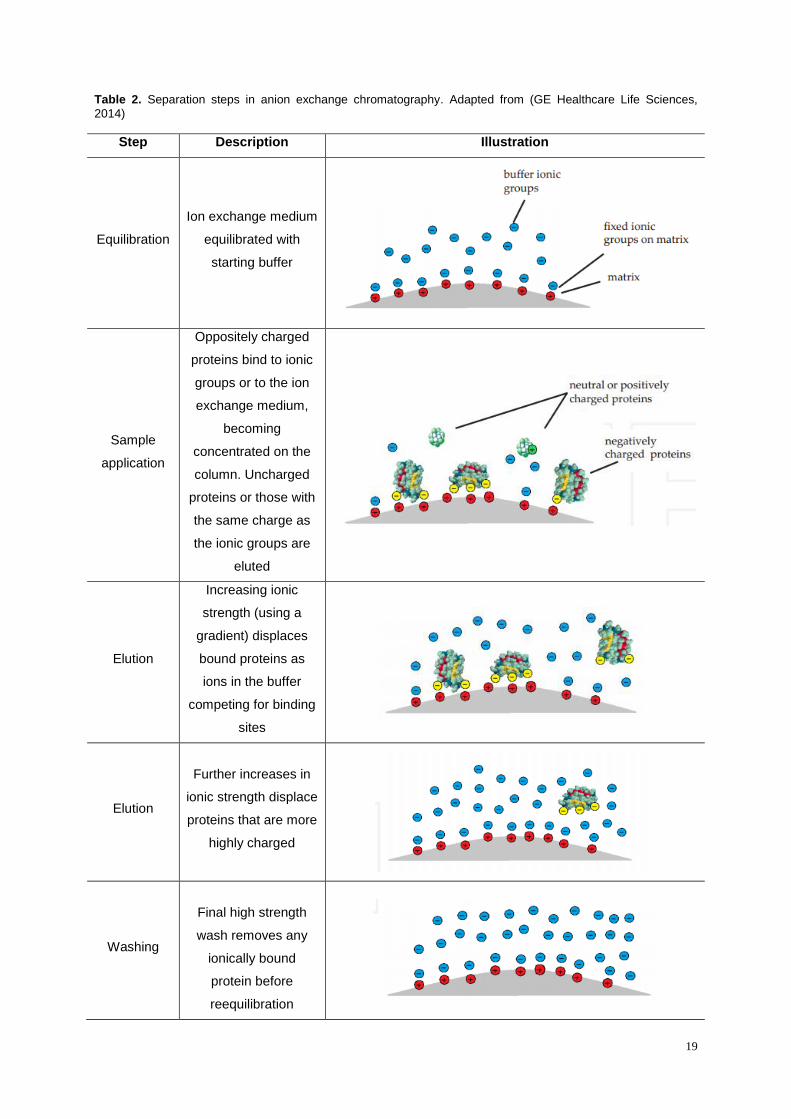
Table 2. Separation steps in anion exchange chromatography. Adapted from (GE Healthcare Life
Sciences, 2014) ..................................................................................................................................... 19
Table 3. Overview of commercially available monoliths ....................................................................... 21
Table 4. Advantages and disadvantages of ATPS (Rosa, et al., 2010) (Xu, et al., 2001). ................... 24
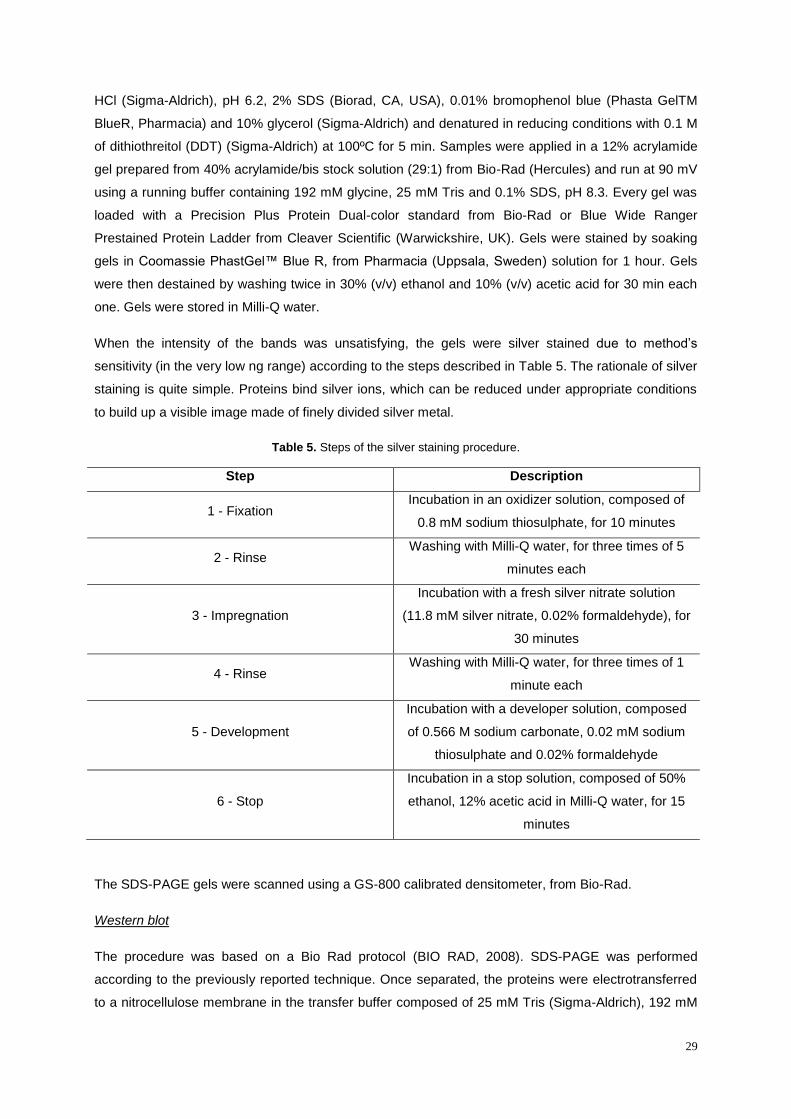
Table 5. Steps of the silver staining procedure. .................................................................................... 29
Table 6. Microscopic view of the CPE. Uninfected cells are shown as the negative control (0 h),
followed by infected cells at different post-infection times. ................................................................... 34
Table 7. Overall resistance (RT) and resistance due to concentration polarization + fouling (Rcp+f)
values as a function of diafiltration time (which corresponds to each 100 mL processed). Relative
importance of the concentration polarization and fouling phenomena in the overall resistance is
represented by Rcp+f/RT. ........................................................................................................................ 42
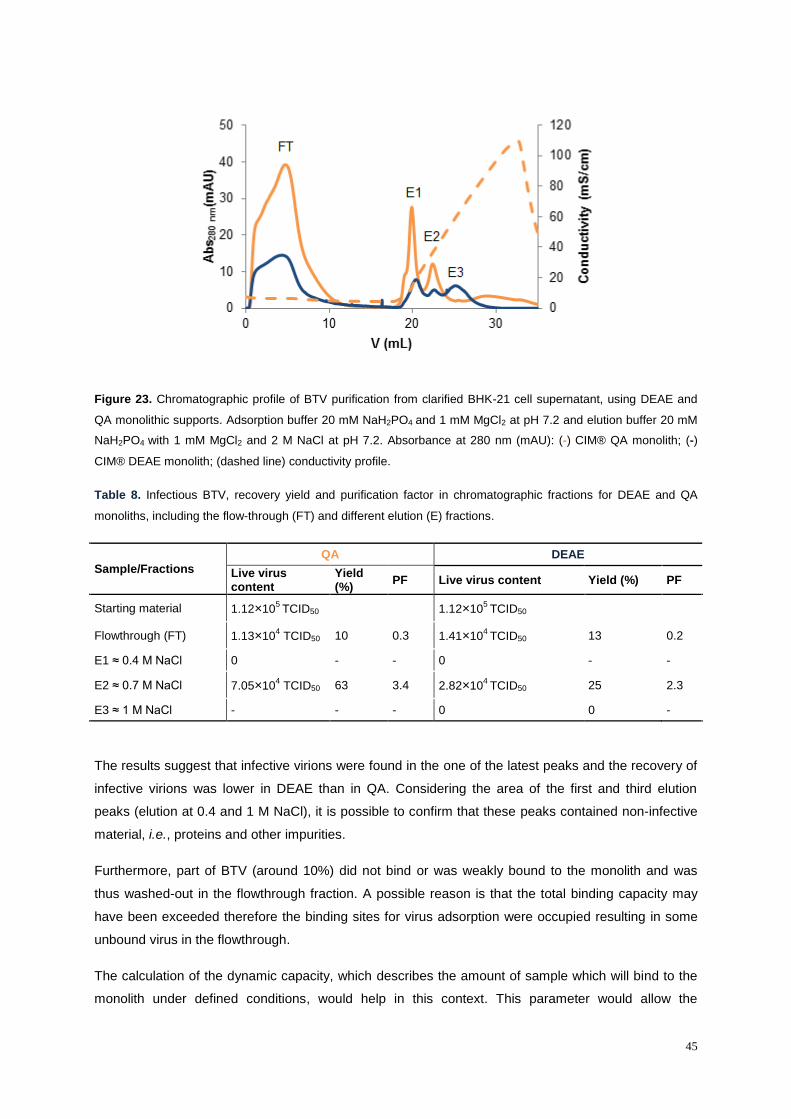
Table 8. Infectious BTV, recovery yield and purification factor in chromatographic fractions for DEAE
and QA monoliths, including the flow-through (FT) and different elution (E) fractions.......................... 45
Table 9. Infectious BTV, recovery yield and purification factor in chromatographic fractions for two QA
CIM® disks. ........................................................................................................................................... 46
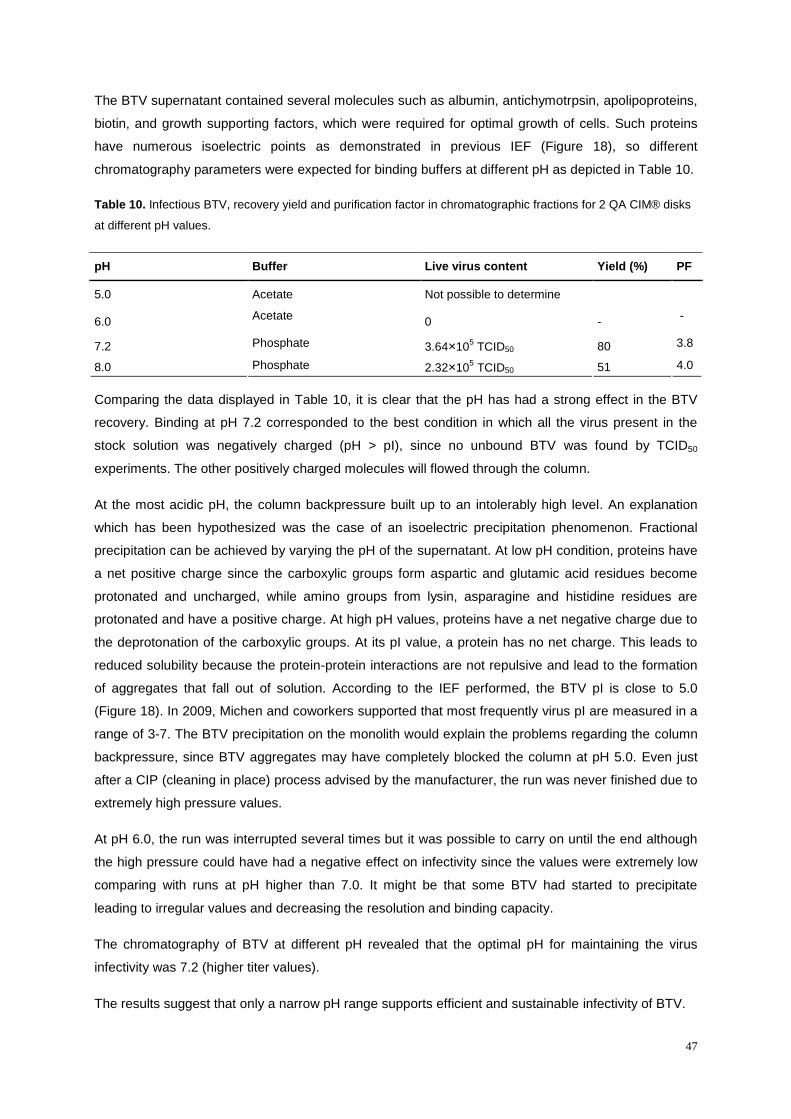
Table 10. Infectious BTV, recovery yield and purification factor in chromatographic fractions for 2 QA
CIM® disks at different pH values. ........................................................................................................ 47
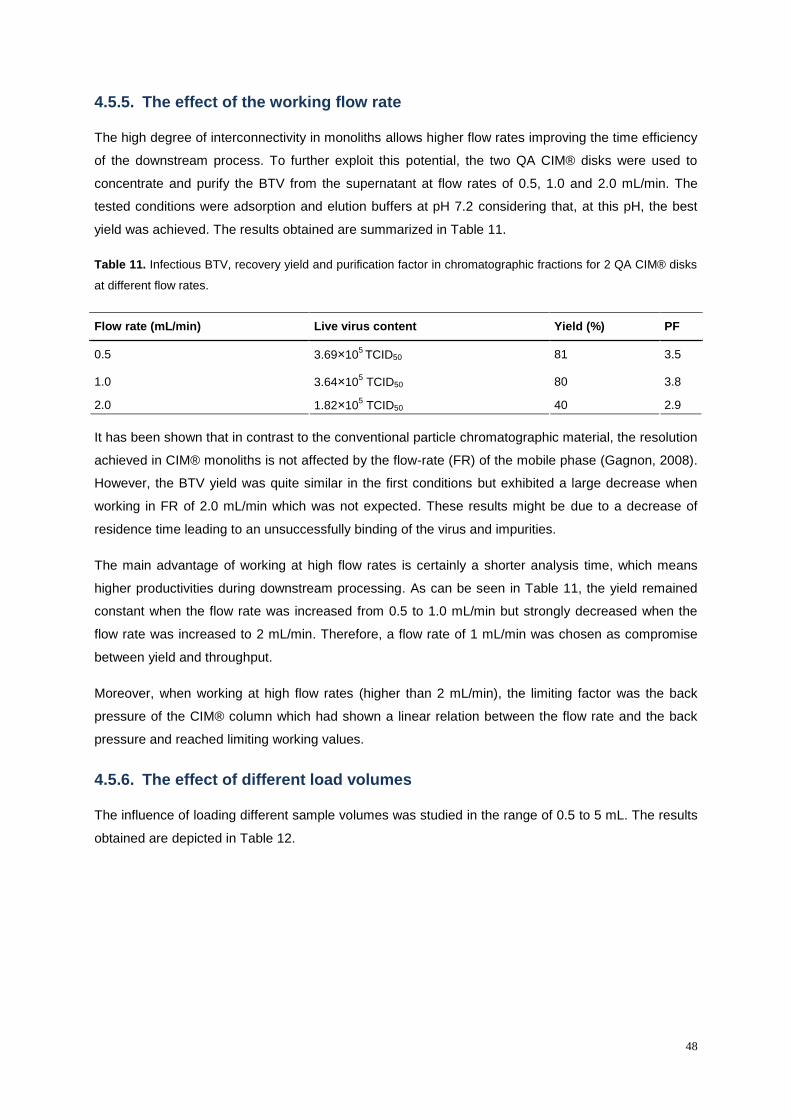
Table 11. Infectious BTV, recovery yield and purification factor in chromatographic fractions for 2 QA
CIM® disks at different flow rates. ......................................................................................................... 48
Table 12. Infectious BTV, recovery yield and purification factor in chromatographic fractions for 2 QA
CIM® disks at different flow rates. ......................................................................................................... 49
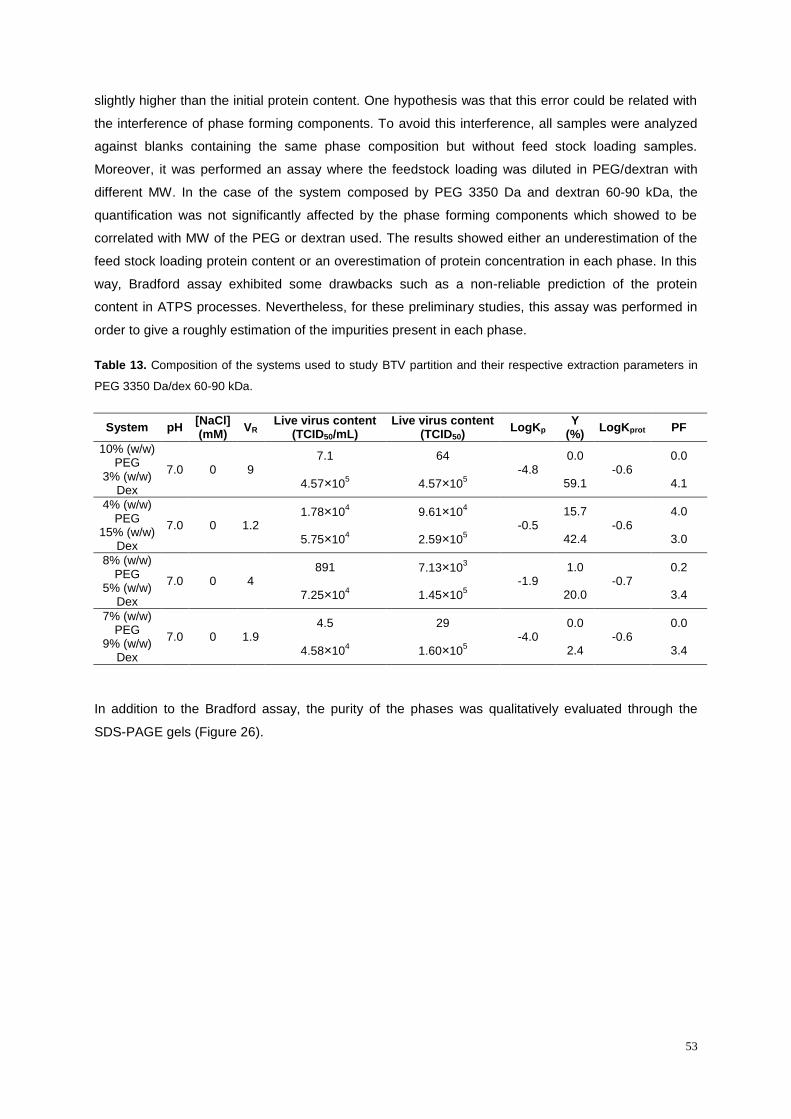
Table 13. Composition of the systems used to study BTV partition and their respective extraction
parameters in PEG 3350 Da/dex 60-90 kDa. ........................................................................................ 53
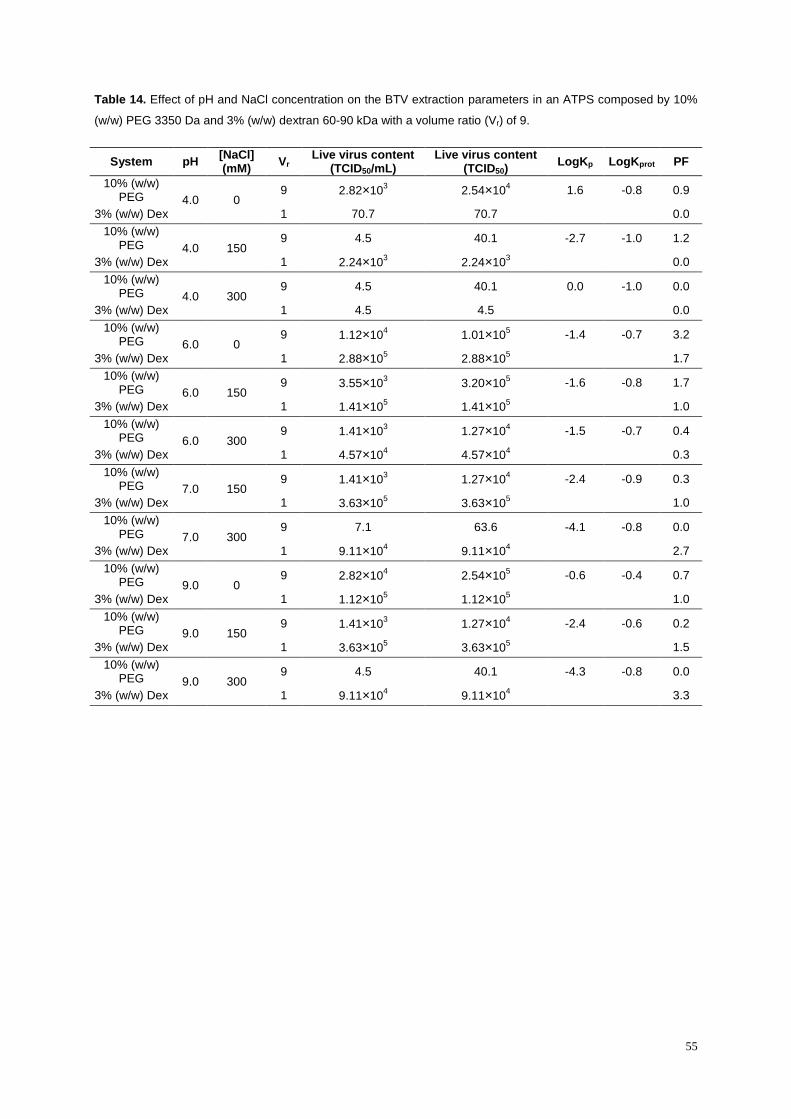
Table 14. Effect of pH and NaCl concentration on the BTV extraction parameters in an ATPS
composed by 10% (w/w) PEG 3350 Da and 3% (w/w) dextran 60-90 kDa with a volume ratio (Vr) of 9.
............................................................................................................................................................... 55
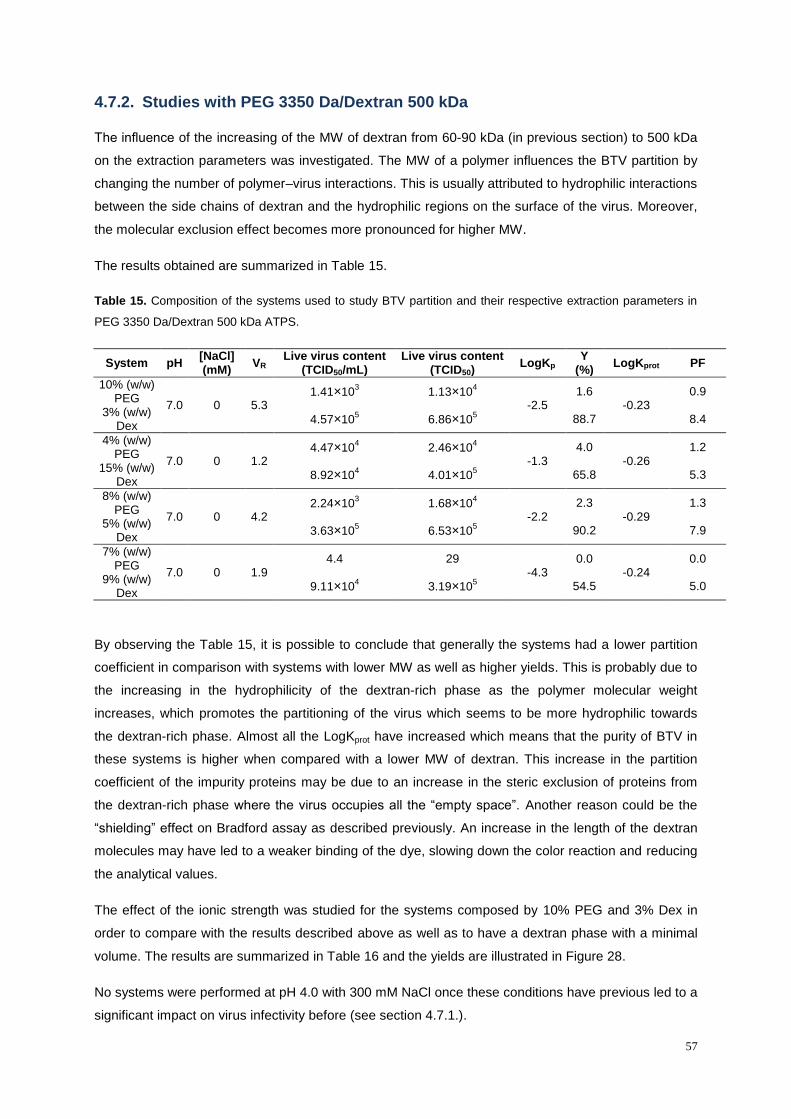
Table 15. Composition of the systems used to study BTV partition and their respective extraction
parameters in PEG 3350 Da/Dextran 500 kDa ATPS. .......................................................................... 57
Table 16. Effect of pH and NaCl concentration on the BTV extraction parameters in an ATPS
composed by 10% (w/w) PEG 3350 Da and 3% (w/w) dextran 500 kDa with a Vr of 9. ....................... 58
Table 17. Composition of the systems used to study BTV partition and their respective extraction
parameters in PEG 3350 Da/Phosphate ATPS. ................................................................................... 60
Table 18. Effect of pH and NaCl concentration on the BTV extraction parameters in PEG 3350
Da/phosp ATPS. .................................................................................................................................... 62
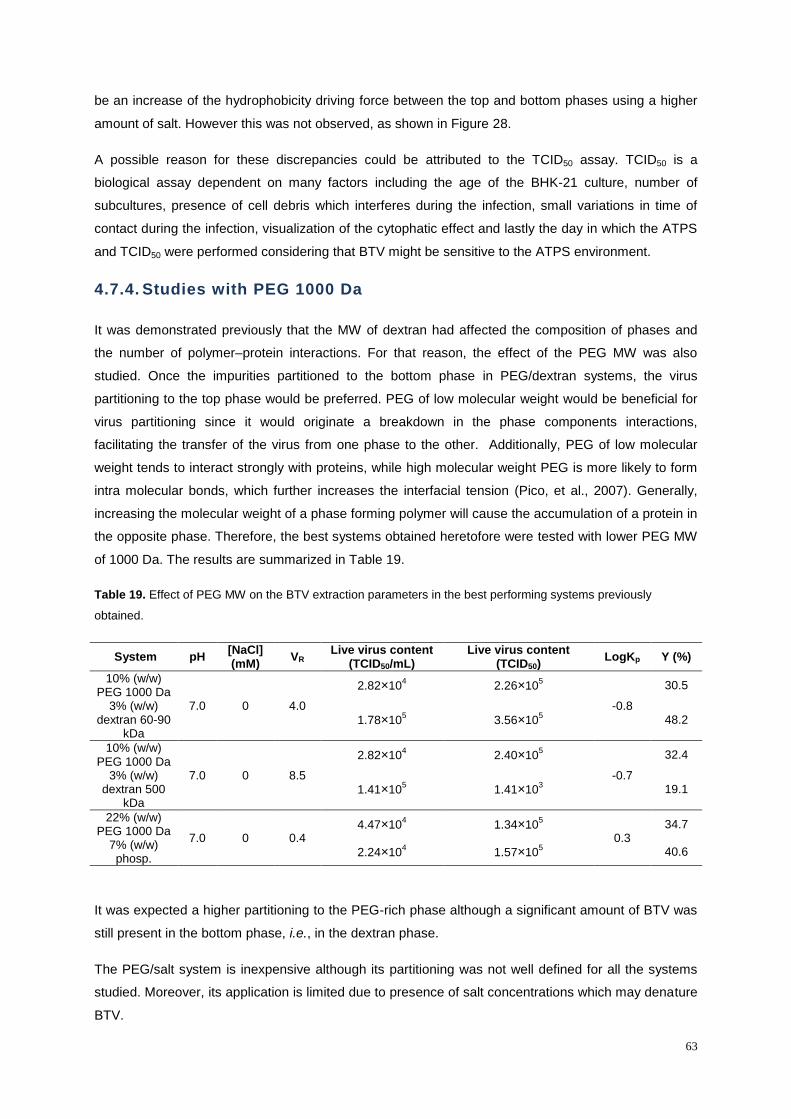
Table 19. Effect of PEG MW on the BTV extraction parameters in the best performing systems
previously obtained. ............................................................................................................................... 63
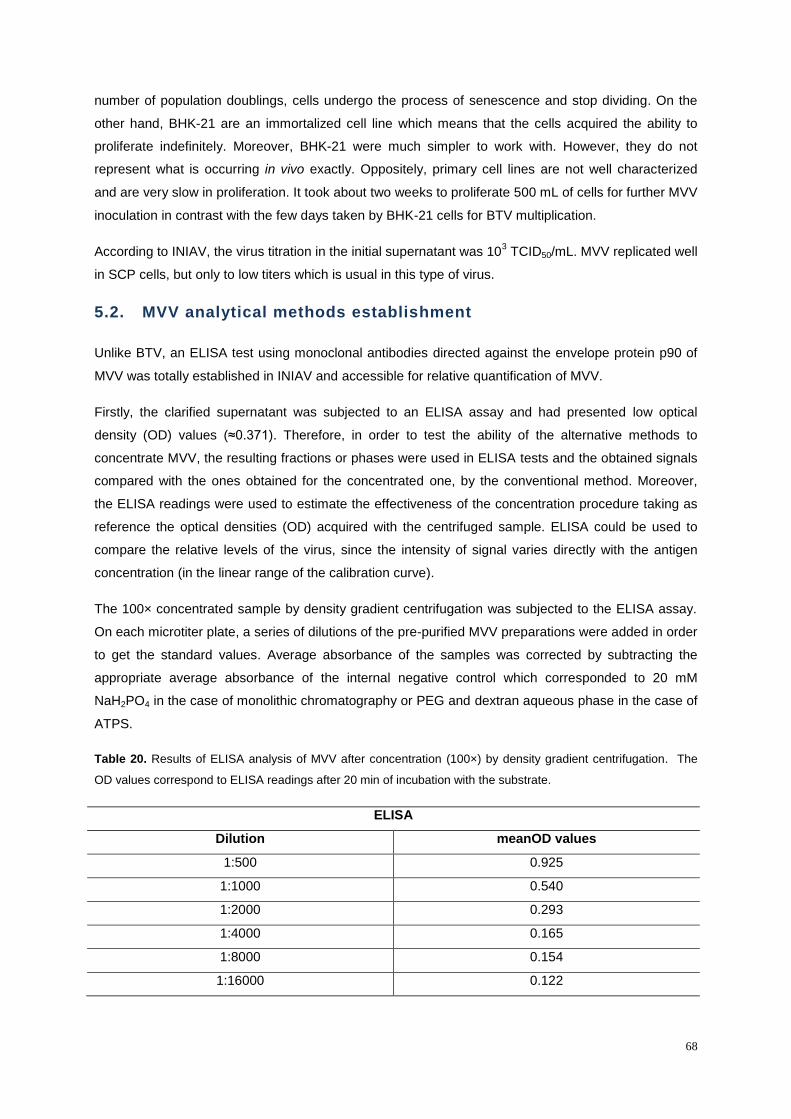
Table 20. Results of ELISA analysis of MVV after concentration (100x) by density gradient
centrifugation. The OD values correspond to ELISA readings after 20 min of incubation with the
substrate. ............................................................................................................................................... 68
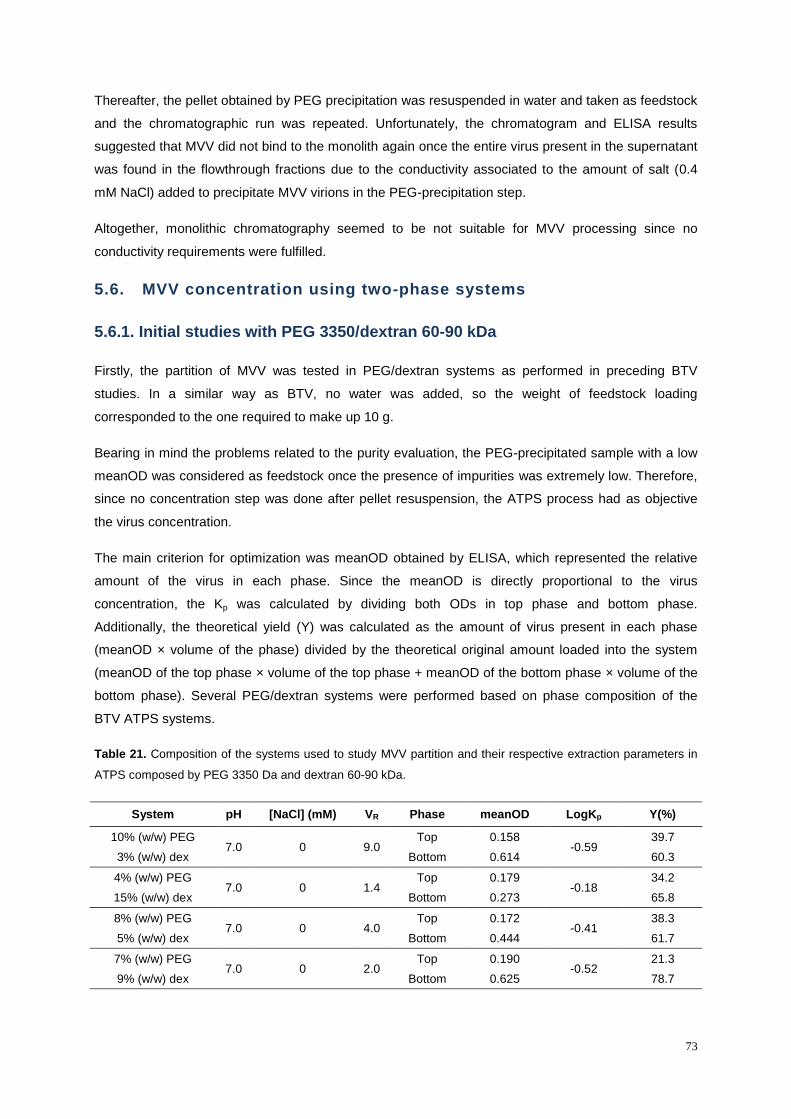
Table 21. Composition of the systems used to study MVV partition and their respective extraction
parameters in ATPS composed by PEG 3350 Da and dextran 60-90 kDa. ......................................... 73
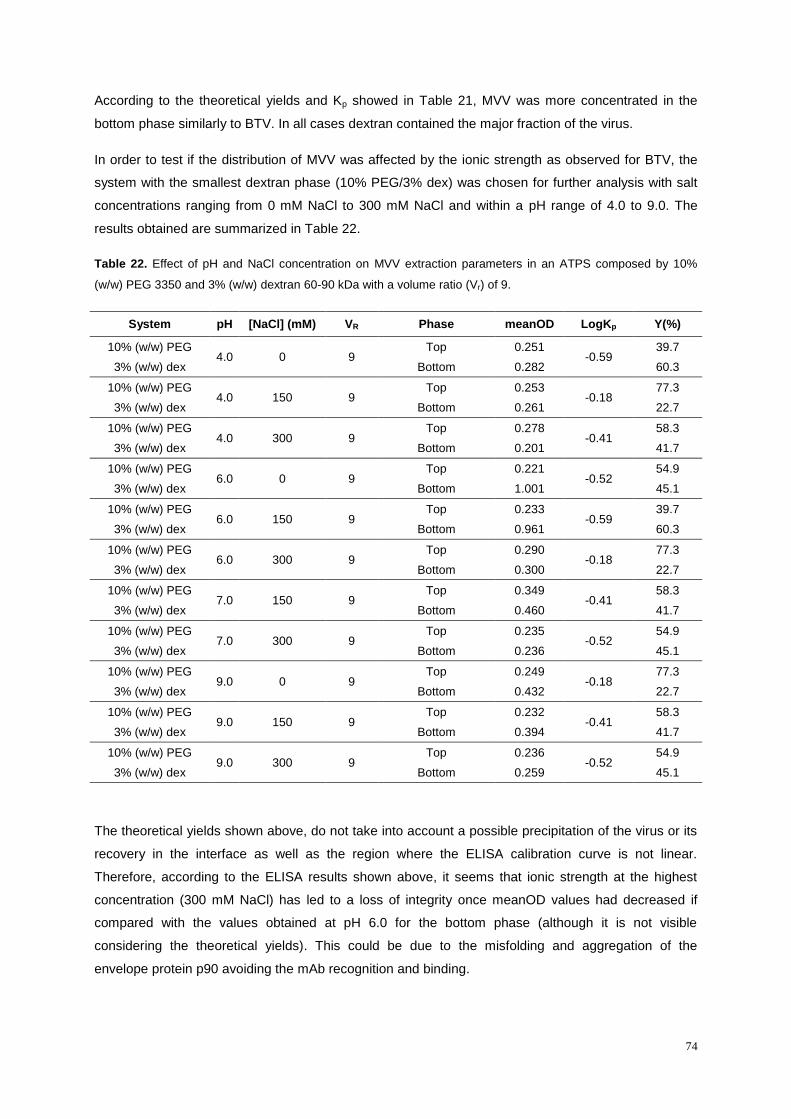
Table 22. Effect of pH and NaCl concentration on MVV extraction parameters in an ATPS composed
by 10% (w/w) PEG 3350 and 3% (w/w) dextran 60-90 kDa with a volume ratio (Vr) of 9. .................... 74
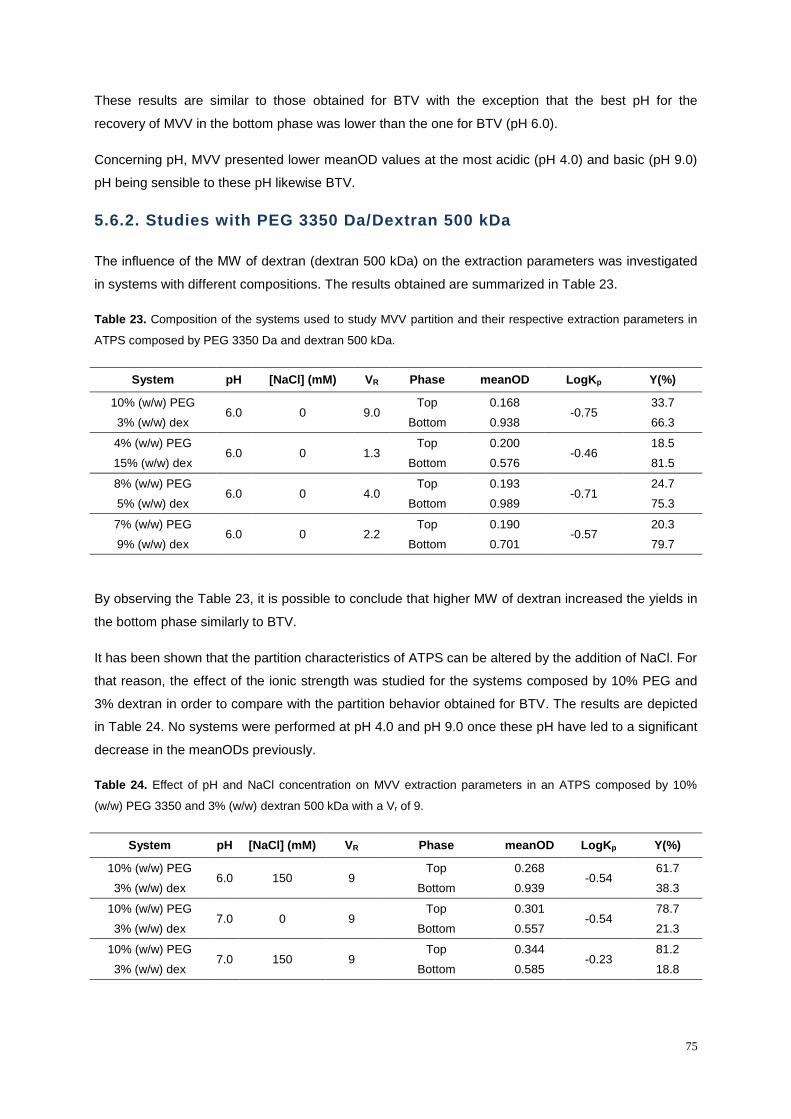
Table 23. Composition of the systems used to study MVV partition and their respective extraction
parameters in ATPS composed by PEG 3350 Da and dextran 500 kDa. ............................................. 75
Table 24. Effect of pH and NaCl concentration on MVV extraction parameters in an ATPS composed
by 10% (w/w) PEG 3350 and 3% (w/w) dextran 500 kDa with a Vr of 9. .............................................. 75
Page 14
x
Table 25. Composition of the systems used to study MVV partition and their respective extraction
parameters in an ATPS composed by PEG 3350 Da and phosphate at pH 6.0................................... 76
Table 26. Effect of pH and NaCl concentration on MVV extraction parameters in an ATPS composed
by 15% (w/w) PEG 3350 Da and 10% (w/w) phosphate with a Vr of 1. ................................................ 76
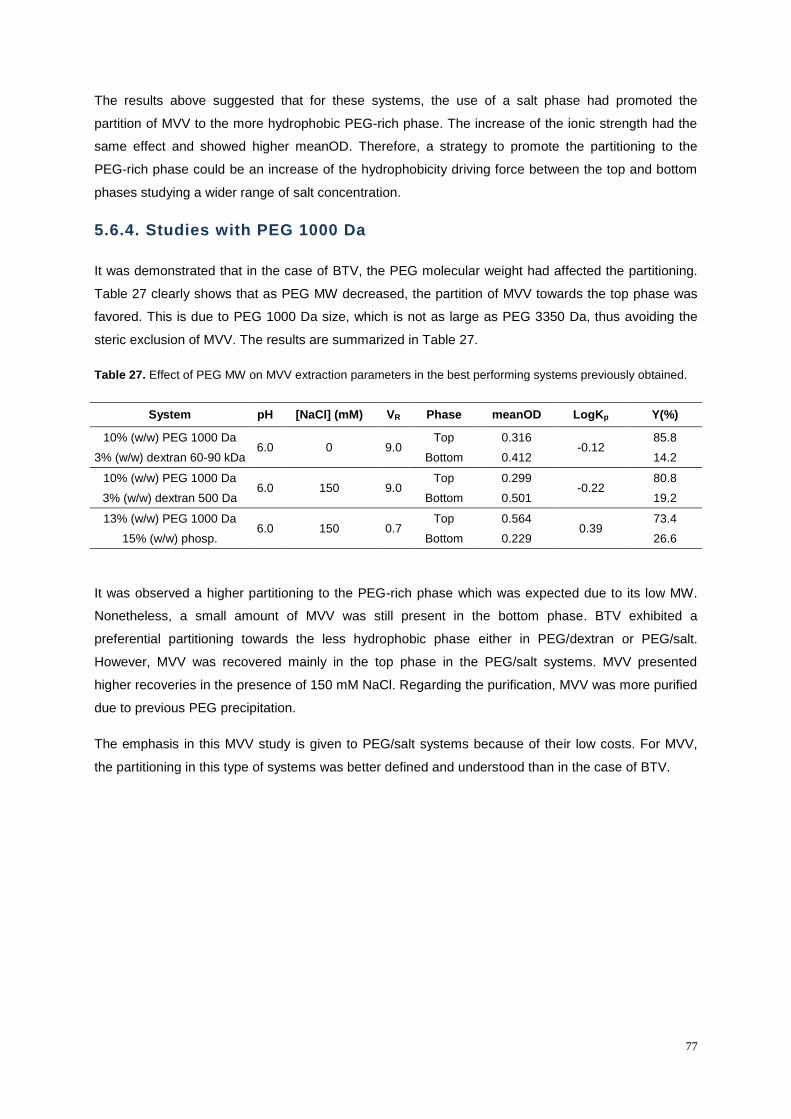
Table 27. Effect of PEG MW on MVV extraction parameters in the best performing systems
previously obtained. ............................................................................................................................... 77
Page 15
xi
List of Figures
Figure 1. Summary of BTV transmission root (Purse, et al., 2005). ....................................................... 5
Figure 2. Clinical signs of the disease namely reddening and swelling of the lips, mouth, nasal linings
and eyelids (Baynard, 2010). .................................................................................................................. 6
Figure 3. Representative scheme of BTV structural proteins and dsRNA segments (Purse, et al.,
2005). ....................................................................................................................................................... 7
Figure 4. Clinical signs of the MVV disease namely mastitis in mammary glands (A) and loss of body
weight in sheep (B) (Veterinary Faculty of Zaragoza, Spain, 2013). ...................................................... 8
Figure 5. Representative structure of MVV and its main proteins (SIB Swiss Institute of Bioinformatics,
2014). ....................................................................................................................................................... 9
Figure 6. Cell culture production plant from Novartis Vaccines and Diagnostics ((IFPMA, 2014). ...... 11
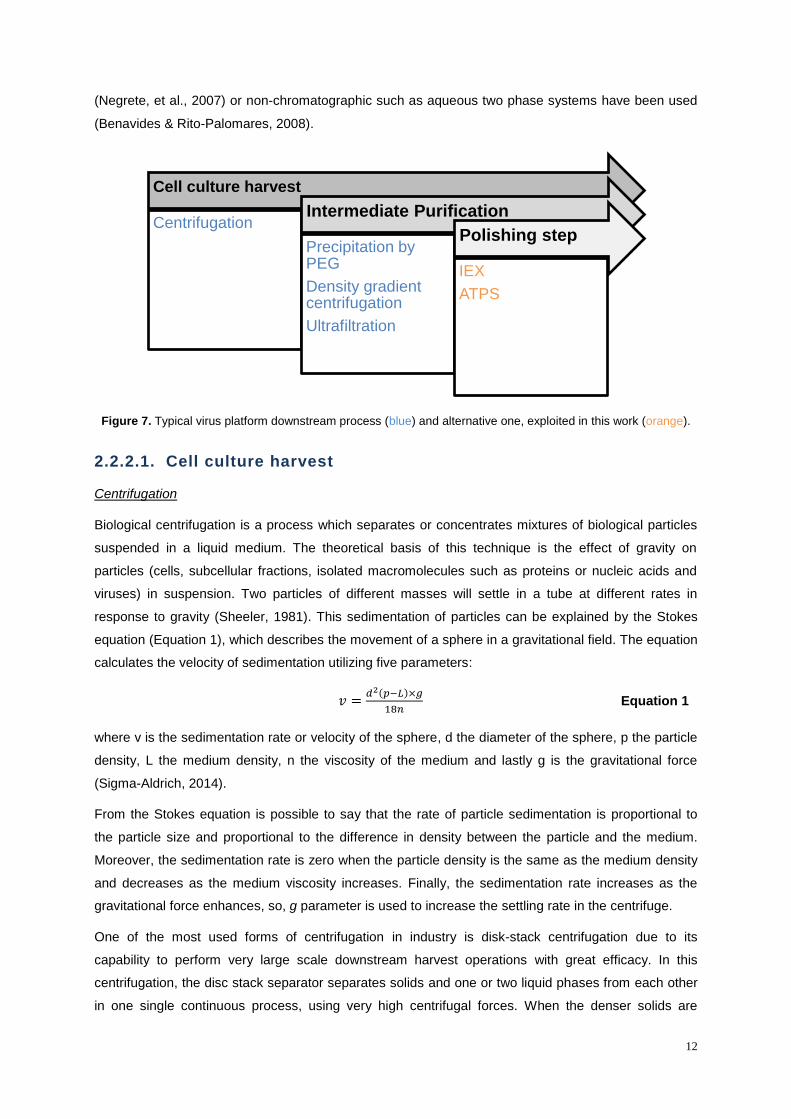
Figure 7. Typical virus platform downstream process (blue) and alternative one, exploited in this work
(orange). ................................................................................................................................................ 12
Figure 8. Separation scheme of biological particles using a density gradient. The sample is carefully
layered on top of preformed density gradient prior to centrifugation. After centrifugation time
separation of the different sized particle was obtained (Walker & Wilson, 2010). ................................ 14
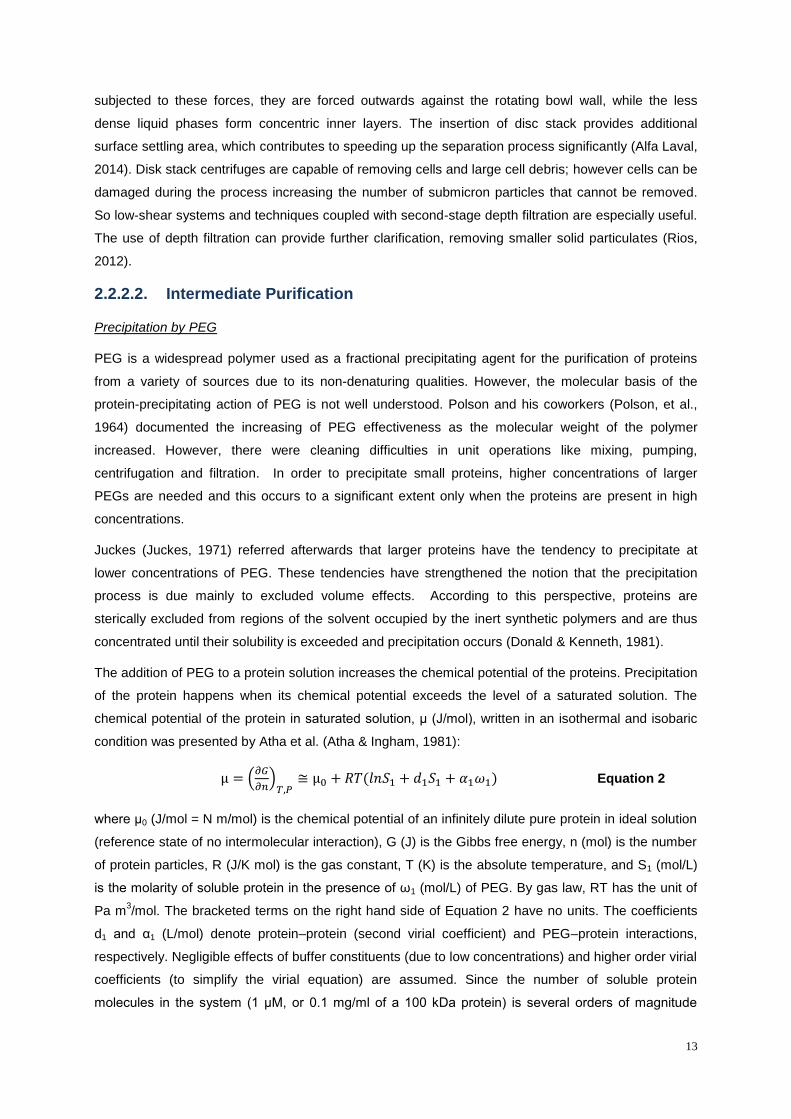
Figure 9. Swinging bucket rotor from Instituto Nacional de Investigação Agrária e Veterinária (INIAV).
............................................................................................................................................................... 15
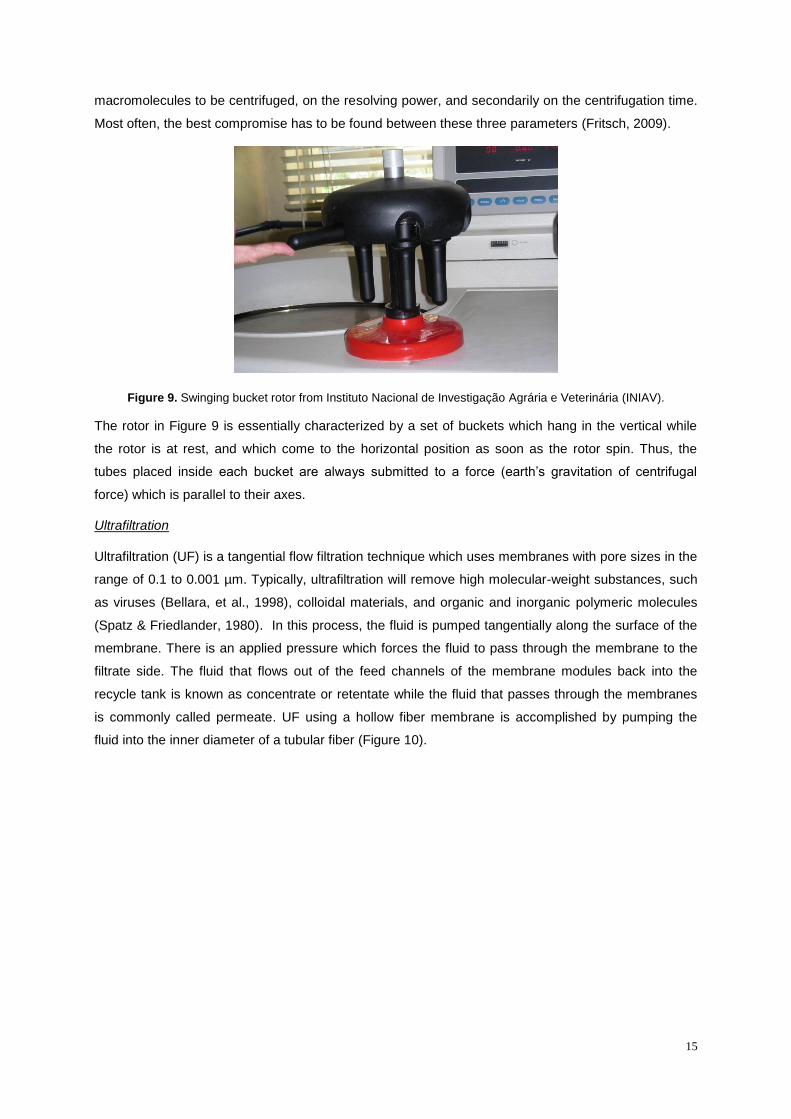
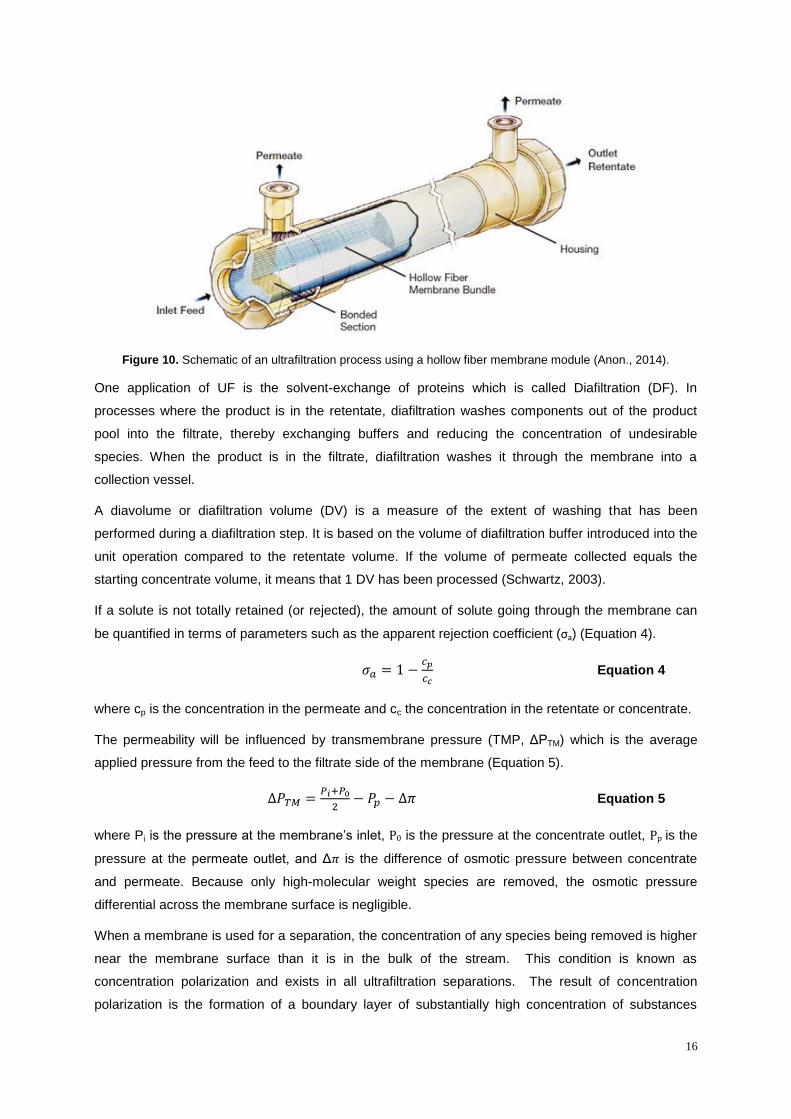
Figure 10. Schematic of an ultrafiltration process using a hollow fiber membrane module (Anon.,
2014). ..................................................................................................................................................... 16
Figure 11. CIM® disks and housing. CIM® disks (left) are white monoliths placed in the middle of the
disk of a non-porous self-sealing ring with different colors according with their ligand chemistry. CIM
disk is inserted in the CIM housing (right) and used as a chromatography column.............................. 21
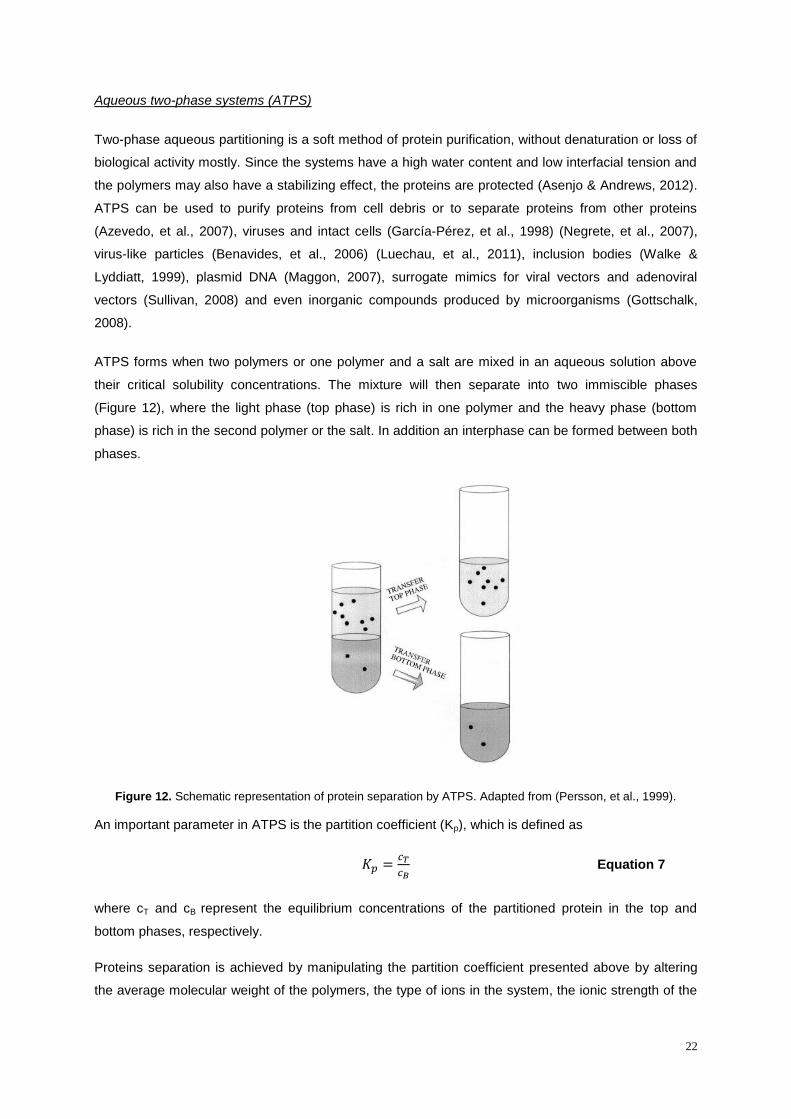
Figure 12. Schematic representation of protein separation by ATPS. Adapted from (Persson, et al.,
1999). ..................................................................................................................................................... 22
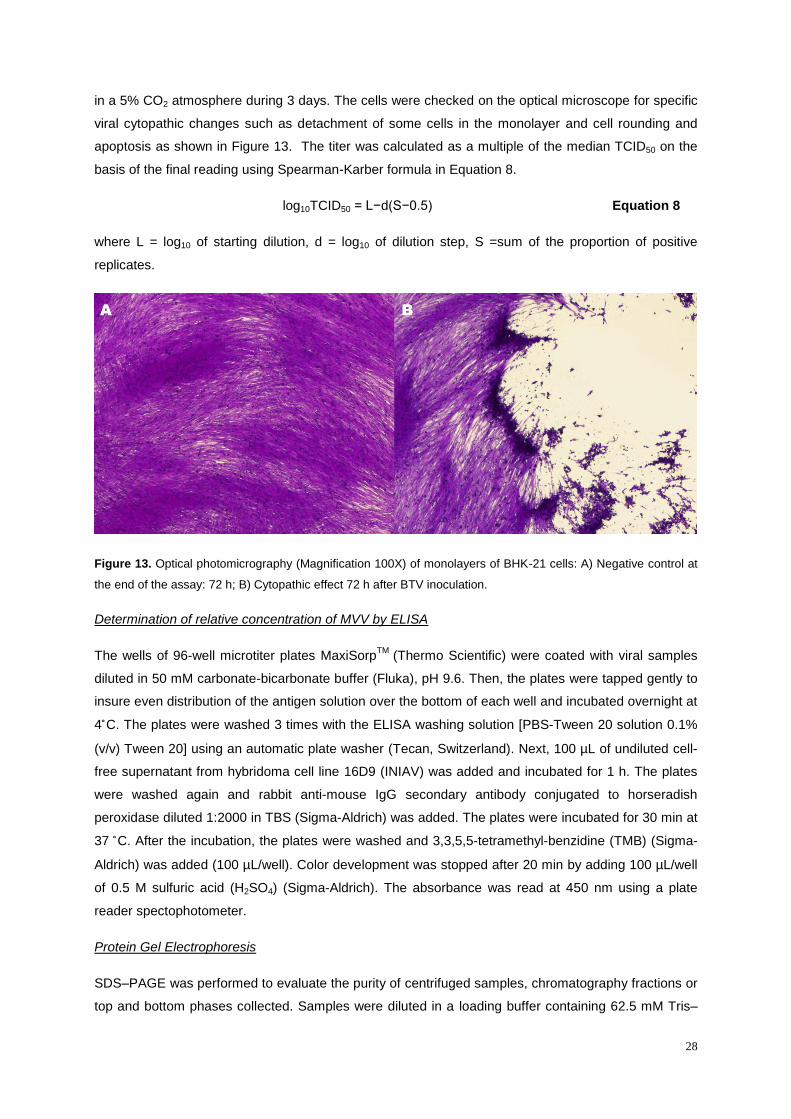
Figure 13. Optical photomicrography (Magnification 100X) of monolayers of BHK-21 cells: A)
Negative control at the end of the assay: 72 h; B) Cytopathic effect 72 h after BTV inoculation. ......... 28
Figure 14. Effect of BTV on cell number and their viability. The viability was measured by trypan blue
cell viability assay. Number of live cells (●); number of dead cells (x); viability (●) as a function of the
time post-infection. ................................................................................................................................ 33
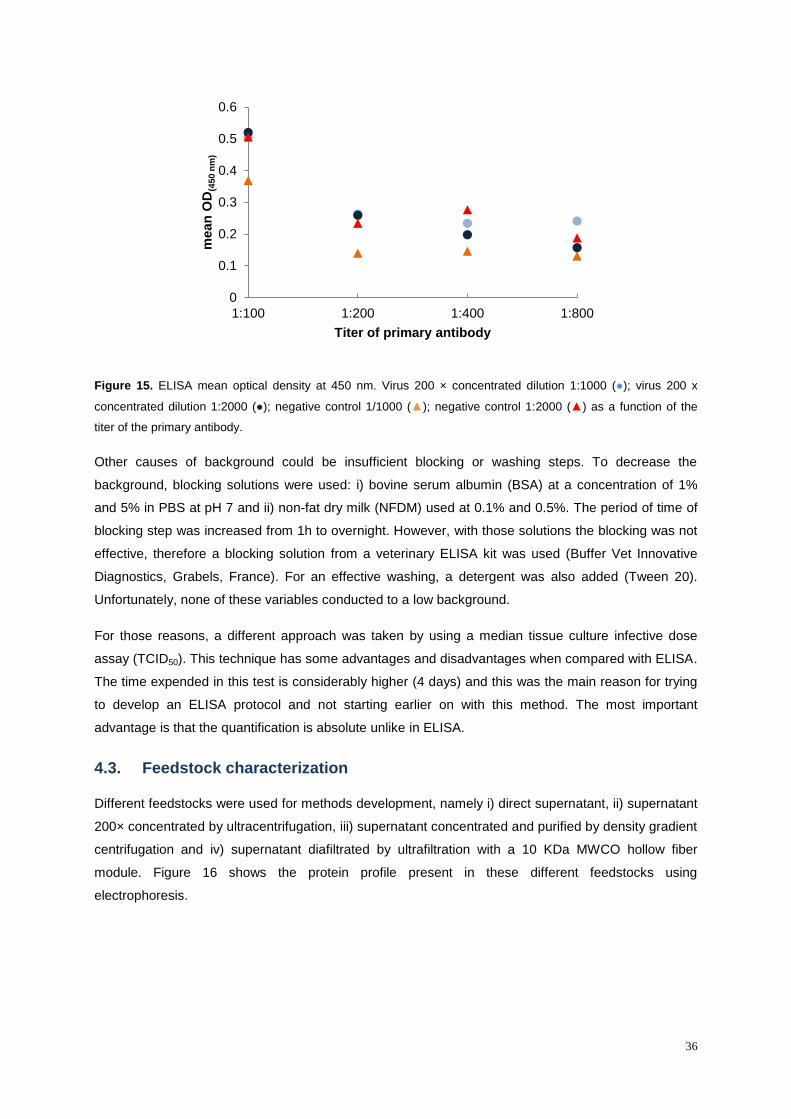
Figure 15. ELISA mean optical density at 450 nm. Virus 200 × concentrated dilution 1:1000 (●); virus
200 x concentrated dilution 1:2000 (●); negative control 1/1000 (▲); negative control 1:2000 (▲) as a
function of the titer of the primary antibody. .......................................................................................... 36
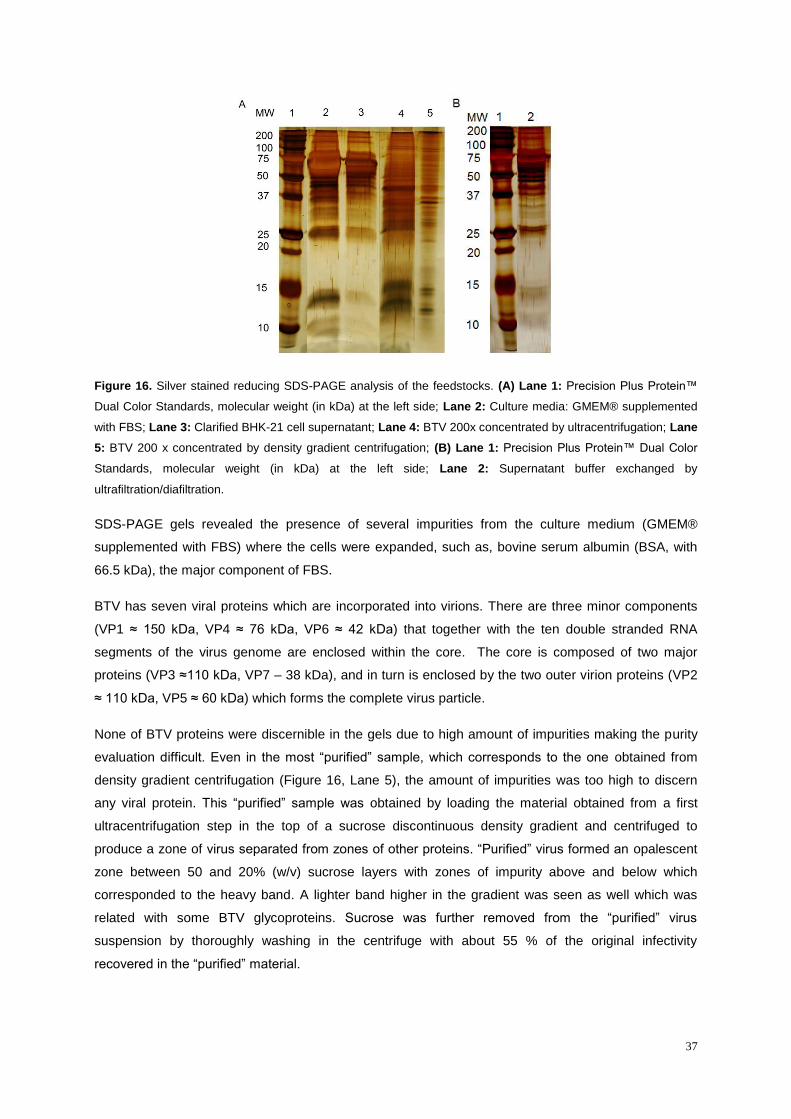
Figure 16. Silver stained reducing SDS-PAGE analysis of the feedstocks. (A) Lane 1: Precision Plus
Protein™ Dual Color Standards, molecular weight (in kDa) at the left side; Lane 2: Culture media:
GMEM® supplemented with FBS; Lane 3: Clarified BHK-21 cell supernatant; Lane 4: BTV 200x
concentrated by ultracentrifugation; Lane 5: BTV 200 x concentrated by density gradient
centrifugation; (B) Lane 1: Precision Plus Protein™ Dual Color Standards, molecular weight (in kDa)
at the left side; Lane 2: Supernatant buffer exchanged by ultrafiltration/diafiltration. ........................... 37
Figure 17. Western blot analyses of the 200× concentrated BTV by ultracentrifugation using anti-BTV-
4 antisera. .............................................................................................................................................. 38
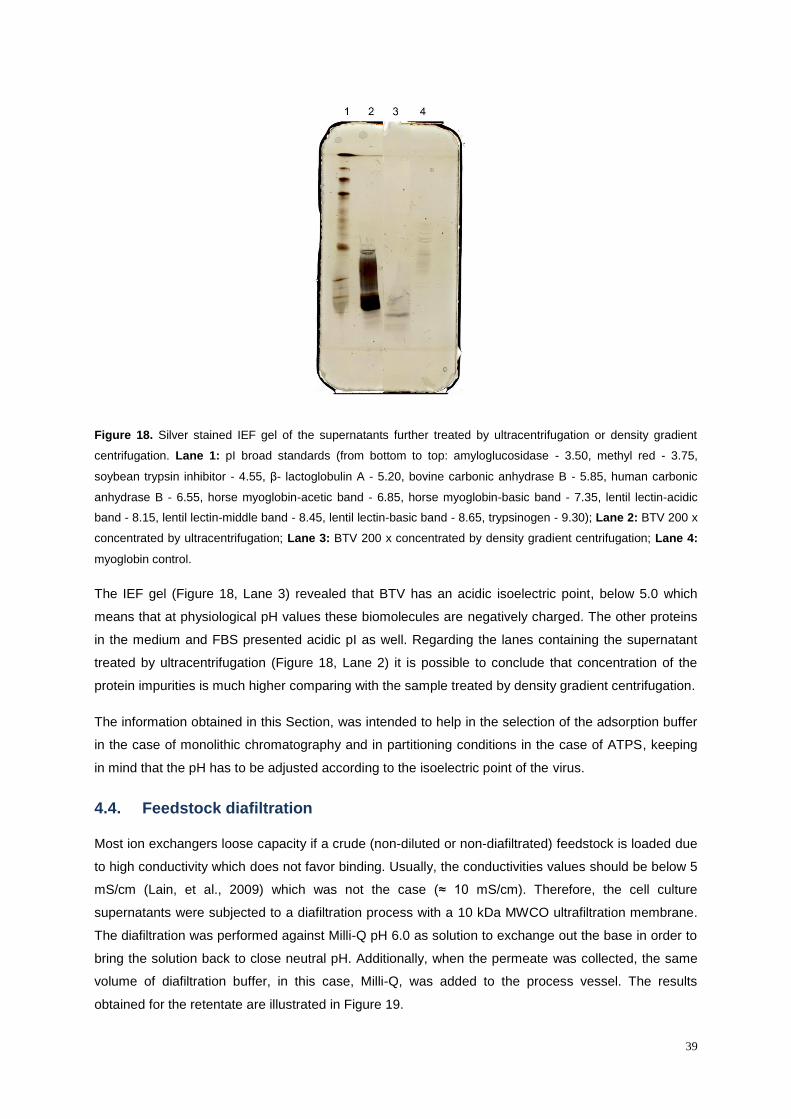
Figure 18. Silver stained IEF gel of the supernatants further treated by ultracentrifugation or density
gradient centrifugation. Lane 1: pI broad standards (from bottom to top: amyloglucosidase - 3.50,
methyl red - 3.75, soybean trypsin inhibitor - 4.55, β- lactoglobulin A - 5.20, bovine carbonic anhydrase
B - 5.85, human carbonic anhydrase B - 6.55, horse myoglobin-acetic band - 6.85, horse myoglobin-
basic band - 7.35, lentil lectin-acidic band - 8.15, lentil lectin-middle band - 8.45, lentil lectin-basic
band - 8.65, trypsinogen - 9.30); Lane 2: BTV 200 x concentrated by ultracentrifugation; Lane 3: BTV
200 x concentrated by density gradient centrifugation; Lane 4: myoglobin control. ............................. 39
Figure 19. Virus titer (●) and conductivity (●) in the retentate as a function of diafiltration volumes for
the BTV supernatant buffer exchanged into Milli-Q water pH 6.0. ........................................................ 40
Page 16
xii
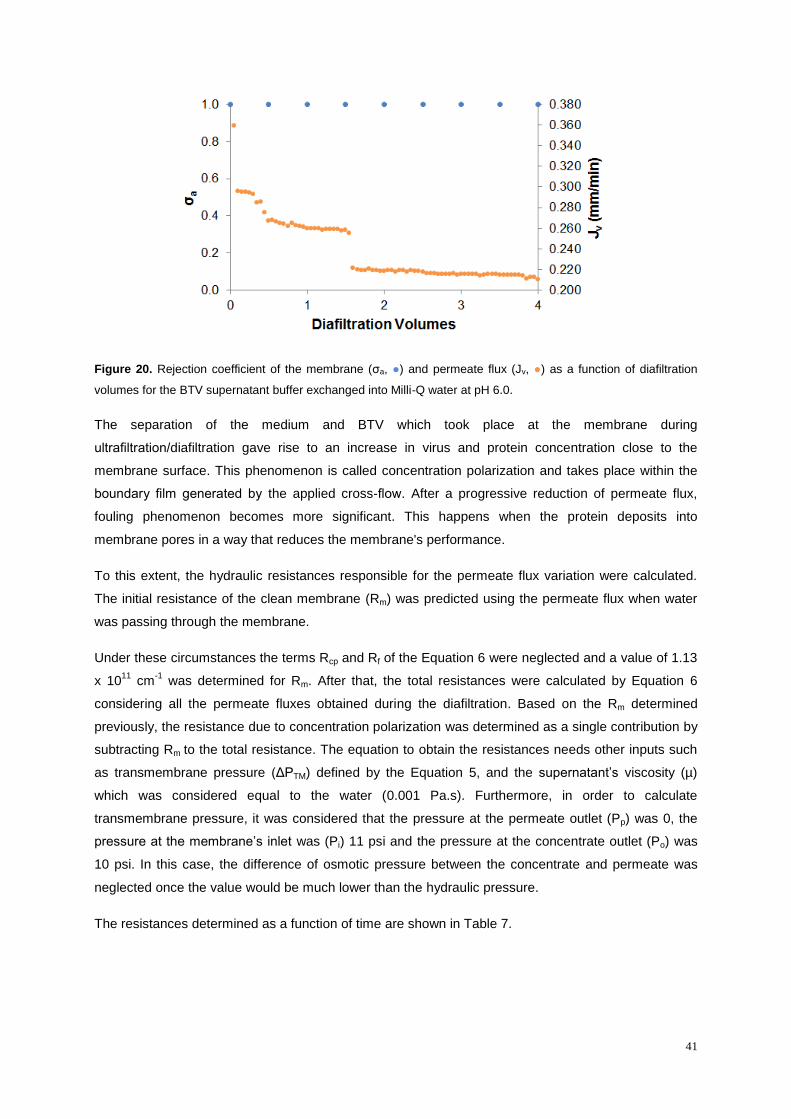
Figure 20. Rejection coefficient of the membrane (σa, ●) and permeate flux (Jv, ●) as a function of
diafiltration volumes for the BTV supernatant buffer exchanged into Milli-Q water at pH 6.0. .............. 41
Figure 21. CIM DEAE® chromatography profile of BTV purification from clarified BHK-21 cell
supernatant, using as adsorption buffer 20 mM NaH2PO4 with 175 or 350 mM NaCl at pH 7.2 and
elution buffer 20 mM NaH2PO4 with 2 M NaCl at pH 7.2. Absorbance at 280 nm (mAU) – dark blue line
(adsorption buffer 20 mM NaH2PO4 with 350 mM NaCl at pH 7.2) and light blue line (adsorption buffer
20 mM NaH2PO4 with 175 mM NaCl at pH 7.2), conductivity (mS/cm) - dashed dark blue line
(adsorption buffer 20 mM NaH2PO4 with 350 mM NaCl at pH 7.2) and dashed light blue line
(adsorption buffer 20 mM NaH2PO4 with 175 mM NaCl at pH 7.2).... ................................................... 43
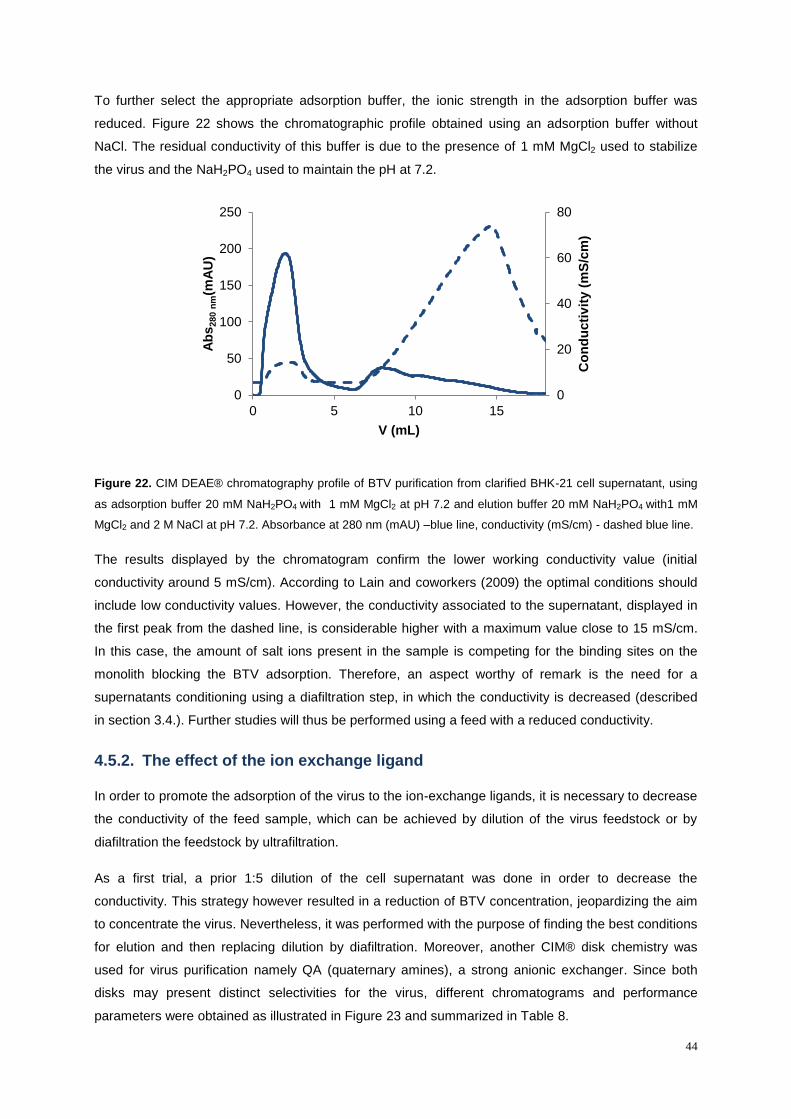
Figure 22. CIM DEAE® chromatography profile of BTV purification from clarified BHK-21 cell
supernatant, using as adsorption buffer 20 mM NaH2PO4 with 1 mM MgCl2 at pH 7.2 and elution
buffer 20 mM NaH2PO4 with1 mM MgCl2 and 2 M NaCl at pH 7.2. Absorbance at 280 nm (mAU) –blue
line, conductivity (mS/cm) - dashed blue line. ....................................................................................... 44
Figure 23. Chromatographic profile of BTV purification from clarified BHK-21 cell supernatant, using
DEAE and QA monolithic supports. Adsorption buffer 20 mM NaH2PO4 and 1 mM MgCl2 at pH 7.2 and
elution buffer 20 mM NaH2PO4 with 1 mM MgCl2 and 2 M NaCl at pH 7.2. Absorbance at 280 nm
(mAU): (-) CIM® QA monolith; (-) CIM® DEAE monolith; (dashed line) conductivity profile. ............... 45
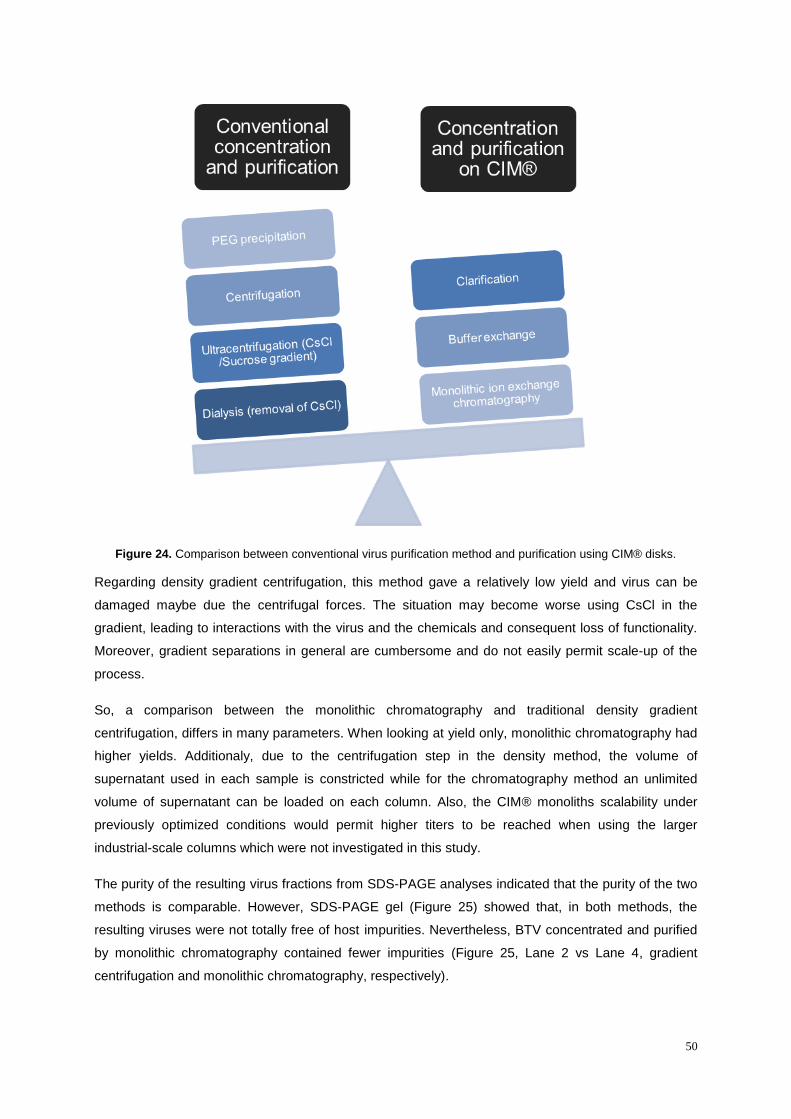
Figure 24. Comparison between conventional virus purification method and purification using CIM®
disks. ...................................................................................................................................................... 50
Figure 25. Silver stained reducing SDS-PAGE analysis of the density gradient centrifugation,
ultrafiltration and eluate from monolithic chromatography. Lane 1: Precision Plus Protein™ Dual Color
Standards, molecular weight (in kDa) at the left side; Lane 2: Density gradient centrifugation 200×
concentrated; Lane 3: ultracentrifugation 200× concentrated; Lane 4: BTV 10× concentrated by
monolithic chromatography using two QA monolithic supports and as adsorption buffer 20 mM
NaH2PO4 at pH 7.2 and elution buffer 20 mM NaH2PO4 with 1 mM MgCl2 at pH 7.2. ...................... 51
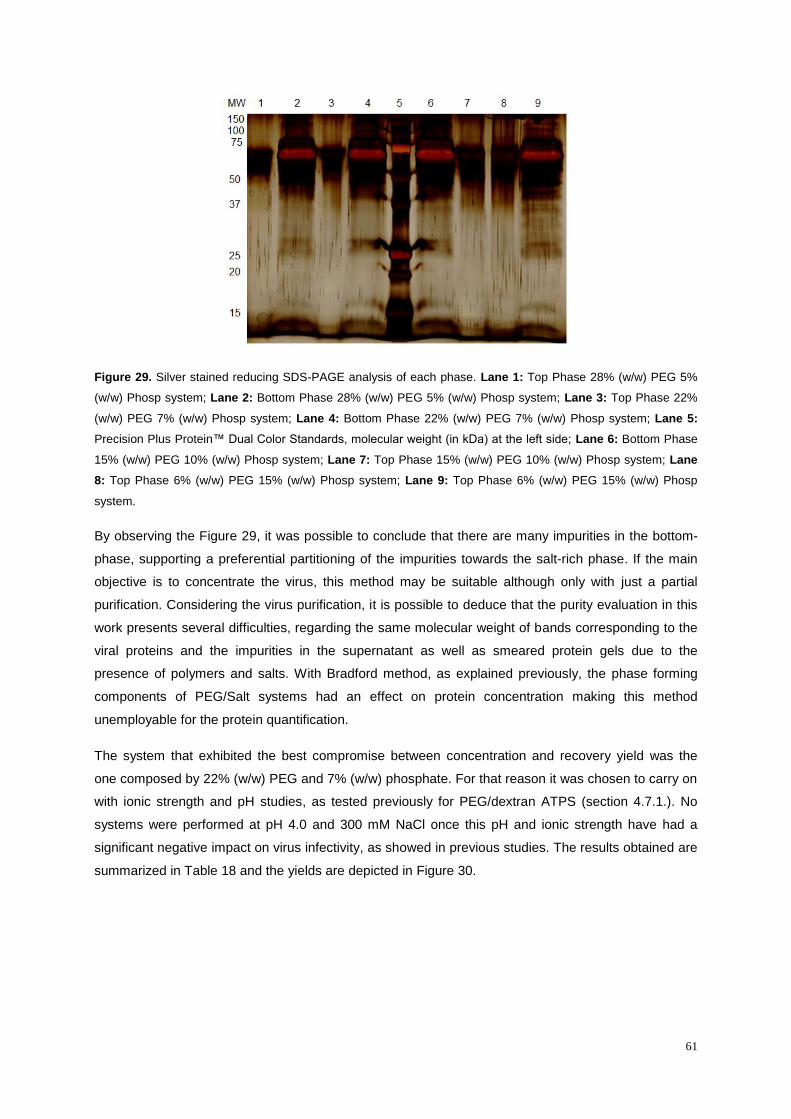
Figure 26. Silver stained reducing SDS-PAGE analysis of each phase. Lane 1: Precision Plus
Protein™ Dual Color Standards, molecular weight (in kDa) at the left side; Lane 2: Top Phase 4%
(w/w) PEG 15% (w/w) Dex system; Lane 3: Bottom Phase 4% (w/w) PEG 15% (w/w) Dex system;
Lane 4: Top Phase 7% (w/w) PEG 9% (w/w) Dex system; Lane 5: Bottom Phase 7% (w/w) PEG 9%
(w/w) Dex system; Lane 6: Top Phase 10% (w/w) PEG 3% (w/w) Dex system; Lane 7: Bottom Phase
10% (w/w) PEG 3% (w/w) Dex system; Lane 8: BTV supernatant.. ..................................................... 54
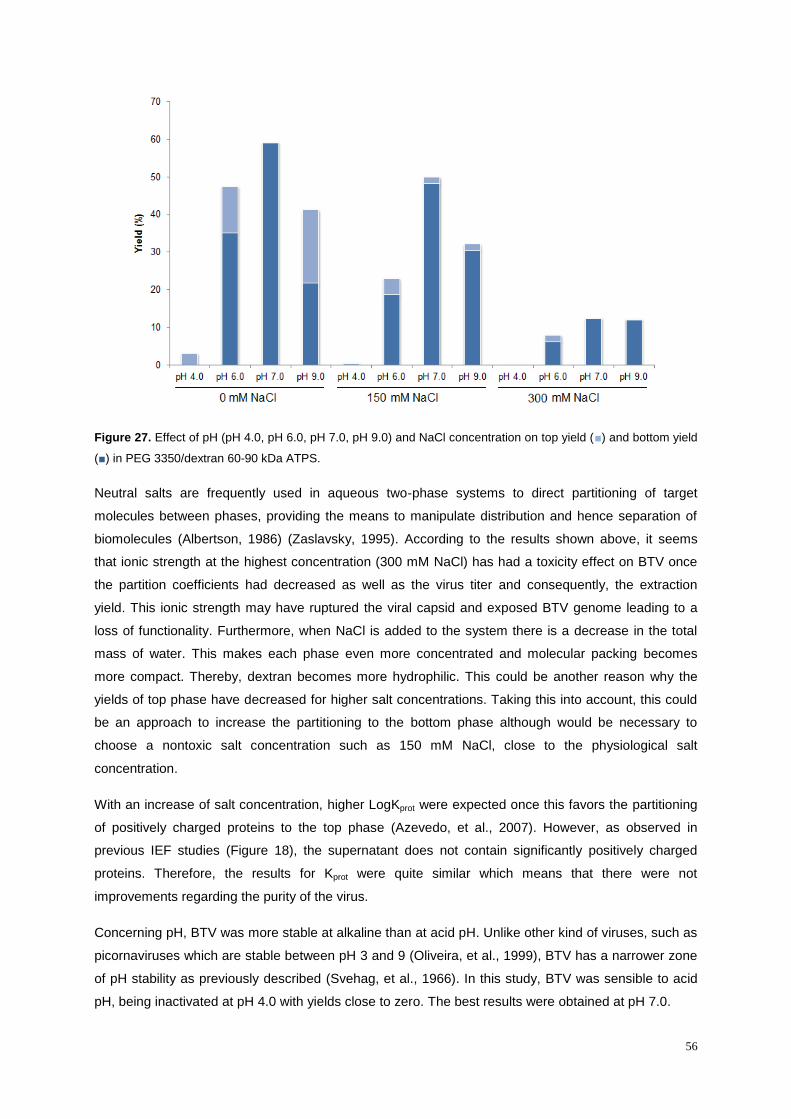
Figure 27. Effect of pH (pH 4.0, pH 6.0, pH 7.0, pH 9.0) and NaCl concentration on top yield (■) and
bottom yield (■) in PEG 3350/dextran 60-90 kDa ATPS. ...................................................................... 56
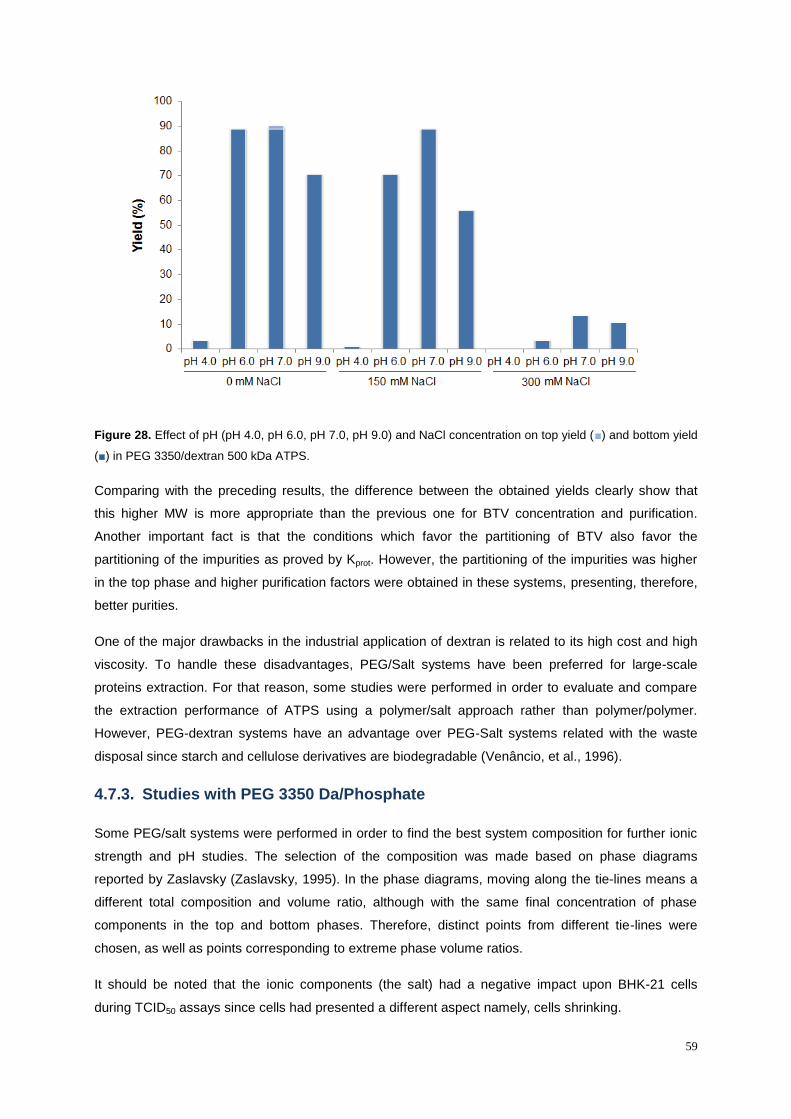
Figure 28. Effect of pH (pH 6.0, pH 7.0 and pH 9.0) and NaCl concentration (0 mM NaCl and 150 mM
NaCl) on top yield (■) and bottom yield (■) in PEG 3350/Phosp ATPS. ............................................... 62
Figure 29. Silver stained reducing SDS-PAGE analysis of the density gradient centrifugation,
ultrafiltration and ATPS best performing systems. Lane 1: Precision Plus Protein™ Dual Color
Standards, molecular weight (in kDa) at the left side; Lane 2: Density gradient centrifugation 200 x
concentrated; Lane 3: ultracentrifugation 200 x concentrated; Lane 4: BTV concentrated by ATPS –
Bottom phase 10% (w/w) PEG 3% (w/w) Dex 60-90 0 mM NaCl pH 7.0 system; Lane 5: BTV
concentrated by ATPS – Bottom phase 10% (w/w) PEG 3% (w/w) Dex 500 kDa, 150 mM NaCl pH 7.0
system; Lane 6: BTV concentrated by ATPS – Bottom phase 22% (w/w) PEG 7% (w/w) Phosp, 0 mM
NaCl pH 7.0 system. .............................................................................................................................. 64
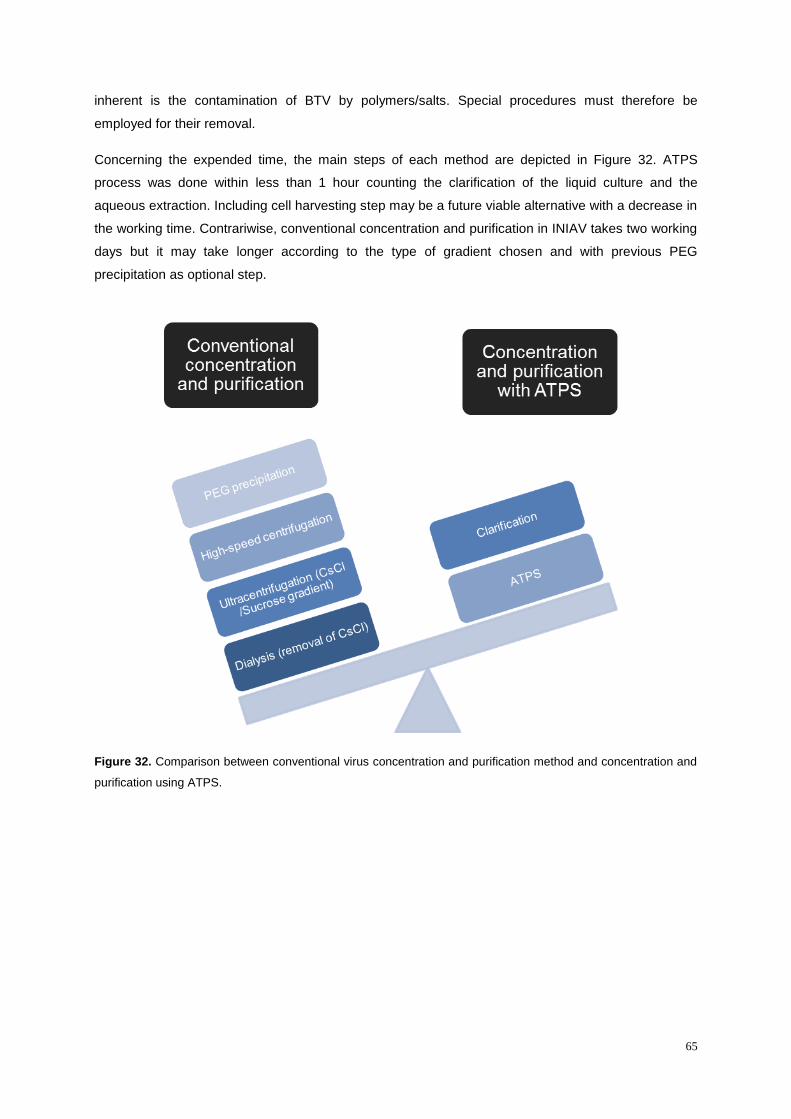
Figure 30. Comparison between conventional virus concentration and purification method and
concentration and purification using ATPS. .......................................................................................... 65
Figure 31. Silver stained reducing SDS-PAGE analysis of the density gradient centrifugation,
ultrafiltration and ATPS best performing systems. Lane 1: Precision Plus Protein™ Dual Color
Standards, molecular weight (in kDa) at the left side; Lane 2: Density gradient centrifugation 200 x
concentrated; Lane 3: ultracentrifugation 200 x concentrated; Lane 4: BTV concentrated by ATPS –
Bottom phase 10% (w/w) PEG 3% (w/w) Dex 60-90 0 mM NaCl pH 7.0 system; Lane 5: BTV
concentrated by ATPS – Bottom phase 10% (w/w) PEG 3% (w/w) Dex 500 kDa, 150 mM NaCl pH 7.0
system; Lane 6: BTV concentrated by ATPS – Bottom phase 22% (w/w) PEG 7% (w/w) Phosp, 0 mM
NaCl pH 7.0 system... ............................................................................................................................ 65
Page 17
xiii
Figure 32. (A) Silver stained and (B) Coomassie stained reducing SDS-PAGE analysis of the
feedstocks. (A) Lane 1: MVV 100x concentrated by ultracentrifugation; Lane 2: MVV 100x
concentrated by density gradient centrifugation; Lane 3: Precision Plus Protein™ Dual Color
Standards, molecular weight (in kDa) at the left side; Lane 4: MVV purified by PEG precipitation; Lane
5: Clarified SCP cell supernatant; Lane 6: DMEM® supplemented with FBS; (B) Lane 1: Precision
Plus Protein™ Dual Color Standards, molecular weight (in kDa) at the left side; Lane 2: Supernatant
buffer exchanged by ultrafiltration/diafiltration. ...................................................................................... 65
Figure 33. Microscopic view of the cytopathic effect. Uninfected cells are shown as the negative
control after 3 days (A), followed by infected cells (B). Magnification 40×.. .......................................... 65
Figure 34. Silver stained IEF gel of the supernatants further treated by ultracentrifugation or density
gradient centrifugation. Lane 1: pI broad standards (from bottom to top: amyloglucosidase - 3.50,
methyl red - 3.75, soybean trypsin inhibitor - 4.55, β- lactoglobulin A - 5.20, bovine carbonic anhydrase
B - 5.85, human carbonic anhydrase B - 6.55, horse myoglobin-acetic band - 6.85, horse myoglobin-
basic band - 7.35, lentil lectin-acidic band - 8.15, lentil lectin-middle band - 8.45, lentil lectin-basic
band - 8.65, trypsinogen - 9.30); Lane 2: MVV 100 x concentrated by density gradient centrifugation;
Lane 3: BTV 100 x concentrated by ultracentrifugation; Lane 4: PEG-precipitated MVV.. ................... 69
Figure 35. Western blot analyses of the 100× concentrated MVV by density gradient using anti-WLC-1
MVV antisera... ...................................................................................................................................... 70
Figure 36. Silver stained IEF gel of the supernatants further treated by ultracentrifugation or density
gradient centrifugation. Lane 1: pI broad standards (from bottom to top: amyloglucosidase - 3.50,
methyl red - 3.75, soybean trypsin inhibitor - 4.55, β- lactoglobulin A - 5.20, bovine carbonic anhydrase
B - 5.85, human carbonic anhydrase B - 6.55, horse myoglobin-acetic band - 6.85, horse myoglobin-
basic band - 7.35, lentil lectin-acidic band - 8.15, lentil lectin-middle band - 8.45, lentil lectin-basic
band - 8.65, trypsinogen - 9.30); Lane 2: MVV 100× concentrated by density gradient centrifugation;
Lane 3: BTV 100× concentrated by ultracentrifugation; Lane 4: PEG-precipitated MVV... .................. 70
Figure 37. Virus relative titer by ELISA meanOD at 450 nm (●) and conductivity (●) in the retentate as
a function of diafiltration volumes for the BTV supernatant buffer exchanged into Milli-Q water pH 6.0..
............................................................................................................................................................... 71
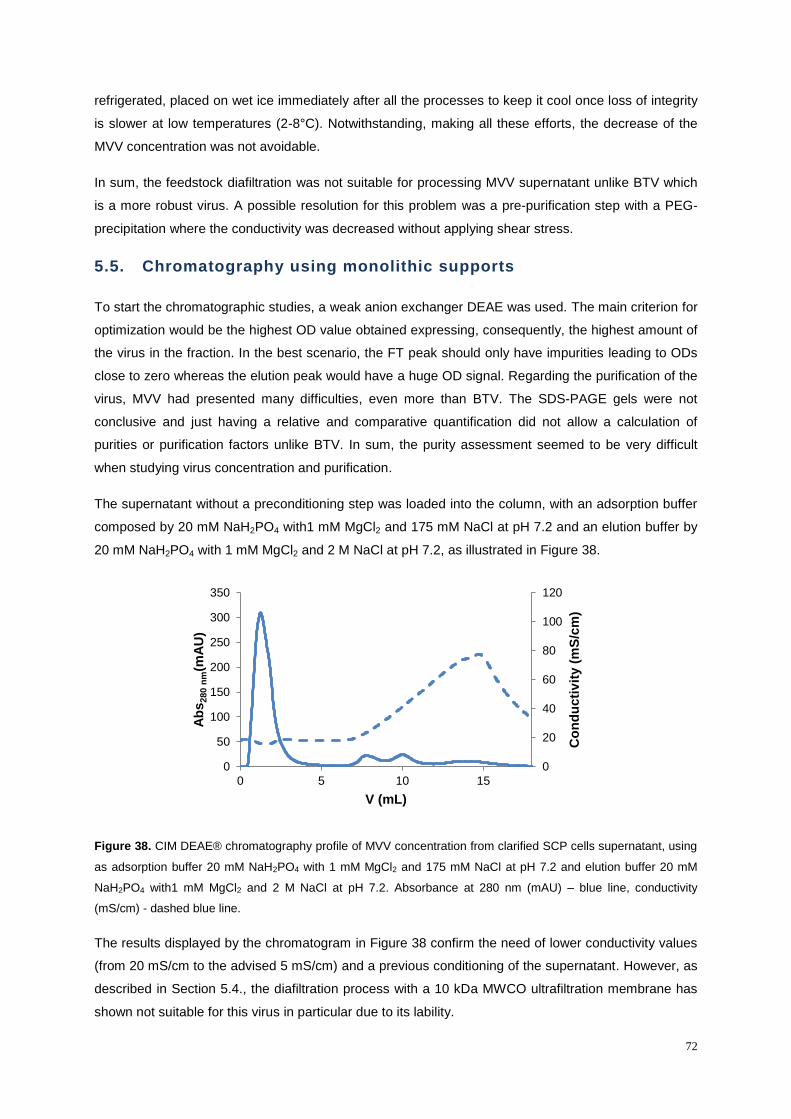
Figure 38. CIM DEAE® chromatography profile of MVV concentration from clarified SCP cells
supernatant, using as adsorption buffer 20 mM NaH2PO4 with 1 mM MgCl2 and 175 mM NaCl at pH
7.2 and elution buffer 20 mM NaH2PO4 with1 mM MgCl2 and 2 M NaCl at pH 7.2. Absorbance at 280
nm (mAU) – blue line, conductivity (mS/cm) - dashed blue line... ........................................................ 72
Figure A1. Typical calibration curve used for total protein quantification, obtained from BSA standards
with concentrations ranging from 5 mg/L to 400 mg/L.. ........................................................................ 89
Page 19
xv
List of Abbreviations
AEX Anion exchange chromatography
ATPS Aqueous two-phase systems
BHK Baby-hamster-kidney
BP Bottom phase
BSA Bovine serum albumin
CIM® Convection interaction media
CV Column volume
DEAE Diethyl amine
DF Diafiltration
DMEM Dulbecco’s Modiffied Essential Medium
dsp Downstream process
DV Diafiltration volume
E Elution
EDTA Ethylenediaminetetraacetic acid
e.g. exempli gratia
ELISA Enzyme linked immunoadsorbent assay
FBS Fetal bovine serum
FT Flow through
HIV Human immunodeficiency virus
i.e. id est
IEF Isoelectricfocusing
IEX Ion exchange chromatography
ITP Interphase
LC Liquid chromatography
mAbs Monoclonal antibodies
MC Membrane chromatography
MVV Maedi Visna virus
MW Molecular weight
MW Molecular weight cut-off
NaCl Sodium chloride
PBS Phosphate buffered saline
PEG Polyethylene glycol
pI Isoelectric point
QA Quaternary amine
RT Room temperature
SCP Sheep Choroid Plexus
SDS-PAGE Sodium dodecyl sulphate-polyacrylamid gel electrophoresis
TBS Tris-buffered saline
Page 20
xvi
TTBS Tris-buffered saline and Tween 20
TMP Transmembrane pressure
TP Top phase
Page 21
xvii
Nomenclature
E: Eluate
FT: Flowthrough
OD: optical density
Kp: partition coefficient of the virus
PF : Purification factor
TCID50: Tissue Culture Infective Dose
Vr: volume ratio
Y: extraction yield
Page 23
1. Introduction
1.1. State-of-the art
Recently, the successful purification of virus is a key feature in the production of viral vaccines and
gene delivery vehicles in the biopharmaceutical industry. However, a cost effective downstream
process is still a challenge and a mandatory requirement to manufacture these products.
During the last years, traditional methods based on ultracentrifugation and packed bed
chromatography have been the main process used, mainly due to its simplicity and high resolution
power. Nevertheless, there is an interest in alternative separation methods due to high costs, batch
operation, low throughput and complex scale-up involved in both technologies (Przybycien, et al.,
2004). The liquid-liquid extraction using aqueous two-phase systems (ATPS) has been recently
revisited to successfully recover bioproducts on a large scale with excellent levels of purity and yield
(Negrete, et al., 2007) (Rosa, et al., 2013) looking, therefore, promising in this field.
In the area of chromatography, the past 20 years have witnessed an increasing development of
alternative supports to the traditional packed-beds, namely membranes and monoliths. These
convective-flow media have unique architectures that offer compelling performance features offering
substantial advantages in binding capacity and throughput in addition to convenient handling (Gagnon,
2008).
The practical application of ATPS has been demonstrated in many cases including a number of
industrial applications such as the purification of human antibodies (Rosa, et al., 2013), the large scale
“in situ” purification of IGF-1 carried out by Genentech and the one of the most successful industrial
application of this technology, chymosin purification from recombinant Aspergillus supernatant (Asenjo
& Andrews, 2012). Furthermore, this separation and purification has also been successfully used for
virus and virus-like particles. Examples include recombinant VLPs from yeast and insect cells (Asenjo
& Andrews, 2012) (Luechau, et al., 2011), bacteriophage T4 (Negrete, et al., 2007) among others.
Regarding the application of monolithic chromatography to the purification of virus, in 2005, live
attenuated replication-defective Influenza Vaccine project from Green Hills Biotechnology were
granted funding from European Commission working with different partner institutions both from
academia and biotech industry in different European countries highlighting the importance of this
technology. Later on, in 2011, Forcic and coworkers proved the applicability of the monolithic anion
exchange in the purification of rubella virus with viral recoveries of almost 100%. In 2012, Bamford
and his coworkers purified bacteriophage PDR1.
To acknowledge the importance of this emerging technique in virus purification, in 2007, Professor
Georges Guiochon had summarized, in one sentence, the current interest of the scientific community:
“…monolithic columns will, someday, become the main workhorse of chromatographic separation.”
(Guiochon, 2007).
Page 24
2
1.2. Objectives
This work specifically aims to: i) execute the upstream process of mammalian cell culture-based
viruses mainly Bluetongue and Maedi Visna virus and ascertain any differences; ii) viruses
downstream processing based on alternative methods namely monolithic chromatography and
extraction in aqueous two-phase systems (ATPS) iii) optimization of the monolithic chromatography
and ATPS changing several parameters; iv) comparison between both technologies and conventional
methods for virus recovery and purification; v) comparison between both viruses results in order to
generalize the downstream processing to other viruses.
This work is expected to be useful in the design and production of vaccines, gene delivery vehicles
and in the scientific understanding of viral purification strategies.
Page 25
3
2. Literature review
2.1. Viruses: General remarks and applications
The evolution of pathogenic virus infections like influenza and HIV has created an urgent need to stop
diseases before they emerge through vaccines production. The size of vaccines market is about 2-3%
in the global pharmaceutical market although with a spectacular growth rate of 10-15% per year
versus 5-7 % for other pharmaceuticals (WHO, 2013).
The progress in vaccine research is likely to be seen as one of the crucial progresses of the early 21st
century. For companies that come up with breakthroughs, the rewards can be enormous. Merck's
Gardisil, which prevents the spread of human papillomavirus (HPV), accomplished more than $1
billion in sales in 2013 (Merck, 2013). Pfizer's Prevnar 13, which helps preventing invasive
pneumococcal disease, is expected to surpass $5 billion in annual sales within a few years (Pfizer,
2012). Furthermore, Influenza vaccine market is estimated at $2.9 billion in 2011 to $3.8 billion by
2018 (WHO, 2013). The World Health Organization estimates that the global vaccine market grew
from $5 billion in 2000 to $24 billion in 2013 - and could hit $100 billion by 2025.
Another field where viruses look promising is gene therapy. The market for gene therapy is
challenging to estimate as there is only one approved gene therapy product and it is marketed in
China since 2004 (Jain PharmaBiotech, 2014). Due some unsuccessful cases, gene therapy had
pretty much dropped off the biotechnology industry. Genzyme and Pfizer in the U.S. and Novartis in
Europe are bringing back gene therapy to the market. California Global Industry Analysts forecast that
sales of gene-based therapies could exceed $465 million annually by the year 2015
(BloombergBusinessweek, 2010).
Viruses have been used extensively over the last years due to their many attractive features including
(i) nanometer size range, (ii) high degree of symmetry and polyvalency, (iii) low polydispersity, (iv)
efficient and inexpensive production, and (v) biocompatibility. Thousands of virus species have been
identified and as a result provided an enormous variety of potential platforms for applying
nanotechnology and pairing inherent properties of viruses with the most appropriate application
(Kristopher & Manchester, 2010).
A virus consists of a protein shell called the capsid surrounding a genome composed by RNA or DNA.
The particle is called a virion and, unlike a living cell, has no way to make its own energy or duplicate
its own genome. The virus relies on the host to do this work. As viruses do not have their own
metabolism, inhibitors such as antibiotics have no effect on them as there is no metabolism to be
disrupted. The only point of possible interventions is viral interaction with the host (Reinhard, 2008).
Viruses come in many different types and can inhabit every living organism from bacteria to humans to
plants. Viral diseases in humans are very common, and most cause only minor symptoms. For
example, when rhinovirus invades a host, the victim ends up with a runny nose as with other cold
symptoms and usually feels miserable for a few days. However, some viruses do cause a significant
Page 26
4
number of serious diseases, such as human immunodeficiency virus (HIV), smallpox (Variola),
hepatitis or ebola hemorrhagic fever.
The great variety of viruses can be divided into groups based on capsid shape or type of genome. The
three major shapes are spherical, filamentous, and complex. Complex viruses come in various
shapes, but some have “legs” that attach to the host cell, a linear segment that injects the DNA or
RNA genome into the host, and a structure that stores the viral genome. This type of complex virus is
common among bacteriophages.
Viral genomes are varied in size, but all contain sufficient genetic information to get the host cell make
more copies of the virus genome and make more capsid proteins to pack it. At the very least, a virus
needs a gene to replicate its genome, a gene for capsid protein, and a gene to release new viruses
from the host cell (Clark & Pazdernik, 2012).
The viruses provide a diverse array of shapes as rods and spheres, and a variety of sizes spanning
from tens to hundreds of nanometers (Table 1).
Table 1. Examples of some viruses: name, features and structure. Content from (SIB Swiss Institute of
Bioinformatics, 2014).
Name Features Structural illustration
Herpesvirus
double-stranded DNA;
enveloped; 150-200 nm
Reovirus
double-stranded DNA;
nonenveloped; 70-80 nm
Tobacco Mosaic Virus
single-stranded RNA;
nonenveloped; 18 nm
Page 27
5
Viruses have been previously used as vaccine carriers and gene therapy vectors and play an
important role in current medical approaches. Viral vectors like adenoviruses, adeno associated
viruses, or retro-viruses are the vehicles being developed for delivering genetic material to the target
cell in gene therapy. Viral vaccines, such as attenuated or inactivated rabies virus, influenza virus, or
hepatitis virus are powerful tools used nowadays (Arvina & Greenberg, 2006). Moreover, viruses are
used in molecular and cellular biology research as well as in genetic engineering (Lodish, et al., 2000).
2.1.1. Understanding Bluetongue virus: virology, pathogenesis and epidemiology
Bluetongue virus (BTV) is an economically important orbivirus of the Reoviridae family which causes
disease in domestic and wild ruminants, mainly in sheep and less frequently in cattle, goats, buffalo,
deer, dromedaries and antelope (Sperlova & Zendulkova, 2011). It is not known to affect humans
therefore is not a significant threat to human health.
BTV is mostly transmitted by biting midges, small (0.3 mm) haematophagous insects of the genus
Culicoides. The genus Culicoides include, at the present, 1300 to 1400 species, but only about 30 of
them are BTV vectors (Meiswinkel, et al., 2004).
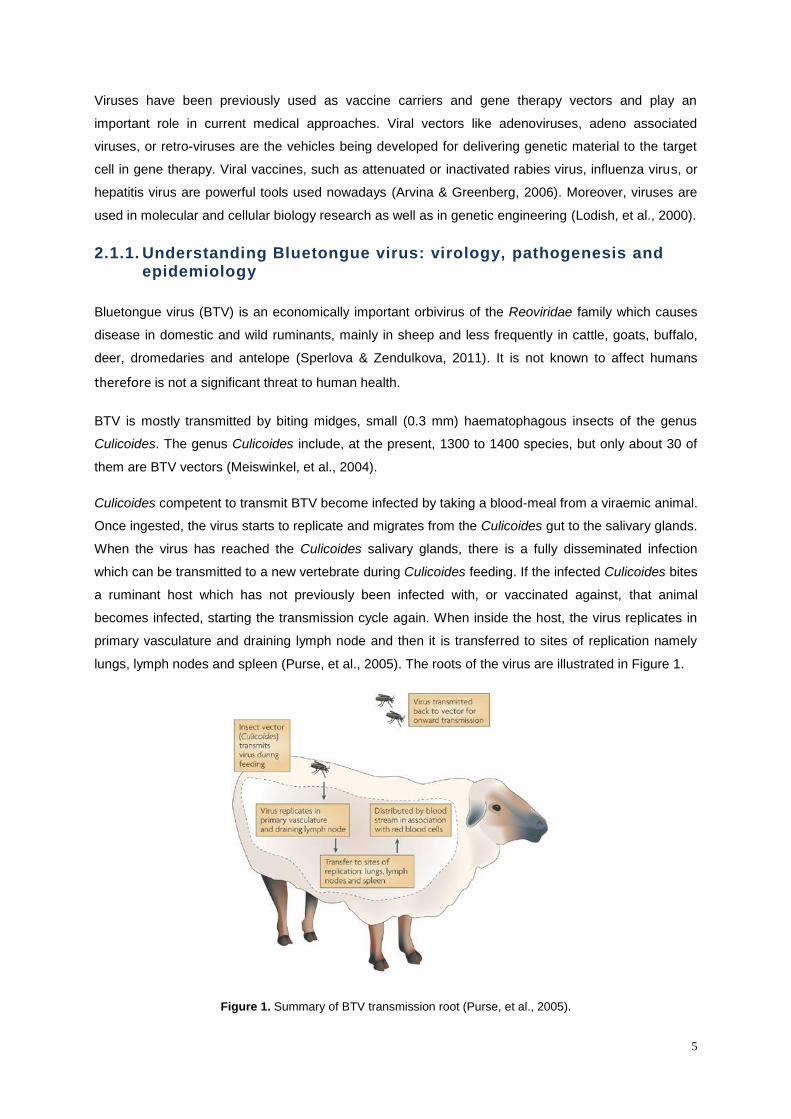
Culicoides competent to transmit BTV become infected by taking a blood-meal from a viraemic animal.
Once ingested, the virus starts to replicate and migrates from the Culicoides gut to the salivary glands.
When the virus has reached the Culicoides salivary glands, there is a fully disseminated infection
which can be transmitted to a new vertebrate during Culicoides feeding. If the infected Culicoides bites
a ruminant host which has not previously been infected with, or vaccinated against, that animal
becomes infected, starting the transmission cycle again. When inside the host, the virus replicates in
primary vasculature and draining lymph node and then it is transferred to sites of replication namely
lungs, lymph nodes and spleen (Purse, et al., 2005). The roots of the virus are illustrated in Figure 1.
Figure 1. Summary of BTV transmission root (Purse, et al., 2005).
Page 28
6
Infection with BTV results in reddening (hyperaemia) and swelling (oedema) of the lips, mouth, nasal
linings and eyelids (Figure 2). Animals may have quickened breathing. Nasal discharges, excess
salivation and frothing are common clinical signs. Animals can lose condition rapidly, including muscle
degeneration. All ruminant species can be infected by BTV, although clinical signs of the disease are
usually restricted to exploration breeds of sheep.
Figure 2. Clinical signs of the disease namely reddening and swelling of the lips, mouth, nasal linings and eyelids
(Baynard, 2010).
26 serotypes of BTV have been reported around the world. Due to its economic impact, BTV is an
Office International des Epizooties (OIE)-listed disease. Economic losses associated with BTV
infection are caused directly through reductions in productivity and death and more importantly
indirectly through trade losses due to animal movement restrictions, restrictions on the export of cattle
semen and the costs of implementing control measures, including diagnostic tests (Sperlova &
Zendulkova, 2011).
In 2007, a BTV-8 serotype outbreak in France was estimated to cost US$1.4 billion. Economic losses
were mainly due to the inability to trade cattle, a very substantial industry in France, on the
international market. In 2007 a BTV-8 outbreak in the Netherlands cost approximately US$85 million.
In the eastern Mediterranean, a bluetongue episystem has been accepted since the first half of the
20th century. Bluetongue became endemic in the eastern Mediterranean Basin with sporadic spillovers
in Cyprus, Greece, Spain and Portugal. Portugal was involved in the 2004 epidemic of BTV-4 that
affected the Iberian Peninsula. In the same way, in Spain, vaccination of all sheep and cattle to be
moved was performed with modified live virus and inactivated vaccines (Caporale, 2008). Both
countries announced as free of this serotype in March 2010. However in 2011, there was an outbreak
of serotype 1 in Portugal, as well as two outbreaks in 2012 specifically in Idanha-a-Nova, Castelo
Branco and Vila Velha de Ródão where the vaccination is still mandatory up to date (Ministério da
Agricultura, Mar, Ambiente e Ordenamento do Território, 2013).
Considering the structure, BTV is a non-enveloped virus, 90 nm in diameter, with a triple-layered
icosahedral protein capsid (Venkataram, Yamaguchi, & Roy, 1992) (Peter & Diprose, 2004) (Roy &
Page 29
7
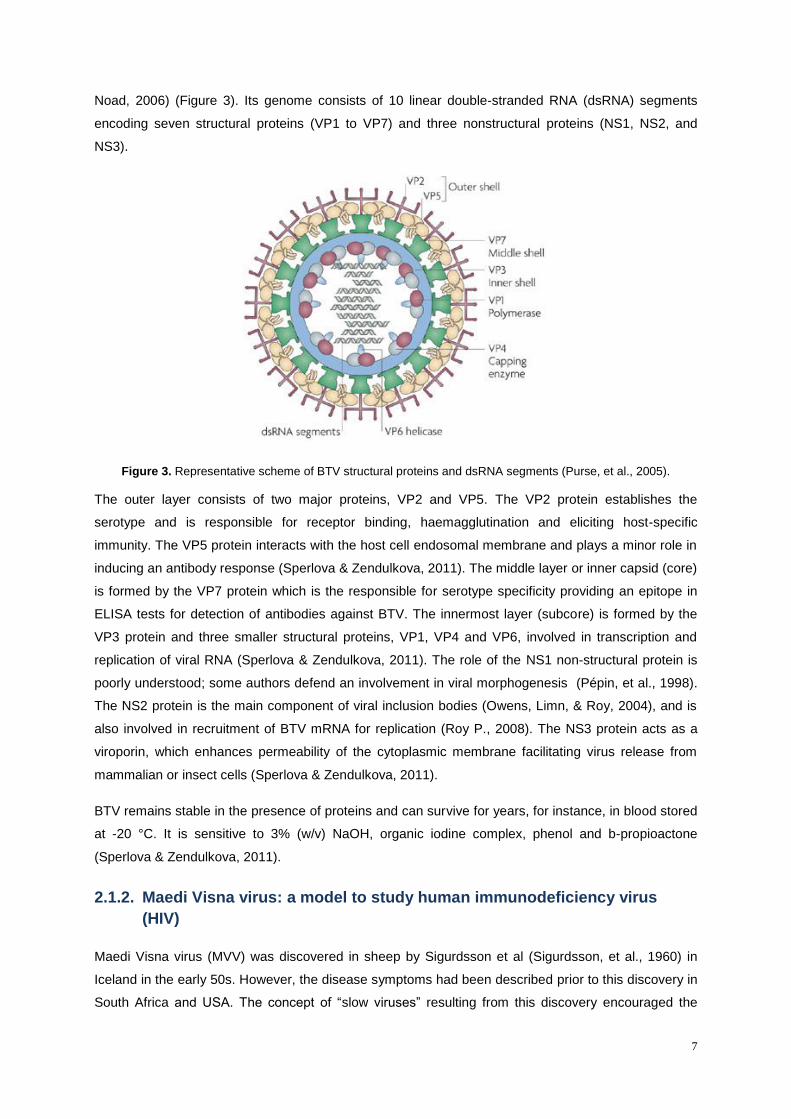
Noad, 2006) (Figure 3). Its genome consists of 10 linear double-stranded RNA (dsRNA) segments
encoding seven structural proteins (VP1 to VP7) and three nonstructural proteins (NS1, NS2, and
NS3).
Figure 3. Representative scheme of BTV structural proteins and dsRNA segments (Purse, et al., 2005).
The outer layer consists of two major proteins, VP2 and VP5. The VP2 protein establishes the
serotype and is responsible for receptor binding, haemagglutination and eliciting host-specific
immunity. The VP5 protein interacts with the host cell endosomal membrane and plays a minor role in
inducing an antibody response (Sperlova & Zendulkova, 2011). The middle layer or inner capsid (core)
is formed by the VP7 protein which is the responsible for serotype specificity providing an epitope in
ELISA tests for detection of antibodies against BTV. The innermost layer (subcore) is formed by the
VP3 protein and three smaller structural proteins, VP1, VP4 and VP6, involved in transcription and
replication of viral RNA (Sperlova & Zendulkova, 2011). The role of the NS1 non-structural protein is
poorly understood; some authors defend an involvement in viral morphogenesis (Pépin, et al., 1998).
The NS2 protein is the main component of viral inclusion bodies (Owens, Limn, & Roy, 2004), and is
also involved in recruitment of BTV mRNA for replication (Roy P., 2008). The NS3 protein acts as a
viroporin, which enhances permeability of the cytoplasmic membrane facilitating virus release from
mammalian or insect cells (Sperlova & Zendulkova, 2011).
BTV remains stable in the presence of proteins and can survive for years, for instance, in blood stored
at -20 °C. It is sensitive to 3% (w/v) NaOH, organic iodine complex, phenol and b-propioactone
(Sperlova & Zendulkova, 2011).
2.1.2. Maedi Visna virus: a model to study human immunodeficiency virus
(HIV)
Maedi Visna virus (MVV) was discovered in sheep by Sigurdsson et al (Sigurdsson, et al., 1960) in
Iceland in the early 50s. However, the disease symptoms had been described prior to this discovery in
South Africa and USA. The concept of “slow viruses” resulting from this discovery encouraged the
Page 30
8
name of the lentivirus [lentus (latin) means slow] genus of which MVV is a member. There are two
distinct pathological situations, corresponding to the main clinical manifestations of MVV infection: the
first, called maedi (“dyspnea” in Icelandic), is a progressive pneumonia and the second, called visna
(“fading away – state of progressive apathy” in Icelandic), is a demyelinating leukoencephalomyelitis
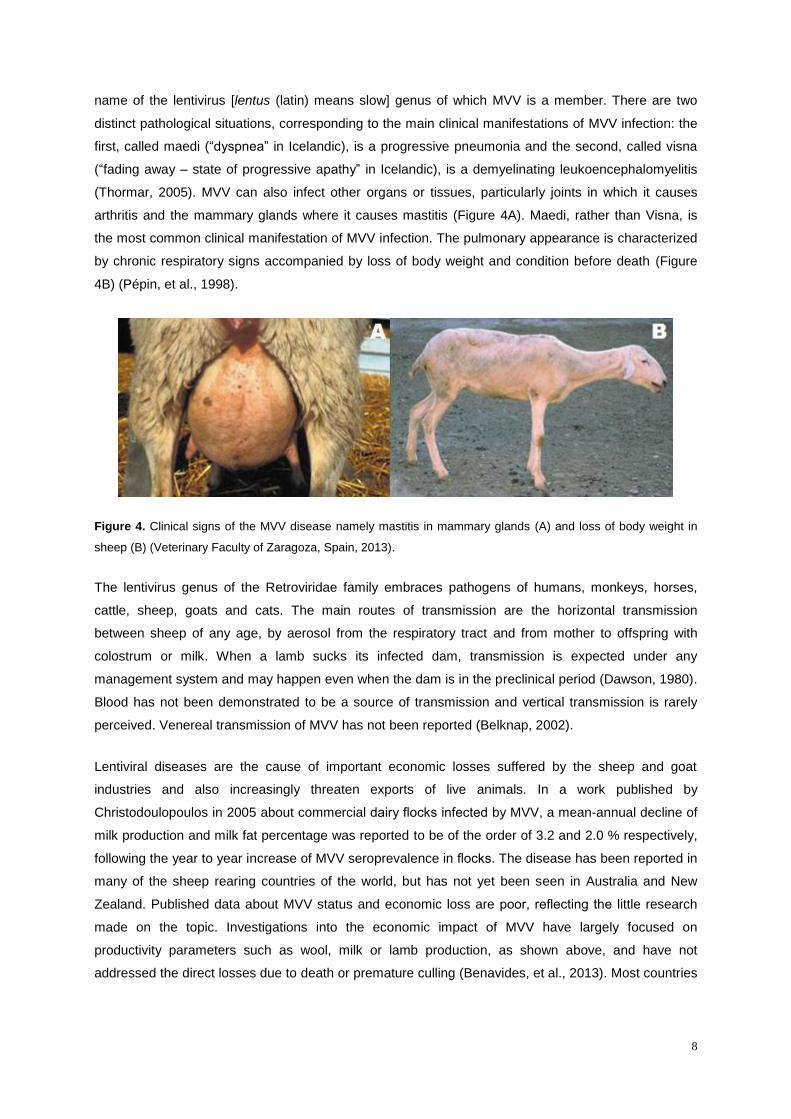
(Thormar, 2005). MVV can also infect other organs or tissues, particularly joints in which it causes
arthritis and the mammary glands where it causes mastitis (Figure 4A). Maedi, rather than Visna, is
the most common clinical manifestation of MVV infection. The pulmonary appearance is characterized
by chronic respiratory signs accompanied by loss of body weight and condition before death (Figure
4B) (Pépin, et al., 1998).
Figure 4. Clinical signs of the MVV disease namely mastitis in mammary glands (A) and loss of body weight in
sheep (B) (Veterinary Faculty of Zaragoza, Spain, 2013).
The lentivirus genus of the Retroviridae family embraces pathogens of humans, monkeys, horses,
cattle, sheep, goats and cats. The main routes of transmission are the horizontal transmission
between sheep of any age, by aerosol from the respiratory tract and from mother to offspring with
colostrum or milk. When a lamb sucks its infected dam, transmission is expected under any
management system and may happen even when the dam is in the preclinical period (Dawson, 1980).
Blood has not been demonstrated to be a source of transmission and vertical transmission is rarely
perceived. Venereal transmission of MVV has not been reported (Belknap, 2002).
Lentiviral diseases are the cause of important economic losses suffered by the sheep and goat
industries and also increasingly threaten exports of live animals. In a work published by
Christodoulopoulos in 2005 about commercial dairy flocks infected by MVV, a mean-annual decline of
milk production and milk fat percentage was reported to be of the order of 3.2 and 2.0 % respectively,
following the year to year increase of MVV seroprevalence in flocks. The disease has been reported in
many of the sheep rearing countries of the world, but has not yet been seen in Australia and New
Zealand. Published data about MVV status and economic loss are poor, reflecting the little research
made on the topic. Investigations into the economic impact of MVV have largely focused on
productivity parameters such as wool, milk or lamb production, as shown above, and have not
addressed the direct losses due to death or premature culling (Benavides, et al., 2013). Most countries
Page 31
9
have recorded the disease already. In Portugal, the full-length sequence of the first Portuguese isolate
of ovine lentivirus has been presented (Barros, et al., 2004).
Regarding the structure, MVV virions have a conical capside and a unique three-layered structure
(Figure 5). Their diameter is about 100 nm. The central part of the virus is the genome-nucleo-protein
complex, associated with the reverse transcriptase. This structure is placed within an icosahedral
capsid enclosed by an envelope derived from the plasma membrane of the host cell.
Figure 5. Representative structure of MVV and its main proteins (SIB Swiss Institute of Bioinformatics, 2014).
The virus has a typical genetic organization of lentiviruses: its genome is a RNA dimer with positive
strand polarity, 9.2 kb in size, which is reverse transcribed into proviral DNA some of which will be
integrated into the chromosomal DNA. It comprises three structural genes: gag (group-specific
antigen), pol (polymerase) and env (envelope), as well as various auxiliary genes (Pépin, et al., 1998).
The virus remains within infected monocytes and macrophages and may exist in a latent state for an
uncertain period. Viral expression is closely dependent on the maturation of monocyte to macrophage.
Moreover, the virus is able to mutate and the resultant antigenic drift results in new strains of the virus.
This fact explains the different patterns of the disease associated with diverse strains of the virus
(Belknap, 2002).
It will be difficult to have an available vaccine due to mutagenic properties of the virus (Belknap, 2002).
Despite this, a number of research groups continue to defend the feasibility of a search for such
vaccine, advocating different strategies. The use of attenuated viruses obtained by deletion of
selected genes looks promising (Pépin, et al., 1998) (Peterhans, et al., 2004).
The infections triggered by MVV in sheep share a number of features with the infection caused by the
HIV, such as an incubation period of several months or even years, a slow development of disease
symptoms and many structural and functional protein similarities (Thormar, 2005). In this degree,
studies of MVV may therefore help in the search for new drugs against HIV.
Page 32
10
2.2. Bioprocess design to develop viruses
There are many challenges in the development of viruses due to the complexity, costly and high-
regulated upstream processes associated. Downstream processing is also a key step, costly and time
consuming as well. Therefore, biotech companies developing viral platforms are based on
conventional techniques although they are studying novel and appealing techniques to produce and
recover these bioproducts.
2.2.1. Manufacturing technology
In the case of the viruses, gene transfer experiments require large amounts of highly pure material.
Predictions have been made regarding the magnitude of single doses required for therapy which lie
between 1011
and 1014
particles, with annual productivity requirements variously projected by some
agencies in the range of 1013
to 1020
(Lyddiatt & O'Sullivan, 1998). Therefore, manufacturing capacity
to meet the demands of viral vectors production is a real challenge. In addition, market speed is critical
to deliver health benefits to patients quickly and to achieve business success.
There are two different methods to produce viruses: egg-based manufacture and cell-culture-based
manufacture. Each one has advantages and disadvantages based on experience, costs, raw materials
availability, and economic viability (Hickling & D'Hondt, 2006).
Relatively of egg-based manufacture at the laboratory scale, it is possible to produce viruses “by
hand”, without the need for automation and using only standard laboratory equipment. Embryonated
eggs from a certified source are needed and used 9–12 days after fertilization. The seed-virus is
inoculated via alantoic route into the alantoic sac with a syringe under aseptic conditions. The hole is
then sealed with wax. The inoculated egg is incubated for two to three days. At the end of this period,
it is transferred to 4°C, which kills the embryo. The top of the egg is cut off, the membrane pierced with
a pipette and the allantoic fluid is removed. This is then clarified by centrifugation to remove cell
debris. Harvests from the eggs are pooled and sterility tested for three to four days (Hickling &
D'Hondt, 2006).
At industrial scale, the process is the same but with automatic inoculators, incubators and harvesters
required to speed up the process and increase capacity.
In the past, seasonal flu vaccines have been manufactured using fertilized embryonic eggs. The
advantages of using embryonic eggs to manufacture seasonal flu vaccines are that the safety and
effectiveness of the vaccines produced have been well established. One of the most disadvantages in
this egg-based manufacture is that in the event of a pandemic, the available egg-grown influenza
vaccine would be insufficient to meet global demand (IFPMA, 2012).
However, in order to get a faster scale-up, a laboratory-scale cell-culture-based process can be better.
This process uses relatively straightforward equipment such as roller bottles or cell factories, standard
incubators and bioreactors.
Page 33
11
The first step is the cell line development stage to expand the desired quantity for working cell banks.
Then, cells are infected with the virus and incubated for necessary time. Parameters such as
multiplicity of infection, incubation time and temperature need to be optimized for each cell line and
each strain of virus. After the incubation period, the virus is harvested by removing the tissue-culture
supernatant. The harvested supernatant is concentrated using ultrafiltration or ultracentrifugation.
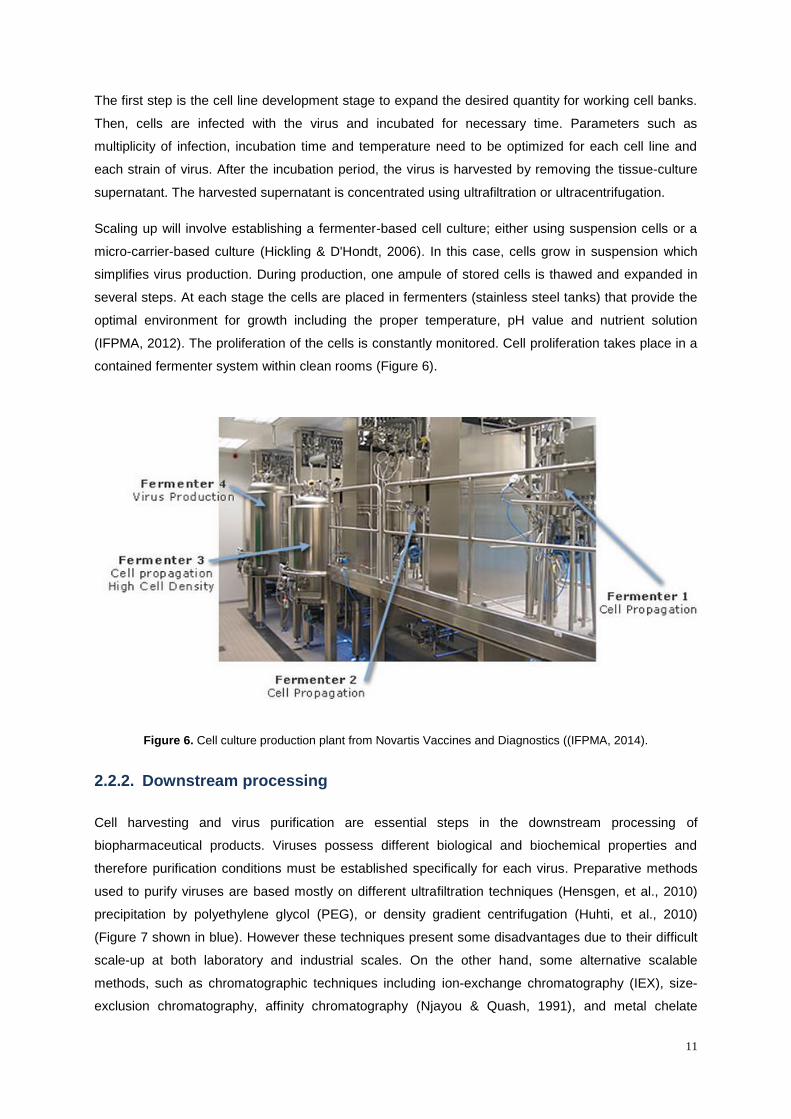
Scaling up will involve establishing a fermenter-based cell culture; either using suspension cells or a
micro-carrier-based culture (Hickling & D'Hondt, 2006). In this case, cells grow in suspension which
simplifies virus production. During production, one ampule of stored cells is thawed and expanded in
several steps. At each stage the cells are placed in fermenters (stainless steel tanks) that provide the
optimal environment for growth including the proper temperature, pH value and nutrient solution
(IFPMA, 2012). The proliferation of the cells is constantly monitored. Cell proliferation takes place in a
contained fermenter system within clean rooms (Figure 6).
Figure 6. Cell culture production plant from Novartis Vaccines and Diagnostics ((IFPMA, 2014).
2.2.2. Downstream processing
Cell harvesting and virus purification are essential steps in the downstream processing of
biopharmaceutical products. Viruses possess different biological and biochemical properties and
therefore purification conditions must be established specifically for each virus. Preparative methods
used to purify viruses are based mostly on different ultrafiltration techniques (Hensgen, et al., 2010)
precipitation by polyethylene glycol (PEG), or density gradient centrifugation (Huhti, et al., 2010)
(Figure 7 shown in blue). However these techniques present some disadvantages due to their difficult
scale-up at both laboratory and industrial scales. On the other hand, some alternative scalable
methods, such as chromatographic techniques including ion-exchange chromatography (IEX), size-
exclusion chromatography, affinity chromatography (Njayou & Quash, 1991), and metal chelate
Page 34
12
(Negrete, et al., 2007) or non-chromatographic such as aqueous two phase systems have been used
(Benavides & Rito-Palomares, 2008).
Figure 7. Typical virus platform downstream process (blue) and alternative one, exploited in this work (orange).
2.2.2.1. Cell culture harvest
Centrifugation
Biological centrifugation is a process which separates or concentrates mixtures of biological particles
suspended in a liquid medium. The theoretical basis of this technique is the effect of gravity on
particles (cells, subcellular fractions, isolated macromolecules such as proteins or nucleic acids and
viruses) in suspension. Two particles of different masses will settle in a tube at different rates in
response to gravity (Sheeler, 1981). This sedimentation of particles can be explained by the Stokes
equation (Equation 1), which describes the movement of a sphere in a gravitational field. The equation
calculates the velocity of sedimentation utilizing five parameters:
( )
Equation 1
where v is the sedimentation rate or velocity of the sphere, d the diameter of the sphere, p the particle
density, L the medium density, n the viscosity of the medium and lastly g is the gravitational force
(Sigma-Aldrich, 2014).
From the Stokes equation is possible to say that the rate of particle sedimentation is proportional to
the particle size and proportional to the difference in density between the particle and the medium.
Moreover, the sedimentation rate is zero when the particle density is the same as the medium density
and decreases as the medium viscosity increases. Finally, the sedimentation rate increases as the
gravitational force enhances, so, g parameter is used to increase the settling rate in the centrifuge.
One of the most used forms of centrifugation in industry is disk-stack centrifugation due to its
capability to perform very large scale downstream harvest operations with great efficacy. In this
centrifugation, the disc stack separator separates solids and one or two liquid phases from each other
in one single continuous process, using very high centrifugal forces. When the denser solids are
Cell culture harvest
Centrifugation Intermediate Purification
Precipitation by PEG
Density gradient centrifugation
Ultrafiltration
Polishing step
IEX
ATPS
Page 35
13
subjected to these forces, they are forced outwards against the rotating bowl wall, while the less
dense liquid phases form concentric inner layers. The insertion of disc stack provides additional
surface settling area, which contributes to speeding up the separation process significantly (Alfa Laval,
2014). Disk stack centrifuges are capable of removing cells and large cell debris; however cells can be
damaged during the process increasing the number of submicron particles that cannot be removed.
So low-shear systems and techniques coupled with second-stage depth filtration are especially useful.
The use of depth filtration can provide further clarification, removing smaller solid particulates (Rios,
2012).
2.2.2.2. Intermediate Purification
Precipitation by PEG
PEG is a widespread polymer used as a fractional precipitating agent for the purification of proteins
from a variety of sources due to its non-denaturing qualities. However, the molecular basis of the
protein-precipitating action of PEG is not well understood. Polson and his coworkers (Polson, et al.,
1964) documented the increasing of PEG effectiveness as the molecular weight of the polymer
increased. However, there were cleaning difficulties in unit operations like mixing, pumping,
centrifugation and filtration. In order to precipitate small proteins, higher concentrations of larger
PEGs are needed and this occurs to a significant extent only when the proteins are present in high
concentrations.
Juckes (Juckes, 1971) referred afterwards that larger proteins have the tendency to precipitate at
lower concentrations of PEG. These tendencies have strengthened the notion that the precipitation
process is due mainly to excluded volume effects. According to this perspective, proteins are
sterically excluded from regions of the solvent occupied by the inert synthetic polymers and are thus
concentrated until their solubility is exceeded and precipitation occurs (Donald & Kenneth, 1981).
The addition of PEG to a protein solution increases the chemical potential of the proteins. Precipitation
of the protein happens when its chemical potential exceeds the level of a saturated solution. The
chemical potential of the protein in saturated solution, μ (J/mol), written in an isothermal and isobaric
condition was presented by Atha et al. (Atha & Ingham, 1981):
(
) ( ) Equation 2
where μ0 (J/mol = N m/mol) is the chemical potential of an infinitely dilute pure protein in ideal solution
(reference state of no intermolecular interaction), G (J) is the Gibbs free energy, n (mol) is the number
of protein particles, R (J/K mol) is the gas constant, T (K) is the absolute temperature, and S1 (mol/L)
is the molarity of soluble protein in the presence of ω1 (mol/L) of PEG. By gas law, RT has the unit of
Pa m3/mol. The bracketed terms on the right hand side of Equation 2 have no units. The coefficients
d1 and α1 (L/mol) denote protein–protein (second virial coefficient) and PEG–protein interactions,
respectively. Negligible effects of buffer constituents (due to low concentrations) and higher order virial
coefficients (to simplify the virial equation) are assumed. Since the number of soluble protein
molecules in the system (1 μM, or 0.1 mg/ml of a 100 kDa protein) is several orders of magnitude
Page 36
14
lower than the number of PEG molecules present [17 mM or 10 % (w/v) of a 6000 Da PEG], the non-
ideality caused by protein–protein interactions (d1S1) is not considered.
By taking μ as a constant (soluble and precipitated protein phases are in equilibrium), Juckes (Juckes,
1971) simplified Equation 2 to a semi-logarithmic expression (Equation 3):
log S=−βω+κ Equation 3
where S (mg/ml) is the protein solubility in the presence of ω (%w/v) of PEG. When solubility data is
plotted in semi-logarithmic scale, normally one of the curves obtained is a sigmoidal with a middle
linear region of negative slope that fits into Equation 3. The β-value ([log(mg/ml)]/[%w/v]) represents
the precipitation efficiency, whereas the κ-value [log(mg/ml)] denotes intrinsic protein solubility in the
absence of PEG.
The equations described above help to refine the selection criterion for PEG precipitants.
Density gradient centrifugation
In the case of a biological mixture with particles of similar size but differing density, ultracentrifugation
with performed or self-establishing density gradients is the best method of choice. The mixture, such
as a virus containing supernatant, is layered on top of a preformed liquid density gradient. Depending
on biological application a wide variety of gradient materials are available: caesium chloride for
banding DNA or isolate plasmids and viruses; sodium bromide for the fractionation of lipoproteins;
sucrose for the separation of membrane vesicles from tissue homogenates (Walker & Wilson, 2010).
Those materials should have: i) good solubility in water, ii) electrical neutrality and iii) transparency to
UV-light. Whereas their viscosity should be relatively small for the centrifugation of macromolecules,
this restriction is less stringent for viruses or large cellular organelles (Fritsch, 2009).
Figure 8. Separation scheme of biological particles using a density gradient. The sample is carefully layered on
top of preformed density gradient prior to centrifugation. After centrifugation time separation of the different sized
particle was obtained (Walker & Wilson, 2010).
Density gradient centrifugation necessarily requires the use of swinging bucket rotors (Figure 9) or
zonal rotors. These are the only rotors in which the density gradient is always parallel to the force
which is submitted and the zones do not suffer any major distortion. Therefore, fixed angle rotors are
not suited for zone centrifugation. The choice of a particular rotor depends basically on the amount of
Page 37
15
macromolecules to be centrifuged, on the resolving power, and secondarily on the centrifugation time.
Most often, the best compromise has to be found between these three parameters (Fritsch, 2009).
Figure 9. Swinging bucket rotor from Instituto Nacional de Investigação Agrária e Veterinária (INIAV).
The rotor in Figure 9 is essentially characterized by a set of buckets which hang in the vertical while
the rotor is at rest, and which come to the horizontal position as soon as the rotor spin. Thus, the
tubes placed inside each bucket are always submitted to a force (earth’s gravitation of centrifugal
force) which is parallel to their axes.
Ultrafiltration
Ultrafiltration (UF) is a tangential flow filtration technique which uses membranes with pore sizes in the
range of 0.1 to 0.001 µm. Typically, ultrafiltration will remove high molecular-weight substances, such
as viruses (Bellara, et al., 1998), colloidal materials, and organic and inorganic polymeric molecules
(Spatz & Friedlander, 1980). In this process, the fluid is pumped tangentially along the surface of the
membrane. There is an applied pressure which forces the fluid to pass through the membrane to the
filtrate side. The fluid that flows out of the feed channels of the membrane modules back into the
recycle tank is known as concentrate or retentate while the fluid that passes through the membranes
is commonly called permeate. UF using a hollow fiber membrane is accomplished by pumping the
fluid into the inner diameter of a tubular fiber (Figure 10).
Page 38
16
Figure 10. Schematic of an ultrafiltration process using a hollow fiber membrane module (Anon., 2014).
One application of UF is the solvent-exchange of proteins which is called Diafiltration (DF). In
processes where the product is in the retentate, diafiltration washes components out of the product
pool into the filtrate, thereby exchanging buffers and reducing the concentration of undesirable
species. When the product is in the filtrate, diafiltration washes it through the membrane into a
collection vessel.
A diavolume or diafiltration volume (DV) is a measure of the extent of washing that has been
performed during a diafiltration step. It is based on the volume of diafiltration buffer introduced into the
unit operation compared to the retentate volume. If the volume of permeate collected equals the
starting concentrate volume, it means that 1 DV has been processed (Schwartz, 2003).
If a solute is not totally retained (or rejected), the amount of solute going through the membrane can
be quantified in terms of parameters such as the apparent rejection coefficient (σa) (Equation 4).
Equation 4
where cp is the concentration in the permeate and cc the concentration in the retentate or concentrate.
The permeability will be influenced by transmembrane pressure (TMP, ΔPTM) which is the average
applied pressure from the feed to the filtrate side of the membrane (Equation 5).
Equation 5
where Pi is the pressure at the membrane’s inlet, P0 is the pressure at the concentrate outlet, Pp is the
pressure at the permeate outlet, and Δ is the difference of osmotic pressure between concentrate
and permeate. Because only high-molecular weight species are removed, the osmotic pressure
differential across the membrane surface is negligible.
When a membrane is used for a separation, the concentration of any species being removed is higher
near the membrane surface than it is in the bulk of the stream. This condition is known as
concentration polarization and exists in all ultrafiltration separations. The result of concentration
polarization is the formation of a boundary layer of substantially high concentration of substances
Page 39
17
being removed by the membrane (Porter, 1972). The thickness of the layer and its concentration
depend on the mass of transfer conditions that exist in the membrane system. Membrane flux and
feed flow velocity are both important in controlling the thickness and the concentration in the boundary
layer. In addition to concentration polarization phenomenon there is another reason for the
degradation of membrane's performance: membrane fouling. This is accomplished when solute
deposits onto a membrane surface or into membrane pores. Membrane fouling is an irreversible and
time-dependent phenomenon (Katsuki Kimuraa, 2004).
The permeate flux in an ultrafiltration process determines its productivity. This parameter depends
primarily on the properties of the membrane and the feed solution therefore is affected by
transmembrane pressure, concentration polarization and membrane fouling phenomena as described
in Equation 6,
( ) Equation 6
where µ is the solution’s viscosity, Rm is the resistance due to the membrane, Rcp is the resistance due
to concentration polarization, and Rf is the resistance due to fouling.
2.2.2.3. Polishing step
Ion Exchange Chromatography
With its origins dating back to the 1940s, ion-exchange chromatography (IEX) was designed
specifically for the separation of differentially charged or ionizable molecules. Researchers have
routinely employed this technique for the purification of proteins (Kent, 1999), enzymes (Cummins &
O'Connor, 1996), antibodies (Knudsen, et al., 2001), peptides, amino acids and nucleic acids, as well
as carbohydrates and organic compounds (Horvath & Lipsky, 1966).
IEX is an alternative purification technique to conventional ultracentrifugation based methods for virus
purification. The basis of IEX is that charged ions can freely exchange with ions of the same type. In
this context, the mass of the ion is irrelevant. Therefore, it is possible for a bulky anion like a
negatively charged protein to exchange with chloride ions. This process can later be reversed by
washing with chloride ions in the form of NaCl or KCl solution. Such washing removes weakly bound
proteins first, followed by more strongly bound proteins with a greater net negative charge. Its large
sample-handling capacity, wide applicability (particularly to proteins and virus), reasonable cost,
powerful resolving ability, and easy to scale-up and automation, made this technique as one of the
most versatile and widely used of all liquid chromatography (LC) techniques (Kent, 1999).
In cation exchange chromatography positively charged molecules are attracted to a negatively
charged solid support at a pH below its isoelectric point (pI). Contrariwise, in anion exchange
chromatography, negatively charged molecules are attracted to a positively charged solid support at a
pH above its pI. In a particular condition, the molecule carries no net surface and interactions with the
charged medium do not occur, in this case, pH corresponds to its isoelectric point. Additionally other
minor types of interactions may occur, due to Van der Waals forces or non-polar interactions.
Page 40
18
The stages of an anionic exchange chromatography are described in Table 2. The first step is
equilibration with the buffers in which the ion exchanger is brought to a starting state, in terms of pH
and ionic strength, which allows the binding of the desired solute molecules (Table 2 – Equilibration
step). The second step is the sample application and adsorption, in which solute molecules carrying
the appropriate charge displace counter-ions and bind reversibly to the medium. Unbound substances
are washed out from the column (Table 2 – Sample application step). In the third stage, the
substances are removed from the column by changing to elution conditions unfavorable for ionic
binding of the solute molecules (Table 2 – Elution steps). This normally involves increasing the ionic
strength (typically Na+ or Cl
-) of the eluting buffer or changing its pH. The last stage is the removal of
substances not eluted from the column under the previous experimental conditions and re-
equilibration at the starting conditions for the next purification (Table 2 – Washing step).
Page 41
19
Table 2. Separation steps in anion exchange chromatography. Adapted from (GE Healthcare Life Sciences,
2014)
Step Description Illustration
Equilibration
Ion exchange medium
equilibrated with
starting buffer
Sample
application
Oppositely charged
proteins bind to ionic
groups or to the ion
exchange medium,
becoming
concentrated on the
column. Uncharged
proteins or those with
the same charge as
the ionic groups are
eluted
Elution
Increasing ionic
strength (using a
gradient) displaces
bound proteins as
ions in the buffer
competing for binding
sites
Elution
Further increases in
ionic strength displace
proteins that are more
highly charged
Washing
Final high strength
wash removes any
ionically bound
protein before
reequilibration
Page 42
20
Furthermore, ion exchangers are classified as “weak” or “strong.” This classification refers to the fact
that functional groups on many ion-exchange absorbents maintain their charge only during a certain
interval of pH. Functional groups on strong ion exchangers remain charged in wider pH ranges than
for weak ion exchangers. The weak/strong classification does not refer to the absorbent ability to bind
proteins; it refers only to pKa value of their functional groups (GE Healthcare Life Sciences, 2014).
Monolithic Chromatography: a particular case of IEX
Monoliths, also called continuous stationary phases, are important tools for bioseparation of large
molecules such as viruses. The first experiments with monoliths were reported in the late 60s and
early 70s but their commercial boost was not achieved until the new millennium (Jungbauer & Hahn,
2004). In that time, the search for an alternative to packed columns, considering problems caused by
assembly of the particles in the column, was a logical consequence. Hjerten in 1989 was the pioneer
who established continuous polymer beds based on polyacrylamide for the fast separation of
biopolymers. Thereafter, in 1992 Tennikova and Svec synthesized poly(glycidyl methacrylate ethylene
dimethacrylate) polymers as disks called macroporous polymer membranes which were
commercialized later by BIA Separations from Lubljana, Slovenia under the trade name Convection
Interaction Media (CIM).
These supports can be a single piece of organic highly porous material (like CIM disks mentioned
above) or inorganic (silica) with well-defined distribution of pore sizes. The pores are highly
interconnected network of large diameter channels in which the mobile phase flows (Gagnon, 2008).
Large biomolecules are more vulnerable than small molecules to structural damage from shear forces.
Even subtle alterations can compromise recovery, stability and effectiveness. The structure of
monoliths avoids generation of shear forces, thereby contributing to high functional recoveries, even
for labile biomolecules such as live virus vaccines, DNA plasmids, and large proteins. In monoliths the
predominant transport mechanism is convection rather than diffusion which leads to a flow-unaffected
resolution. Monoliths are homogenous, and flow is uniform throughout the bed unlike packed particle
columns, where its structure is discontinuous, comprising zones with dramatically different flow
properties (Gagnon, 2008). These features enable fast separations, laminar, nonturbulent flow of
mobile phase and low pressure drops even at very high flow rates. Therefore, monoliths present
simultaneously high capacity and high-resolution fractionation of these biomolecules.
Monoliths are made in different formats as porous rods, generated in thin capillaries or made as thin
membranes or disks as shown in Figure 11.
Page 43
21
Figure 11. CIM® disks and housing. CIM® disks (left) are white monoliths placed in the middle of the disk of a
non-porous self-sealing ring with different colors according with their ligand chemistry. CIM disk is inserted in the
CIM housing (right) and used as a chromatography column.
Currently, five companies are manufacturing monolithic columns for application in bioseparation. An
overview of their products is given in Table 3.
Trade Name Manufacturer Material Channel diameter Separation
Modes
CIM BIA Separations Polymethacrylate 1500 nm
IEX, HIC,
Bioaffinity,
Reversed
phase
UNO Bio-Rad Polyacrylamide 1000 nm IEX
SWIFT Isco Polymethacrylate 1500 nm IEX, Reversed
phase
Ultimate LC-Packings Polystyene
divenylbenzene Not available
IEX, Reversed
phase
Chromolith Merck Silica
Macropores: 2 µm
Mesopores: 13 nm
Reversed
phase
Table 3. Overview of commercially available monoliths
Page 44
22
Aqueous two-phase systems (ATPS)
Two-phase aqueous partitioning is a soft method of protein purification, without denaturation or loss of
biological activity mostly. Since the systems have a high water content and low interfacial tension and
the polymers may also have a stabilizing effect, the proteins are protected (Asenjo & Andrews, 2012).
ATPS can be used to purify proteins from cell debris or to separate proteins from other proteins
(Azevedo, et al., 2007), viruses and intact cells (García-Pérez, et al., 1998) (Negrete, et al., 2007),
virus-like particles (Benavides, et al., 2006) (Luechau, et al., 2011), inclusion bodies (Walke &
Lyddiatt, 1999), plasmid DNA (Maggon, 2007), surrogate mimics for viral vectors and adenoviral
vectors (Sullivan, 2008) and even inorganic compounds produced by microorganisms (Gottschalk,
2008).
ATPS forms when two polymers or one polymer and a salt are mixed in an aqueous solution above
their critical solubility concentrations. The mixture will then separate into two immiscible phases
(Figure 12), where the light phase (top phase) is rich in one polymer and the heavy phase (bottom
phase) is rich in the second polymer or the salt. In addition an interphase can be formed between both
phases.
Figure 12. Schematic representation of protein separation by ATPS. Adapted from (Persson, et al., 1999).
An important parameter in ATPS is the partition coefficient (Kp), which is defined as
Equation 7
where cT and cB represent the equilibrium concentrations of the partitioned protein in the top and
bottom phases, respectively.
Proteins separation is achieved by manipulating the partition coefficient presented above by altering
the average molecular weight of the polymers, the type of ions in the system, the ionic strength of the
Page 45
23
salt phase or by adding an additional salt such as NaCl (Zaslavsky, 1995) (Cabezas, 1996) (Hatti-
Kaul, 2001).
To achieve an effective separation of a particular protein, the following properties of partitioning should
be studied (Asenjo & Andrews, 2011):
(i) Hydrophobicity, where the hydrophobic properties of a phase system are used for separation
according to the hydrophobicity of proteins;
(ii) Electrochemical, where the electrical potential between the phases is used to separate molecules
or particles according to their charge;
(iii) Size-dependent partitioning where molecular size of the proteins or surface area of the molecules
(proteins) or particles is the dominating factor;
(iv) Biospecific affinity, where the affinity between sites on the proteins and ligands attached to one of
the phase polymers is exploited for separation;
(v) Conformation-dependent, where the conformation of the proteins is the determining factor.
Therefore it is fundamental to do a physicochemical characterization of the target product and major
contaminants present in the feedstock as a first step in the process design. The following steps are the
selection of the type of ATPS, selection of system parameters and evaluation of the process
parameters upon product recovery/purity (Rito-Palomares, 2004) (Benavides & Rito-Palomares,
2008). Regarding the second step, in general, there are two major types of ATPSs, polymer/salt and
polymer/polymer. The initial selection of a polymer/salt ATPS (e.g. PEG/phosphate) has been
preferred due to several process advantages including low cost, low viscosity, short phase separation
time and possible recycling strategy of both polymer and salt (Greve & Kula, 1991) (Costa, et al.,
2000) (Benavides & Rito-Palomares, 2008). When the polymer/salt ATPSs are not effective and the
market cost of the product of interest is considerably high, a polymer/polymer ATPS (e.g.
PEG/dextran) may be considered.
ATPS has important advantages over the current established methods of ultrafiltration, precipitation by
PEG, or density gradient centrifugation: ATPS process does not harm or denature biomolecules due
to mild conditions used (presence of more than 80% water in both phases); it has a rapid mass
transfer (low interfacial tension) and specific systems may be developed in order to favor the
enrichment of a specific compound, or class of compounds, in one of the two phases reaching higher
yields and purities. These systems are easy to scale-up and they may be employed in continuous
protein-extraction processes. Therefore, ATPS has been applied in several fields of biotechnology
such as recovery of proteins, enzymes, biopharmaceuticals and extractive fermentation. The
advantages and disadvantages of this process are summarized in Table 4:
Page 46
24
Table 4. Advantages and disadvantages of ATPS (Rosa, et al., 2010) (Xu, et al., 2001).
Advantages Disadvantages
Mild conditions
Rapid mass transfer
High biocompatibility
Easy scale-up
Low cost
Limited know-how of the mechanism of partitioning, installation,
validation and operation
Large consumption of auxiliary materials
Page 47
25
3. Materials and Methods
3.1. Culture expansion and virus inoculation
Production of BTV antigen
BHK-21 (Baby-Hamster-Kidney) cell line (European Collection of Cell Cultures) was cultured in
Glasgow Modified Eagle's Medium (MEM) (Gibco®, CA, USA), supplemented with 10% fetal bovine
serum (FBS) and 1% of antibiotics (Gibco®).
Virus suspensions of BTV-4 28931-13 (INIAV) used in centrifugation, chromatographic, and ATPS
experiments were prepared by infection of BHK-21 cells. The cell culture medium was removed and
the cellular monolayer was washed once with PBS (Sigma-Aldrich). BTV-4 inoculum (3 mL) with a
titer of 1.12x10⁵ TCID50/mL was added and adsorbed to the cells and incubated for 1 h at 37°C in a
5% CO2 atmosphere. After 72 hours of incubation, when extensive cytopathic effect (CPE) was
observed the culture medium was removed and clarified by centrifugation 3000 × g for 30 min.
Production of MVV antigen
SCP cells (Sheep Choroid Plexus cells) obtained from a MVV seronegative sheep were used at low
passage to grow MVV (strain WLC-1) (INIAV). The cells were maintained in Dulbecco’s MEM (DMEM)
(Gibco®, CA, USA) supplemented with non-essential amino acids, sodium pyruvate, antibiotics, and
10% heat inactivated fetal calf serum (Gibco®). At 5 days after inoculation, when extensive cytopathic
effects were observed, the medium containing MVV was harvested. Cell culture supernatants were
clarified at 3000 × g for 30 min.
3.2. MVV pre-purification by polyethylene glycol-NaCl precipitation
The MVV was precipitated from the supernatant using 6% (w/v) polyethylene glycol 6000 (Sigma-
Aldrich) and 0.4 M NaCl (Sigma-Aldrich) with overnight stirring and centrifuged at 3000 × g for 30 min
at 4 C in a Sorvall GSA rotor and resuspended with the original volume with phosphate buffered saline
(PBS) (Sigma-Aldrich).
3.3. Viruses concentration by density gradient centrifugation
Viral pellets (BTV and MVV) obtained by ultracentrifugation (107000 × g) of clarified supernatants or
PEG pre-purified MVV were suspended in 1 mL of PBS and layered onto an 11 mL discontinuous
gradient consisting of 2 mL of 50% (w/w) and 8 mL of 20% sucrose in 1 mM
Tris(hydroxylmethyl)aminomethane-chloride buffer [(Tris)-chloride buffer] (pH 7.2) containing 0.001 M
ethylenediaminetetraacetic acid (EDTA) (final solution: TNE) (all from Sigma-Aldrich). The gradients
were centrifuged for 1h15 at 107000 × g in a Beckman SW 41 rotor (Beckman, CA, USA). The viral
band at the interface between 20 and 50% sucrose was carefully collected, diluted in 3.5 mL of TNE
and centrifuged for 1h at 107000 × g in a Beckman SW 65 rotor. The virus pellet was suspended in
1/100 of the initial volume and stored at −80°C.
Page 48
26
3.4. Supernatants ultrafiltration/diafiltration
The clarified supernatants were buffer exchanged by diafiltration/ultrafiltration in a tangential flow
filtration system with a Masterflex® L/S
® pump, containing an Easy-Load
® II pump head (model 77200-
50) (Vernon Hills, IL, USA) and two pressure gauges connected (Anderson Instrument Company Inc.,
NY, USA). The diafiltration/ultrafiltration was carried out through a hollow fiber cartridge (33.7 L x 0.9
cm o.d.), with a 10 kDa molecular weight cut-off (MWCO) hollow fiber polysulfone membrane (pore
size and a membrane area of 110 cm2) (GE Healthcare, Sweden).
The operating conditions were established by selecting the pump’s speed and adjusting the valve’s
closure at the concentrate outlet with a transmembrane pressure of 10 –13 psi (0.69-0.90 bar). The
pressure at the concentrate inlet caused an outlet pressure slightly above 13 psi.
The supernatants were diafiltered four times with an equal volume of Milli-Q water (i.e. 200 mL). The
permeate flow rate was measured in each 10 mL processed, and an equal volume of water was added
in the repository at the same time. Samples from permeate and concentrate were collected in each
treated 100 mL, in order to measure the infectious virus titer/ELISA optical density and the
conductivity. Virus concentration was determined by TCID50 assay or ELISA, according to the
procedure described below. The conductivity was measured in an ECTester Low microprocessor-
based conductivity tester (range: 0 to 1990 μS/cm), from Oakton Instruments (Vernon Hills, IL, USA),
after the samples had been five or ten times diluted in Milli-Q water.
The hollow-fiber membrane cartridges were cleaned using 0.1 M NaOH and, after whole neutralization
of the alkaline solution with water and stored in a 20% ethanol solution.
3.5. Viruses concentration and purification by Chromatography
Chromatography experiments were performed in an ÄKTATM
purifier HPLC system (GE Healthcare,
Uppsala, Sweden) which works with the UNICORNTM
control software. CIM® disk monolithic columns
(BIA Separations, Ljubljana, Slovenia) of two different chemistries diethyl amine (DEAE) and
quaternary amines (QA) were used during the experimental work. CIM® monolithic column is a 3
mm×12 mm disk-shaped highly porous polyglycidyl methacrylate-co-ethylene dimethacrylate matrix
and its bed volume and porosity are 0.34 mL and 62%, respectively. The channels within the column
have a diameter of 1500 nm. The disk is stuck in a polyetheretherketon housing (BIA Separations).
During the procedure, the absorbance was measured at 280 nm and the flow rate was 0.5, 1 or 2
mL/min (depending on experimental settings). Virus suspension volumes applied to the monolithic
column varied in range from 0.5 to 5 mL. Equilibration of a disk monolithic column was carried out with
3 CVs of the adsorption buffer. All buffers were filtered prior to the chromatography procedure through
a 0.45 μm filter (Millipore, Bedford, MA, USA). In order to stabilize the virus, 0.1 mM of MgCl2 (Sigma-
Aldrich) was added in the adsorption buffer. The composition of the adsoption buffer varied depending
on experimental settings.
Page 49
27
In some experiments virus suspensions were diluted 1:5 in adsorption buffer prior to loading. Non-
bound substances were washed out by adsorption buffer at a flow rate of 1 mL/min with 2 column
volumes (CVs). Elution was undertaken by using a linear gradient (up to 75% of elution buffer) with 5
CVs. After loading, washing and elution, an ali uot of each fraction or fraction pools were analy ed. All
runs were performed at room temperature. Samples were stored at 4 C until further analysis. Cleaning
in Place of disk monolithic column was carried out after 5 runs by washing the column with 20 column
volumes of 0.1 M NaOH at a flow rate of 1 mL/min and then with Milli-Q water in order to remove
precipitated proteins. Additionally, the column was washed with 20 column volumes of 30 % (v/v) 2-
propanol due to some bound hydrophobic proteins or lipids.
3.6. BTV concentration and purification by Aqueous Two-Phase Systems
The necessary amount of phase-forming chemicals for a 10 g ATPS were constructed on a w/w%
basis. Predetermined quantities of stock solutions of PEG 1000 and PEG 3350 Da (Sigma-Aldrich),
dextran 60-90 and dextran 500 kDa (Fluka, Buchs, Switzerland) or potassium phosphate (Sigma-
Aldrich) were mixed in either a complex system (containing clarified BTV supernatant) or a pre-purified
system (containing pre-purified MVV virus by PEG precipitation). Aqueous solutions of 40% (w/w)
phosphate were prepared and buffered at different pH by adjusting with NaOH or HCl (Sigma-Aldrich).
The virus supernatant was added in the end and consisted of a remaining percentage to make up total
ATPS weight. Partition assays were set up in 15 mL graduated centrifuge tubes. In the case of
PEG/Dextran systems, the final pH was given by a 1 M phosphate buffer stock solution in which 1 %
(%w/w) was added to all ATPS. In the case of PEG/Salt systems, the pH was assumed to be the
same as the original phosphate stock solution. The phase components were thoroughly mixed on a
vortex agitator (Ika, Staufen, Germany). Then, the tubes were left to equilibrate for two hours at 4°C
and, afterwards, were centrifuged for 5 min in a fixed angle rotor centrifuge (Eppendorf, Hamburg,
Germany) at 4000 rpm, to ensure total phase separation. Finally, phase volumes were measured and
top and bottom phases were then carefully separated with a syringe and taken for further analysis.
The volumes of the phases were used to estimate the volume ratio (volume of the top phase/volume
of the bottom phase, Vr).
3.7. Analytical Methods
Cell viability assay
BHK-21 cells were counted at time 24, 36, 48 and 72 h of BTV incubation. BHK-21 cells were washed
with PBS, removed from the well plate by trypsin digestion, and diluted in trypan blue. Viable cells
were scored as viable by trypan blue (Gibco®) exclusion method.
Determination of concentration of infectious BTV by 50% Tissue Culture Infective Dose (TCID50) assay
Viral samples were titrated in 96-well microtiter plates. Twofold dilutions of the viral samples (1:100,
1:200 or 1:500 in the first row) were prepared in Glasgow medium and added to the plates with an
equal volume (100 µL) of BHK-21 cells suspension (106 cells/mL). The plates were incubated at 37 C
Page 50
28
in a 5% CO2 atmosphere during 3 days. The cells were checked on the optical microscope for specific
viral cytopathic changes such as detachment of some cells in the monolayer and cell rounding and
apoptosis as shown in Figure 13. The titer was calculated as a multiple of the median TCID50 on the
basis of the final reading using Spearman-Karber formula in Equation 8.
log10TCID50 = L−d(S−0.5) Equation 8
where L = log10 of starting dilution, d = log10 of dilution step, S =sum of the proportion of positive
replicates.
Figure 13. Optical photomicrography (Magnification 100X) of monolayers of BHK-21 cells: A) Negative control at
the end of the assay: 72 h; B) Cytopathic effect 72 h after BTV inoculation.
Determination of relative concentration of MVV by ELISA
The wells of 96-well microtiter plates MaxiSorpTM
(Thermo Scientific) were coated with viral samples
diluted in 50 mM carbonate-bicarbonate buffer (Fluka), pH 9.6. Then, the plates were tapped gently to
insure even distribution of the antigen solution over the bottom of each well and incubated overnight at
4 C. The plates were washed 3 times with the ELISA washing solution [PBS-Tween 20 solution 0.1%
(v/v) Tween 20] using an automatic plate washer (Tecan, Switzerland). Next, 100 µL of undiluted cell-
free supernatant from hybridoma cell line 16D9 (INIAV) was added and incubated for 1 h. The plates
were washed again and rabbit anti-mouse IgG secondary antibody conjugated to horseradish
peroxidase diluted 1:2000 in TBS (Sigma-Aldrich) was added. The plates were incubated for 30 min at
37 C. After the incubation, the plates were washed and 3,3,5,5-tetramethyl-benzidine (TMB) (Sigma-
Aldrich) was added (100 µL/well). Color development was stopped after 20 min by adding 100 µL/well
of 0.5 M sulfuric acid (H2SO4) (Sigma-Aldrich). The absorbance was read at 450 nm using a plate
reader spectophotometer.
Protein Gel Electrophoresis
SDS–PAGE was performed to evaluate the purity of centrifuged samples, chromatography fractions or
top and bottom phases collected. Samples were diluted in a loading buffer containing 62.5 mM Tris–
Page 51
29
HCl (Sigma-Aldrich), pH 6.2, 2% SDS (Biorad, CA, USA), 0.01% bromophenol blue (Phasta GelTM
BlueR, Pharmacia) and 10% glycerol (Sigma-Aldrich) and denatured in reducing conditions with 0.1 M
of dithiothreitol (DDT) (Sigma-Aldrich) at 100ºC for 5 min. Samples were applied in a 12% acrylamide
gel prepared from 40% acrylamide/bis stock solution (29:1) from Bio-Rad (Hercules) and run at 90 mV
using a running buffer containing 192 mM glycine, 25 mM Tris and 0.1% SDS, pH 8.3. Every gel was
loaded with a Precision Plus Protein Dual-color standard from Bio-Rad or Blue Wide Ranger
Prestained Protein Ladder from Cleaver Scientific (Warwickshire, UK). Gels were stained by soaking
gels in Coomassie PhastGel™ Blue R, from Pharmacia (Uppsala, Sweden) solution for 1 hour. Gels
were then destained by washing twice in 30% (v/v) ethanol and 10% (v/v) acetic acid for 30 min each
one. Gels were stored in Milli-Q water.
When the intensity of the bands was unsatisfying, the gels were silver stained due to method’s
sensitivity (in the very low ng range) according to the steps described in Table 5. The rationale of silver
staining is quite simple. Proteins bind silver ions, which can be reduced under appropriate conditions
to build up a visible image made of finely divided silver metal.
Table 5. Steps of the silver staining procedure.
Step Description
1 - Fixation Incubation in an oxidizer solution, composed of
0.8 mM sodium thiosulphate, for 10 minutes
2 - Rinse Washing with Milli-Q water, for three times of 5
minutes each
3 - Impregnation
Incubation with a fresh silver nitrate solution
(11.8 mM silver nitrate, 0.02% formaldehyde), for
30 minutes
4 - Rinse Washing with Milli-Q water, for three times of 1
minute each
5 - Development
Incubation with a developer solution, composed
of 0.566 M sodium carbonate, 0.02 mM sodium
thiosulphate and 0.02% formaldehyde
6 - Stop
Incubation in a stop solution, composed of 50%
ethanol, 12% acetic acid in Milli-Q water, for 15
minutes
The SDS-PAGE gels were scanned using a GS-800 calibrated densitometer, from Bio-Rad.
Western blot
The procedure was based on a Bio Rad protocol (BIO RAD, 2008). SDS-PAGE was performed
according to the previously reported technique. Once separated, the proteins were electrotransferred
to a nitrocellulose membrane in the transfer buffer composed of 25 mM Tris (Sigma-Aldrich), 192 mM
Page 52
30
glycine (Sigma-Aldrich) and 20% methanol (v/v) (Panreac Quimica, Barcelona, Spain) with a Trans-
Blot® SD Semi-Dry Transfer Cell at 15 V for 20 min at room temperature. Once transferred, the
nitrocellulose sheet was incubated 1 h with a Tris buffered saline solution (TBS) (20 mM Tris, 500 mM
NaCl) with 0.1 % Tween 20 (TTBS solution). After the blocking step, the membrane was washed with
TTBS for 10 minutes with gently agitation at room temperature (RT). Then it was incubated overnight
with a 1:20 dilution of sheep/bovine serum samples (MVV and BTV respectively) in TTBS. The BTV
sera selected were originated from infected bovines collected during BTV-4 outbreaks (2004-2006).
Concerning MVV, the sera were originated from flocks with a history of respiratory problems and high
prevalence of MVV antibodies as determined by ELISA (enzyme linked immunosorbent assay)-based
surveys (Fevereiro, et al., 1999). Once the primary antibodies were removed and washed with TTBS
for 5 minutes at RT, a donkey anti-sheep-IgG-HRP (1:10000) or sheep anti-bovine-IgG-HRP
conjugate (1:5000) was added for 2 h (MVV and BTV respectively). Finally, the membranes were
washed twice with TTBS for 5 min and one last time with TBS. Bound antibodies were visualized by
the addition of the substrate/chromogen solution [H2O2/4-chloro-1-naphtol (Sigma-Aldrich) in TBS].
Color development was allowed to proceed until bands of desired intensity appeared. The reaction
was stopped with Milli-Q water, and the blots were dried at RT.
Virus Isoelectric focusing
For the isoelectric focusing (IEF) of the viral samples, a PhastSystem® electrophoresis apparatus
(Pharmacia) was used as well as a PhastGel® IEF gel with a pH gradient of 3.5-9.5 (Pharmacia). The
method used for IEF contains three steps: (i) a prefocusing step, in which the pH gradient is formed
and when the sample applicators can be loaded; (ii) a sample application step, in which the samples
are applied to the gel for 15 Vh; (iii) a focusing step, in which the applicators are raised and the
proteins migrate to their pI.
In the applicator comb were loaded 2 μL of the viral samples, 2 μL of a myoglobin sample as an
additional pH ladder and 1 μL of a pI marker. The pI marker (Pharmacia) was composed of
amyloglucosidase (pI 3.50), methyl red (pI 3.75), soybean trypsin inhibitor (pI 4.55), β-lactoglobulin A
(pI 5.20), bovine carbonic anhydrase B (pI 5.85), human carbonic anhydrase B (pI 6.55), horse
myoglobin-acetic band (pI 6.85), horse myoglobin-basic band (pI 7.35), lentil lectin-acidic band (pI
8.15), lentil lectin-middle band (pI 8.45), lentil lectin-basic band (pI 8.65), and trypsinogen (pI 9.30).
The IEF gels were silver stained according to these steps: (i) Fixation of the gel with a 20% (w/v)
trichloroacetic acid solution, for 5 min at 20°C; (ii) washing with a 50% (v/v) ethanol, 10% (v/v) acetic
acid solution, for 2 min at 50°C; (iii) washing again with a 10% (v/v) ethanol, 5% (v/v) acetic acid
solution, for 6 min at 50°C; (iv) incubation in a sensitizer solution composed of 8.3% glutaraldehyde,
for 6 min at 50°C; (v) washing with a 10% (v/v) ethanol, 5% (v/v) acetic acid solution, for 8 min at
50°C; (vi) washing with Milli-Q water, for 4 min at 50°C; (vii) incubation in a 0.5% (w/v) silver nitrate
solution, for 10 min at 40°C; (viii) washing with Milli-Q water, for 1 min at 30°C; (ix) incubation in a
developer solution composed of 0.015% formaldehyde in 2.5% sodium carbonate, at 30°C until the
Page 53
31
satisfying bands intensity; (x) incubation in a stop solution, composed of 5% (v/v) acetic acid, for 5 min
at 50°C.
Total Protein Quantification- Bradford Assay
Total amount of protein present in loading samples (BHK-21 and SCP cell culture medium and
clarified supernatants), centrifuged samples, chromatography fractions and in top and bottom phases
were quantified by the Bradford method (Bradford, 1976) using the Coomassie assay kit supplied by
Pierce (Rockford, IL, USA). In order to prepare a calibration curve, standard samples of known
concentration of bovine serum albumin (BSA) were prepared, and applied in the 96 well plate in the
same way as the other samples. The samples were diluted five times in the respective buffer
according to the technique and applied in duplicate in the microwell plate. The plate was mixed on a
plate shaker for 30 seconds and incubated for 10 minutes at RT. The absorbance of all the samples in
the well was measured at 595 nm in a microplate reader from Molecular Devices (Sunnyvale, CA,
USA) armed with a Softmax Pro 5.3 processing software. Concerning a possible interference from
phase forming components in the case of ATPS, all samples were analyzed against blank containing
the same phase composition but without loading samples containing the virus.
Page 55
33
4. BTV Results and Discussion
4.1. Production of cell culture-derived BTV
As BHK-21 cells are routinely used for the preparation of BTV viral stocks in INIAV, this mammalian
cell line was chosen as a simple in vitro model for analysis of the direct viral influences on cell host
viability.
Control and BTV infected BHK-21 cells were cultured in 12-Well Cell Culture Receiver Plate (Sigma-
Aldrich). Once the cell density level reached about 106 cells/mL, 3 mL of BTV-4 suspension (1.12x10
5
TCID50/mL) were added to the cell culture. Viable cells were counted at 24, 36, 48 and 72 h using the
Trypan blue exclusion method with a hemocytometer as illustrated in Figure 14. The pattern of the
cytopathic effect (CPE) was examined under microscope as shown in Table 6.
Figure 14. Effect of BTV on cell number and their viability. The viability was measured by trypan blue cell viability
assay. Number of live cells (●); number of dead cells (x); viability (●) as a function of the time post-infection.
The results obtained clearly indicate that after BTV inoculation, viable cell density started to decrease
(Figure 14). At one-day post infection there were 52 % of viable cells, whereas at the end of process
there were only nonviable cells. The minimal viability (0.0 %) was achieved after 48 h post infection.
0
10
20
30
40
50
60
70
80
90
100
0
5
10
15
20
25
0 12 24 36 48 60 72V
iab
ilit
y (
%)
To
tal cell n
um
ber
x 1
05
/mL
Time post-infection (h)
Page 56
34
Table 6. Microscopic view of the CPE. Uninfected cells are shown as the negative control (0 h), followed by
infected cells at different post-infection times.
Time post-infection
(h)
Images (Magni-
fication 40X) Description
0
Uninfected cells adhering to the
plate.
24
No CPE is visible yet although the
viability had already decreased
significantly.
36
Detachment of some cells in the
monolayer. BTV has produced
foci of infection.
48
Cell rounding and detaching.
CPE appears to be generalized.
72
Extensive CPE. Clumping of the
nonviable cells.
Page 57
35
BTV infection of BHK-21 resulted in a severe CPE within 48 h post-infection manifested by cell
rounding, apoptosis, and lytic release of virions into the culture medium. These effects were consistent
with the ones reported in the literature (Clavijo, et al., 2000) (Sekar, et al., 2008).
It should be taken into account that the results were obtained using a cell line which is not the natural
host of the virus. Moreover, the virus was not under the in vivo environmental conditions.
Nevertheless, these results still present a comparative set of data which can be valuable for further in
vitro and in vivo studies of BTV.
4.2. BTV analytical methods establishment
Due to the work novelty (no published material in the field concerning BTV), it was necessary to
establish an expeditious and efficient method to quantify the virus in fractionated samples, namely
each flowthrough and eluate fractions obtained by chromatographic run and in each top and bottom
aqueous phase obtained after extraction.
Initially, ELISA seemed to be the best method since it can be accomplished in two working days.
Besides being relatively fast, this method is capable to detect antigens at a very low and unknown
concentration. Moreover, it is safe and used in a wide variety of tests. However, for diagnosis
purposes, INIAV works with expensive BTV assay kits or with real-time polymerase chain reaction
also called quantitative polymerase chain reaction (qPCR). These kits were cost-prohibitive
concerning testing all the samples, making ELISA development a valuable process in this research
setting. There is a in house DIVA system based on the detection of antibodies to non-structural protein
3 (NS3) of Bluetongue virus although not suitable for this work (Barros, et al., 2009).
Therefore, in order to evaluate the antigen concentration, an indirect ELISA was developed using
200× concentrated sample obtained by ultracentrifugation. The ELISA protocol development included
i) selecting antibody concentrations, ii) choosing the appropriate buffer, iii) reducing interference and
iv) evaluating the optimal time length for incubation periods.
Throughout protocol development, the major problem was the high background signal. A common
cause overlies in the conjugate (secondary-antibody) concentration. Thus, different concentrations of
anti-bovine were tested (1:5000; 1:8000; 1:10000; 1:15000; 1:20000). However, a high optical density
at 450 nm was obtained when using a BTV negative control bovine serum as shown in Figure 15.
This fact suggested non-specific binding and false positive results. All the plates included always a
negative control in order to validate the results.
Page 58
36
Figure 15. ELISA mean optical density at 450 nm. Virus 200 × concentrated dilution 1:1000 (●); virus 200 x
concentrated dilution 1:2000 (●); negative control 1/1000 (▲); negative control 1:2000 (▲) as a function of the
titer of the primary antibody.
Other causes of background could be insufficient blocking or washing steps. To decrease the
background, blocking solutions were used: i) bovine serum albumin (BSA) at a concentration of 1%
and 5% in PBS at pH 7 and ii) non-fat dry milk (NFDM) used at 0.1% and 0.5%. The period of time of
blocking step was increased from 1h to overnight. However, with those solutions the blocking was not
effective, therefore a blocking solution from a veterinary ELISA kit was used (Buffer Vet Innovative
Diagnostics, Grabels, France). For an effective washing, a detergent was also added (Tween 20).
Unfortunately, none of these variables conducted to a low background.
For those reasons, a different approach was taken by using a median tissue culture infective dose
assay (TCID50). This technique has some advantages and disadvantages when compared with ELISA.
The time expended in this test is considerably higher (4 days) and this was the main reason for trying
to develop an ELISA protocol and not starting earlier on with this method. The most important
advantage is that the quantification is absolute unlike in ELISA.
4.3. Feedstock characterization
Different feedstocks were used for methods development, namely i) direct supernatant, ii) supernatant
200× concentrated by ultracentrifugation, iii) supernatant concentrated and purified by density gradient
centrifugation and iv) supernatant diafiltrated by ultrafiltration with a 10 KDa MWCO hollow fiber
module. Figure 16 shows the protein profile present in these different feedstocks using
electrophoresis.
0
0.1
0.2
0.3
0.4
0.5
0.6
1:100 1:200 1:400 1:800
mean
OD
(450
nm
)
Titer of primary antibody
Page 59
37
Figure 16. Silver stained reducing SDS-PAGE analysis of the feedstocks. (A) Lane 1: Precision Plus Protein™
Dual Color Standards, molecular weight (in kDa) at the left side; Lane 2: Culture media: GMEM® supplemented
with FBS; Lane 3: Clarified BHK-21 cell supernatant; Lane 4: BTV 200x concentrated by ultracentrifugation; Lane
5: BTV 200 x concentrated by density gradient centrifugation; (B) Lane 1: Precision Plus Protein™ Dual Color
Standards, molecular weight (in kDa) at the left side; Lane 2: Supernatant buffer exchanged by
ultrafiltration/diafiltration.
SDS-PAGE gels revealed the presence of several impurities from the culture medium (GMEM®
supplemented with FBS) where the cells were expanded, such as, bovine serum albumin (BSA, with
66.5 kDa), the major component of FBS.
BTV has seven viral proteins which are incorporated into virions. There are three minor components
(VP1 ≈ 150 kDa, VP4 ≈ 76 kDa, VP6 ≈ 42 kDa) that together with the ten double stranded RNA
segments of the virus genome are enclosed within the core. The core is composed of two major
proteins (VP3 ≈110 kDa, VP7 – 38 kDa), and in turn is enclosed by the two outer virion proteins (VP2
≈ 110 kDa, VP5 ≈ 60 kDa) which forms the complete virus particle.
None of BTV proteins were discernible in the gels due to high amount of impurities making the purity
evaluation difficult. Even in the most “purified” sample, which corresponds to the one obtained from
density gradient centrifugation (Figure 16, Lane 5), the amount of impurities was too high to discern
any viral protein. This “purified” sample was obtained by loading the material obtained from a first
ultracentrifugation step in the top of a sucrose discontinuous density gradient and centrifuged to
produce a zone of virus separated from ones of other proteins. “Purified” virus formed an opalescent
zone between 50 and 20% (w/v) sucrose layers with zones of impurity above and below which
corresponded to the heavy band. A lighter band higher in the gradient was seen as well which was
related with some BTV glycoproteins. Sucrose was further removed from the “purified” virus
suspension by thoroughly washing in the centrifuge with about 55 % of the original infectivity
recovered in the “purified” material.
Page 60
38
The low purity obtained by this traditional methodology is probably a consequence of the unfeasibility
in removing only the virus band from the density gradient without contaminating the sample with
protein impurities present on the top and bottom of the viral zone.
Considering that the virus needed further separation from other particles with similar density, a
continuous gradient should have been chosen instead of a discontinuous gradient. Alternatively, the
virus could have been further concentrated by another high-speed ultracentrifugation although with
losses considering the yields. In sum, little purification of the crude virus was obtained which therefore
reinforced the importance of establishing alternative and effective methods for virus concentration and
purification.
Afterwards, in order to confirm the proteins authenticity, a Western immunoblot was performed with
the supernatant 200× concentrated by ultracentrifugation using anti-BTV-4 serotype antisera.
Figure 17. Western blot analyses of the 200× concentrated BTV by ultracentrifugation using anti-BTV-4 antisera.
As shown in Figure 17, VP4, VP5, VP6 and VP7 bands of the 200× concentrated supernatant fluids of
infected BHK cells reacted strongly with anti-BTV-4 antisera. Bands of these molecular weights were
seen in previous SDS-PAGE gels, although were not considered once the supernatant contained a lot
of impurities with these molecular weights as well.
Additionally, an isoelectric focusing (IEF) was performed in order to determine the isoelectric point (pI)
of the BTV and of the other proteins present in the “purified” sample from density gradient
centrifugation. The IEF gel obtained is shown in the Figure 18.
Page 61
39
Figure 18. Silver stained IEF gel of the supernatants further treated by ultracentrifugation or density gradient
centrifugation. Lane 1: pI broad standards (from bottom to top: amyloglucosidase - 3.50, methyl red - 3.75,
soybean trypsin inhibitor - 4.55, β- lactoglobulin A - 5.20, bovine carbonic anhydrase B - 5.85, human carbonic
anhydrase B - 6.55, horse myoglobin-acetic band - 6.85, horse myoglobin-basic band - 7.35, lentil lectin-acidic
band - 8.15, lentil lectin-middle band - 8.45, lentil lectin-basic band - 8.65, trypsinogen - 9.30); Lane 2: BTV 200 x
concentrated by ultracentrifugation; Lane 3: BTV 200 x concentrated by density gradient centrifugation; Lane 4:
myoglobin control.
The IEF gel (Figure 18, Lane 3) revealed that BTV has an acidic isoelectric point, below 5.0 which
means that at physiological pH values these biomolecules are negatively charged. The other proteins
in the medium and FBS presented acidic pI as well. Regarding the lanes containing the supernatant
treated by ultracentrifugation (Figure 18, Lane 2) it is possible to conclude that concentration of the
protein impurities is much higher comparing with the sample treated by density gradient centrifugation.
The information obtained in this Section, was intended to help in the selection of the adsorption buffer
in the case of monolithic chromatography and in partitioning conditions in the case of ATPS, keeping
in mind that the pH has to be adjusted according to the isoelectric point of the virus.
4.4. Feedstock diafiltration
Most ion exchangers loose capacity if a crude (non-diluted or non-diafiltrated) feedstock is loaded due
to high conductivity which does not favor binding. Usually, the conductivities values should be below 5
mS/cm (Lain, et al., 2009) which was not the case (≈ 10 mS/cm). Therefore, the cell culture
supernatants were subjected to a diafiltration process with a 10 kDa MWCO ultrafiltration membrane.
The diafiltration was performed against Milli-Q pH 6.0 as solution to exchange out the base in order to
bring the solution back to close neutral pH. Additionally, when the permeate was collected, the same
volume of diafiltration buffer, in this case, Milli-Q, was added to the process vessel. The results
obtained for the retentate are illustrated in Figure 19.
Page 62
40
During the process, the conductivity in the concentrate and in permeate were monitored as well as the
concentration of infectious BTV, to guarantee that the shear tensions would not decrease the viral
functionality and consequently its infectivity.
Figure 19. Virus titer (●) and conductivity (●) in the retentate as a function of diafiltration volumes for the BTV
supernatant buffer exchanged into Milli-Q water pH 6.0.
Concerning conductivity, a strong decrease was observed from 9.8 to 0.25 mS/cm being the final
conductivity value much below to those recommended. The concentration of live BTV remained
almost constant once it was retained by the membrane although the results obtained may reveal a
small loss of infectivity, specifically after 2 diafiltration volumes.
The apparent rejection coefficient of the membrane (σa) which reflects the ability to retain BTV or
reject it from passing through, was calculated by the Equation 4 and is represented in Figure 20.
The volume of liquid crossing the membrane per unit area per unit time, permeate flux, was measured
in order to verify the filtration resistance. The typical variation of permeate flux (Jv) over time is an
initial severe decrease, due to the formation of the concentration polarization layer, followed by
gradual decrease due to fouling, and then finally steady state due to equilibrium of foulant attachment
with its detachment between membrane surface and feed solution (Hyeok, et al., 2005)(Figure 20).
0
2
4
6
8
10
12
0
2
4
6
8
10
12
0 1 2 3 4
Diafiltration Volumes
Co
nd
ucti
vit
y (
mS
/cm
)
Vir
us t
iter
(x10
4 T
CID
50/m
L)
Page 63
41
Figure 20. Rejection coefficient of the membrane (σa, ●) and permeate flux (Jv, ●) as a function of diafiltration
volumes for the BTV supernatant buffer exchanged into Milli-Q water at pH 6.0.
The separation of the medium and BTV which took place at the membrane during
ultrafiltration/diafiltration gave rise to an increase in virus and protein concentration close to the
membrane surface. This phenomenon is called concentration polarization and takes place within the
boundary film generated by the applied cross-flow. After a progressive reduction of permeate flux,
fouling phenomenon becomes more significant. This happens when the protein deposits into
membrane pores in a way that reduces the membrane's performance.
To this extent, the hydraulic resistances responsible for the permeate flux variation were calculated.
The initial resistance of the clean membrane (Rm) was predicted using the permeate flux when water
was passing through the membrane.
Under these circumstances the terms Rcp and Rf of the Equation 6 were neglected and a value of 1.13
x 1011
cm-1
was determined for Rm. After that, the total resistances were calculated by Equation 6
considering all the permeate fluxes obtained during the diafiltration. Based on the Rm determined
previously, the resistance due to concentration polarization was determined as a single contribution by
subtracting Rm to the total resistance. The equation to obtain the resistances needs other inputs such
as transmembrane pressure (ΔPTM) defined by the Equation 5, and the supernatant’s viscosity (µ)
which was considered equal to the water (0.001 Pa.s). Furthermore, in order to calculate
transmembrane pressure, it was considered that the pressure at the permeate outlet (Pp) was 0, the
pressure at the membrane’s inlet was (Pi) 11 psi and the pressure at the concentrate outlet (Po) was
10 psi. In this case, the difference of osmotic pressure between the concentrate and permeate was
neglected once the value would be much lower than the hydraulic pressure.
The resistances determined as a function of time are shown in Table 7.
Page 64
42
Table 7. Overall resistance (RT) and resistance due to concentration polarization + fouling (Rcp+f) values as a
function of diafiltration time (which corresponds to each 100 mL processed). Relative importance of the
concentration polarization and fouling phenomena in the overall resistance is represented by Rcp+f/RT.
Time (min) RT (cm-1
) Rcp+f Rcp+f/RT (%)
3 1.21×10¹¹
8.12×10⁹ 6.7
31 1.62×10¹¹
4.97×10¹⁰
30.6
66 1.67×10¹¹
5.45×10¹⁰
32.6
101 1.68×10¹¹
5.54×10¹⁰
33.0
141 1.99×10¹¹
8.60×10¹⁰
43.3
183 1.99×10¹¹
8.65×10¹⁰
43.4
225 2.02×10¹¹
8.89×10¹⁰
44.1
263 2.02×10¹¹
8.94×10¹⁰
44.2
306 2.06×10¹¹
9.37×10¹⁰
45.4
The resistances had values in the same magnitude therefore similar contributions for overall
resistance with exception at the beginning of the process where the main resistance was intrinsic to
the membrane. There was a continuous increase of Rcp+f and then an almost steady state due to
equilibrium of foulant buil-up and its detachment.
This experimental approach has shown to be well suited for BTV. The open flow path of the hollow-
fiber membrane promoted gentle supernatant buffer exchange preventing loss of functionality. This
step disregards a supernatant dilution, which would result in a decrease in BTV concentration and
consequently would be conflicting with the main objective of this work which was the virus
concentration. To conclude, this diafiltration step allowed salt removal as well as buffer exchange in a
quick and convenient way.
4.5. Chromatography using monolithic supports
The purification of BTV by anion-exchange chromatography using a monolithic bed was first studied
using a weak anion exchanger diethylaminoethyl (DEAE). The experiments were executed initially with
the supernatant which was passed through the monolith without pre-conditioning steps. In a following
experiment, the supernatant was diluted in order to decrease conductivity and finally was buffer
exchanged by diafiltration/ultrafiltration using a hollow fiber module or using an Amicon® Ultra
centrifugal filter unit. In addition to the different loads, the working conditions were changed, namely
salt concentration in the buffer, pH and working flow rate.
The efficiency of concentration and purification process was monitored by measuring the
concentration of infective virus and determining protein content quantitatively by Bradford assay in
starting material and in different chromatographic fractions.
Since the goal was to select an adsorption buffer that maximized the recovery of the BTV while
preventing the binding of impurities to the monolith, the elution recovery yield and the purification
Page 65
43
factor were calculated. The purification factor was obtained dividing the virus titer per protein content
in each pool of fractions by the initial live virus content in the supernatant per amount of proteins.
4.5.1. The effect of different ionic strength in the adsorption buffer
Since there are no reported data describing the concentration and purification of BTV by monolithic
chromatography, in order to select the most suitable conditions for the virus downstream processing,
initial studies were focused on investigate the effect of ionic strength of the adsorption buffer. These
studies were performed at neutral pH according to preliminary studies performed under batch
conditions using DEAE-Sepharose (data not shown), using a small monolithic column (CIM® disk)
with 0.34 mL of bed volume, bearing weak anion-exchange groups (DEAE). The adsorption of virus to
the DEAE ligands is reversible and occurs in continuous competition not only with other negatively
charged proteins from the supernatant but also with buffer ions. The concept was that at higher ionic
strengths, salts, namely Cl- would compete with protein impurities but not with the virus for the binding
sites thus originating higher purities. In the best scenario, the flow through (FT) peak should only have
impurities whereas the elution peak would have the BTV. In the initial studies, the supernatant was
directly loaded into the monolithic column. Figure 21 shows two anion-exchange chromatographic
runs performed at different ionic strengths. FT and eluted fractions were analyzed by TCID50
experiments and it was possible to acknowledge that BTV was mainly present in the flow through
fractions, indicating that it did not interact with the ligand probably due to the high ionic strength of the
adsorption buffers.
Figure 21. CIM DEAE® chromatography profile of BTV purification from clarified BHK-21 cell supernatant, using
as adsorption buffer 20 mM NaH2PO4 with 175 or 350 mM NaCl at pH 7.2 and elution buffer 20 mM NaH2PO4
with 2 M NaCl at pH 7.2. Absorbance at 280 nm (mAU) – dark blue line (adsorption buffer 20 mM NaH2PO4 with
350 mM NaCl at pH 7.2) and light blue line (adsorption buffer 20 mM NaH2PO4 with 175 mM NaCl at pH 7.2),
conductivity (mS/cm) - dashed dark blue line (adsorption buffer 20 mM NaH2PO4 with 350 mM NaCl at pH 7.2)
and dashed light blue line (adsorption buffer 20 mM NaH2PO4 with 175 mM NaCl at pH 7.2).
0
20
40
60
80
100
120
0
50
100
150
200
250
300
0 5 10 15
Co
nd
ucti
vit
y (
mS
/cm
)
Ab
s2
80
nm
(mA
U)
V (mL)
Page 66
44
To further select the appropriate adsorption buffer, the ionic strength in the adsorption buffer was
reduced. Figure 22 shows the chromatographic profile obtained using an adsorption buffer without
NaCl. The residual conductivity of this buffer is due to the presence of 1 mM MgCl2 used to stabilize
the virus and the NaH2PO4 used to maintain the pH at 7.2.
Figure 22. CIM DEAE® chromatography profile of BTV purification from clarified BHK-21 cell supernatant, using
as adsorption buffer 20 mM NaH2PO4 with 1 mM MgCl2 at pH 7.2 and elution buffer 20 mM NaH2PO4 with1 mM
MgCl2 and 2 M NaCl at pH 7.2. Absorbance at 280 nm (mAU) –blue line, conductivity (mS/cm) - dashed blue line.
The results displayed by the chromatogram confirm the lower working conductivity value (initial
conductivity around 5 mS/cm). According to Lain and coworkers (2009) the optimal conditions should
include low conductivity values. However, the conductivity associated to the supernatant, displayed in
the first peak from the dashed line, is considerable higher with a maximum value close to 15 mS/cm.
In this case, the amount of salt ions present in the sample is competing for the binding sites on the
monolith blocking the BTV adsorption. Therefore, an aspect worthy of remark is the need for a
supernatants conditioning using a diafiltration step, in which the conductivity is decreased (described
in section 3.4.). Further studies will thus be performed using a feed with a reduced conductivity.
4.5.2. The effect of the ion exchange ligand
In order to promote the adsorption of the virus to the ion-exchange ligands, it is necessary to decrease
the conductivity of the feed sample, which can be achieved by dilution of the virus feedstock or by
diafiltration the feedstock by ultrafiltration.
As a first trial, a prior 1:5 dilution of the cell supernatant was done in order to decrease the
conductivity. This strategy however resulted in a reduction of BTV concentration, jeopardizing the aim
to concentrate the virus. Nevertheless, it was performed with the purpose of finding the best conditions
for elution and then replacing dilution by diafiltration. Moreover, another CIM® disk chemistry was
used for virus purification namely QA (quaternary amines), a strong anionic exchanger. Since both
disks may present distinct selectivities for the virus, different chromatograms and performance
parameters were obtained as illustrated in Figure 23 and summarized in Table 8.
0
20
40
60
80
0
50
100
150
200
250
0 5 10 15
Co
nd
ucti
vit
y (
mS
/cm
)
Ab
s2
80
nm
(mA
U)
V (mL)
Page 67
45
Figure 23. Chromatographic profile of BTV purification from clarified BHK-21 cell supernatant, using DEAE and
QA monolithic supports. Adsorption buffer 20 mM NaH2PO4 and 1 mM MgCl2 at pH 7.2 and elution buffer 20 mM
NaH2PO4 with 1 mM MgCl2 and 2 M NaCl at pH 7.2. Absorbance at 280 nm (mAU): (-) CIM® QA monolith; (-)
CIM® DEAE monolith; (dashed line) conductivity profile.
Table 8. Infectious BTV, recovery yield and purification factor in chromatographic fractions for DEAE and QA
monoliths, including the flow-through (FT) and different elution (E) fractions.
Sample/Fractions
QA DEAE
Live virus content
Yield (%)
PF Live virus content Yield (%) PF
Starting material 1.12×10⁵
TCID50 1.12×10
5 TCID50
Flowthrough (FT) 1.13×10⁴ TCID50 10 0.3 1.41×10
4 TCID50 13 0.2
E1 ≈ 0.4 M NaCl 0 - - 0 - -
E2 ≈ 0.7 M NaCl 7.05×10⁴ TCID50 63 3.4 2.82×10
4 TCID50 25 2.3
E3 ≈ 1 M NaCl - - - 0 0 -
The results suggest that infective virions were found in the one of the latest peaks and the recovery of
infective virions was lower in DEAE than in QA. Considering the area of the first and third elution
peaks (elution at 0.4 and 1 M NaCl), it is possible to confirm that these peaks contained non-infective
material, i.e., proteins and other impurities.
Furthermore, part of BTV (around 10%) did not bind or was weakly bound to the monolith and was
thus washed-out in the flowthrough fraction. A possible reason is that the total binding capacity may
have been exceeded therefore the binding sites for virus adsorption were occupied resulting in some
unbound virus in the flowthrough.
The calculation of the dynamic capacity, which describes the amount of sample which will bind to the
monolith under defined conditions, would help in this context. This parameter would allow the
Page 68
46
maximization of the virus yield and higher concentration achievements. However, to determine the
dynamic capacity, it is necessary to have a pure target molecule with a known concentration which
was not the case. BTV with low purity was obtained by density gradient centrifugation therefore the
binding capacity would be underestimated once protein contaminants would bind to the monolith
decreasing the value.
Regarding purity, the highest purification factor was obtained using QA chemistry probably due to the
fact that there were much lower recoveries when the DEAE ligand was used (25% recover against the
63% obtained with the QA ligand).
4.5.3. The effect of bed height
In this study, the length of the CIM monolithic column was varied by merging two QA CIM® disks in a
single CIM® housing, still working with a prior dilution step 1:5 and injecting 5 mL of the supernatant.
The QA ligand was chosen due to the results obtained previously with only one CIM® disk, in which
QA ligand presented better results. Adding a second disk affects the separation performance because
a higher bed height of the separation material increases the number of binding sites available. A
higher bed height however resulted in a longer analysis time and higher back pressure although with
moderate values.
Comparing the yields depicted in Table 9 with the analogous in Table 8 (for 1 CIM® disk), the most
remarkable improvement is the absence of BTV in the flowthrough fraction, suggesting that a greater
binding capacity was achieved in the concentration with two CIM® disks.
Table 9. Infectious BTV, recovery yield and purification factor in chromatographic fractions for two QA CIM®
disks.
2 x QA
Sample/Fractions Live virus content Yield (%) PF
Starting material 1.12×10⁵
TCID50
Flowthrough 0 - -
Eluate ≈ 0.4 M NaCl 0 - -
Eluate ≈ 0.7 M NaCl 8.9×10⁴ TCID50 80 3.5
The total amount of BTV in the initial feedstock was 1.12 x 10⁵ TCID50 and approximately 80% of the
virions were recovered during elution with 0.7 M NaCl.
4.5.4. The effect of the working pH
After establishing optimal chromatographic conditions and performing diafiltration/ultrafiltration to the
initial cell supernatant (Section 3.4), an experimental pH range (5.0-9.0) was chosen to further exploit
the potential of monolithic chromatography. In this case, total amount of BTV in initial suspension was
4.56×10⁵ TCID50 and 5 mL of the supernantant were injected.
Page 69
47
The BTV supernatant contained several molecules such as albumin, antichymotrpsin, apolipoproteins,
biotin, and growth supporting factors, which were required for optimal growth of cells. Such proteins
have numerous isoelectric points as demonstrated in previous IEF (Figure 18), so different
chromatography parameters were expected for binding buffers at different pH as depicted in Table 10.
Table 10. Infectious BTV, recovery yield and purification factor in chromatographic fractions for 2 QA CIM® disks
at different pH values.
pH Buffer Live virus content Yield (%) PF
5.0 Acetate Not possible to determine
6.0 Acetate
0 - -
7.2 Phosphate 3.64×10⁵ TCID50 80 3.8
8.0 Phosphate 2.32×10⁵ TCID50 51 4.0
Comparing the data displayed in Table 10, it is clear that the pH has had a strong effect in the BTV
recovery. Binding at pH 7.2 corresponded to the best condition in which all the virus present in the
stock solution was negatively charged (pH > pI), since no unbound BTV was found by TCID50
experiments. The other positively charged molecules will flowed through the column.
At the most acidic pH, the column backpressure built up to an intolerably high level. An explanation
which has been hypothesized was the case of an isoelectric precipitation phenomenon. Fractional
precipitation can be achieved by varying the pH of the supernatant. At low pH condition, proteins have
a net positive charge since the carboxylic groups form aspartic and glutamic acid residues become
protonated and uncharged, while amino groups from lysin, asparagine and histidine residues are
protonated and have a positive charge. At high pH values, proteins have a net negative charge due to
the deprotonation of the carboxylic groups. At its pI value, a protein has no net charge. This leads to
reduced solubility because the protein-protein interactions are not repulsive and lead to the formation
of aggregates that fall out of solution. According to the IEF performed, the BTV pI is close to 5.0
(Figure 18). In 2009, Michen and coworkers supported that most frequently virus pI are measured in a
range of 3-7. The BTV precipitation on the monolith would explain the problems regarding the column
backpressure, since BTV aggregates may have completely blocked the column at pH 5.0. Even just
after a CIP (cleaning in place) process advised by the manufacturer, the run was never finished due to
extremely high pressure values.
At pH 6.0, the run was interrupted several times but it was possible to carry on until the end although
the high pressure could have had a negative effect on infectivity since the values were extremely low
comparing with runs at pH higher than 7.0. It might be that some BTV had started to precipitate
leading to irregular values and decreasing the resolution and binding capacity.
The chromatography of BTV at different pH revealed that the optimal pH for maintaining the virus
infectivity was 7.2 (higher titer values).
The results suggest that only a narrow pH range supports efficient and sustainable infectivity of BTV.
Page 70
48
4.5.5. The effect of the working flow rate
The high degree of interconnectivity in monoliths allows higher flow rates improving the time efficiency
of the downstream process. To further exploit this potential, the two QA CIM® disks were used to
concentrate and purify the BTV from the supernatant at flow rates of 0.5, 1.0 and 2.0 mL/min. The
tested conditions were adsorption and elution buffers at pH 7.2 considering that, at this pH, the best
yield was achieved. The results obtained are summarized in Table 11.
Table 11. Infectious BTV, recovery yield and purification factor in chromatographic fractions for 2 QA CIM® disks
at different flow rates.
Flow rate (mL/min) Live virus content Yield (%) PF
0.5 3.69×10⁵
TCID50 81 3.5
1.0 3.64×10⁵ TCID50 80 3.8
2.0 1.82×10⁵ TCID50 40 2.9
It has been shown that in contrast to the conventional particle chromatographic material, the resolution
achieved in CIM® monoliths is not affected by the flow-rate (FR) of the mobile phase (Gagnon, 2008).
However, the BTV yield was quite similar in the first conditions but exhibited a large decrease when
working in FR of 2.0 mL/min which was not expected. These results might be due to a decrease of
residence time leading to an unsuccessfully binding of the virus and impurities.
The main advantage of working at high flow rates is certainly a shorter analysis time, which means
higher productivities during downstream processing. As can be seen in Table 11, the yield remained
constant when the flow rate was increased from 0.5 to 1.0 mL/min but strongly decreased when the
flow rate was increased to 2 mL/min. Therefore, a flow rate of 1 mL/min was chosen as compromise
between yield and throughput.
Moreover, when working at high flow rates (higher than 2 mL/min), the limiting factor was the back
pressure of the CIM® column which had shown a linear relation between the flow rate and the back
pressure and reached limiting working values.
4.5.6. The effect of different load volumes
The influence of loading different sample volumes was studied in the range of 0.5 to 5 mL. The results
obtained are depicted in Table 12.
Page 71
49
Table 12. Infectious BTV, recovery yield and purification factor in chromatographic fractions for 2 QA CIM® disks
at different flow rates.
Sample volume (mL) Live virus content Yield (%) PF
0.5 5.61×10³
TCID50 10 0.2
2.0 4.47×10⁴ TCID50 20 1.1
5.0 3.64×10⁵ TCID50 80 3.8
The injected volumes of 0.5 and 2.0 mL did not provide the recovery yields intended. When higher
volumes were applied, an increase in yields was verified which was not expected. A possible
explanation is related with possible virus losses during the fraction collection. There is always a
product loss associated with pooling different fractions, which is more pronounced if the initial sample
volume is lower like in this case. Consequently, the losses of BTV during fractionation had affected
strongly the overall BTV recovery yield when smaller sample volumes were loaded.
4.6. Monolithic chromatography VS Density gradient centrifugation
Density gradient centrifugation and monolithic chromatography were analyzed as possible methods to
concentrate and separate host debris from BTV virus in a repeatable manner.
The concentration and purification procedure using monolithic chromatography can be performed with
standard downstream process equipment and completed within two hours, using Amicon® Ultra
centrifugal filter devices or within half working day applying diafiltration/ultrafiltration through a hollow
fiber cartridge. Contrariwise, conventional concentration and purification in INIAV takes two working
days but it may take longer according to the type of gradient chosen and with previous PEG
precipitation as optional step. The main steps of each method are depicted in Figure 24.
Page 72
50
Figure 24. Comparison between conventional virus purification method and purification using CIM® disks.
Regarding density gradient centrifugation, this method gave a relatively low yield and virus can be
damaged maybe due the centrifugal forces. The situation may become worse using CsCl in the
gradient, leading to interactions with the virus and the chemicals and consequent loss of functionality.
Moreover, gradient separations in general are cumbersome and do not easily permit scale-up of the
process.
So, a comparison between the monolithic chromatography and traditional density gradient
centrifugation, differs in many parameters. When looking at yield only, monolithic chromatography had
higher yields. Additionaly, due to the centrifugation step in the density method, the volume of
supernatant used in each sample is constricted while for the chromatography method an unlimited
volume of supernatant can be loaded on each column. Also, the CIM® monoliths scalability under
previously optimized conditions would permit higher titers to be reached when using the larger
industrial-scale columns which were not investigated in this study.
The purity of the resulting virus fractions from SDS-PAGE analyses indicated that the purity of the two
methods is comparable. However, SDS-PAGE gel (Figure 25) showed that, in both methods, the
resulting viruses were not totally free of host impurities. Nevertheless, BTV concentrated and purified
by monolithic chromatography contained fewer impurities (Figure 25, Lane 2 vs Lane 4, gradient
centrifugation and monolithic chromatography, respectively).
Page 73
51
Figure 25. Silver stained reducing SDS-PAGE analysis of the density gradient centrifugation, ultrafiltration and
eluate from monolithic chromatography. Lane 1: Precision Plus Protein™ Dual Color Standards, molecular weight
(in kDa) at the left side; Lane 2: Density gradient centrifugation 200× concentrated; Lane 3: ultracentrifugation
200× concentrated; Lane 4: BTV 10× concentrated by monolithic chromatography using two QA monolithic
supports and as adsorption buffer 20 mM NaH2PO4 at pH 7.2 and elution buffer 20 mM NaH2PO4 with 1 mM
MgCl2 at pH 7.2.
After the optimization process, the chromatographic method was faster than density purification.
Layering of CsCl/sucrose gradients is a time consuming process, followed by a centrifugation step that
lasts 3 h to overnight, finishing with dialysis of the virus suspension which in turn takes several hours.
When looking at cost, both methods require expensive equipment: a High-performance liquid
chromatography (HPLC) for chromatography and an ultracentrifuge for CsCl/Sucrose purification.
Obviously, HPLC has broader general applicability in terms of protein purification. Apart from that, the
amount of CsCl needed to process a BTV stock is cheaper than one monolith, but the latter can be
reused a number of times, making it cheaper after several reuses.
The main disadvantage considering monolithic chromatography is the fact that no single step can
achieve the necessary virus yield, purity, and throughput and therefore must be integrated with an
ultrafiltration/diafiltration step to meet the requirements. Thus, monolithic chromatography needs either
an increase in the loaded volume of virus suspension (extra dilution) or an extra step (diafiltration)
prior to virus loading. Diafiltration, in particular, may not be practical for large volumes, making the
slight loss of BTV an acceptable trade-off for the increased speed of purification. Furthermore, another
drawback of the monolithic technology is that it may not separate RNA-containing mature virus
particles from the RNA-less procapsids, which can be accomplished by density gradient centrifugation
separating particles according to the differences in their sedimentation velocity. This phenomenon
should have been checked by SDS-PAGE gels.
Therefore, the decision to use each method needs to be made for each case separately.
Page 74
52
4.7. BTV concentration and purification using two-phase systems
4.7.1. Initial studies with PEG 3350/dextran 60-90 kDa
The objective of a successful protein extraction by ATPS is to find a suitable system where the
selective separation is achieved with the best yield. PEG/dextran and PEG/salt systems are the most
commonly used ATPS for protein separation. The partition of BTV was firstly tested in PEG/dextran
systems based on Albertsson and coworkers previous studies (Albertsson, et al., 1959) with the same
polymers although for different viruses. In this case, dextran forms the more hydrophilic, denser, lower
phase and PEG the more hydrophobic, less dense, upper phase.
The mechanism of partitioning is complex, empirical and cannot easily be predicted or understood.
Therefore, a detailed study was carried out to analyze the effect of composition of the system, pH,
ionic strength and type of polymer on the partition characteristics of the BTV present in the
supernatant.
Firstly, the 1.5 g systems were prepared containing 20% (w/w) corresponding to the feedstock loading.
However, due to the high dilution of the cell supernatant (1:5) and small amount of samples no results
were obtained by the TCID50 assay. To overcome this difficulty, final phase-system weight was
increased to 10 g and concomitantly the feedstock loading was increased to the maximum capacity of
the system. In this case, no water was added to the system achieve the final weight and consequently
the weight of feedstock loading corresponded to the one required to make up 10 g after the addition of
the polymers stock solutions.
After selecting the system scale, several PEG/dextran systems were prepared with different
compositions in order to select the most promising system composition for further studies on the effect
of ionic strength and pH. This selection was done based on phase diagrams reported by Zaslavsky
(Zaslavsky, 1995). In the phase diagrams, moving along the tie-lines means a different total
composition and volume ratio, although with the same final concentration of phase components in the
top and bottom phases. Therefore, distinct points from different tie-lines were chosen, including
systems corresponding to extreme phase volume ratios.
According to partition coefficients showed in Table 13, a one-sided distribution of BTV towards the
dextran-rich bottom phase was observed. The best results were obtained when dextran phase had the
minimal volume allowing virus concentration in the smaller dextran phase. In this system, Kp presented
the lowest value for all ATPS tested and the highest live virus content/yield. The volume of the bottom
phase was 9 times smaller than the top phase. In all cases, dextran contained the major fraction of the
virus. Nevertheless, recovery yields were always lower than 60%.
Concerning purity, LogKprot exhibited negative values which means that total protein partitioned
preferentially to the bottom phase decreasing the purity of the virus. Comparing the protein content
obtained by Bradford method in each phase with initial protein concentration in the feed stock loading,
it is possible to observe that in some assays the sum of the protein concentration in each phase were
Page 75
53
slightly higher than the initial protein content. One hypothesis was that this error could be related with
the interference of phase forming components. To avoid this interference, all samples were analyzed
against blanks containing the same phase composition but without feed stock loading samples.
Moreover, it was performed an assay where the feedstock loading was diluted in PEG/dextran with
different MW. In the case of the system composed by PEG 3350 Da and dextran 60-90 kDa, the
quantification was not significantly affected by the phase forming components which showed to be
correlated with MW of the PEG or dextran used. The results showed either an underestimation of the
feed stock loading protein content or an overestimation of protein concentration in each phase. In this
way, Bradford assay exhibited some drawbacks such as a non-reliable prediction of the protein
content in ATPS processes. Nevertheless, for these preliminary studies, this assay was performed in
order to give a roughly estimation of the impurities present in each phase.
Table 13. Composition of the systems used to study BTV partition and their respective extraction parameters in
PEG 3350 Da/dex 60-90 kDa.
System pH [NaCl] (mM)
VR Live virus content
(TCID50/mL) Live virus content
(TCID50) LogKp
Y (%)
LogKprot PF
10% (w/w) PEG
7.0 0 9 7.1 64
-4.8 0.0
-0.6 0.0
3% (w/w) Dex
4.57×10⁵ 4.57×10
5 59.1 4.1
4% (w/w) PEG
7.0 0 1.2 1.78×10
4 9.61×10
4
-0.5 15.7
-0.6 4.0
15% (w/w) Dex
5.75×10⁴ 2.59×10
5 42.4 3.0
8% (w/w) PEG
7.0 0 4 891 7.13×10
3
-1.9 1.0
-0.7 0.2
5% (w/w) Dex
7.25×10⁴ 1.45×10
5 20.0 3.4
7% (w/w) PEG
7.0 0 1.9 4.5 29
-4.0 0.0
-0.6 0.0
9% (w/w) Dex
4.58×10⁴ 1.60×10
5 2.4 3.4
In addition to the Bradford assay, the purity of the phases was qualitatively evaluated through the
SDS-PAGE gels (Figure 26).
Page 76
54
Figure 26. Silver stained reducing SDS-PAGE analysis of each phase. Lane 1: Precision Plus Protein™ Dual
Color Standards, molecular weight (in kDa) at the left side; Lane 2: Top Phase 4% (w/w) PEG 15% (w/w) Dex
system; Lane 3: Bottom Phase 4% (w/w) PEG 15% (w/w) Dex system; Lane 4: Top Phase 7% (w/w) PEG 9%
(w/w) Dex system; Lane 5: Bottom Phase 7% (w/w) PEG 9% (w/w) Dex system; Lane 6: Top Phase 10% (w/w)
PEG 3% (w/w) Dex system; Lane 7: Bottom Phase 10% (w/w) PEG 3% (w/w) Dex system; Lane 8: BTV
supernatant.
By observing Figure 26, it is possible to conclude that there are many impurities in the bottom-phase,
supporting the uneven distribution above described and corroborating the Bradford assay results. If
the main objective is to concentrate the virus, this method may be suitable although only with a partial
purification.
In order to test if the distribution of BTV was affected by the salt environment – as for other viruses
and proteins (Albertson, 1986) (Azevedo, et al., 2007) (Asenjo & Andrews, 2012) - the system with the
highest yield (10% PEG/3% Dex) was chosen to carry on the analysis as well as to study the pH effect
on the partitioning. Therefore, the salt influence was evaluated by maintaining all the conditions of the
reference system (10% PEG/3% Dex) and changing only the ionic strength in a range from 0 (systems
only with the inorganic salts provided by Glasgow Medium and FBS) to 300 mM NaCl. The same
strategy was done to study the pH in a range from 4.0 to 9.0. The results obtained are summarized in
Table 14 and the yields of top and bottom phases in Figure 27.
Page 77
55
Table 14. Effect of pH and NaCl concentration on the BTV extraction parameters in an ATPS composed by 10%
(w/w) PEG 3350 Da and 3% (w/w) dextran 60-90 kDa with a volume ratio (Vr) of 9.
System pH [NaCl] (mM)
Vr Live virus content
(TCID50/mL) Live virus content
(TCID50) LogKp LogKprot PF
10% (w/w) PEG 4.0 0
9 2.82×10³ 2.54×10
4 1.6 -0.8 0.9
3% (w/w) Dex 1 70.7 70.7
0.0
10% (w/w) PEG 4.0 150
9 4.5 40.1 -2.7 -1.0 1.2
3% (w/w) Dex 1 2.24×10³ 2.24×10
3
0.0
10% (w/w) PEG 4.0 300
9 4.5 40.1 0.0 -1.0 0.0
3% (w/w) Dex 1 4.5 4.5
0.0
10% (w/w) PEG 6.0 0
9 1.12×10⁴ 1.01×10
5 -1.4 -0.7 3.2
3% (w/w) Dex 1 2.88×10⁵ 2.88×10
5
1.7
10% (w/w) PEG 6.0 150
9 3.55×10³ 3.20×10
5 -1.6 -0.8 1.7
3% (w/w) Dex 1 1.41×10⁵ 1.41×10
5
1.0
10% (w/w) PEG 6.0 300
9 1.41×10³ 1.27×10
4 -1.5 -0.7 0.4
3% (w/w) Dex 1 4.57×10⁴ 4.57×10
4
0.3
10% (w/w) PEG 7.0 150
9 1.41×10³ 1.27×10
4 -2.4 -0.9 0.3
3% (w/w) Dex 1 3.63×10⁵ 3.63×10
5
1.0
10% (w/w) PEG 7.0 300
9 7.1 63.6 -4.1 -0.8 0.0
3% (w/w) Dex 1 9.11×10⁴ 9.11×10
4
2.7
10% (w/w) PEG 9.0 0
9 2.82×10⁴ 2.54×10
5 -0.6 -0.4 0.7
3% (w/w) Dex 1 1.12×10⁵ 1.12×10
5
1.0
10% (w/w) PEG 9.0 150
9 1.41×10³ 1.27×10
4 -2.4 -0.6 0.2
3% (w/w) Dex 1 3.63×10⁵ 3.63×10
5
1.5
10% (w/w) PEG 9.0 300
9 4.5 40.1 -4.3 -0.8 0.0
3% (w/w) Dex 1 9.11×10⁴ 9.11×10
4
3.3
Page 78
56
Figure 27. Effect of pH (pH 4.0, pH 6.0, pH 7.0, pH 9.0) and NaCl concentration on top yield (■) and bottom yield
(■) in PEG 3350/dextran 60-90 kDa ATPS.
Neutral salts are frequently used in aqueous two-phase systems to direct partitioning of target
molecules between phases, providing the means to manipulate distribution and hence separation of
biomolecules (Albertson, 1986) (Zaslavsky, 1995). According to the results shown above, it seems
that ionic strength at the highest concentration (300 mM NaCl) has had a toxicity effect on BTV once
the partition coefficients had decreased as well as the virus titer and consequently, the extraction
yield. This ionic strength may have ruptured the viral capsid and exposed BTV genome leading to a
loss of functionality. Furthermore, when NaCl is added to the system there is a decrease in the total
mass of water. This makes each phase even more concentrated and molecular packing becomes
more compact. Thereby, dextran becomes more hydrophilic. This could be another reason why the
yields of top phase have decreased for higher salt concentrations. Taking this into account, this could
be an approach to increase the partitioning to the bottom phase although would be necessary to
choose a nontoxic salt concentration such as 150 mM NaCl, close to the physiological salt
concentration.
With an increase of salt concentration, higher LogKprot were expected once this favors the partitioning
of positively charged proteins to the top phase (Azevedo, et al., 2007). However, as observed in
previous IEF studies (Figure 18), the supernatant does not contain significantly positively charged
proteins. Therefore, the results for Kprot were quite similar which means that there were not
improvements regarding the purity of the virus.
Concerning pH, BTV was more stable at alkaline than at acid pH. Unlike other kind of viruses, such as
picornaviruses which are stable between pH 3 and 9 (Oliveira, et al., 1999), BTV has a narrower zone
of pH stability as previously described (Svehag, et al., 1966). In this study, BTV was sensible to acid
pH, being inactivated at pH 4.0 with yields close to zero. The best results were obtained at pH 7.0.
Page 79
57
4.7.2. Studies with PEG 3350 Da/Dextran 500 kDa
The influence of the increasing of the MW of dextran from 60-90 kDa (in previous section) to 500 kDa
on the extraction parameters was investigated. The MW of a polymer influences the BTV partition by
changing the number of polymer–virus interactions. This is usually attributed to hydrophilic interactions
between the side chains of dextran and the hydrophilic regions on the surface of the virus. Moreover,
the molecular exclusion effect becomes more pronounced for higher MW.
The results obtained are summarized in Table 15.
Table 15. Composition of the systems used to study BTV partition and their respective extraction parameters in
PEG 3350 Da/Dextran 500 kDa ATPS.
System pH [NaCl] (mM)
VR Live virus content
(TCID50/mL) Live virus content
(TCID50) LogKp
Y (%)
LogKprot PF
10% (w/w) PEG
7.0 0 5.3 1.41×10
3 1.13×10
4
-2.5 1.6
-0.23 0.9
3% (w/w) Dex
4.57×10⁵ 6.86×10
5 88.7 8.4
4% (w/w) PEG
7.0 0 1.2 4.47×10
4 2.46×10
4
-1.3 4.0
-0.26 1.2
15% (w/w) Dex
8.92×10⁴ 4.01×10
5 65.8 5.3
8% (w/w) PEG
7.0 0 4.2 2.24×10
3 1.68×10
4
-2.2 2.3
-0.29 1.3
5% (w/w) Dex
3.63×10⁵ 6.53×10
5 90.2 7.9
7% (w/w) PEG
7.0 0 1.9 4.4 29
-4.3 0.0
-0.24 0.0
9% (w/w) Dex
9.11×10⁴ 3.19×10
5 54.5 5.0
By observing the Table 15, it is possible to conclude that generally the systems had a lower partition
coefficient in comparison with systems with lower MW as well as higher yields. This is probably due to
the increasing in the hydrophilicity of the dextran-rich phase as the polymer molecular weight
increases, which promotes the partitioning of the virus which seems to be more hydrophilic towards
the dextran-rich phase. Almost all the LogKprot have increased which means that the purity of BTV in
these systems is higher when compared with a lower MW of dextran. This increase in the partition
coefficient of the impurity proteins may be due to an increase in the steric exclusion of proteins from
the dextran-rich phase where the virus occupies all the “empty space”. Another reason could be the
“shielding” effect on Bradford assay as described previously. An increase in the length of the dextran
molecules may have led to a weaker binding of the dye, slowing down the color reaction and reducing
the analytical values.
The effect of the ionic strength was studied for the systems composed by 10% PEG and 3% Dex in
order to compare with the results described above as well as to have a dextran phase with a minimal
volume. The results are summarized in Table 16 and the yields are illustrated in Figure 28.
No systems were performed at pH 4.0 with 300 mM NaCl once these conditions have previous led to a
significant impact on virus infectivity before (see section 4.7.1.).
Page 80
58
Table 16. Effect of pH and NaCl concentration on the BTV extraction parameters in an ATPS composed by 10%
(w/w) PEG 3350 Da and 3% (w/w) dextran 500 kDa with a Vr of 9.
System pH [NaCl] (mM)
VR Live virus content
(TCID50/mL) Live virus content
(TCID50) LogKP LogKprot PF
10% (w/w) PEG
4 0 5.3 5.61 44.9
-3.5 -0.67 0.0
3% (w/w) dex
1.78×10⁴ 2.67×10
4 4.1
10% (w/w) PEG
4 150 6.9 4.45 36.9
-3.2 -0.20 0.0
3% (w/w) dex
7.07×10³ 8.5×10
3 0.8
10% (w/w) PEG
6 0 5.3 7.07 56.6
-4.8 -0.26 0.0
3% (w/w) dex
4.57×10⁵ 6.85×10
5 7.7
10% (w/w) PEG
6 150 5.3 4.50 36.0
-4.9 -0.27 0.0
3% (w/w) dex
3.63×10⁵ 5.44×10
5 5.1
10% (w/w) PEG
6 300 5.3 5.61 44.9
-3.5 0.00 0.0
3% (w/w) dex
1.78×10⁴ 2.67×10
4 3.3
10% (w/w) PEG
7 150 5.3 4.45 35.6
-5.01 -0.14 0.0
3% (w/w) dex
4.57×10⁵ 6.85×10
5 7.5
10% (w/w) PEG
7 300 5.3 7.07 56.6
-4.00 -0.13 0.0
3% (w/w) dex
7.08×10⁴ 1.06×10
5 1.6
10% (w/w) PEG
9 0 5.3 5.61 44.9
-4.81 -0.33 0.0
3% (w/w) dex
3.63×10⁵ 5.44×10
5 6.0
10% (w/w) PEG
9 150 5.3 4.45 35.6
-5.01 -0.35 0.0
3% (w/w) dex
4.57×10⁵ 6.85×10
5 9.0
10% (w/w) PEG
9 300 5.3 4.45 35.6
-4.10 -0.33 0.0
3% (w/w) dex
5.62×10⁴ 8.43×10
4 9.3
Page 81
59
Figure 28. Effect of pH (pH 4.0, pH 6.0, pH 7.0, pH 9.0) and NaCl concentration on top yield (■) and bottom yield
(■) in PEG 3350/dextran 500 kDa ATPS.
Comparing with the preceding results, the difference between the obtained yields clearly show that
this higher MW is more appropriate than the previous one for BTV concentration and purification.
Another important fact is that the conditions which favor the partitioning of BTV also favor the
partitioning of the impurities as proved by Kprot. However, the partitioning of the impurities was higher
in the top phase and higher purification factors were obtained in these systems, presenting, therefore,
better purities.
One of the major drawbacks in the industrial application of dextran is related to its high cost and high
viscosity. To handle these disadvantages, PEG/Salt systems have been preferred for large-scale
proteins extraction. For that reason, some studies were performed in order to evaluate and compare
the extraction performance of ATPS using a polymer/salt approach rather than polymer/polymer.
However, PEG-dextran systems have an advantage over PEG-Salt systems related with the waste
disposal since starch and cellulose derivatives are biodegradable (Venâncio, et al., 1996).
4.7.3. Studies with PEG 3350 Da/Phosphate
Some PEG/salt systems were performed in order to find the best system composition for further ionic
strength and pH studies. The selection of the composition was made based on phase diagrams
reported by Zaslavsky (Zaslavsky, 1995). In the phase diagrams, moving along the tie-lines means a
different total composition and volume ratio, although with the same final concentration of phase
components in the top and bottom phases. Therefore, distinct points from different tie-lines were
chosen, as well as points corresponding to extreme phase volume ratios.
It should be noted that the ionic components (the salt) had a negative impact upon BHK-21 cells
during TCID50 assays since cells had presented a different aspect namely, cells shrinking.
Page 82
60
Nevertheless, the TCID50 results were considered valid since it was feasible to check the cytopathic
effect in the cells at higher dilutions of the salt phase showing them no toxic effect caused by the salt.
Additionally, the protein content of both phases was not successively determined, once the protein
quantification by Bradford assay had interferences caused by the phase forming components, namely
in the bottom phosphate-rich phase. Thus, the purity was only qualitatively evaluated through SDS-
PAGE gels. The results obtained are summarized in Table 17.
Table 17. Composition of the systems used to study BTV partition and their respective extraction parameters in
PEG 3350 Da/Phosphate ATPS.
System pH [NaCl] (mM)
VR Live virus content
(TCID50/mL) Live virus content
(TCID50) LogKp Y (%)
28% (w/w) PEG
7.0 0 5.1 1.12×10
4 8.62×10
4
-0.6
22.6
5% (w/w) Phosp.
4.47x10⁴ 6.71×10
4 17.6
22% (w/w) PEG
7.0 0 3.5 1.45×10
4 1.02×10
5
-0.9
26.3
7% (w/w) Phosp.
1.12x10⁵ 2.24×10
5 58.0
15% (w/w) PEG
7.0 0 0.8 4.47×10
4 1.79×10
5
-0.1
24.6
10% (w/w) Phosp.
5.62×10⁴ 2.81×10
5 38.6
6% (w/w) PEG
7.0 0 0.3 5.63×10
4 1.13×10
5
0.1
19.9
15% (w/w) Phosp.
4.47×10⁴ 3.13×10
5 55.3
By observing the partition coefficients in Table 17, it was possible to conclude that almost in all the
systems, the BTV partitioned preferentially to the bottom-salt phase. Additionally, the systems
exhibited a much higher partition coefficient in comparison with polymer/polymer systems.
Page 83
61
Figure 29. Silver stained reducing SDS-PAGE analysis of each phase. Lane 1: Top Phase 28% (w/w) PEG 5%
(w/w) Phosp system; Lane 2: Bottom Phase 28% (w/w) PEG 5% (w/w) Phosp system; Lane 3: Top Phase 22%
(w/w) PEG 7% (w/w) Phosp system; Lane 4: Bottom Phase 22% (w/w) PEG 7% (w/w) Phosp system; Lane 5:
Precision Plus Protein™ Dual Color Standards, molecular weight (in kDa) at the left side; Lane 6: Bottom Phase
15% (w/w) PEG 10% (w/w) Phosp system; Lane 7: Top Phase 15% (w/w) PEG 10% (w/w) Phosp system; Lane
8: Top Phase 6% (w/w) PEG 15% (w/w) Phosp system; Lane 9: Top Phase 6% (w/w) PEG 15% (w/w) Phosp
system.
By observing the Figure 29, it was possible to conclude that there are many impurities in the bottom-
phase, supporting a preferential partitioning of the impurities towards the salt-rich phase. If the main
objective is to concentrate the virus, this method may be suitable although only with just a partial
purification. Considering the virus purification, it is possible to deduce that the purity evaluation in this
work presents several difficulties, regarding the same molecular weight of bands corresponding to the
viral proteins and the impurities in the supernatant as well as smeared protein gels due to the
presence of polymers and salts. With Bradford method, as explained previously, the phase forming
components of PEG/Salt systems had an effect on protein concentration making this method
unemployable for the protein quantification.
The system that exhibited the best compromise between concentration and recovery yield was the
one composed by 22% (w/w) PEG and 7% (w/w) phosphate. For that reason it was chosen to carry on
with ionic strength and pH studies, as tested previously for PEG/dextran ATPS (section 4.7.1.). No
systems were performed at pH 4.0 and 300 mM NaCl once this pH and ionic strength have had a
significant negative impact on virus infectivity, as showed in previous studies. The results obtained are
summarized in Table 18 and the yields are depicted in Figure 30.
Page 84
62
Table 18. Effect of pH and NaCl concentration on the BTV extraction parameters in PEG 3350 Da/phosp ATPS.
System pH [NaCl] (mM) VR Live virus content (TCID50/mL) Live virus content (TCID50) LogKp
22% (w/w) PEG 6.0 0 3.8
2.82×10⁴ 2.12×10
5
-0.4 7% (w/w) phosp. 7.08×10
4 1.42×10
5
22% (w/w) PEG 6.0 150 4.2
1.41×10⁴ 1.07×10
5
-0.5 7% (w/w) phosp. 4.47×10
4 8.05×10
3
22% (w/w) PEG 7.0 0 3.5
1.45×10⁴ 1.02×10
5
-0.9 7% (w/w) phosp. 1.12×10
5 2.02×10
5
22% (w/w) PEG 7.0 150 4.3
1.78×10⁴ 1.37×10
5
-0.7 7% (w/w) phosp. 8.92×10
4 1.61×10
5
22% (w/w) PEG 9.0 0 3.8
5.63×10⁴ 4.22×10
5
-0.3 7% (w/w) phosp. 1.12×10
5 2.24×10
5
22% (w/w) PEG 9.0 150 4.1
2.82×10⁴ 2.06×10
5
-0.7 7% (w/w) phosp. 1.41×10
5 2.54×10
5
Figure 30. Effect of pH (pH 6.0, pH 7.0 and pH 9.0) and NaCl concentration (0 mM NaCl and 150 mM NaCl) on
top yield (■) and bottom yield (■) in PEG 3350/Phosp ATPS.
Unlike polymer/polymer systems, BTV was not recovered in a specific phase. Therefore the
partitioning was not well defined. Furthermore, in this specific case, the partition coefficients did not
correspond to a real tendency in the partitioning once the partition coefficient values obtained were
negative indicating a possible virus recovery in the bottom phase although with higher yields in the top
phase than in the bottom phase.
Proteins usually exhibit a preferential partition towards the less hydrophobic phase due to their
hydrophilic character. Concerning viruses, the same principle can be applied. The results suggested
that for the system studied, the use of a salt had promoted the partition of BTV to the more
hydrophobic PEG-rich phase. A strategy to promote a higher partitioning to the PEG-rich phase would
Page 85
63
be an increase of the hydrophobicity driving force between the top and bottom phases using a higher
amount of salt. However this was not observed, as shown in Figure 28.
A possible reason for these discrepancies could be attributed to the TCID50 assay. TCID50 is a
biological assay dependent on many factors including the age of the BHK-21 culture, number of
subcultures, presence of cell debris which interferes during the infection, small variations in time of
contact during the infection, visualization of the cytophatic effect and lastly the day in which the ATPS
and TCID50 were performed considering that BTV might be sensitive to the ATPS environment.
4.7.4. Studies with PEG 1000 Da
It was demonstrated previously that the MW of dextran had affected the composition of phases and
the number of polymer–protein interactions. For that reason, the effect of the PEG MW was also
studied. Once the impurities partitioned to the bottom phase in PEG/dextran systems, the virus
partitioning to the top phase would be preferred. PEG of low molecular weight would be beneficial for
virus partitioning since it would originate a breakdown in the phase components interactions,
facilitating the transfer of the virus from one phase to the other. Additionally, PEG of low molecular
weight tends to interact strongly with proteins, while high molecular weight PEG is more likely to form
intra molecular bonds, which further increases the interfacial tension (Pico, et al., 2007). Generally,
increasing the molecular weight of a phase forming polymer will cause the accumulation of a protein in
the opposite phase. Therefore, the best systems obtained heretofore were tested with lower PEG MW
of 1000 Da. The results are summarized in Table 19.
Table 19. Effect of PEG MW on the BTV extraction parameters in the best performing systems previously
obtained.
System pH [NaCl] (mM)
VR Live virus content
(TCID50/mL) Live virus content
(TCID50) LogKp Y (%)
10% (w/w) PEG 1000 Da
7.0 0 4.0
2.82×10⁴ 2.26×10
5
-0.8
30.5
3% (w/w) dextran 60-90
kDa 1.78×10
5 3.56×10
5 48.2
10% (w/w) PEG 1000 Da
7.0 0 8.5
2.82×10⁴ 2.40×10
5
-0.7
32.4
3% (w/w) dextran 500
kDa 1.41×10
5 1.41×10
3 19.1
22% (w/w) PEG 1000 Da
7.0 0 0.4 4.47×10
4 1.34×10
5
0.3 34.7
7% (w/w) phosp.
2.24×10⁴ 1.57×10
5 40.6
It was expected a higher partitioning to the PEG-rich phase although a significant amount of BTV was
still present in the bottom phase, i.e., in the dextran phase.
The PEG/salt system is inexpensive although its partitioning was not well defined for all the systems
studied. Moreover, its application is limited due to presence of salt concentrations which may denature
BTV.
Page 86
64
4.8. Comparison between ATPS and Density Gradient Centrifugation
Density gradient centrifugation and ATPS were analyzed as possible methods to concentrate and
separate BTV from the supernatant in a repeatable way. Both procedures are simple, quick and the
yield of BTV is relatively high. However, SDS-PAGE gels (Figure 31) showed that, in both methods,
the resulting viruses were not totally free of host contaminants once the conditions which favor the
partitioning of BTV in ATPS also favor the partitioning of the contaminant proteins. Considering density
gradient centrifugation, due to the heterogeneity in biological particles, this centrifugation suffers from
contamination and poor recoveries. This fact might be addressed by resuspension and repetition of
the centrifugation steps (i.e., washing the pellets obtained). Using this method, the final BTV recovery
from 100 mL of supernatant was 55%. Some BTV was lost since part of it remained in the initial low-
speed supernatant and a considerable number were lost in the pellet.
Figure 31. Silver stained reducing SDS-PAGE analysis of the density gradient centrifugation, ultrafiltration and
ATPS best performing systems. Lane 1: Precision Plus Protein™ Dual Color Standards, molecular weight (in
kDa) at the left side; Lane 2: Density gradient centrifugation 200 x concentrated; Lane 3: ultracentrifugation 200 x
concentrated; Lane 4: BTV concentrated by ATPS – Bottom phase 10% (w/w) PEG 3% (w/w) Dex 60-90 0 mM
NaCl pH 7.0 system; Lane 5: BTV concentrated by ATPS – Bottom phase 10% (w/w) PEG 3% (w/w) Dex 500
kDa, 150 mM NaCl pH 7.0 system; Lane 6: BTV concentrated by ATPS – Bottom phase 22% (w/w) PEG 7%
(w/w) Phosp, 0 mM NaCl pH 7.0 system.
Based on recovery of BTV, both techniques have proved being useful as simple methods for
concentrating viruses from animal cells for biochemical and serological investigations although with
limitations regarding purification.
ATPS advantages over density gradient centrifugation include easy removal of cell debris, scalability,
low cost of chemicals when using PEG/salt systems and short processing time. A disadvantage
Page 87
65
inherent is the contamination of BTV by polymers/salts. Special procedures must therefore be
employed for their removal.
Concerning the expended time, the main steps of each method are depicted in Figure 32. ATPS
process was done within less than 1 hour counting the clarification of the liquid culture and the
aqueous extraction. Including cell harvesting step may be a future viable alternative with a decrease in
the working time. Contrariwise, conventional concentration and purification in INIAV takes two working
days but it may take longer according to the type of gradient chosen and with previous PEG
precipitation as optional step.
Figure 32. Comparison between conventional virus concentration and purification method and concentration and
purification using ATPS.
Page 89
67
5. MVV Results and Discussion
The ultimate objective of this investigation was to analyze the main similarities and divergences in the
partitioning caused by the morphologic differences between MVV and BTV. These results would show
whether is possible or not to generalize the downstream processing to other specimens.
Apart of their proteins, the major difference between MVV and BTV is that MVV has a capsid
surrounded by an envelope derived from the plasma membrane of the host cell whereas BTV does not
have this lipid envelope. Concerning the downstream process, this fact is important to take into
account once more MVV may be lost during the clarification process due to the merging of both
membranes, from the virus and from the host.
5.1. Production of cell culture-derived MVV
SCP cells obtained from a MVV seronegative sheep are the classic susceptible cells used to study
Visna virus infection in vitro in INIAV. The cells were maintained as described in Section 3.2. At 3 days
after inoculation, there were clear indications of the virus infection through an extensive cytopathic
effect as shown in Figure 39. Thereafter, the supernatant containing the viral antigens was clarified for
further concentration by density gradient centrifugation, monolithic chromatography or ATPS.
Figure 33. Microscopic view of the cytopathic effect. Uninfected cells are shown as the negative control after 3
days (A), followed by infected cells (B). Magnification 40×.
The cytopathic effect was characterized by the appearance of refractile stellate cells accompanied by
the formation of syncytia. Polykaryocytes were observed within 48 and 72 h after infection resulting of
the direct fusing effect of the MVV. Polykaryocytes appeared more prominent after 72 h. At 72 h after
infection the observation of polykarycytes was easier due to the increased number of nuclei [Figure 33
(B)]. Uninfected SCP cells did not show any CPE [Figure 33 (A)].
Comparing with the production of BTV, MVV was much more difficult to produce due to the slower
replication rate of the virus. SCP cells are primary cells meaning that SCP are cultured directly from a
subject. Contrary to tumors cell lines, most primary cell cultures have limited lifespan. After a certain
Page 90
68
number of population doublings, cells undergo the process of senescence and stop dividing. On the
other hand, BHK-21 are an immortalized cell line which means that the cells acquired the ability to
proliferate indefinitely. Moreover, BHK-21 were much simpler to work with. However, they do not
represent what is occurring in vivo exactly. Oppositely, primary cell lines are not well characterized
and are very slow in proliferation. It took about two weeks to proliferate 500 mL of cells for further MVV
inoculation in contrast with the few days taken by BHK-21 cells for BTV multiplication.
According to INIAV, the virus titration in the initial supernatant was 103 TCID50/mL. MVV replicated well
in SCP cells, but only to low titers which is usual in this type of virus.
5.2. MVV analytical methods establishment
Unlike BTV, an ELISA test using monoclonal antibodies directed against the envelope protein p90 of
MVV was totally established in INIAV and accessible for relative quantification of MVV.
Firstly, the clarified supernatant was subjected to an ELISA assay and had presented low optical
density (OD) values (≈0.371). Therefore, in order to test the ability of the alternative methods to
concentrate MVV, the resulting fractions or phases were used in ELISA tests and the obtained signals
compared with the ones obtained for the concentrated one, by the conventional method. Moreover,
the ELISA readings were used to estimate the effectiveness of the concentration procedure taking as
reference the optical densities (OD) acquired with the centrifuged sample. ELISA could be used to
compare the relative levels of the virus, since the intensity of signal varies directly with the antigen
concentration (in the linear range of the calibration curve).
The 100× concentrated sample by density gradient centrifugation was subjected to the ELISA assay.
On each microtiter plate, a series of dilutions of the pre-purified MVV preparations were added in order
to get the standard values. Average absorbance of the samples was corrected by subtracting the
appropriate average absorbance of the internal negative control which corresponded to 20 mM
NaH2PO4 in the case of monolithic chromatography or PEG and dextran aqueous phase in the case of
ATPS.
Table 20. Results of ELISA analysis of MVV after concentration (100×) by density gradient centrifugation. The
OD values correspond to ELISA readings after 20 min of incubation with the substrate.
ELISA
Dilution meanOD values
1:500 0.925
1:1000 0.540
1:2000 0.293
1:4000 0.165
1:8000 0.154
1:16000 0.122
Page 91
69
5.3. Feedstock characterization
Different feedstocks were used for further virus comparison, specifically i) direct supernatant, ii)
supernatant 100× concentrated by ultracentrifugation, iii) supernatant 100× concentrated and purified
by density gradient centrifugation, iv) purified MVV by PEG precipitation and v) diafiltrated by
ultrafiltration with a 10 KDa MWCO hollow fiber module. Figure 34 shows the protein profile present in
these different feedstocks using SDS-PAGE.
Figure 34. (A) Silver stained and (B) Coomassie stained reducing SDS-PAGE analysis of the feedstocks. (A)
Lane 1: MVV 100× concentrated by ultracentrifugation; Lane 2: MVV 100× concentrated by density gradient
centrifugation; Lane 3: Precision Plus Protein™ Dual Color Standards, molecular weight (in kDa) at the left side;
Lane 4: MVV purified by PEG precipitation; Lane 5: Clarified SCP cell supernatant; Lane 6: DMEM®
supplemented with FBS; (B) Lane 1: Precision Plus Protein™ Dual Color Standards, molecular weight (in kDa) at
the left side; Lane 2: Supernatant buffer exchanged by ultrafiltration/diafiltration.
SDS-PAGE gels revealed the presence of several impurities from the DMEM® supplemented with
FBS where the cells were expanded.
MVV has two major proteins which are the core protein p25 (25 kDa) and the major envelope protein
gp135 (135 kDa) (Pépin, et al., 1998). None of these MVV proteins were considered in the gels as a
consequence of the high amount of impurities with similar MW. Thus, the purity evaluation was difficult
to assess. In the most purified sample, which corresponded to the one obtained by PEG-precipitation
(Figure 34, Lane 4), the amount of proteins was much lower when compared to the other samples.
Nonetheless, it was impossible to discern any viral protein. Therefore, the SDS-PAGE for MVV gels
have reinforced the difficulties in the purity evaluation in this work.
Thereafter, a Western immunoblot was performed with the supernatant 100× concentrated by density
gradient centrifugation using anti-WLC-1 MVV antisera.
Page 92
70
Figure 35. Western blot analyses of the 100× concentrated MVV by density gradient using anti-WLC-1 MVV
antisera.
Response to at least three MVV specific bands was seen in the nitrocellulose membrane (Figure 35).
A strong p25 band was found as well as a narrow and weak gp44 band. At the top of the strip there
was a band corresponding to the gp135 (both gp44 and gp135 not visible in the scanned image).
Additionally, an isoelectric focusing (IEF) was performed in order to check the isoelectric point (pI) of
the MVV and other proteins present. The pI value reported in the literature for MVV is 3.8 (Haase &
Baringer, 1974). The IEF gel obtained is shown in the Figure 36.
Figure 36. Silver stained IEF gel of the supernatants further treated by ultracentrifugation or density gradient
centrifugation. Lane 1: pI broad standards (from bottom to top: amyloglucosidase - 3.50, methyl red - 3.75,
soybean trypsin inhibitor - 4.55, β- lactoglobulin A - 5.20, bovine carbonic anhydrase B - 5.85, human carbonic
anhydrase B - 6.55, horse myoglobin-acetic band - 6.85, horse myoglobin-basic band - 7.35, lentil lectin-acidic
band - 8.15, lentil lectin-middle band - 8.45, lentil lectin-basic band - 8.65, trypsinogen - 9.30); Lane 2: MVV 100×
concentrated by density gradient centrifugation; Lane 3: BTV 100× concentrated by ultracentrifugation; Lane 4:
PEG-precipitated MVV.
Page 93
71
The IEF revealed that MVV, DMEM® and FBS proteins have an acidic isoelectric point, like BTV and
GMEM®. The sample treated by density gradient centrifugation (Figure 36, Lane 2) shows higher
purity and proteins precipitated by PEG were not seen even in gel replicates. For IEF, the average
sensitivity limit of the silver staining technique is estimated to be 1 to 5 ng protein per band
(Amersham Biosciences, 1998). As shown in the previous SDS-PAGE gel (Figure 34, Lane 4), the
MVV PEG-precipitated presented higher purities when compared to the other samples meaning that
probably the amount of remaining MVV was extremely low. Therefore it proteins were not visible in
silver stained IEF gels.
5.4. Feedstock diafiltration
As shown in Section 4.4., due to their high conductivity, the supernatants required an
ultrafiltration/diafiltration step before the chromatography process. Thus, the MVV supernatant was
subjected to a diafiltration process with a 10 kDa MWCO ultrafiltration membrane similarly to BTV.
During the process, the conductivity in the concentrate and in permeate were monitored as well as the
relative concentration of MVV by ELISA, to guarantee that the shear tensions would not damage the
viral integrity. The diafiltration was performed against Milli-Q water pH 6.0 The results obtained for the
concentrate are illustrated in Figure 37.
Figure 37. Virus relative titer by ELISA meanOD at 450 nm (●) and conductivity (●) in the retentate as a function
of diafiltration volumes for the MVV supernatant buffer exchanged into Milli-Q water pH 6.0.
The data show differences before and after diafiltration experiments indicating that the virus integrity
was affected by shear stress during the process. The mean OD was calculated in the permeate as
well, although the results were close to the blank values. This reinforces that the loss of the virus
signal was not due to the ultrafiltration membrane but to the shear stress imposed by the process.
Thus, other parameters such as rejection coefficient and permeate flux were not calculated once this
technique showed being unsuitable for MVV unlike BTV.
Working with MVV presented some difficulties when compared with BTV. The sample had to be
treated as soon as possible after harvesting, since loss of functionality occurs over time. The virus was
0
1
2
3
4
5
6
7
8
9
10
0.000
0.050
0.100
0.150
0.200
0.250
0.300
0.350
0.400
0 1 2 3 4
Diafiltration Volumes
Co
nd
uct
ivit
y (m
S/cm
)
Mean
OD
(450
nm
)
Page 94
72
refrigerated, placed on wet ice immediately after all the processes to keep it cool once loss of integrity
is slower at low temperatures (2-8°C). Notwithstanding, making all these efforts, the decrease of the
MVV concentration was not avoidable.
In sum, the feedstock diafiltration was not suitable for processing MVV supernatant unlike BTV which
is a more robust virus. A possible resolution for this problem was a pre-purification step with a PEG-
precipitation where the conductivity was decreased without applying shear stress.
5.5. Chromatography using monolithic supports
To start the chromatographic studies, a weak anion exchanger DEAE was used. The main criterion for
optimization would be the highest OD value obtained expressing, consequently, the highest amount of
the virus in the fraction. In the best scenario, the FT peak should only have impurities leading to ODs
close to zero whereas the elution peak would have a huge OD signal. Regarding the purification of the
virus, MVV had presented many difficulties, even more than BTV. The SDS-PAGE gels were not
conclusive and just having a relative and comparative quantification did not allow a calculation of
purities or purification factors unlike BTV. In sum, the purity assessment seemed to be very difficult
when studying virus concentration and purification.
The supernatant without a preconditioning step was loaded into the column, with an adsorption buffer
composed by 20 mM NaH2PO4 with1 mM MgCl2 and 175 mM NaCl at pH 7.2 and an elution buffer by
20 mM NaH2PO4 with 1 mM MgCl2 and 2 M NaCl at pH 7.2, as illustrated in Figure 38.
Figure 38. CIM DEAE® chromatography profile of MVV concentration from clarified SCP cells supernatant, using
as adsorption buffer 20 mM NaH2PO4 with 1 mM MgCl2 and 175 mM NaCl at pH 7.2 and elution buffer 20 mM
NaH2PO4 with1 mM MgCl2 and 2 M NaCl at pH 7.2. Absorbance at 280 nm (mAU) – blue line, conductivity
(mS/cm) - dashed blue line.
The results displayed by the chromatogram in Figure 38 confirm the need of lower conductivity values
(from 20 mS/cm to the advised 5 mS/cm) and a previous conditioning of the supernatant. However, as
described in Section 5.4., the diafiltration process with a 10 kDa MWCO ultrafiltration membrane has
shown not suitable for this virus in particular due to its lability.
0
20
40
60
80
100
120
0
50
100
150
200
250
300
350
0 5 10 15
Co
nd
ucti
vit
y (
mS
/cm
)
Ab
s2
80
nm
(mA
U)
V (mL)
Page 95
73
Thereafter, the pellet obtained by PEG precipitation was resuspended in water and taken as feedstock
and the chromatographic run was repeated. Unfortunately, the chromatogram and ELISA results
suggested that MVV did not bind to the monolith again once the entire virus present in the supernatant
was found in the flowthrough fractions due to the conductivity associated to the amount of salt (0.4
mM NaCl) added to precipitate MVV virions in the PEG-precipitation step.
Altogether, monolithic chromatography seemed to be not suitable for MVV processing since no
conductivity requirements were fulfilled.
5.6. MVV concentration using two-phase systems
5.6.1. Initial studies with PEG 3350/dextran 60-90 kDa
Firstly, the partition of MVV was tested in PEG/dextran systems as performed in preceding BTV
studies. In a similar way as BTV, no water was added, so the weight of feedstock loading
corresponded to the one required to make up 10 g.
Bearing in mind the problems related to the purity evaluation, the PEG-precipitated sample with a low
meanOD was considered as feedstock once the presence of impurities was extremely low. Therefore,
since no concentration step was done after pellet resuspension, the ATPS process had as objective
the virus concentration.
The main criterion for optimization was meanOD obtained by ELISA, which represented the relative
amount of the virus in each phase. Since the meanOD is directly proportional to the virus
concentration, the Kp was calculated by dividing both ODs in top phase and bottom phase.
Additionally, the theoretical yield (Y) was calculated as the amount of virus present in each phase
(meanOD × volume of the phase) divided by the theoretical original amount loaded into the system
(meanOD of the top phase × volume of the top phase + meanOD of the bottom phase × volume of the
bottom phase). Several PEG/dextran systems were performed based on phase composition of the
BTV ATPS systems.
Table 21. Composition of the systems used to study MVV partition and their respective extraction parameters in
ATPS composed by PEG 3350 Da and dextran 60-90 kDa.
System pH [NaCl] (mM) VR Phase meanOD LogKp Y(%)
10% (w/w) PEG 7.0 0 9.0
Top 0.158 -0.59
39.7
3% (w/w) dex Bottom 0.614 60.3
4% (w/w) PEG 7.0 0 1.4
Top 0.179 -0.18
34.2
15% (w/w) dex Bottom 0.273 65.8
8% (w/w) PEG 7.0 0 4.0
Top 0.172 -0.41
38.3
5% (w/w) dex Bottom 0.444 61.7
7% (w/w) PEG 7.0 0 2.0
Top 0.190 -0.52
21.3
9% (w/w) dex Bottom 0.625 78.7
Page 96
74
According to the theoretical yields and Kp showed in Table 21, MVV was more concentrated in the
bottom phase similarly to BTV. In all cases dextran contained the major fraction of the virus.
In order to test if the distribution of MVV was affected by the ionic strength as observed for BTV, the
system with the smallest dextran phase (10% PEG/3% dex) was chosen for further analysis with salt
concentrations ranging from 0 mM NaCl to 300 mM NaCl and within a pH range of 4.0 to 9.0. The
results obtained are summarized in Table 22.
Table 22. Effect of pH and NaCl concentration on MVV extraction parameters in an ATPS composed by 10%
(w/w) PEG 3350 and 3% (w/w) dextran 60-90 kDa with a volume ratio (Vr) of 9.
System pH [NaCl] (mM) VR Phase meanOD LogKp Y(%)
10% (w/w) PEG 4.0 0 9
Top 0.251 -0.59
39.7
3% (w/w) dex Bottom 0.282 60.3
10% (w/w) PEG 4.0 150 9
Top 0.253 -0.18
77.3
3% (w/w) dex Bottom 0.261 22.7
10% (w/w) PEG 4.0 300 9
Top 0.278 -0.41
58.3
3% (w/w) dex Bottom 0.201 41.7
10% (w/w) PEG 6.0 0 9
Top 0.221 -0.52
54.9
3% (w/w) dex Bottom 1.001 45.1
10% (w/w) PEG 6.0 150 9
Top 0.233 -0.59
39.7
3% (w/w) dex Bottom 0.961 60.3
10% (w/w) PEG 6.0 300 9
Top 0.290 -0.18
77.3
3% (w/w) dex Bottom 0.300 22.7
10% (w/w) PEG 7.0 150 9
Top 0.349 -0.41
58.3
3% (w/w) dex Bottom 0.460 41.7
10% (w/w) PEG 7.0 300 9
Top 0.235 -0.52
54.9
3% (w/w) dex Bottom 0.236 45.1
10% (w/w) PEG 9.0 0 9
Top 0.249 -0.18
77.3
3% (w/w) dex Bottom 0.432 22.7
10% (w/w) PEG 9.0 150 9
Top 0.232 -0.41
58.3
3% (w/w) dex Bottom 0.394 41.7
10% (w/w) PEG 9.0 300 9
Top 0.236 -0.52
54.9
3% (w/w) dex Bottom 0.259 45.1
The theoretical yields shown above, do not take into account a possible precipitation of the virus or its
recovery in the interface as well as the region where the ELISA calibration curve is not linear.
Therefore, according to the ELISA results shown above, it seems that ionic strength at the highest
concentration (300 mM NaCl) has led to a loss of integrity once meanOD values had decreased if
compared with the values obtained at pH 6.0 for the bottom phase (although it is not visible
considering the theoretical yields). This could be due to the misfolding and aggregation of the
envelope protein p90 avoiding the mAb recognition and binding.
Page 97
75
These results are similar to those obtained for BTV with the exception that the best pH for the
recovery of MVV in the bottom phase was lower than the one for BTV (pH 6.0).
Concerning pH, MVV presented lower meanOD values at the most acidic (pH 4.0) and basic (pH 9.0)
pH being sensible to these pH likewise BTV.
5.6.2. Studies with PEG 3350 Da/Dextran 500 kDa
The influence of the MW of dextran (dextran 500 kDa) on the extraction parameters was investigated
in systems with different compositions. The results obtained are summarized in Table 23.
Table 23. Composition of the systems used to study MVV partition and their respective extraction parameters in
ATPS composed by PEG 3350 Da and dextran 500 kDa.
System pH [NaCl] (mM) VR Phase meanOD LogKp Y(%)
10% (w/w) PEG 6.0 0 9.0
Top 0.168 -0.75
33.7
3% (w/w) dex Bottom 0.938 66.3
4% (w/w) PEG 6.0 0 1.3
Top 0.200 -0.46
18.5
15% (w/w) dex Bottom 0.576 81.5
8% (w/w) PEG 6.0 0 4.0
Top 0.193 -0.71
24.7
5% (w/w) dex Bottom 0.989 75.3
7% (w/w) PEG 6.0 0 2.2
Top 0.190 -0.57
20.3
9% (w/w) dex Bottom 0.701 79.7
By observing the Table 23, it is possible to conclude that higher MW of dextran increased the yields in
the bottom phase similarly to BTV.
It has been shown that the partition characteristics of ATPS can be altered by the addition of NaCl. For
that reason, the effect of the ionic strength was studied for the systems composed by 10% PEG and
3% dextran in order to compare with the partition behavior obtained for BTV. The results are depicted
in Table 24. No systems were performed at pH 4.0 and pH 9.0 once these pH have led to a significant
decrease in the meanODs previously.
Table 24. Effect of pH and NaCl concentration on MVV extraction parameters in an ATPS composed by 10%
(w/w) PEG 3350 and 3% (w/w) dextran 500 kDa with a Vr of 9.
System pH [NaCl] (mM) VR Phase meanOD LogKp Y(%)
10% (w/w) PEG 6.0 150 9
Top 0.268 -0.54
61.7
3% (w/w) dex Bottom 0.939 38.3
10% (w/w) PEG 7.0 0 9
Top 0.301 -0.54
78.7
3% (w/w) dex Bottom 0.557 21.3
10% (w/w) PEG 7.0 150 9
Top 0.344 -0.23
81.2
3% (w/w) dex Bottom 0.585 18.8
Page 98
76
Comparing with the preceding results, the yields in the top phase were higher as well as the Kp. which
was not expected considering BTV results. The unexpected results further reinforce the need of more
replicates in order to study the real partitioning behavior of MVV.
5.6.3. Studies with PEG 3350 Da/phosphate
Several PEG/salt systems were performed with the selection of the composition based on BTV former
studies. In the case of BTV, the salt had a negative impact upon BHK-21 cells on TCID50 assay.
ELISA brings a solid advantage concerning this issue once no cells are needed in the assay. The
results obtained are summarized in Table 25.
Table 25. Composition of the systems used to study MVV partition and their respective extraction parameters in
an ATPS composed by PEG 3350 Da and phosphate at pH 6.0.
System pH [NaCl] (mM) VR Phase meanOD LogKp Y(%)
28% (w/w) PEG 6.0 0 5.0
Top 0.467 0.19
88.8
5% (w/w) phosp. Bottom 0.340 11.2
22% (w/w) PEG 6.0 0 4.0
Top 0.475 0.19
88.4
7% (w/w) phosp. Bottom 0.308 11.6
15% (w/w) PEG 6.0 0 1.0
Top 0.444 0.05
54.1
10% (w/w) phosp. Bottom 0.395 45.9
6% (w/w) PEG 6.0 0 0.5
Top 0.443 0.13
44.0
15% (w/w) phosp. Bottom 0.326 56.0
Unlike polymer/polymer systems and PEG/salt systems in the case of BTV, MVV was recovered
mainly in the top phase having positive LogKp contrasting to BTV. The system chosen for further ionic
strength studies was the one composed by 15% (w/w) PEG and 10% (w/w) phosphate. The results
obtained are summarized in Table 26.
Table 26. Effect of pH and NaCl concentration on MVV extraction parameters in an ATPS composed by 15%
(w/w) PEG 3350 Da and 10% (w/w) phosphate with a Vr of 1.
System pH [NaCl] (mM) VR Phase meanOD LogKp Y(%)
15% (w/w) PEG 6.0 150 1.0
Top 0.520 0.44
85.6
10% (w/w) phosp. Bottom 0.189 14.4
15% (w/w) PEG 7.0 0 1.0
Top 0.499 0.37
80.9
10% (w/w) phosp. Bottom 0.211 19.1
15% (w/w) PEG 7.0 150 1.0
Top 0.503 0.32
76.4
10% (w/w) phosp. Bottom 0.240 23.6
15% (w/w) PEG 9.0 0 1.0
Top 0.443 0.13
61.1
10% (w/w) phosp. Bottom 0.326 38.9
15% (w/w) PEG 9.0 150 1.0
Top 0.457 0.20
66.9
10% (w/w) phosp. Bottom 0.288 33.1
Page 99
77
The results above suggested that for these systems, the use of a salt phase had promoted the
partition of MVV to the more hydrophobic PEG-rich phase. The increase of the ionic strength had the
same effect and showed higher meanOD. Therefore, a strategy to promote the partitioning to the
PEG-rich phase could be an increase of the hydrophobicity driving force between the top and bottom
phases studying a wider range of salt concentration.
5.6.4. Studies with PEG 1000 Da
It was demonstrated that in the case of BTV, the PEG molecular weight had affected the partitioning.
Table 27 clearly shows that as PEG MW decreased, the partition of MVV towards the top phase was
favored. This is due to PEG 1000 Da size, which is not as large as PEG 3350 Da, thus avoiding the
steric exclusion of MVV. The results are summarized in Table 27.
Table 27. Effect of PEG MW on MVV extraction parameters in the best performing systems previously obtained.
System pH [NaCl] (mM) VR Phase meanOD LogKp Y(%)
10% (w/w) PEG 1000 Da 6.0 0 9.0
Top 0.316 -0.12
85.8
3% (w/w) dextran 60-90 kDa Bottom 0.412 14.2
10% (w/w) PEG 1000 Da 6.0 150 9.0
Top 0.299 -0.22
80.8
3% (w/w) dextran 500 Da Bottom 0.501 19.2
13% (w/w) PEG 1000 Da 6.0 150 0.7
Top 0.564 0.39
73.4
15% (w/w) phosp. Bottom 0.229 26.6
It was observed a higher partitioning to the PEG-rich phase which was expected due to its low MW.
Nonetheless, a small amount of MVV was still present in the bottom phase. BTV exhibited a
preferential partitioning towards the less hydrophobic phase either in PEG/dextran or PEG/salt.
However, MVV was recovered mainly in the top phase in the PEG/salt systems. MVV presented
higher recoveries in the presence of 150 mM NaCl. Regarding the purification, MVV was more purified
due to previous PEG precipitation.
The emphasis in this MVV study is given to PEG/salt systems because of their low costs. For MVV,
the partitioning in this type of systems was better defined and understood than in the case of BTV.
Page 101
79
6. Conclusions and future perspectives
The production of viral vaccines or gene therapy vectors requires viruses to be grown in living cells,
harvested and then purified. These biopharmaceuticals typically require high concentrations and
purities, making downstream processing a critical component of the overall process. In recent years,
upstream production has been considerable enhanced whereas the downstream processing did not
follow this increase in terms of throughput and scalability. Therefore, in order to manufacture an
economically acceptable vaccine or gene therapy vectors, the development of a straightforward and
efficient method for concentration and purification of viruses is required.
The use of anion exchange chromatography as an alternative to the conventional methods for BTV
concentration and purification presented encouraging results. Besides developing a rapid and
straightforward procedure, the key goal was to preserve virus infectivity during the purification process
and to obtain pure viruses at high concentration without any additional concentration steps. The
studies using anion exchange CIM® monoliths revealed that the best condition for BTV concentration
was with an adsorption buffer composed by 20 mM NaH2PO4 and elution buffer 20 mM NaH2PO4 with
1.5 M NaCl and 1 mM MgCl2 both at pH 7.2 with a recovery yield of 80%. The TCID50 assay, besides
the determination of the BTV titer, served as a direct proof of the biological activity of the eluted virus
and indicated that BTV was not being inactivated by the chromatographic process itself. However, the
results showed no significant improvements concerning BTV purity when compared to density gradient
centrifugation.
At the most acidic pH, the column backpressure built up to unbearable pressure values. An
explanation which has been hypothesized was the case of an isoelectric precipitation phenomenon
where the BTV had precipitated in the monolith, blocking it completely at pH 5.0, due to its size. The
results suggest that BTV has a narrow working pH range considering its infectivity.
The chromatographic virus purification procedure showed several advantages over the conventional
techniques based on centrifugation methods. With the use of the monolithic columns, the
ultracentrifugation steps could be omitted and the virus concentration procedure became significantly
shorter. In addition, CIM® monolithic supports are easy to handle and the chromatographic technique
is easily scalable due to the different size of monolithic columns available (up to 8000 mL)
circumventing the limitations of the ultracentrifugation scale-up.
Regarding ATPS, the partitioning of BTV in PEG/dextran and PEG/salt has been found to be
influenced by several phenomena. The systems studied were composed by two-polymer phases or
polymer-salt phases, a more hydrophilic dextran-rich (or salt-rich) phase and a more hydrophobic
PEG-rich phase. Considering the results obtained with PEG/dextran systems, a number of factors,
such as concentration, pH, ionic strength and MW were studied. It is possible to state that the best
performed system to achieve high BTV partition in the dextran-rich phase was composed by 10%
(w/w) PEG 3350 Da, 3% (w/w) dextran 500 kDa, 0 mM NaCl at pH 7.0 with a recovery yield of 89%.
Higher MW of dextran showed to be more appropriate than low MW for BTV concentration and
Page 102
80
purification. Once dextran is not economically viable for industrial purposes, PEG/salt ATPS were also
tested. In these systems, BTV was not recovered in a specific phase. Therefore the partitioning was
not well defined. The best performed system, considering a desirable partitioning to the PEG-rich
phase, was composed by 22% (w/w) PEG, 7% (w/w) phosphate, 0 mM NaCl at pH 6 with a recovery
yield of 54.7 % . An important fact was that the conditions which favor the partitioning of BTV also
favored the partitioning of the contaminant proteins and thus the purification achieved was lower with
this method in both types of systems, than in the chromatographic assay.
ATPS offers advantages over density gradient centrifugation once is a scalable method, the chemicals
have a low cost in the case of PEG/salt systems and has a shorter processing time. A disadvantage
inherent is the contamination of BTV by polymers/salts. Special procedures must therefore be
employed for their removal. There is still a reduced commercial application of ATPS caused by the
complexity of the definition of forming phase compositions and the low process recovery reported as
verified in this work. Despite the fact that the PEG/salt systems are inexpensive, their application is
limited due to presence of salt concentrations which may denature the BTV. Therefore, this leads, as
future work, to study inexpensive substitutes of dextran, like derivatives of starch, cellulose, polyvinyl
alcohol and hydroxypropyl starch.
In the case of MVV, monolithic chromatography seemed to be not suitable for MVV processing due to
the need of a preconditioning using diafiltration process which was not possible due to the virus lability
and weakness. The benefit of doing a pre-PEG precipitation is that it may decrease, if desired, the
volume of the sample to be loaded in the following steps and presents high purities. Regarding ATPS,
MVV exhibited a top phase preference with the highest recoveries obtained with 15% PEG 3350 Da,
10% phosphate at pH 6.0. MVV also presented a narrow working pH range.
Considering the results for the different viruses, it is clear that the protocol needs to be optimized for
each virus individually. Like usually in purification of biological macromolecules and their complexes -
not only macromolecular complexes like viruses but also proteins - it is improbable that the same
purification method could be applied to many specimens. Therefore, every downstream schemes need
to be optimized. Furthermore, the techniques presented in this work are limited practically because
they commonly fail to discriminate between infective particles and contaminants stemmed from the
virus itself such as non-infective particles and particle components. Nevertheless, the conditions
determined in this work from chromatography experiments and ATPS are good starting points for
additional viruses studies.
Both techniques, but mostly monolithic chromatography, are relatively novel approaches considering
virus concentration and purification, meaning that more research is required, especially in this case
where the centrifugation process is well implemented in the laboratories and porous particle columns
in the industry.
In quality control of live viral vaccines, FDA requires a genomic DNA quantification in vaccines
produced in immortalized cells, such as the ones used in this work - BHK-21 - and administered
parenterally. In these vaccines the quantity of residual genomic DNA must be below 10 ng/dose. In the
Page 103
81
case of MVV, SCP cells are not immortalized, but bearing in mind that the methods described in this
work might be transferred to vaccines prepared in other cell lines, further work at the level of genomic
DNA quantification must be performed to acknowledge if it was removed after virus concentration and
purification.
As viruses are large macromolecular assemblies, the surface charge distribution is not necessarily
uniform. Therefore it is possible that at some regions of the surface (e.g. at certain protein domains)
there will be clusters of positively charged moieties, while at the other regions negatively charged
moieties will prevail. For this reason, a weak or strong cation exchanger must be tested in the future
as well. Moreover, the use of other alternative buffers might lead to differences regarding virus stability
and a decrease in the costs. In this way, alternatives to phosphate and acetate buffers such as Tris,
MES buffer, could be tested. Another type of chromatography, namely hydrophobic interaction
chromatography, could also be studied since it is an alternative separation technique based on ionic
interactions.
To overcome the lengthy infection times inherent in TCID50 assays as well as its high variability, an
ultra-sensitive fluorescence stain could be developed as a faster and more reliable method for virus
quantification in each phase or fraction.
Lastly, for a better comparison between all the methods, an economic evaluation must be performed.
Page 105
83
7. References
A.S. Schmidt, A. V. J. A., 1994. Partitioning and purification of α-amylase in aqueous two-phase
systems. Enzyme and Microbial Technology, 16 pp. 131–142.
Albertson, P., 1986. Partition of cell particles and macromolecules: separation and purification of
biomolecules, cell organelles, membranes, and cells in aqueous polymer two-phase systems and their
use in biochemical analysis and biotechnology. New York Wiley
Albertsson, P.-A., Philipson, L. & Wesslén, T., 1959. Concentration of Animal Viruses Using Two-
Phase Systems of Aqueous Polymer Solutions. 510-520.
Alexander, D. J., 2001. Newcastle Disease. British Poultry Science 42, pp. 5-22.
Alfa Laval, 2014. Disc stack separator technology. Available at:
www.alfalaval.com/_layouts/.../Document.aspx? [Accessed 1st February 2014]
Amersham Biosciences, 1998. Sensitive silver staining. Available at:
https://www.gelifesciences.com/gehcls_images/GELS/Related%20Content/Files/1314716762536/litdo
c80131198_20110830174600.pdf [Accessed 2nd April 2014].
Anderson, L., Shimada, T. & Young, N., 1991. Self-assembled B19 parvovirus capsids, produced in
a baculovirus system, are antigenically and immunogenically similar to native virions. Proc. Natl. Acad.
Sci. U.S.A. 88, p. 4646–4650.
Anon., 2012. Upstream Processing. In: Biopharmaceutical Production Technology. Wiley-VCH, pp.
143-145.
Arvina, A. M. & Greenberg, H. B., 2006. New viral vaccines. Virology, pp. 240–249.
Asenjo, J. A. & Andrews, B. A., 2012. Aqueous two-phase systems for protein separation: Phase
separation and applications. Journal of Chromatography A.
Atha, D. H. & Ingham, K. C., 1981. Mechanism of Precipitation of Proteins by Polyethylene Glycols.
The journal of biological chemistry, pp. 12108-12117.
Azevedo, A., Rosa, P., Ferreira, I. & Aires‐Barros, M., 2007. Optimisation of aqueous two‐phase
extraction of human antibodies. Journal of Biotechnology 132, pp. 209–217.
Barros, S., Ramos, F., Duarte, M., Fagulha, T., Cruz, B. & Fevereiro, M., 2004. Genomic
Characterization of a Slow/Low Maedi Visna Virus. Virus Genes 29, pp. 199-210.
Barros, S., Cruz, B., Luís, T., Ramos, F., Fagulha, T., Duarte, M., Henriques, M. & Fevereiro, M.,
2009. A DIVA system based on the detection of antibodies to non-structural protein 3 (NS3) of
Bluetongue virus. Veterinary Microbiology 137, pp. 199-210.
Baynard, A., 2010. Institute for Animal Health: Development of multivalent vaccines. Institue for
Animal Health.
Belknap, E., 2002. Diseases of the respiratory system. Sheep and Goat Medicine, pp. 107–128.
Bellara, S. R., Cui, Z., MacDonald, S. L. & Pepper, D. S., 1998. Virus removal from bioproducts
using ultrafiltration membranes modified with latex particle pretreatment. Bioseparation, pp. 79-88.
Benavides, J. et al., 2013. Impact of maedi-visna in intensively managed dairy sheep. The Veterinary
Journal, pp. 607–612.
Page 106
84
Benavides, J. & Rito-Palomares, M., 2008. Journal of Chemical Technology and Biotechnology 83,
pp. 133.
BIO RAD, 2008. Protein Blotting Guide. Available at: http://www.bio-
rad.com/webroot/web/pdf/lsr/literature/Bulletin_2895.pdf [Accessed 21st January 2014].
BloombergBusinessweek, 2010. Gene Therapy Takes a Turn for the Better.
Available at: http://www.businessweek.com/magazine/content/10_18/b4176027902498.htm
[Accessed 3rd Jun 2014].
Cabezas, H. J., 1996. Journal of Chromatography B 680.
Caporale, V., 2008. Bluetongue control strategy, including recourse to vaccine. OIE - World
Organisation for Animal Health, pp. 189-207 .
Chiang, E. et al., 2006. Bluetongue virus and double-stranded RNA increase human vascular
permeability: role of p38 MAPK.. Journal of Clinical Immunology 26, pp. 406–416.
Christodoulopoulos, G., 2005. Maedi–Visna: Clinical review and short reference on the disease
status in Mediterranean countries. Small Ruminant Research, pp. 47–53.
Clark, D. P. & Pazdernik, N. J., 2012. Biotechnology: Academic Cell Update Edition. s.l.:Academic
Press.
Clavijo, A., Heckert, R. A., Dulac, G. C. & Afshar, A., 2000. Isolation and identification of bluetongue
virus. Journal of Virological Methods, pp. 13–23.
Coetzee, P. et al., 2012. Bluetongue: a historical and epidemiological perspective with the emphasis
on South Africa. Virology Journal.
Costa, M. J. L., Cunha, M. T., Cabral, J. M. S. & Aires-Barros, M. R., 2000. Bioseparation 9, p. 231.
Cruz, P.E., Peixoto, C.C., Devos, K., Moreira, J.L., Saman, E., 2000. Characterization and
downstream processing of HIV-1 core and virus-like- particles produced in serum free medium.
Enzyme Microb. Technol. 26, pp. 61-70.
Cummins, P. M. & O'Connor, B., 1996. Bovine brain pyroglutamyl aminopeptidase (type-1):
Purification and characterisation of a neuropeptide-inactivating peptidase. The International Journal of
Biochemistry & Cell Biology, pp. 883–893.
Dawson, M., 1980. Maedi/visna: a review. Veterinary Record, pp. 212-216.
Donald, A. & Kenneth, I., 1981. Mechanism of Precipitation of Proteins by Polyethylene Glycol. The
journal of biological chemistry, pp. 12108-12117.
Enders, M., Helbig, S., Hunjet, A. & Pfister, H., 2007. Comparative evaluation of two commercial
enzyme immunoassays for serodiagnosis of human parvovirus B19 infection. J. Virol. Methods 146,
pp. 409–413.
Evermann, J., 2008. Accidental introduction of viruses into companion animals by commercial
vaccines.. Veterinary Clinics of North America-Small Animal Practise, 38, pp. 919–929.
Fevereiro, M., Barros, S. & Fagulha, T., 1999. Development of a monoclonal antibody blocking-
ELISA for detection of antibodies against Maedi-Visna virus. Journal of Virological Methods, 81(1-2),
pp. 101-108.
Flynn, C. E., Lee, S. W., Peelle, B. R. & Belcher, A. M., 2003. Viruses as vehicles for growth,
organization and assembly of Materials. Acta Materialia 51, p. 5867–5880.
Page 107
85
Fritsch, A., 2009. Preparative density gradient centrifugations. Paris: Institut Pasteur.
Gagnon, P., 2008. The Emerging Generation of Chromatography Tools for Virus Purification.
BioProcess International, pp. 24-30.
Gale, P. et al., 2009. Gale P, Drew T, Phipps LP, David G, Wooldridge M (2009): The effect of climate
change on occurrence and prevalence of livestock diseases in Great Britain: a review. Journal of
Applied Microbiology 106, p. 1409–1423.
García-Pérez, A., Sancho, P. & Pinilla, M., 1998. Journal of Chromatography B, p. 301.
GE Healthcare Life Sciences, 2014. Ion Exchange Chromatography (IEX).
Available at: http://www.gelifesciences.com/webapp/wcs/stores/servlet/catalog/pt/GELifeSciences-
US/products/ion-exchange-chromatography-iex/ [Accessed 14th March 2014].
Greve, A. & Kula, M. R., 1991. J. Chem. Technol. Biotechnol. 50, pp. 27.
Guiochon, G., 2007. Monolithic columns in high-performance liquid chromatography. Journal of
Chromatography A, 1168, pp. 101.
Haase, A. & Baringer, J., 1974. The structural polypeptides of RNA slow viruses. Virology, 57(1), pp.
238-250.
Hensgen, M. I., Czermak, P., Carlson, J. O. & Wickramasinghe, R. S., 2010. Purification of Minute
Virus of Mice using high performance tangential flow filtration. Desalination 250, pp. 1121–1124.
Hickling, J. & D'Hondt, E., 2006. Review of production technologies for influenza virus vaccines, and
their suitability for deployment in developing countries for influenza pandemic preparedness. Geneva,
s.n., pp. 1-34.
Horvath, G. & Lipsky, S., 1966. Use of liquid ion exchange chromatography for the separation of
organic compounds. Nature, 211, pp. 748-749.
Hyeok, C. et al., 2005. Effect of permeate flux and tangential flow on membrane fouling for
wastewater treatment. Separation and Purification Technology, pp. 68-78.
IFPMA, 2012. ifpma.org. Available at: http://www.ifpma.org/resources/influenza-vaccines/influenza-
vaccines/vaccine-manufacture-egg-based-vaccine-production.html
Jain PharmaBiotech, 2014. Gene Therapy - Technologies, Markets and Companies. Available at:
http://www.researchandmarkets.com/reports/70434/gene_therapy_technologies_markets_and_compa
nies [Accessed 3rd
Jun 2014].
Juckes, I. R. M., 1971. Fractionation of proteins and viruses with polyethylene glycol. Biochimica et
Biophysica Acta, pp. 535-546.
Jungbauer, A. & Hahn, R., 2004. Monoliths for fast bioseparation and bioconversion and their
applications in biotechnology. Journal of Separation Science, July.pp. 767-778.
Kent, U. M., 1999. Purification of Antibodies Using Ion-Exchange Chromatography. Methods in
Molecular Biology, pp. 19-22.
Knudsen, H. L. et al., 2001. Membrane ion-exchange chromatography for process-scale antibody
purification. Journal of Chromatography A, 907 (Issues 1-2), pp. 145-154.
Kristopher, K. J. & Manchester, M., 2010. Chemically modified viruses: principles and applications.
Current Opinion in Chemical Biology, pp. 810–817.
Page 108
86
Lain, B., Cacciuttolo, M. & Zarbis-Papastoitsis, G., 2009. Development of a high-capacity mab
capture step based on cation-exchange chromatography. BioProcess Technical.
Lodish, H., Berk, A. & Zipursky, S., 2000. Viruses: Structure, Function, and Uses. New York: W. H.
Freeman.
Luechau, F., Ling, T. C. & Lyddiatt, A., 2011. Recovery of B19 virus-like particles by aqueous two-
phase systems. Food and Bioproducts Processing 89, pp. 322-327.
Lyddiatt, A. & O'Sullivan, D. A., 1998. Biochemical recovery and purification of gene therapy vectors.
Current Opinion in Biotechnology, 9, pp. 177-185.
MacLachlan, N., 2004. Bluetongue: pathogenesis and duration of viraemia. Veterinaria Italiana 40, p.
462–467.
MacLachlan, N., Drew, C., Darpel, K. & Worwa, G., 2009. The Pathology and Pathogenesis of
Bluetongue.. Journal of Comparative Pathology 141, p. 1–16.
Meiswinkel, R. et al., 2004. The taxonomy of Culicoides vector complexes – unfinished business.
Vet. Ital. 40, pp. 151-159.
Merck, 2013. Merck Announces Third-Quarter 2013 Financial Results. Available at:
http://www.mercknewsroom.com/news-release/corporate-news/merck-announces-third-quarter-2013-
financial-results [Accessed 14th March 2014].
Ministério da Agricultura, Mar, Ambiente e Ordenamento do Território, 2013. Febre catarral ovina
Língua Azul. EDITAL nº31, 18th January, pp. 1-4.
Mortola, E., Noad, R. & Roy, P., 2004. Bluetongue virus outer capsid proteins are sufficient to trigger
apoptosis in mammalian cells.. Journal of Virology 78, p. 2875–2883.
Mullens, B. A., Gerry, A. C., Lysyk, T. J. & Schmidmann, E. T., 2004. Environmental effects on
vector competence and verogenesis of bluetongue virus in Culicoides: interpreting laboratory data in a
field context. Vet. Ital., 40, pp. 160-166.
Negrete, A., Ling, T. C. & Lyddiatt, A., 2007. Aqueous two-phase recovery of bio-nanoparticles: A
miniaturization study for recovery of bacteriophage T4. Journal of Chromatography B, pp. 13-19.
Njayou, M. & Quash, G., 1991. Purification of measles virus by affinity chromatography and by
ultracentrifugation: a comparative study.. Journal of Virological Methods 32, pp. 67–77.
Oliveira, A. C. et al., 1999. Low Temperature and Pressure Stability of Picornaviruses: Implications
for Virus Uncoating. Biophysical Journal, pp. 1270 –1279.
Peixoto, C. et al., 2007. Downstream processing of triple layered rotavirus like particles. Journal of
Biotechnology.
Pépin, M. et al., 1998. Maedi-visna virus infection in sheep: a review. Research in Veterinary Science,
pp. 341-367.
Persson, J., Johansson, H. O. & Tjerneld, L., 1999. Purification of protein and recycling of polymers
in a new aqueous two-phase system using two thermoseparating polymers. Journal of
Chromatography A 864, p. 31–48.
Peterhans, E. et al., 2004. Routes of transmission and consequences of small ruminant lentiviruses
(SRLVs) infection and eradication schemes. Veterinary Research, pp. 257-274.
Page 109
87
Peter, M. P. & Diprose, J., 2004. The bluetongue virus core: a nano-scale transcription machine.
Virus Research 101, p. 29–43.
Pfizer, 2012. Fierce Vaccines Pfizer Vaccine revenue. Available at:
http://www.fiercevaccines.com/special-reports/pfizer [Accessed 14th March 2014].
Pico, G., Bassani, G., Farruggia, B. & Nerli, B., 2007. Calorimetric investigation of the protein –
flexible chain polymer interactions and its relationship with protein partition in aqueous two phase
systems. International journal of biological macromolecules, 40, pp. 268-275.
Polson, A. et al., 1964. The fractionation of protein mixtures by linear polymers of high molecular
weight. Biochimica et Biophysica Acta, p. 463–475.
Porter, M. C., 1972. Concentration Polarization with Membrane Ultrafiltration. Industrial & Engineering
Chemistry Research, 11, pp. 234-248.
Przybycien, T., Pujar, N. & Steele, 2004. Alternative bioseparation operations: life beyond packed-
bed chromatography. Current Opinion in Biotechnology, 15, pp. 469-478.
Purse, B. V. et al., 2005. Climate change and the recent emergence of bluetongue in Europe. Nature
Reviews Microbiology, pp. 171-181.
Rios, M., 2012. A Decade of Harvesting Methods. BioProcess International, pp. 28-31.
Rito-Palomares, M. & Lyddiatt, A., 2002. Process integration using aqueous two-phase partition for
the recovery of intracellular proteins. Chemical Engineering Journal 87, p. 313–319.
Rosa, P. A. J., Azevedo, A. M. & Aires-Barros, M. R., 2010. Aqueous two-phase systems: a viable
platform in the manufacturing of biopharmaceuticals. Journal of Chromatography A 1217, pp. 2296-
2305.
Rosa, P. A. J. et al., 2013. Continuous purification of antibodies from cell culture supernatant with
aqueous two-phase systems: From concept to process. Biotechnology Journal, 8, pp. 352-362.
Roy, P., 2008. Functional mapping of Bluetongue Virus Proteins and their interactions with host
proteins during virus replication. Cell Biochem Biophys, pp. 143–157.
Roy, P. & Noad, R., 2006. Bluetongue virus assembly and morphogenesis. Current Topics in
Microbiology and Immunology. Springer, pp. 87–116.
Schillberg, S., Fischer, R. & Emans, N., 2003. "Molecular farming" of antibodies in plants.
Naturwissenschaften 90, pp. 145–155.
Schwartz-Corni, I. et al., 2008. Bluetongue virus: virology, pathogenesis and immunity. Vet. Res., pp.
39-46.
Schwartz, L., 2003. Diafiltration for Desalting or Buffer Exchange. BioProcess International, pp. 43-
49.
Sekar, P., Ponmurugan, K. & Gurusubramanian, G., 2008. Comparative Susceptibility of BHK 21
and Vero Cell Lines to Bluetongue Virus (BTV) Isolate Pathogenic for Sheep. The Internet Journal of
Microbiology, 7.
Sheeler, P., 1981. Centrifugation in Biology and Medical Science. s.l.:Wiley.
SIB Swiss Institute of Bioinformatics, 2014. http://viralzone.org. Available at:
http://viralzone.expasy.org/ [Accessed 24th January 2014].
Page 110
88
Sigma-Aldrich, 2014. Biofiles. Available at: http://www.sigmaaldrich.com/content/dam/sigma-
aldrich/articles/biofiles/biofiles-pdf/biofiles_v6_n5.pdf
Sigurdsson, B., H., T. & Pálss, 1960. Cultivation of visna virus in tissue culture. Arch. Ges.
Virusforsch., pp. 368-381.
Spatz, D. D. & Friedlander, R., 1980. Ultrafiltration — The Membranes, the Process and Its
Application to Organic Molecule Fractionation. Ultrafiltration Membranes and Applications, pp. 603.
Sperlova, A. & Zendulkova, D., 2011. Bluetongue: a review. Veterinarni Medicina, 56, pp. 430–452.
Su, Z. & Feng, X. L., 1999. Process Integration of cell disruption and aqueous two-phase extraction.
J. Chem. Technol. Biotechnol. 74, pp. 284–288.
Svehag, S. E., Leendertsen, L. & Gorham, J. R., 1966. Sensitivity of bluetongue virus to lipid
solvents, trypsin and pH changes and its serological relationship to arboviruses. The Journal of
Hygiene, pp. 339-346.
Tabachnick, W., 1996. The genetics of Culicoides variipennis and the epidemiology of bluetongue
disease in North America. Annual Review of Entomology 45, pp. 20-40.
Thormar, H., 2005. Maedi-visna virus and its relationship to human immunodeficiency virus. HIV &
AIDS Review, pp. 233-245.
Venâncio, A., Almeida, C. & Teixeira, J. A., 1996. Enzyme purification with aqueous two-phase
systems: comparison between systems composed of pure polymers and systems composed of crude
polymers. Journal of Chromatography B, pp. 131-136 .
Venkataram, P. B. V., Yamaguchi, S. & Roy, P., 1992. Three-Dimensional Structure of Single-
Shelled Bluetongue Virus. Journal of Virology, pp. 2135-2142.
Veterinary Faculty of Zaragoza, Spain, 2013. Flock and herd - Case notes. Available at:
http://www.flockandherd.net.au/sheep/reader/respiratory%20tract%20diseases%20of%20sheep%20in
%20Spain.html [Accessed 21st January 2014].
Vicente, T. et al., 2011. Large-scale production and purification of VLP-based vaccines. Journal of
Invertebrate Pathology 107, p. 42–48.
Vicente, T., Sousa, M.F.Q., Peixoto, C., Mota, 2008. Anion-exchange membrane chromatography
for purification of rotavirus-like particles. J. Membr. Sci. 311, p. 270–283.
Walker, J. & Wilson, K., 2010. Principles and Techniques of Biochemistry and Molecular Biology.
New York: Cambridge University Press.
Walke, S. & Lyddiatt, A., 1999. J. Chem. Technol. Biotechnol. 74, p. 250.
WHO, 2013. Global Vaccine Market Features and Trends. Available at:
http://who.int/influenza_vaccines_plan/resources/session_10_kaddar.pdf [Accessed 14th March 2014].
Wilson, A. J. & Mellor, P. S., 2009. Bluetongue in Europe: past, present and future.. Phil. Trans. R.
Soc. B. 364, p. 2669–2681.
Xu, Y., Souza, M., Ribeiro-Pontes, M. & Vitolo, M., 2001. Liquid-liquid Extraction of Pharmaceuticals
by Aqueous Two-phase systems. Brazilian Journal of Pharmaceutical Sciences 37.
Zaslavsky, B. Y., 1995. Aqueous Two-Phase Partitioning: Physical Chemistry and Bioanalytical
Applications. New York: Marcel Dekker Inc.
Page 111
89
Zhen, S. et al., 2010. A novel method for purifying bluetongue virus with high purity by co-
immunoprecipitation with agarose protein A. Virology Journal.
Zolotukhin, S. et al., 1999. Recombinant adeno-associated virus purification using novel methods
improves infectious titer and yield. Gene Therapy 6, p. 973–985.
Page 113
91
8. Annexes
The total protein quantification by the Bradford method required the use of a calibration curve for each
assay performed, prepared with bovine serum albumin (BSA) as protein standard, with concentrations
ranging from 5 mg/L to 400 mg/L. In Figure A1 is depicted a typically obtained calibration curve for the
total protein quantification and consequently, the PF of this work.
Figure A1. Typical calibration curve used for total protein quantification, obtained from BSA standards with
concentrations ranging from 5 mg/L to 400 mg/L.
y = 1669.5x2 - 2133.9x + 783.18 R² = 0.999
0
100
200
300
400
500
0.6 0.7 0.8 0.9 1 1.1
[To
tal p
rote
in]
(mg
/L)
Absorbance(595nm)