80
Downtown Kalamazoo Retail Market Analysis Kalamazoo, Michigan Prepared for: City of Kalamazoo Prepared by: Gibbs Planning Group 25 May 2017 Draft

Downtown Kalamazoo
Retail Market Analysis Kalamazoo, Michigan
Prepared for:
City of Kalamazoo
Prepared by:
Gibbs Planning Group
25 May 2017 Draft


TABLE OF CONTENTS
INTRODUCTION .................................................................................................................. 1
Executive Summary ............................................................................................................. 1
Background .......................................................................................................................... 3
Methodology ......................................................................................................................... 5
Trade Area ........................................................................................................................... 7
Demographic Characteristics ............................................................................................... 8
Tapestry Lifestyles ............................................................................................................... 11
Employment Base ................................................................................................................ 15
TRADE AREA CHARACTERISTICS ................................................................................... 17
Location ................................................................................................................................ 18
Access .................................................................................................................................. 18
Traffic ................................................................................................................................... 19
Student Population ................................................................................................................ 21
Other Shopping Areas .......................................................................................................... 20
Special Events ..................................................................................................................... 21
Regional Centers ................................................................................................................. 22
Community Centers .............................................................................................................. 22
Neighborhood Centers ......................................................................................................... 24
SUMMARY OF FINDINGS .................................................................................................... 28
Supportable 2017 Retailers & Potential Tenants .................................................................. 30
2017-2022 Supportable Retail Table .................................................................................... 31
Recommended Retailers....................................................................................................... 32
Retail Category Definitions ................................................................................................... 37
Shopping Center Definitions ................................................................................................. 37
Rationale ............................................................................................................................... 40
Limits of Study ....................................................................................................................... 41
APPENDIX ............................................................................................................................ 43


Downtown Kalamazoo, Michigan Retail Market Study 1. Gibbs Planning Group, Inc. 25 May 2017
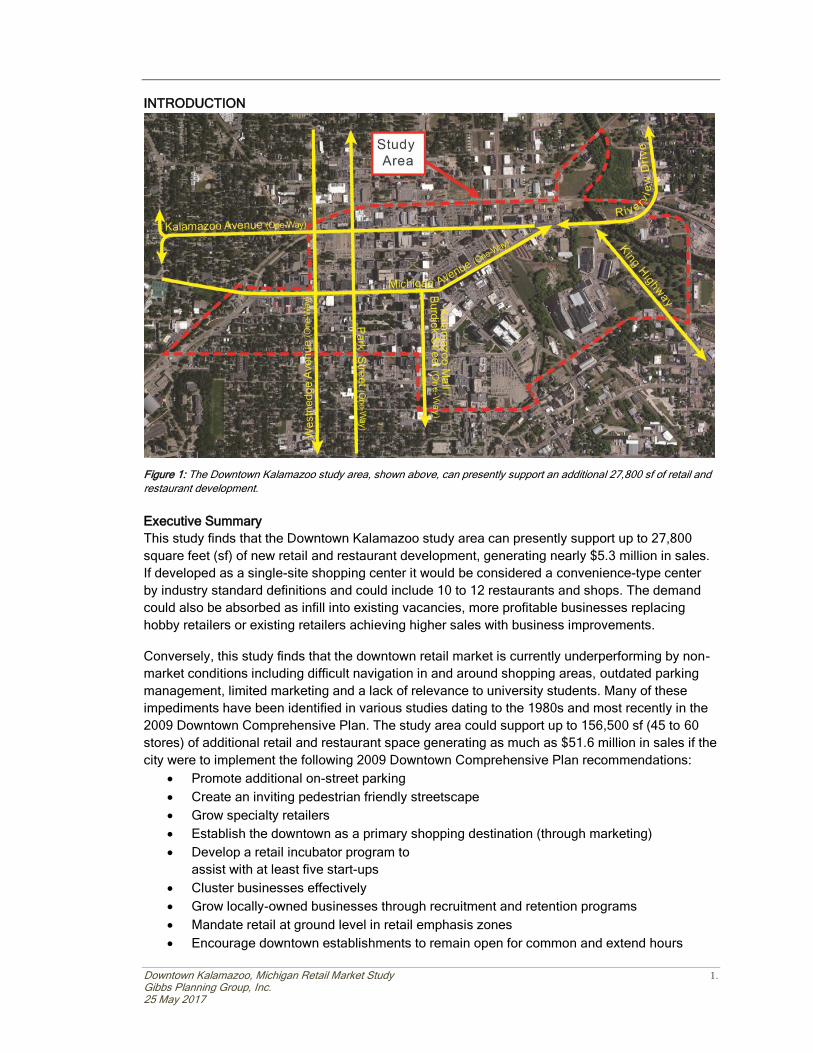
INTRODUCTION
Figure 1: The Downtown Kalamazoo study area, shown above, can presently support an additional 27,800 sf of retail and
restaurant development.
Executive Summary
This study finds that the Downtown Kalamazoo study area can presently support up to 27,800
square feet (sf) of new retail and restaurant development, generating nearly $5.3 million in sales.
If developed as a single-site shopping center it would be considered a convenience-type center
by industry standard definitions and could include 10 to 12 restaurants and shops. The demand
could also be absorbed as infill into existing vacancies, more profitable businesses replacing
hobby retailers or existing retailers achieving higher sales with business improvements.
Conversely, this study finds that the downtown retail market is currently underperforming by non-
market conditions including difficult navigation in and around shopping areas, outdated parking
management, limited marketing and a lack of relevance to university students. Many of these
impediments have been identified in various studies dating to the 1980s and most recently in the
2009 Downtown Comprehensive Plan. The study area could support up to 156,500 sf (45 to 60
stores) of additional retail and restaurant space generating as much as $51.6 million in sales if the
city were to implement the following 2009 Downtown Comprehensive Plan recommendations:
• Promote additional on-street parking
• Create an inviting pedestrian friendly streetscape
• Grow specialty retailers
• Establish the downtown as a primary shopping destination (through marketing)
• Develop a retail incubator program to
assist with at least five start-ups
• Cluster businesses effectively
• Grow locally-owned businesses through recruitment and retention programs
• Mandate retail at ground level in retail emphasis zones
• Encourage downtown establishments to remain open for common and extend hours

2. Downtown Kalamazoo, Michigan Retail Market Study Gibbs Planning Group, Inc. 25 May 2017
• Assist in the development of three new student-oriented businesses
• Continue to support retail focused events.
In addition, GPG recommends the city implement the following physical and policy improvements
to meet or exceed industry standards for downtown shopping districts:
• Return all streets to two-way traffic and implement traffic calming techniques
• Expand on-street parking in the downtown, especially in or near the mall
• Install parking meters along all commercial streets and offer two-hours of free parking in
public parking garages
• Develop a business recruitment plan
• Develop a market-based merchandising plan for the study area
• Implement a comprehensive marketing plan for the downtown
Table 1: 2017 Supportable Retail
Retail Category 2017 Status Quo Estimated
Supportable SF
Estimated Supportable SF with
Improvements
No. of Stores
Retailers
Apparel Stores 1,800 sf 26,500 sf 8 - 10
Miscellaneous Store Retailers 4,000 sf 17,900 sf 6 - 8
Department Store Merchandise 2,400 sf 14,400 sf 3 - 4
Specialty Food Stores 4,100 sf 12,300 sf 1 - 3
Electronics and Appliance Stores - sf 10,400 sf 3 - 4
Pharmacy and Personal Care Stores - sf 9,900 sf 1 - 2
Gift Stores 2,100 sf 9,400 sf 5 - 6
Book and Music Stores 1,100 sf 4,300 sf 1
Home Furnishings Stores 1,800 sf 3,300 sf 1 - 2
Beer, Wine and Liquor Stores - sf 2,600 sf 1
Jewelry Stores 1,700 sf 2,300 sf 1
Shoe Stores - sf 1,400 sf 1
Florists - sf 1,100 sf 1
Total New Supportable Retail 19,000 sf 115,800 sf 33 - 44
Restaurants
Full-Service Restaurants 3,800 sf 13,400 sf 3 - 4
Limited-Service Eating Places - sf 11,600 sf 4 - 5
Bars, Breweries and Pubs 2,500 sf 9,100 sf 2 - 3
Special Food Services 2,500 sf 6,700 sf 3 - 4
Total New Supportable Restaurant 8,800 sf 40,700 sf 12 - 16
Retailer & Restaurant Totals 27,800 sf 156,500 sf 45 - 60
Table 1: With improvements, the study area could support up to 156,500 sf of new retail and restaurant development.
The supportable retail with improvements includes 8-10 apparel stores, 5-6 gift stores, 4-5 limited-
service eating places, 3-4 full-service restaurants, 3-4 stores selling department store
merchandise, 3-4 electronics and appliance stores, 3-4 special food services stores, 2-3 drinking
establishments, 1-3 specialty food stores, 1-2 pharmacy and personal care stores, 1-2 home
furnishings stores and a variety of other retail. Although the trade area will not support a grocery
store downtown, GPG recommends that the city consider a small to medium-size, year-round

Downtown Kalamazoo, Michigan Retail Market Study 3. Gibbs Planning Group, Inc. 25 May 2017
public market, such as those in Bay City, Flint, Grand Rapids and the Oxbow Market in Napa. A
summary of the 2017 total new supportable retail can be found in Table 1.
The study area is Kalamazoo’s Central Business District, southwest Michigan’s retail, employment, entertainment, civic and residential hub for the surrounding region. It is centered on
Michigan Avenue and bound by Willard Street, Mills Street, Walnut Street and I-94/US-131.
Regionally, it is located in the southwest corner of the state of Michigan approximately 40 miles
from both the state’s southern border and its eastern border on Lake Michigan. It is 45 miles south
of Grand Rapids, 60 miles southwest of Lansing and 20 miles west of Battle Creek. Access to the
study area is excellent, via Interstate 94 for east-west visitors, and north-south via US-131.
This study further finds that the study area has a primary trade area population of 237,300
persons, increasing to 244,900 persons by 2022 with a projected annual growth rate of 0.63
percent. Average and median household income in the primary trade area ($64,400 and $45,500,
respectively) is slightly more than the total trade area, while the percentage of those holding a
bachelor’s or graduate degree (22.0 percent and 14.6 percent, respectively) is higher than the
total trade area and the state. The primary trade area has a labor base of 158,600 employees.
Background
Gibbs Planning Group Inc. (GPG) has been retained by the City of Kalamazoo to conduct an
independent retail market analysis for its downtown Central Business District. Kalamazoo is
located in western Michigan, approximately 45 miles south of Grand Rapids.
Figure 2: The city’s predominance of one-way streets in the downtown is detrimental to robust commerce and would be
better served with implementation of the 2009 Kalamazoo Comprehensive Plan’s proposed two-way conversion plan.
The study area encompasses Kalamazoo Mall, which was the first pedestrian shopping mall in
the United States when it opened in 1959. Designed by legendary mall architect Victor Gruen, it is
located in the heart of downtown. The two blocks of Burdick from Eleanor Street to W. Michigan
Avenue are designated North Kalamazoo Mall; the two blocks south of W. Michigan to W. Lovell
Street, South Kalamazoo Mall. As proposed by Victor Gruen, the city also incorporated a north-
south one-way couplet (Westnedge Avenue and Park Street) and an east-west one-way couplet
(Michigan Avenue and Kalamazoo Avenue). The one-way couplets facilitated expedient
movement through the downtown, often at the expense of retailers and pedestrian comfort.
The mall underwent renovations in the 70s, but by the 1990s the mall suffered from a limited
selection of shops, inadequate nearby parking and increased crime. A proposal to reopen the two
blocks of the Mall south of W. Michigan to auto traffic was approved in May 1997. The street
officially reopened in October 1998, albeit one way. The one-way couplets remain, although their
conversion has been the subject of study since the 1980s.

4. Downtown Kalamazoo, Michigan Retail Market Study Gibbs Planning Group, Inc. 25 May 2017
More than 130 mostly local or regional retailers & restaurants beckon shoppers today. The
retailers include: Alfred E. Bike, Arcadia Pharmacy, Dobbs Optical, Fireplace & Grill Shop,
Gazelle Sports, Homestead Furniture, Lana’s Fashion Boutique, Maggiknits, Milan the Style
Shop, Morrison Jewelers, Newman’s Bookshop, Okun Brothers Shoes, Pop City Popcorn,
Stewart & Clarke Fine Furniture, URBAN, V&A Bootery and Van Sweden Jewelers. Among the
full and limited-service restaurants are Bell’s Eccentric Café, Bimbo’s Pizza, Central City Tap
House, Comensoli’s Italian Bistro & Bar, Epic Bistro, Food Dance, The Gatsby, London Grill –
Singapore, Mangia Mangia, The Park Club, Rustica, Sarkozy Bakery, Union Cabaret & Grill,
Webster’s Prime and Zazio’s.
Figure 3: The Downtown Kalamazoo study area is located in western Michigan.
GPG addressed the following issues in this study:
• What is the existing and planned retail market in the study and trade areas?
• What are the primary and total trade areas for Downtown Kalamazoo?
• What are the population, demographic and lifestyle characteristics in the trade areas,
currently and projected for 2022?
• What is the current and projected growth for retail expenditures in the primary trade area,
now and for the next five years?

Downtown Kalamazoo, Michigan Retail Market Study 5. Gibbs Planning Group, Inc. 25 May 2017
• How much additional retail square footage is supportable in the Downtown Kalamazoo
study area and what retail uses should be encouraged? What sales volumes can
development achieve in or near the study area?
Figure 4: The Downtown Kalamazoo study area in southwestern Michigan. Kalamazoo is approximately equidistant to
Detroit and Chicago (150 miles) and less than 50 miles from Grand Rapids.
Methodology
To address the above issues, GPG conducted an evaluation of most major existing shopping
centers and retail concentrations in the primary trade area surrounding the Downtown Kalamazoo
study area. During the week of April 10, 2017 GPG visited and assessed most major and planned
retail concentrations in the area.
GPG also visited the area during the daytime, as well as the evening, to gain a qualitative
understanding of the retail gravitational patterns and traffic patterns throughout the study area.
GPG then defined a trade area that would serve the retail in the study area based on the field
evaluation, geographic and topographic considerations, traffic access/flow in the area, relative
retail strengths and weakness of the competition, concentrations of daytime employment, and the
retail gravitation in the market, as well as our experience defining trade areas for similar markets.
Population, consumer expenditure and demographic characteristics of trade area residents were

6. Downtown Kalamazoo, Michigan Retail Market Study Gibbs Planning Group, Inc. 25 May 2017
collected by census tracts from the U.S. Bureau of the Census, U.S. Bureau of Labor Statistics,
and Esri and updated based on information gathered from local planning sources.
Finally, based on the projected consumer expenditure capture (demand) in the primary trade area
of the gross consumer expenditure by retail category, less the current existing retail sales (supply)
by retail category, GPG projects the potential net consumer expenditure (gap) available to support
new development. The projected net consumer expenditure capture is based on household
expenditure and demographic characteristics of the primary trade area, existing and planned
retail competition, traffic and retail gravitational patterns and GPG’s qualitative assessment of the
study area.
Net potential captured consumer expenditure (gap) is equated to potential retail development
square footage, with the help of retail sales per square foot data provided by Dollars and Cents of
Shopping Centers (Urban Land Institute and International Council of Shopping Centers),
qualitatively adjusted to fit the urbanism and demographics of the study area.
For the purposes of this study, GPG has assumed the following:
• Other major community retail centers may be planned or proposed, but only the existing
retail is considered for this study. The quality of the existing retail trade in the study area
is projected to remain constant. Gains in future average retail sales per sf reflect higher
sales per sf in newly developed retail and selected increases in sales per sf by individual
retail categories.
• No new major regional retail centers will be developed within the trade area of this
analysis through 2022 for the purposes of this study.
• Annual population growth for the primary trade area is estimated to be 0.63 percent
throughout the five-year period of this study.
• Employment distribution is projected to remain constant, without a significant spike or
decline in employment by NAICS categories.
• The projected lease and vacancy rate model is based on our proprietary econometric
model of the relationship between changes in employment and changes in vacancy and
lease rates. Data was gathered from the U.S. Census Bureau, Esri, CBRE and local
brokerage services.
• The region’s economy will continue at normal or above normal ranges of employment,
inflation, retail demand and growth.
• Retailers will exemplify retail industry best practices in store management,
merchandising, store layout, general appearance, product selection, marketing and
customer service.
• Parking for the Downtown will meet or exceed the industry standards.
• Visibility of any new retail in the Downtown study area is also assumed very good, with
signage as required to assure easy visibility of the retailers.
• Any new construction in the study area will be planned, designed, built and managed to
the best practices of the American Planning Association, American Institute of Architects,
American Society of Landscape Architects, the Congress for the New Urbanism, the
International Council of Shopping Centers and The Urban Land Institute.

Downtown Kalamazoo, Michigan Retail Market Study 7. Gibbs Planning Group, Inc. 25 May 2017
Trade Area
Based on GPG’s field evaluation, the existing retail hubs, population clusters, highway access,
and the retail gravitation in the market, as well as our experience defining trade areas for similar
mixed-use developments, GPG determined that consumers in the primary trade area generate
demand to support a wide variety of retailers. This potential will continue to grow over the next
five years, sustained by an annual population growth rate of 0.63 percent and annual household
income growth of 2.9 percent.
Figure 5: The Downtown Kalamazoo primary trade area, outlined in blue, encompasses approximately 308 square miles.
The primary trade area is the consumer market where the study area has a significant competitive
advantage because of access, design, lack of competition and traffic and commute patterns. This
competitive advantage equates to a potential domination of the capture of consumer expenditure
by the retailers in the study area.
GPG defined a primary trade area by topography, vehicular access, strength of retail competition
and residential growth patterns instead of standardized “drive-times.” Consumers inside the
primary trade area will account for up to 60 to 70 percent of the total sales captured by retailers in
the study area.

8. Downtown Kalamazoo, Michigan Retail Market Study Gibbs Planning Group, Inc. 25 May 2017
The following borders approximately delineate the primary trade area:
• North: 106th Avenue
• South: U Avenue
• East: 38th Street
• West: Kalamazoo/Van Buren County Line.
Figure 6: The total trade area, outlined in green, encompasses nearly 2,700 square miles of southwestern Michigan.
The total trade area (Figure 6) extends to include residents and workers who, because of
convenient access and a lack of meaningful competition, may currently or in the future contribute
expenditure to study area retailers. The boundaries of the total trade area extend:
• North to 124th Avenue
• East to 11 Mile Road
• South to Harvey Street
• West to Lake Michigan.
Residents who live in the total, but not within the primary, trade area will shop in Downtown
Kalamazoo occasionally, but the area will not be their primary shopping destination. Consumer
expenditure by these residents will account for approximately 15 to 20 percent of retail sales.
Demographic Characteristics
Using data from Esri (Environmental Systems Research Institute) and the U.S. Census Bureau,
GPG obtained the population and demographic characteristics, most recent (2017) and projected
for 2022, for the defined trade areas as well as regional statistics.

Downtown Kalamazoo, Michigan Retail Market Study 9. Gibbs Planning Group, Inc. 25 May 2017
The Downtown Kalamazoo primary trade area has an estimated 2017 population of 237,300
persons, which is estimated to grow to 244,900 by 2022, at an annual projected increase of 0.63
percent over the total five-year period. This annual growth rate is nearly twice that of the total
trade area’s projected annual increase of 0.35 percent. The number of households in the primary
trade area is 95,700, holding 2.39 persons-per-household, and is projected to increase to 98,700
per household by 2022, at an annual increase of 0.62 percent over the five-year period.
Table 2: Demographic Comparisons
Demographic Characteristic Primary Trade
Area
2-Mile
Radius
Total Trade
Area
State of
Michigan
2017 Population 237,300 44,700 608,000 9,954,600
2017 Households 95,700 15,500 240,900 3,921,100
2022 Population 244,900 45,700 618,700 10.067.300
2022 Households 98,700 15,900 245,200 3,975,700
2017-2022 Annual Population Growth Rate 0.63% 0.44% 0.35% 0.23 %
2017-2022 Annual HH Growth Rate 0.62% 0.48% 0.36% 0.28%
2017 Average Household Income $64,400 $44,200 $62,100 $68,100
2017 Median Household Income $45,500 $28,800 $45,800 $50,700
2022 Average Household Income $70,800 $47,700 $68,400 $75,000
2022 Median Household Income $52,200 $28,800 $52,000 $56,700
% Households w. incomes $75,000 or higher 29.4% 16.5% 28.3% 32.5%
% Bachelor’s Degree 22.0% 15.2% 16.5% 16.8%
% Graduate or Professional Degree 14.6% 11.7% 10.2% 11.1%
Average Household Size 2.39 2.47 2.46 2.48
Median Age 34.3 26.5 38.4 39.9
Table 2: This side-by-side table compares and contrasts primary trade area demographic statistics with those of a 2-mile
radius area, the total trade area and the State of Michigan.
The median and average household incomes in the primary trade area ($45,500 and $64,400,
respectively) are similar to the total trade area incomes of $45,800 and $62,100. Additionally, the
percentage of households with incomes over $75,000 is 29.4 percent, as compared to 28.3
percent in the total trade area, while the percentage of those holding a graduate degree is 14.6
percent, higher than the total trade area (10.2%) and the state (11.1%). The median age in the
primary trade area is 34.3.

10. Downtown Kalamazoo, Michigan Retail Market Study Gibbs Planning Group, Inc. 25 May 2017
The total trade area includes a population of 608,000 and 240,900 households, growing to
618,700 and 245,200, respectively, by 2022. This area has an average household size of 2.46
and median age of 38.4.
A closer-in two-mile radius area reports a population of 44,700, projected to grow at an annual
rate of 0.44 percent to 45,700 in five years. Its 15,500 households will grow to15,900 by 2022 at
an annual rate of 0.48 percent. Average and median households in 2017 are lower than the
primary trade area at $44,200 and $28,800, respectively; by 2022 the average household income
will have increased to $47,700 annually, while the median income remains stagnant. Households
with incomes over $75,000 is lowest of the comparative geographies at 16.5 percent. Bachelor’s
and graduate degrees have been earned by 15.2 percent and 11.7 percent of the population,
respectively. This area’s current household size is 2.47 and holds the youngest median age at
26.5 years.
Figure 7: Two-mile radius map of the Downtown study area shows the historic core and surrounding neighborhoods.
On the largest scale, the state of Michigan includes 9,954,600 people and 3,922,100 households.
The former is expected to grow at an annual rate of 0.23 percent, and the latter is projected to
grow at an annual rate of 0.28 percent to 2022, when the state’s projected population will be
10,067,300 with 3,975,700 households. This projected growth will be slower than the trade areas

Downtown Kalamazoo, Michigan Retail Market Study 11. Gibbs Planning Group, Inc. 25 May 2017
and 2-mile radius area, at 23.0 percent and 28.0 percent, respectively. The 2017 state median
and average household income statistics are greater than the three other comparison areas at
$50,700 and $68,100, respectively. The state’s figures for average household size of 2.48
persons, median age of 39.9 years, and 32.5 percent of the population that earned over $75,000
annually in 2017 is highest of all the comparative geographies. The percentage of residents
holding a bachelor’s degree is 16.8, while 11.1 percent have earned a graduate degree.
Of all households in the primary trade area, 54.9 percent are owner-occupied, a number that will
stay flat at 54.8 percent by 2022. Renter-occupied households have increased from 35.3 percent
in 2010 to 36.3 percent in 2017, and this statistic is projected to taper off to 36.5 percent by 2022.
The vacancy rate is projected to decrease correspondingly from 8.8 percent in 2017 to 8.7
percent in 2022. The average home value of $183,200 is expected to increase to $207,500 in five
years, while the median home value of $144,000 is expected to increase to $176,800 by 2022.
Tapestry Lifestyles
Esri (Environmental Systems Research Institute) has developed Tapestry Lifestyles, which is an
attempt to create 65 classifications, or lifestyle segments, that help determine purchasing
patterns. These segments are broken down to the U.S. Census Block Group level and used by
many national retailers to help determine future potential locations. The following Table 3 details
the top Tapestry Lifestyles found in the primary trade area.
Table 3: Tapestry Lifestyles
Lifestyle
Primary Trade Area Statistics
Short Description
Traditional Living
Population 23,400 Households 12,300 Median HH Income $37,000 12.8% Primary Trade Area Households Market Share 2.0% National Market Share
Traditional Living residents live primarily in low-density, urban clusters of metro areas throughout the Midwest and South. Households are a mix of married-couple families and singles. This is a younger market—beginning householders who are juggling the responsibilities of living on their own or a new marriage, while retaining their youthful interests in style and fun. Unemployment for this group is higher at 10.9%, while labor force participation is also a bit higher at 64.6%. The primary sources of employment for these residents are the manufacturing, retail trade and health care sectors. They tend to carry credit card balances, have student loans, and pay bills in person. Traditional Living residents are cost-conscious consumers that are comfortable with brand loyalty - unless the price is too high. Grocery shopping is done at discount stores such as Walmart supercenters; Kmart is a favorite for apparel and household and personal care products. Half of households use cell phones exclusively and are connected and comfortable with the Internet. They’re fast food devotees. They enjoy outdoor activities such as camping and visiting the zoo.

12. Downtown Kalamazoo, Michigan Retail Market Study Gibbs Planning Group, Inc. 25 May 2017
Lifestyle
Primary Trade Area Statistics
Short Description
Green Acres
Population 21,400 Households 10,400 Median HH Income $72,000 10.8% Primary Trade Area Households Market Share 3.2% National Market Share
The Green Acres lifestyle embraces country living and self-reliance. They live in rural enclaves in metropolitan areas, primarily but not exclusively, in older homes with acreage. Their homes are single-family and owner-occupied, with a median value of $197,000. This is an older market, primarily married couples, most with no children. Sixty percent are college educated and consequently unemployment is low (6%) and the labor force participation rate is high at (67.4%). Income is derived from wages and salaries, self-employment (more than 15% of households), investments (30% of households), and from retirement. These homeowners favor DIY home improvement projects and gardening. They enjoy a variety of outdoor sports such as hunting and fishing, motorcycling, hiking, camping, and even golf. They purchase a variety of vehicles from trucks and SUVs to ATVs and motorcycles, preferably late model. Media of choice are provided by satellite service, radio, and television. Physical fitness, from working out on home exercise equipment to playing a variety of sports, is avidly pursued. Residents are active in their communities and a variety of social organizations, from fraternal orders to veterans’ clubs.
College Towns
Population 16,800 Households 8,700 Median HH Income $28,000 9.1% Primary Trade Area Households Market Share 0.9% National Market Share
About half the residents of College Towns are enrolled in college, while the rest work for a college or the services that support it. These are nonfamily households with many students living alone or with roommates. Dwellings are a mix of densely developed student housing and dorms with local residences. Half of the housing stock is comprised of off-campus, low rent apartments. Over three-quarters of the households are renter occupied, while one-third of homes are single family, mostly occupied by local residents who own their homes. Students are thrifty due to limited incomes, except for a tendency to splurge on the latest fashions. They don’t eat healthy or see a doctor regularly. They prefer cars that get good gas mileage and environmentally friendly products. This group uses computers and cell phones to watch TV and movies, shopping, school work, news and social media. This market is bike and pedestrian friendly, like to go out to the movies and for drinks, and are politically liberal.

Downtown Kalamazoo, Michigan Retail Market Study 13. Gibbs Planning Group, Inc. 25 May 2017
Lifestyle
Primary Trade Area Statistics
Short Description
Rustbelt Traditions
Population 13,400 Households 7,000 Median HH Income $49,000 7.3% Primary Trade Area Households Market Share 2.2% National Market Share
Rustbelt Traditions residents are married-couple families and singles living in older industrial cities in states surrounding the Great Lakes, Most households are without children, reflecting the aging population. While varied, the work force is primarily white collar, with a higher concentration of skilled workers in manufacturing, retail trade, and health care. They live in older developments of single-family homes; nearly three-quarters own their homes. Rustbelt Traditions represents a large market of stable, hard-working consumers with modest incomes but above average net worth. Labor force participation is slightly higher than the U.S. at 67%, although nearly 30% of households collect social security and 20% are drawing income from retirement accounts. These are family-oriented consumers who have been in the same area for years and value time spent at home. They favor American-made products and read newspapers. They enjoy watching TV; many households have more than four TVs. Online gaming is the dominant Internet use. Radio is typically tuned to classic rock stations.
Dorms to Diplomas
Population 15,200 Households 5,000 Median HH Income $17,000 5.2% Primary Trade Area Households Market Share 0.5% National Market Share
Dorms to Diplomas are students on their own for the first time. School and part-time work take up much of the day, but the remainder is filled with socializing and fun with friends. This youngest market reports half of its population is aged 20-24. Housing caters to young renters with a mix of dorms, and on- and off-campus housing. Eighty percent of housing is apartments, with many older homes converted into multi-family units. These residents walk, bike and car pool to class. Dorms to Diplomas are impulse buyers who buy trendy clothes on a budget. Vehicles are used, imported subcompact cars. This is the first online generation – they use a computer for just about everything including news, entertainment, shopping, blogging, social media, TV, movies, and homework. This segment is active, participating in sports and yoga. Frozen dinners and fast food are go-to meals.
Table 3: The top five Tapestry Lifestyle groups profiled above portray a large number of students and singles with few
responsibilities in the primary trade area.
The trade area’s most common tapestry lifestyle group is Traditional Living, representing 12.8
percent of the primary trade area households. Residents of these neighborhoods earn a median
household income of $37,000. Their average household size is 2.50, with a median age of 34.8
years. These consumers live in low-density, settled neighborhoods in urban clusters of metro
areas in the Midwest, and married couples are the dominant household type, followed by single-
parent and single-person households. More than 70 percent have completed high school or some
college.
14. Downtown Kalamazoo, Michigan Retail Market Study Gibbs Planning Group, Inc. 25 May 2017
While unemployment is higher at 10.9 percent, labor force participation is also higher at 64.6
percent. Over three quarters of this segment’s households derive income from wages and
salaries. They are connected to the Internet, while TV is seen as the most trusted media. They
shop at discount stores such as Walmart and Kmart, while frequenting convenience stores for
fueling and lottery ticket purchases.
Green Acres is an older market segment, primarily married couples with an average age of 43.0,
and their average household size of 2.69 reflects that most households have no children. They
live in rural enclaves of metropolitan areas, most often in single-family, older homes with acreage
and a median value of $197,000. Their median household income is $72,000. Unemployment is
low at six percent, and labor force participation is high at 67.4 percent. More than 15 percent of
households are self-employed.
These consumers are focused on quality and durability, and comfortable with debt such as home
and auto loans. They are do-it-yourselfers, maintaining and remodeling their homes, and enjoy
gardening, outdoor sports and golf. These households prefer late model vehicles, from trucks and
SUVs to motorcycles. They are active in their communities and social organizations.
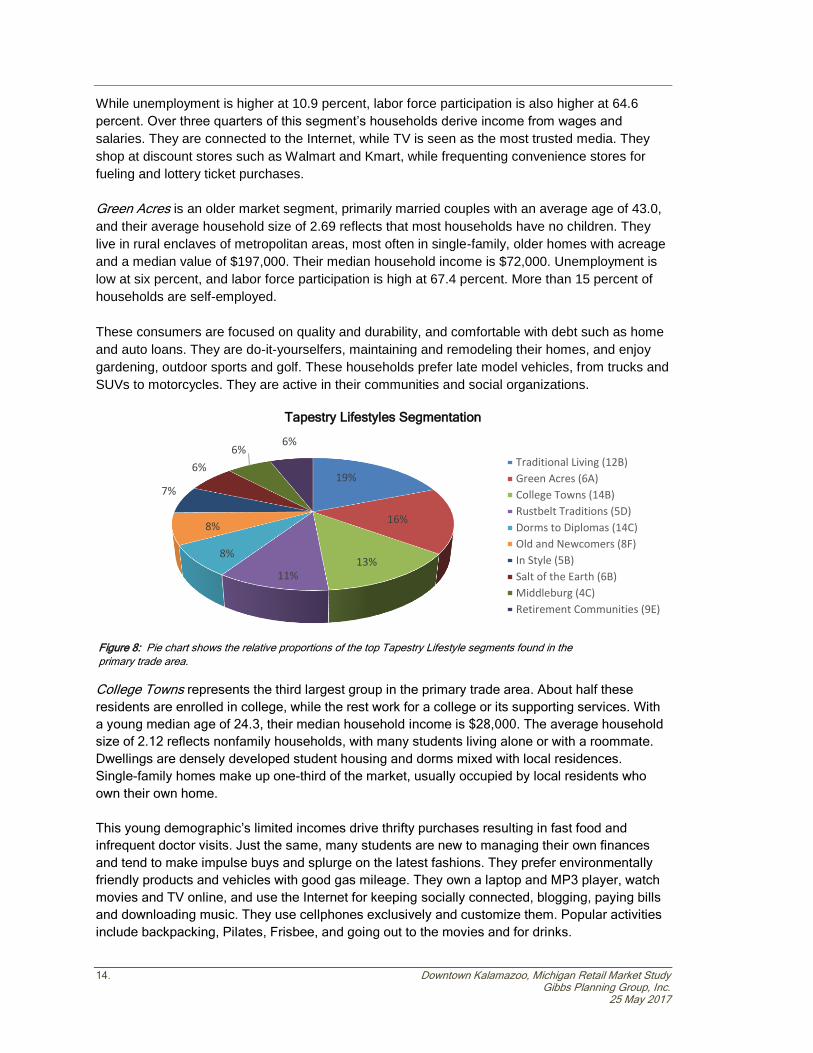
Tapestry Lifestyles Segmentation
College Towns represents the third largest group in the primary trade area. About half these
residents are enrolled in college, while the rest work for a college or its supporting services. With
a young median age of 24.3, their median household income is $28,000. The average household
size of 2.12 reflects nonfamily households, with many students living alone or with a roommate.
Dwellings are densely developed student housing and dorms mixed with local residences.
Single-family homes make up one-third of the market, usually occupied by local residents who
own their own home.
This young demographic’s limited incomes drive thrifty purchases resulting in fast food and
infrequent doctor visits. Just the same, many students are new to managing their own finances
and tend to make impulse buys and splurge on the latest fashions. They prefer environmentally
friendly products and vehicles with good gas mileage. They own a laptop and MP3 player, watch
movies and TV online, and use the Internet for keeping socially connected, blogging, paying bills
and downloading music. They use cellphones exclusively and customize them. Popular activities
include backpacking, Pilates, Frisbee, and going out to the movies and for drinks.
19%
16%
13%11%
8%
8%
7%
6%
6%6%
Traditional Living (12B)
Green Acres (6A)
College Towns (14B)
Rustbelt Traditions (5D)
Dorms to Diplomas (14C)
Old and Newcomers (8F)
In Style (5B)
Salt of the Earth (6B)
Middleburg (4C)
Retirement Communities (9E)
Figure 8: Pie chart shows the relative proportions of the top Tapestry Lifestyle segments found in the
primary trade area.

Downtown Kalamazoo, Michigan Retail Market Study 15. Gibbs Planning Group, Inc. 25 May 2017
Employment Base
The employment dynamic found in the primary trade area reflects a strong Services and Retail
sector foundation, with additional elevated levels of Manufacturing and Finance, Insurance and
Real Estate (FIRE). As shown in Table 4, the Services (39.5%) and Retail Trade (20.2%)
categories account for the majority of employment (59.7%) found in the primary trade area.
Services is the highest employment sector in all the comparison geographies and categories.
Within Services, the leading subcategories after the catchall Other Services (14.7%) are
Education Institutions and Libraries (10.6%) and Health Services (9.8%).
Retail Trade (20.2%) is the second-leading sector of employment in the primary trade area, as it
is in the total trade and state of Michigan areas. The dominant categories under Retail Trade are
Eating and Drinking Places (5.9%) and Food Stores (3.1%).
Manufacturing (10.6%) and Finance, Insurance and Real Estate (FIRE) (10.3%) are the two other
notable employment segments in the primary trade area.
Table 4: Employment Comparison by Sector
Sector 2-Mile Radius Primary Trade
Area Total Trade
Area State of
Michigan
Agriculture and Mining 0.3% 1.3% 1.8% 1.5%
Construction 1.6% 3.9% 3.5% 3.8%
Manufacturing 5.8% 10.6% 13.7% 11.9%
Transportation 3.3% 2.4% 2.5% 2.7%
Communication 0.5% 0.7% 0.7% 0.8%
Utility 0.3% 0.2% 0.4% 0.6%
Wholesale Trade 1.6% 6.9% 5.9% 4.7%
Retail Trade 8.3% 20.2% 19.6% 20.9%
Finance, Insurance and Real Estate 18.3% 10.3% 6.4% 6.1%
Services 53.2% 39.5% 39.6% 41.3%
Government 6.4% 3.7% 5.7% 5.5%
Other 0.4% 0.3% 0.2% 0.2%
Table 4: The Services sector is the dominant sector of employment in the primary trade area, employing nearly
62,700 workers.
Consumer expenditure from daytime employment compliments that captured in the evenings and
on weekends by households in the trade area. “Office Worker Retail Spending in a Digital Age”,
published by the International Council of Shopping Centers in 2012, provides insight into the
impact of office worker employment. Weekly office worker expenditure, adjusted for 2017 dollars,
is estimated at $180. Weekly non-office worker expenditure, in 2017 dollars, is estimated at 37
percent of office workers. Non-office workers are estimated to have slightly less disposable
income, to have multiple work locations including at home and typically are on the road more
during their workweek. Retail purchases (general merchandise, apparel, home furnishings,
electronics, grocery and convenience items) make up the majority of the office worker dollars, at
$120 per week. Restaurant expenditures (full service, limited service and drinking places) account
for the balance at $60 per week.

16. Downtown Kalamazoo, Michigan Retail Market Study Gibbs Planning Group, Inc. 25 May 2017
Annualized, each office worker expends $9,360 before, during and after work. Some of this
potential expenditure can be captured by future additional Downtown retailers to supplement the
demand generated by trade area households.
Table 5: Drive Time and Trade Area Employment by Industry Sector
Table 5: “Services” is the largest employment sector category within a ten-mile drive-time of the study area, with elevated
levels in the “Retail Trade,” “Manufacturing” and “FIRE” (Finance, Insurance and Real Estate) sectors.
For the purposes of this study, an hour lunch break for area workers was assumed and a ten-
minute drive time boundary was used to estimate the spending potential of workers near the study
area. The annual impact of the 75,900 workers within a ten-minute drive time is $147.3 million in
prepared food and beverage establishments, $171.8 million in retail goods sales, $73.6 million in
Employment Sector 5-Minute
Drive-time 10-Minute
Drive-time
Primary Trade Area
Agriculture & Mining 50 700 2,000
Construction 600 2,000 6,100
Manufacturing 1,900 5,900 16,700
Transportation 700 2,100 3,900
Communication 50 600 1,100
Utility 60 300 400
Wholesale Trade 500 2,100 11,000
Retail Trade 3,000 9,200 32,100
Home Improvement 100 500 1,700
General Merchandise Stores 30 550 3,300
Food Stores 300 1,300 4,900
Auto Dealers, Gas Stations, Auto Aftermarket 200 550 2,900
Apparel & Accessory Stores 70 200 1,200
Furniture & Home Furnishings 200 400 1,500
Eating & Drinking Places 1,600 4,200 11,800
Miscellaneous Retail 500 1,500 4,800
Finance, Insurance, & Real Estate 9,200 10,800 16,400
Banks, Savings, & Lending Institutions 300 600 1,500
Securities Brokers 200 300 1,100
Insurance Carriers & Agents 200 300 1,600
Real Estate, Holding, Other Investment 8,500 9,600 12,100
Services 15,800 37,400 62,700
Hotels & Lodging 600 800 1,400
Automotive Services 200 580 1,700
Motion Pictures & Amusements 400 1,180 2,800
Health Services 7,200 9,890 15,500
Legal Services 700 735 1,100
Education Institutions & Libraries 1,700 12,426 16,800
Other Services 5,000 11,735 23,400
Government 2,900 4,500 5,800
Other 200 300 400
Total Employment 35,000 75,900 158,600

Downtown Kalamazoo, Michigan Retail Market Study 17. Gibbs Planning Group, Inc. 25 May 2017
grocery purchases, and $49.1 million in convenience items, totaling $441.9 million in total worker
expenditure before, during and after the workday. Detailed results are found in Table 6.
Table 6: 10-Minute Drive Time Worker Expenditure
Table 6: Employees within a ten-minute drive of the study area could expend $830.3 million dollars annually.
Further research, including focus groups, are recommended to fully understand the existing
policies and physical conditions that are limiting daytime worker shopping and dining.
TRADE AREA CHARACTERISTICS
Market analytics provided by CoStar show mixed trends, but suggest the availability of quality
leasable space is tightening.
Table 7: Kalamazoo Retail Market Conditions
Table 7: The vacancy rate in the Kalamazoo market is down, but the availability rate is up.
The average retail rent in the Kalamazoo market is $10.94 per sf (NNN), which is slightly lower
than the five-year average but may improve as new construction becomes occupied. The vacancy
rate is down to 14.0 percent from a five-year average of 15.3 percent, however the availability rate
is up nearly six percentage points (26.3) from the average of 20.8 percent. This may be due in
part to the tripling of construction starts over the last 12 months and/or functional obsolescence of
Retai l CategoryWeekly
Expendi ture
Annual
Expendi ture
Office Worker
Expendi ture
Non-Office
Worker
Expendi ture
Tota l
Expendi ture
30,400 45,450
Reta i lers
Limited & Full Service
Restaurants$44 $2,288 $69,555,200 $38,476,152 $108,031,352
Drinking Places $16 $832 $25,292,800 $13,991,328 $39,284,128
General Merchandise,
Apparel, Home,
Electronics
$70 $3,640 $110,656,000 $61,212,060 $171,868,060
Grocery $30 $1,560 $47,424,000 $26,233,740 $73,657,740
Convenience $20 $1,040 $31,616,000 $17,489,160 $49,105,160
T o ta ls $180 $9,360 $284,544,000 $157,402,440 $441,946,440
Availability Survey 5-Year Avg Inventory Survey 5-Year Avg
NNN Rent Per SF $10.94 $11.12 Existing Buildings 66 66
Vacancy Rate 14.0% 15.3% Existing SF 1,597,151 1,595,651
Vacant SF 223,078 244,467 12 Mo. Const. Starts 17,800 6,560
Availability Rate 26.3% 20.8% Under Construction 17,800 2,890
Available SF 425,433 332,767 12 Mo. Deliveries 0 3,333
Sublet SF 10,800 4,766
Months on Market 11.9 25.5
Demand Survey 5-Year Avg Sales Past Year 5-Year Avg
12 Mo. Absorption SF -37,614 29,008 Sale Price Per SF $63 $40
12 Mo. Leasing SF 40,834 53,131 Asking Price Per SF $107 $74
Sales Volume (Mil.) $1.1 $1.6 Cap Rate - 8.5%

18. Downtown Kalamazoo, Michigan Retail Market Study Gibbs Planning Group, Inc. 25 May 2017
existing space that has yet to be redeveloped or brought up to contemporary standards.
Correlating this movement, the negative absorption trend shows that more tenants are leaving the
market than signing new leases, although this figure is somewhat affected by the increase in new
construction. The average months that a vacancy spends on the market is more than halved,
showing that many of the remaining tenants are jockeying for modern space in desirable
locations. Suggesting investors are envisioning improved returns, the annual sales volume has
decreased and the average asking and sales prices have risen 57.5 and 44.5 percent
respectively. The cap rate (8.5 percent) is above the national average, meaning returns as well as
risk, can be greater than other markets.
Figure 9: Central Business District Boundary Map.
Location The study area is located in the southwest corner of the state of Michigan approximately 40 miles
from both the state’s southern border and its eastern border on Lake Michigan. It is 45 miles south
of Grand Rapids, 60 miles southwest of Lansing and 20 miles west of Battle Creek. Downtown
Kalamazoo is centered on Michigan Avenue and bound by Willard Street, Mills Street, Walnut
Street and Westnedge Avenue.
Access
The most direct access to the subject area is W. Kalamazoo Avenue/M43 from the east, W. Main
Street/M43 from the west, N. Westnedge Avenue from the north, and S. Park Street from the
south. Regionally, access to the study area is excellent, via I-94 for east-west visitors, and north-
south via US-131.
LEGEND PARKS BUILDINGS WATER FEATURES

Downtown Kalamazoo, Michigan Retail Market Study 19. Gibbs Planning Group, Inc. 25 May 2017
Regional access south of the study area is provided at key exits from I-94: via the E. Michigan
Avenue exit 10 miles east; via the branch road Amvet Memorial Parkway exit four miles southeast
which turns into Kings Highway/I-96; the S. Westnedge Avenue exit almost four miles to the
south; and exits at both Oakland Avenue and branch US-131 into the southwest area. Access
from the west is via US-131, approximately four miles west of the study area at the W. Main Street
exit, and five miles northwest of the study area via a branch US-131 that turns into N. Park Street
and N. Westnedge Avenue. Access from the northeast is via Gull Road/SR 43, which meets M89
in Richland, almost nine miles away.
Table 8: Traffic Counts
Location Traffic Count, AADT
I-94 at S. Westnedge Avenue 77,800
US-131 at Stadium Drive 47,900
M43/W. Main Street at Douglas Avenue 26,100
E. Kalamazoo Avenue at Westnedge Avenue 22,800
Gull Road/S. Riverview Drive at Michigan Avenue 17,700
E. Michigan Avenue at Park Street 17,400
S. Westnedge Avenue at Vine Street 13,200
S. Park Street at Vine Street 13,100
Kings Highway at E. Michigan Avenue 11,100
N. Park Street at W. Kalamazoo Avenue 8,700
N. Westnedge Avenue at Kalamazoo Avenue 8,200
Table 8: The traffic chart shows the heaviest traffic into the study area is M43/W. Main Street at Douglas
Street, at 26,100 ADT, from the west, and E. Kalamazoo Avenue from US-131 to E. Michigan Avenue.
Traffic
High traffic volumes seen in Table 8 depict the routes with the best regional access (I-94 at S.
Westnedge Avenue and US-131 at Stadium Drive), and the highest concentration of activity, as
well as best local access points. The traffic counts in the area are provided by MDOT, and
measured in terms of Average Daily Traffic Volume.
In the downtown study area, the one-way westbound Kalamazoo Avenue demonstrates the
highest traffic levels, 22,800 cars per day, while the eastbound Michigan Avenue averages 17,400
cars per day. The north-south couplet of Westnedge Avenue and Park Street show similar traffic
levels: just above 13,000 cars per day south of downtown and over 8,000 cars per day north of
downtown.
Downtown Kalamazoo is served by Metro Transit with 15 different routes connecting area
residents to downtown. Annual ridership has steadily grown to more than three million – route
frequencies range from 30 to 60 minutes depending on the time of day and the one-way fare is
$1.50. The majority of downtown serving routes connect to the Kalamazoo Transportation Center
at the intersection of Burdick Street and Kalamazoo Avenue. The transit center is also a stop for
Greyhound bus and Amtrak rail service. The Wolverine and Blue Water Amtrak routes connect
Kalamazoo to Detroit, Port Huron and Chicago.

20. Downtown Kalamazoo, Michigan Retail Market Study Gibbs Planning Group, Inc. 25 May 2017
Figure 10: Students from (l-r) Western Michigan University, Kalamazoo College, Kalamazoo Valley Community College
and Davenport University contribute almost 45,000 students and faculty to Kalamazoo’s population.
Student Population
Students are an important gear in the economic engine for Downtown. Western Michigan
University, Kalamazoo College, Kalamazoo Valley Community College and Davenport University,
with over 40,000 students and 4,000 faculty and staff, make Kalamazoo a major center for
advanced education.
1. Western Michigan University
With an enrollment of 26,600 students, (18,600 undergraduates and 8,000 graduate
students) Western is a significant source of consumers for the downtown study area.
Founded in 1903, this public research university is divided into five campuses in and
around Kalamazoo; West Campus is the “Main Campus,” the primary and largest
WMU campus in Kalamazoo, located 1.5 miles west of the study area. Western offers
schools of Law and Medicine and the College of Aviation, one of the largest and most
prestigious Flight Science programs in the United States. The university’s more than
140 undergraduate programs are enhanced by master's degree programs including
Business, Engineering and Education and Human development, as well as highly
ranked programs training speech-language pathologists, physician assistants,
rehabilitation counselors and audiologists.
2. Kalamazoo College
Kalamazoo College is a private liberal arts college, founded in 1833. Notable as
among the 100 oldest colleges and universities in the United States, it offers its 1,400
undergrads some 28 majors, as well as 11 interdisciplinary majors. It is consistently
considered one of the best liberal arts colleges in the country for experiential
learning, study abroad and academics. The importance of experiential education is

Downtown Kalamazoo, Michigan Retail Market Study 21. Gibbs Planning Group, Inc. 25 May 2017
entrenched in its academic plan, known as the "K plan," which consists of a rigorous
liberal arts education supplemented by experience abroad and in the Kalamazoo
community.
3. Davenport University
Davenport University is a private, non-profit university with campuses throughout
Michigan and online. It was founded in 1866 and offers Associate's, Bachelor's, and
Master's Degrees, diplomas, and post-grad certification programs in business,
technology, health professions, and graduate studies (MBA). It has a partnership with
Kalamazoo Valley Community College at the KVCC’s downtown campus whereby
KVCC graduates can seamlessly transition into a bachelor’s degree program with
onsite programs offered on the KVCC campus.
4. Kalamazoo Valley Community College
Administrative Offices for Kalamazoo Valley Community College are located
downtown at 202 N. Rose Street, serving as the northern terminus of the North
Kalamazoo pedestrian Mall. This location is the Arcadia Commons Campus, which
serves as a hub for a community, business and education partnership that renovated
and revitalized a significant portion of the historic downtown area. KVCC is a
comprehensive, public, two-year college with four campuses: Texas Township,
Arcadia Commons, Groves Campus and the Bronson Healthy Living Campus. The
downtown Arcadia campus enrolls 3,000 students a year.
Kalamazoo is also the beneficiary of the Kalamazoo Promise, an anonymously funded
endowment, in perpetuity, which awards Kalamazoo Public School graduates with up to 100%
tuition for continuing their post-secondary education.
Special Events
Figure 10: Downtown Kalamazoo hosts a number of weekly, monthly and annual events.
The study area is a frequent platform for civic events, a popular feature of the pedestrian mall
days, which draw visitors from throughout the community and the region. Perhaps the most well-
known event is the monthly Art Hop that pairs artists with downtown businesses in an open house
format. Beginning in 1995, there have been 235 Art Hops at 5,400 stops featuring over 7,400
artists. Over 75,000 participants are annually drawn to the event with an estimated economic
impact of $2.46 million. In addition to Art Hop, Lunchtime Live! is a popular summer event that
features food trucks and music in Bronson Park, drawing many of the office workers out into the
downtown.

22. Downtown Kalamazoo, Michigan Retail Market Study Gibbs Planning Group, Inc. 25 May 2017
It should be noted that events can be a detriment to retailers when they occur during productive
shopping periods. While they often bring folks downtown that otherwise may not, the lack of
parking, traffic and over-crowding are often enough to keep away regular patrons. Events should
be planned with retailer representation and the negative effects mitigated as feasible.
Other Shopping Areas
As part of GPG’s field evaluation, neighborhood, community and regional shopping centers near
the study area were visited to assess their retail appeal, strength of tenant mix, general
maintenance and accessibility. In addition to the onsite inspection of the most significant
competing shopping concentrations to the study area, GPG used information from the
International Council of Shopping Centers’ Global Shopping Center Directory.
Regional Centers
Figure 12: Crossroads Mall is the only regional center within a 45-mile radius of the study area.
1. The Crossroads is the only enclosed regional center within a 45-mile radius of the study
area. The 769,200-sf center is situated five miles south of the study area, at S.
Westnedge Avenue in Portage, north of a Best Buy. Its 97 retailers are augmented by a
20,000-sf food court, a 36-foot double-decker carousel, and the adjacent Celebration!
Cinema & IMAX. Renovated in 2001, its anchors are JC Penney, Macy’s and Sear’s.
Notable retailers include ALDO, Bath & Body Works, Best Buy Mobile, Build-A-Bear
Workshop, Burlington, Charming Charlie, Forever 21, Kay Jewelers, Pandora, Victoria’s
Secret and Zumiez. GGP is the property owner.
Community Centers
2. University Commons is a 200,000 SF community center located off US-131 at Stadium
Drive, nearly two miles southwest of the study area. University Commons services
commuters as well as the college students from nearby Kalamazoo College, Western
Michigan University, the Western Michigan University Business Technology & Research
Park, and Western Michigan University Engineering College. Grocery-anchored by Save
a Lot, other retailers are At Home, Craft Draft 2 Go, Harbor Freight & Tools, Planet
Fitness, Barrett’s Smokehouse, Jimmy John’s, Arby’s, Qdoba and Uccello’s.

Downtown Kalamazoo, Michigan Retail Market Study 23. Gibbs Planning Group, Inc. 25 May 2017
Figure 13: University Commons (left) and Maple Hill Pavilion.
3. Maple Hill Pavilion originally opened as Maple Hill Mall in 1971, but after years of decline
was mostly demolished and rebuilt by Kimco in 2004. Now owned by Devonshire REIT, it
is located at 5050 W. Main Street, nearly 3.5 miles west of the study area. More than 20
stores are anchored by Hobby Lobby, Lowe’s, Marshall’s, OfficeMax and PetSmart.
Target shadow-anchors the center to the west. Other retailers in the 284,300-sf
community center include America’s Best, Dollar Tree, DSW, Five Below, GNC,
Maurices, Pier 1 Imports, Rooms Today and Rue21. An outparcel holds Old Country
Buffet.
4. West Main Shopping Center is a 363,000-sf community center that enjoys easy access
to US-131 from its location at the southwest corner of West Main and Drake, just across
the street from Maple Hill Pavilion. The center’s anchor tenants include Harding's Food
Market, Kohl's, Lowe's and MC Sports. Ancillary tenants include Blaze Pizza, Family
Dollar, Fashion Connection Menswear, Payless ShoeSource, Niskers Grill, Style M.E.
Boutique, Hunan Gardens, the UPS Store and Verizon.
Figure 14: Kohl’s is among the four anchors of West Main Shopping Center (left). Corner @ Drake (right) Is
expanding its footprint to attract inline retailers to supplement a Costco and Field and Stream.
5. Corner @Drake is a $70 million shopping plaza on 40 acres, located at the northeast
quadrant of US-131 and Stadium Drive, 3.5 miles slightly southwest of the study area.
Already home to a 148,000 sf Costco (opened in 2014) and a 50,000 sf Field & Stream
(opened in 2016), a new retail section called The Corner Shoppes currently features a
Firehouse Subs shop bookended by a credit union and a bank. Two new buildings
fronting Drake Road are currently under construction, and offer up to 20,000 sf of prime
retail or restaurant space by developer AVB Inc.

24. Downtown Kalamazoo, Michigan Retail Market Study Gibbs Planning Group, Inc. 25 May 2017
Figure 15: Southland Mall (left) and Portage Crossings (right) add to the draw of the Crossroads Mall area.
6. Southland Mall, five miles south of the downtown study area, is a 365,000-sf community
center situated at S. Westnedge Avenue and W. Milham Avenue in Portage, midway
between the I-94 interchange and Crossroads regional mall. Anchors include Barnes &
Noble, Kohl's, Old Navy, T.J. Maxx and Ulta. They are buttressed by ABC Warehouse,
David’s Bridal, Hallmark, Helzberg Jewelers, Lane Bryant, MC Sporting Goods, Maurices,
Petco and Tuesday Morning. Customers can swing by Noodles and Company,
Panchero’s, Pizza Hut and Taco Bell for a meal break. The Meyer C. Weiner Company
owns and operates Southland.
Across S. Westnedge Avenue from Southland is a retail assembly that includes Aldi,
Chuck E. Cheeses, Dick’s Sporting Goods, Jo-Ann Fabrics & Crafts and Toys R Us.
7. Portage Crossings is a 290,000-sf community center across S. Westnedge Avenue from
Crossroads Mall, at J.L. Hudson Drive and S. Westnedge in Portage. It was built in 1988
and last renovated in 1992. Its 20 stores are anchored by Target and Home Depot, and
include Bargain Books, Catherine’s, Edible Arrangements, GameStop, Great Party, Life
Uniforms and Sakura Japanese Steakhouse and Zoup!, as well as several beauty and
service-oriented tenants.
Figure 16: Tiffany’s Village (left) is the closest retail competition to Downtown. Westwood Plaza (right) is
situated in the same vicinity as Maple Hill Pavilion and West Main Center.
Neighborhood Centers
8. Tiffany’s Village is a 30,000-sf neighborhood center in Kalamazoo Twp., located less than
1.5 miles from the study area at 1714 W Main Street. Tiffany’s Wine and Spirits anchors
the center, which also includes QD Pharmacy, Klai Beauty Supply, Nina’s Café, Papa
John’s Pizza and Zooroona Restaurant. The center is owned by the Mandwee Family.

Downtown Kalamazoo, Michigan Retail Market Study 25. Gibbs Planning Group, Inc. 25 May 2017
9. Westwood Plaza is a 100,000-sf neighborhood center approximately 3.2 miles west of the
study area at 4604 W. Main Street, on the northeast corner of West Main & Drake. Its
retailers and eateries include Biggby Coffee, Cold Stone Creamery, Discovery Shop,
Kyoto Japanese Steakhouse, Lumber Liquidators, MacKenzie’s Café & Bakery, Main
Street Pub, Merle Norman Cosmetic Studio National Health Food Center, Taste of
Heaven, Penn Station Subs, Sleep Doctor Mattresses, Phantom Fireworks and Wild Bill’s
Tobacco. The center is owned by Treystar.
10. Willow Creek Shopping Center is a 47,600-sf neighborhood center offering a selection of
restaurants, retailers and medical service providers at 5132 S. Westnedge Avenue in
Portage. Situated near I-94, its retailers include Batteries Plus, Dollar Tree, Medical
Weight Loss, Payless ShoeSource, Vladimir Arts and Wild Bill's Tobacco. The retail is
supported by quick service eateries Biggby Coffee, Jersey Giant Subs and Papa John's
Pizza. Located nearly 3.5 miles south of the study area, the leasing manager is Hinman
Development.
Over one million square feet of critical retail mass adjacencies surround Willow Creek.
The center is directly in front of Lowe's, adjacent to Earth Fare and Pet Supplies Plus,
and across the street from Meijer. North of Willow Creek is a community center with Bert’s
Bakery, Big Lots, Family Christian, Hibachi Sushi Buffet and anchor Office Depot.
Figure 17: Willow Creek Shopping Center (left) is adjacent to significant large-scale retail stores. Oakwood
Plaza (right) is anchored by a recently expanded Sawall Health Foods.
10. Oakwood Plaza, located about 4.7 miles south of downtown at 700 Mall Drive in Portage,
is a 52,000-sf neighborhood specialty center. Situated 1.5 miles of Western Michigan
University, it benefits from some college trade. It is grocery-anchored by recently
renovated 24,000-sf Sawall Health Foods, which is the most successful and well known
independent health food store in the area. When the center renovated the exterior
renovation, and added parking in 2015, Sawall also expanded its size by 8,000 sf. It
added an upper level to include space for more pre-cooked foods as well as an outdoor
sitting area. Owned & operated since 1989 by the Matthew C. Weiner Co., its 17 tenants
include Barks 5th Avenue, Bookbug, Fletcher’s Pub, Initial Attraction, Treat Street ice
cream and Wild Birds Unlimited.

26. Downtown Kalamazoo, Michigan Retail Market Study Gibbs Planning Group, Inc. 25 May 2017
Figure 18: Greenspire Shoppes (left) and Woodbridge Village (right) are near each other on W. Centre Avenue.
11. Greenspire Shoppes is located near Woodbridge Shopping Village, at 3279 W. Centre
Avenue in Portage. Hinman and AVB have developed this 13,400-sf upscale
neighborhood retail center that offers Biggby Coffee, Breakfast at Tiffiny's, Centre Street
Tap House, Kazoo Audio and Sticks & Stones, as well as additional service-oriented
tenants. It is approximately 6.8 miles southwest of the study area.
12. Woodbridge Shopping Village is a 65,000-sf neighborhood center located one-half mile
east of US-131 at 3750 W. Centre Avenue in Portage. Retail and restaurant tenants
include Big Apple Bagels, Cookies by Design, Design Details, Fieldstone Grill, Harding's
Market, Little Caesars, Spicy Pickle, Subway, The Big Burrito, UniQ Jewelry Gallery and
Ziingo. They are joined by a variety of service-oriented tenants. The center is managed
by Treystar Leasing.
North of Kalamazoo is a retail conglomeration on Allegan Street/M89 just west of the exit from
US-131 in Plainville, approximately 11.5 miles north of the study area. It includes:
Figure 19: Otsego Plaza (left) and Oaks Crossing Mall (right) are farther north of the site in Plainwell.
13. Otsego Plaza is a 33,000 GLA neighborhood center located at 1221 M-89 in Plainwell.
Constructed in 1992, and shadow-anchored by Home Depot, it offers Dollar Tree,
Payless Shoe Source and Tractor Supply Company. A Meijer is just east of this plaza. It
is represented by Simon Jonna & Group of Marcus & Millichap.
14. Oaks Crossing Mall is a neighborhood center located at 406 Cross Oaks Blvd., southwest
of Otsego Plaza across M89/Allegan Street, between a Walmart and M-89 Cinema. Built
in 1988, its selection of tenants includes Cricket Wireless, Empire Wok, Family Fitness
Center, GameStop, Goin’ Postal, Jo’s Hallmark, NDS Electronics, Mancino' s Italian
Eatery and Sleep Solutions.

Downtown Kalamazoo, Michigan Retail Market Study 27. Gibbs Planning Group, Inc. 25 May 2017
Figure 20: Location map showing location of the significant retail competition to the subject area.
Table 9: Shopping Center Competition
Map Designation
Retail Center Name S/F Distance from
Site Shopping Center Type
1 Crossroads Mall 769,200 sf 5.0 MI S Regional Center
2 University Commons 200,000 sf 1.9 MI SW Community Center
3 Maple Hill Pavilion 284,300 sf 3.5 MI W Community Center
4 West Main Shopping Center 363,000 sf 3.5 MI W Community Center
5 Corner @ Drake 220,000 sf 3.6 MI SW Community Center
6 Southland Mall 365,000 sf 5.0 MI S Community Center
7 Portage Crossings 290,000 sf 5.1 MI S Community Center
8 Tiffany’s Village 30,000 sf 1.4 MI NW Neighborhood Center
9 Westwood Plaza 100,000 sf 3.2 MI W Neighborhood Center
10 Willow Creek Shopping Center 47,600 sf 3.3 MI S Neighborhood Center
11 Oakwood Plaza 52,000 sf 4.7 MI S Neighborhood Center
12 Greenspire Shops 13,400 sf 6.8 MI S Neighborhood Center
13 Woodbridge Village 65,000 sf 7.0 MI S Neighborhood Center
14 Otsego Plaza 33,000 sf 11.5 MI N Neighborhood Center
15 Oaks Crossing Mall 27,400 sf 11.5 MI N Neighborhood Center

28. Downtown Kalamazoo, Michigan Retail Market Study Gibbs Planning Group, Inc. 25 May 2017
Figure 21: Downtown can boast some recent new development, as seen on the left. However, Michigan Avenue has
certain characteristics, such as the one-way street shown right, that impede the success of these enhancements.
SUMMARY of FINDINGS
This study finds that the Downtown Kalamazoo study area can presently support up to 27,800
square feet (sf) of new retail and restaurant development, generating nearly $5.3 million in sales.
Alternatively, with recommended physical and policy changes to the downtown’s operations, the
study area could support up to 156,500 sf of new retail and restaurant, producing up to $51.6
million in gross sales. This retail development could include:
• Corner Stores: One to two corner stores at 1,500 to 2,500 sf, located near neighborhood
entries.
• Convenience Centers: Two to three 20,000 to 30,000 sf convenience centers with
excellent visibility and sufficient parking. These centers can include a wide range of
retailers such as pharmacy, gifts stores, electronics, full-service and limited-service
restaurants, special food services, florists and apparel.
• Main Street Centers: One 100,000 to 150,000 sf Main Street center located with direct
access from Kalamazoo Avenue or Michigan Avenue. The Main Street center would
ideally secure an anchor tenant and feature a strong collection of lifestyle tenants such as
apparel, shoes, jewelry, home furnishings, department store merchandise and gifts, as
well as a critical mass of dining and entertainment options.
These centers could be developed as single-site stand-alone developments or as infill
development into the existing downtown.
The demographics of the primary trade area show a population base of 237,300 people, which
will grow to 244,900 by 2022, at an annual growth rate of 0.63 percent. The persons-per-
household is 2.39, and median age is 34.3 years old. The average household income of $64,400
and the median household income of $45,500 in the primary trade area are similar to the total
trade area incomes of $62,100 and $45,800, respectively. Primary trade area households report
29.4 percent of incomes greater than $75,000 per year, as compared to a 28.3 percent of
residents in the total trade area.
There are approximately 158,600 employees within the primary trade, 39.5 percent of which are
concentrated in the Service sector and 20.2 percent in Retail Trade. These daytime consumers

Downtown Kalamazoo, Michigan Retail Market Study 29. Gibbs Planning Group, Inc. 25 May 2017
expend up to $830.3 million annually, with the General Merchandise, Apparel, Home &
Electronics sector leading at over $322.9 million per year.
Tapestry lifestyles in the market reflect a majority base of Traditional Living, representing 12.8
percent of the primary trade area households. Residents of these neighborhoods earn a median
household income of $37,000, with a median age of 34.8 years These consumers live in low-
density, settled neighborhoods in urban clusters of metro areas in the Midwest, and married
couples are the dominant household type, followed by single-parent and single-person
households.
Many families encompass two generations who have lived and worked in the community. The
manufacturing, retail trade, and health care sectors are the primary sources of employment for
these residents. This is a younger market—beginning householders who are juggling the
responsibilities of living on their own or a new marriage, while retaining their youthful interests in
style and fun. More than 70 percent have completed high school or some college.
More than 75 percent of households derive income from wages and salaries, augmented by
Supplemental Security Income and public assistance. They are cost-conscious, brand-loyal
consumers, unless the price is too high. Households have one or two vehicles. While
unemployment is higher at 10.9 percent, labor force participation is also higher at 64.6 percent.
Over three quarters of this segment’s households derive income from wages and salaries. They
are connected to the Internet, while TV is the most trusted media. They shop at discount stores
such as Walmart and Kmart, while frequenting convenience stores for fueling and lottery ticket
purchases.
Fuel and incidentals like lottery tickets are often purchased at convenience stores. This segment
is likely to carry credit card balances, have student loans and pay their bills in person. Favorite TV
channels include QVC, CMT, and Game Show Network. They enjoy outdoor activities and fast
food.
Green Acres is an older market segment, primarily married couples with an average age of 43.0,
and their average household size of 2.69 reflects that most households have no children. They
live in self-reliant rural enclaves of metropolitan areas, most often in single-family, older homes
with acreage and a median value of $197,000. Their median household income is $72,000.
Unemployment is low at six percent, and labor force participation is high at 67.4 percent. More
than 15 percent of households are self-employed.
These consumers are focused on quality and durability, and comfortable with debt such as home
and auto loans. They are do-it-yourselfers, maintaining and remodeling their homes, and enjoy
gardening, outdoor sports and golf. These households prefer late model vehicles, from trucks and
SUVs to motorcycles. They are active in their communities and social organizations.

30. Downtown Kalamazoo, Michigan Retail Market Study Gibbs Planning Group, Inc. 25 May 2017
Supportable 2017 Retail and Potential Tenants
• 26,500 sf Apparel: Apricot Lane, Country Casuals / Expressions / J. Philips, Del Sol,
Dennis Uniform, Educational Outfitters, Group USA, J. McLaughlin, Jos. A Banks,
Roots and Tom James.
• 17,900 sf Miscellaneous Retail: Miscellaneous retail includes cosmetics, eyewear
and special interest retailers. Potential retailers include Blo Blow Dry Bar, Dick Blick,
GNC, Orvis, Painting with a Twist and President Tuxedo.
• 14,400 sf Department Store Merchandise: Visionworks, SEE Eyewear and Sola
Salon.
• 13,400 sf Full-Service Restaurants: Andiamo, Peppino’s Sports Grille, Real Seafood
Company, Red Mesa Grill, Red Olive, The Melting Pot and Tucano’s Brazilian Grill.
• 12,300 sf Specialty Food Stores: Achatz Handmade Pie Company, Bryn + Dane’s,
Edible, Ric’s Food Center, Spice & Tea Merchants and Street Corner.
• 11,600 sf Limited-Service Eating Places: 1000 Degrees Pizza, Big Smoke Burger,
Cor Life, Naf Naf Grill, Olga’s and Sweet Lorraine’s Mac n Cheez.
• 10,400 sf Electronics & Appliances: iStore, Simply mac, T-Mobile and uBreakiFix.
• 9,900 sf Pharmacy & Personal Care Stores: Benzer Pharmacy, Ehardt’s Pharmacy,
La Vida Massage, Massage Envy and Massage Green.
• 9,400 sf Gift Stores: Cherry Republic, Country Clutter Gifts, Crown Trophy, Kirlin’s
Hallmark, Swan Creek Candle Company and Ten Thousand Villages.
• 9,100 sf Drinking Establishments: Griffin Claw, Bar Louie, Claddagh Irish Pub,
Gordon Biersch Brewing Company, Bier Markt, Sedona Taphouse and Rusty Bucket.
• 6,700 sf Special Food Services: Ben’s Pretzels, Big Apple Bagel, Biggby Coffee,
Breadsmith, Gigi’s Cupcakes, Great Lakes Chocolate & Coffee, Kilwin’s, Sanders,
South Bend Chocolate Co. and Zoyo Neighborhood Yogurt.
• 4,300 sf Books & Music Stores: Argos Book Shop, Book World and Books and
Mortar.
• 3,300 sf Home Furnishings: California Closets, Klingman’s, La-Z-Boy, the Great
Frame Up, US Mattress.
• 2,700 Beverage Stores: Michigan by the Bottle, Tinder Box and Winestyles.
• 2,300 sf Jewelry: Alex & Ani, Medawar, Pandora and The Jewelry Source.
• 1,400 sf Shoes: Potential shoe stores are Good Feet, Foot Solutions, red Wing
Shoes and V&A Shoes.
• 1,200 Florists: 1 (800) Flowers and VanderSalm.

Downtown Kalamazoo, Michigan Retail Market Study 31. Gibbs Planning Group, Inc. 25 May 2017
A detailed examination of the supportable sf of retail uses is found in the following Table 10.
Table 10: 2017 Supportable Retail Table
Table 10: Sales stated in constant 2017 dollars.
A breakdown of suggested category retailers and supportable square feet for each may be found
in the following Table 11. Although the trade area will not support a grocery store downtown, GPG
recommends that the city consider a small to medium-size, year-round public market, such as
those in Bay City, Flint, Grand Rapids and the Oxbow Market in Napa.
City Market, Bay City, Michigan
Bay City will open a new year-round, indoor farmers market at 401 Center Avenue in June 2017.
The market is located in a former downtown JC Penney building and will be fully occupied with
approximately 30 vendors selling fresh, locally sourced food. They range from farmers offering
fresh produce to a fishmonger selling fresh catches from Lake Huron, as well as: Bee Leaf Teas,
Artisanne Chocolatiers, Brewtopia coffee shop, Burdock Root farm-to-table restaurant, Chubby
Duck Asian restaurant and grocery, Cinnamom bakery, Elaine’s bake shop, GCC Organics
USDA- certified butchery, Half-Mile Handmade kitchen products (Michigan-made), Oily
Apothecary essential oils booth, The Devout Sprout salad bar and The Petal Boutique flowers,
among others. The market has 10 vendors on a waiting list to join the new enterprise.
Retail Category
Status Quo
Supportable
SF
Sales/
SF
Status Quo
Estimated
Retail Sales
Supportable
SF with
Improvements
Sales/
SF
2022
Estimated
Retail Sales
No. of
Stores
Retailers
Apparel Stores 1,780 $205 $364,900 26,460 $340 $8,996,400 8 - 10
Beer, Wine & Liquor Stores - $230 $0 2,650 $385 $1,020,250 1
Book & Music Stores 1,130 $170 $192,100 4,270 $280 $1,195,600 1
Department Store Merchandise 2,420 $230 $556,600 14,360 $380 $5,456,800 3 - 4
Electronics & Appliance Stores - $205 $0 10,430 $340 $3,546,200 3 - 4
Florists - $145 $0 1,140 $245 $279,300 1
Gift Stores 2,130 $160 $340,800 9,400 $270 $2,538,000 5 - 6
Home Furnishings Stores 1,810 $195 $352,950 3,280 $325 $1,066,000 1 - 2
Jewelry Stores 1,650 $265 $437,250 2,290 $445 $1,019,050 1
Miscellaneous Store Retailers 3,980 $160 $636,800 17,880 $265 $4,738,200 6 - 8
Pharmacy & Personal Care Stores - $290 $0 9,910 $485 $4,806,350 1 - 2
Shoe Stores - $170 $0 1,420 $285 $404,700 1
Specialty Food Stores 4,090 $175 $715,750 12,260 $295 $3,616,700 1 - 3
Retailer Totals 18,990 $200 $3,597,150 115,750 $334 $38,683,550 33 - 44
Restaurants
Bars, Breweries & Pubs 2,470 $200 $494,000 9,060 $335 $3,035,100 2 - 3
Full-Service Restaurants 3,780 $210 $793,800 13,390 $350 $4,686,500 3 - 4
Limited-Service Eating Places - $170 $0 11,570 $280 $3,239,600 4 - 5
Special Food Services 2,520 $180 $453,600 6,690 $295 $1,973,550 3 - 4
Restaurant Totals 8,770 $190 $1,741,400 40,710 $315 $12,934,750 12 - 16
Retailer & Restaurant Totals 27,760 $198 $5,338,550 156,460 $329 $51,618,300 45 - 60

32. Downtown Kalamazoo, Michigan Retail Market Study Gibbs Planning Group, Inc. 25 May 2017
Figure 22: Workers put the finishing touches on the new City Market in Bay City, set to open in June (left). The Flint
Farmer’s Market (right) relocated to downtown in the former Flint Journal building.
Flint Farmers’ Market
The 70+ year-old Flint Farmers’ Market moved to a new downtown location in May 2014. The
market features more than 50 vendors offering produce, meat and poultry, groceries, spices,
beverages, flowers, gifts, baked goods and eating places in an indoor-outdoor venue. Open three
days a week (Tuesday, Thursday and Saturday) year-round, the 32,000-sf market also sponsors
events such as live music, storytellers, authors, and demonstrations focusing on foods that can
help limit the effects of lead poisoning (the market emphasizes that their water filter system is
lead-free). Voted #3 in the nation, the market’s selection of vendors includes: Willow’s Garden
Juice Bar, Hoffman’s Chop Shop butcher shop, Charlie’s Smokin’ BBQ, d’Vine Wines, Maria’s
Garden, Bagels & Beans, Beirut Restaurant, Crust, a baking company, Fresh Donuts by Porter’s,
Fresh Lake Whitefish Company, Godfrey’s Poultry & Eggs, Gourmet Apple Cart, Hills Home
Cured Cheese, J Deans Smoke House, Market Deli by Hoffman’s, Market Tap full service bar, in
addition to an assortment of farms offering seasonal Michigan homegrown fruits and vegetables.
The market’s Dort Federal Credit Union Demonstration Kitchen hosts weekly cooking classes and
demos. The indoor-outdoor market also features an art gallery, a café and several spaces to host
private events, including the Atrium, or indoor Town Square, which has a 70-foot-high ceiling; the
Rooftop Terrace overlooking downtown Flint; and the Ramsdell Room that seats 200.
Grand Rapids Downtown Market
The Grand Rapids Downtown Market, located at 435 Ionia Ave. SW, is home to 22 indoor market
vendors, two full-service restaurants, monthly outdoor market events, hands-on cooking classes,
private event venues, a state-of-the-art incubator kitchen, rooftop greenhouses and more.
Opened on May 3, 2013 indoor facility, the $30 million market is LEED Gold certified (the first in
the country). Grand Rapids Downtown Market, Inc. operates the Market.
The 138,000-sf space offers an array of vendors including Crane Dance Farm, Trillium Haven
Farm, Slows Bar B Q, Social Kitchen & Bar, Aperitivo, Blue Spoon Pasta Studio, bokay Flower
Market, Carver’s Grand Rapids Finest Meats, Dorothy & Tom’s Gourmet Popcorn, Field & Fire
Bakery, Fish Lads, Love’s Ice Cream, Madcap Coffee, Making Thyme Kitchen, Michigan Pantry,
Rocket Pies and Spice Merchants.

Downtown Kalamazoo, Michigan Retail Market Study 33. Gibbs Planning Group, Inc. 25 May 2017
Figure 23: The Grand Rapids Public Market (left) is the first LEED-certified public market in the country. The Oxbow Pubic
Market in Napa, California (right) opened in 2007.
Oxbow Public Market
The Oxbow Public Market is a 40,000-sf indoor marketplace in Napa, California that features local
and regional artisan food and wine vendors and restaurants. The market leases space to owner-
operated businesses that focus primarily on sustainable local foods. Opened in 2007, its indoor
vendors all share a roof, an airy, open space, and the twice-weekly farmers' market in the parking
lot outside, while also featuring an outdoor deck overlooking the Napa River. The 22 merchants
offer a tenant mix of local food vendors, artisan cafes and an organic produce outlet for local
farms, including, C Casa, Fatted Calf Charcuterie, Five Dot Ranch & Cookhouse, Hog Island
Oyster Co., Hudson Greens & Goods, Model Bakery, Napa Bookmine, Napa Valley Distillery,
Oxbow Cheese and Wine Merchant, Ritual Coffee, Three Twins Ice Cream and Whole Spice.
Managed by Madison Oxbow Ventures LP, the market is open seven days a week.

34. Downtown Kalamazoo, Michigan Retail Market Study Gibbs Planning Group, Inc. 25 May 2017
Table 11: Recommended Retailers
Table 11 continued on next page
Supportable SF= 26,460
Number of Stores 8 to 10
Prospect SF
Country Casuals / Expressions / J. Phillips 2,500
Apricot Lane 2,500
Del Sol 2,000
Dennis Uniform 3,000
Educational Outfitters 4,000
Group USA 5,000
J. McLaughlin 2,300
Jos. A Banks 4,500
Roots 3,000
Tom James 3,000
31,800
Supportable SF= 2,650
Number of Stores 1
Prospect SF
Winestyles 2,000
Tinder Box 1,000
Michigan By The Bottle 2,000
5,000
Supportable SF= 4,270
Number of Stores 1
Prospect SF
Argos Book Shop 3,000
Book World 3,000
Books & Mortar 2,500
8,500
Supportable SF= 14,360
Number of Stores 3 to 4
Prospect SF
Visionworks 3,000
SEE Eyewear 1,200
Sola Salon 5,000
9,200
Supportable SF= 10,430
Number of Stores 3 to 4
Prospect SF
iStore 3,000
Simply Mac 5,000
T-Mobile 3,000
uBreakiFix 1,500
12,500
Apparel
Beer, Wine & Liquor
Book & Music Stores
Department Store Merchandise
Electronics + Appliance Stores

Downtown Kalamazoo, Michigan Retail Market Study 35. Gibbs Planning Group, Inc. 25 May 2017
Table 11: Recommended Retailers (con’t)
Table 11 continued on next page
Supportable SF= 1,140
Number of Stores 1
Prospect SF
1 (800) FLOWERS 2,000
VanderSalm 2,200
4,200
Supportable SF= 9,400
Number of Stores 5 to 6
Prospect SF
Cherry Republic 5,000
Country Clutter Gifts 2,000
Crown Trophy 1,000
Kirlin's Hallmark 3,000
Swan Creek Candle Co 2,000
Ten Thousand Villages 2,500
15,500
Supportable SF= 3,280
Number of Stores 1 to 2
Prospect SF
California Closets 1,000
Klingman's 5,000
La-Z-Boy 5,000
The Great Frame Up 1,500
US Mattress 3,000
15,500
Supportable SF= 2,290
Number of Stores 1
Prospect SF
Alex & Ani 1,500
Medawar 2,500
Pandora 1,000
The Jewelry Source 2,000
7,000
Supportable SF= 17,880
Number of Stores 6 to 8
Prospect SF
Blo Blow Dry Bar 1,200
Dick Blick 5,000
GNC 1,200
Orvis 12,000
Painting with a Twist 2,000
President Tuxedo 1,500
22,900
Gift
Home Furnishings
Jewelry
Miscellaneous Store Retailers
Florist
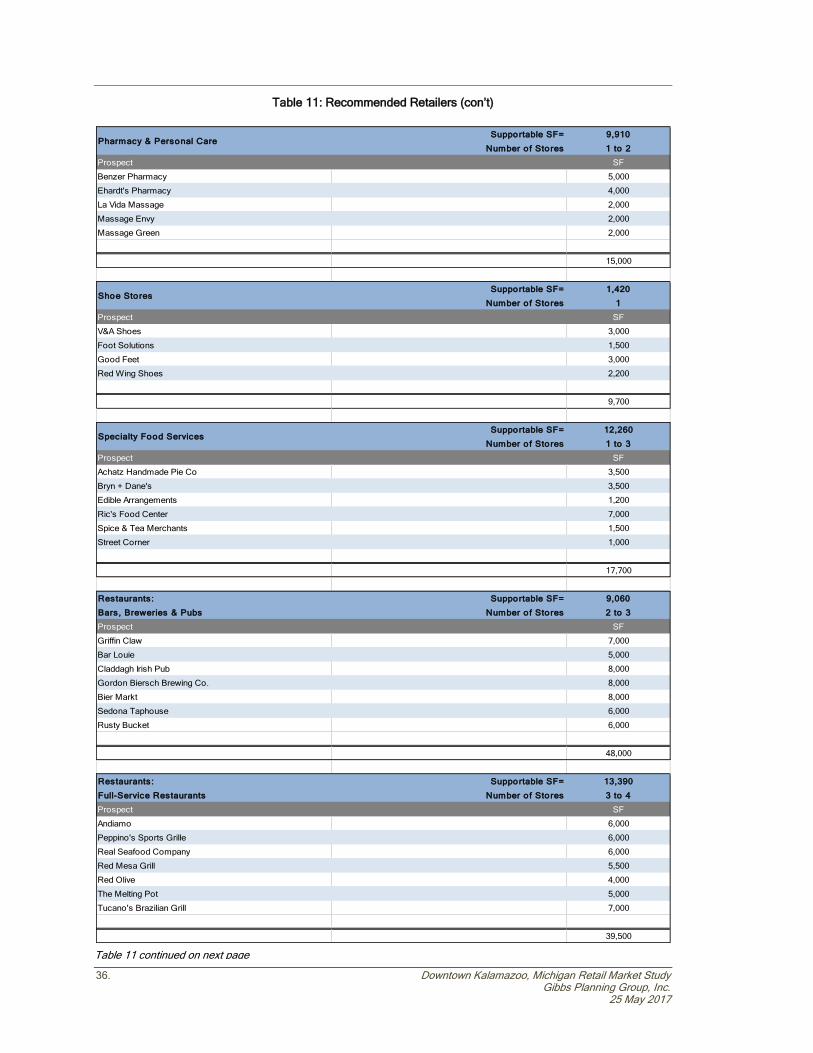
36. Downtown Kalamazoo, Michigan Retail Market Study Gibbs Planning Group, Inc. 25 May 2017
Table 11: Recommended Retailers (con’t)
Supportable SF= 9,910
Number of Stores 1 to 2
Prospect SF
Benzer Pharmacy 5,000
Ehardt's Pharmacy 4,000
La Vida Massage 2,000
Massage Envy 2,000
Massage Green 2,000
15,000
Supportable SF= 1,420
Number of Stores 1
Prospect SF
V&A Shoes 3,000
Foot Solutions 1,500
Good Feet 3,000
Red Wing Shoes 2,200
9,700
Supportable SF= 12,260
Number of Stores 1 to 3
Prospect SF
Achatz Handmade Pie Co 3,500
Bryn + Dane's 3,500
Edible Arrangements 1,200
Ric's Food Center 7,000
Spice & Tea Merchants 1,500
Street Corner 1,000
17,700
Restaurants: Supportable SF= 9,060
Bars, Breweries & Pubs Number of Stores 2 to 3
Prospect SF
Griffin Claw 7,000
Bar Louie 5,000
Claddagh Irish Pub 8,000
Gordon Biersch Brewing Co. 8,000
Bier Markt 8,000
Sedona Taphouse 6,000
Rusty Bucket 6,000
48,000
Restaurants: Supportable SF= 13,390
Full-Service Restaurants Number of Stores 3 to 4
Prospect SF
Andiamo 6,000
Peppino's Sports Grille 6,000
Real Seafood Company 6,000
Red Mesa Grill 5,500
Red Olive 4,000
The Melting Pot 5,000
Tucano's Brazilian Grill 7,000
39,500
Specialty Food Services
Pharmacy & Personal Care
Shoe Stores
Table 11 continued on next page

Downtown Kalamazoo, Michigan Retail Market Study 37. Gibbs Planning Group, Inc. 25 May 2017
Table 11: Recommended Retailers (con’t)
Table 11: Names and sizes of possible retailers supportable in the study area.
Retail Category Definitions
Retail categories in the Supportable Retail Table correspond to the North American Industry
Classification System (NAICS), the standard used by Federal statistical agencies in classifying
business establishments for the purpose of collecting, analyzing, and publishing statistical data
related to the U.S. business economy. The following NAICS codes and definitions are provided by
the U.S. Census Bureau:
Retail
Auto Supply Stores (4411): establishments known as automotive supply stores primarily
engaged in retailing new, used, and/or rebuilt automotive parts and accessories;
automotive supply stores that are primarily engaged in both retailing automotive parts and
accessories and repairing automobiles; establishments primarily engaged in retailing and
installing automotive accessories; and establishments primarily engaged in retailing new
and/or used tires and tubes or retailing new tires in combination with automotive repair
services.
Furniture Stores (4421): establishments primarily engaged in retailing new furniture, such
as household furniture (e.g., baby furniture box springs and mattresses) and outdoor
furniture; office furniture (except those sold in combination with office supplies and
equipment); and/or furniture sold in combination with major appliances, home electronics,
home furnishings, and/or floor coverings.
Restaurants: Supportable SF= 11,570
Limited-Service Eating Places Number of Stores 4 to 5
Prospect SF
1000 Degree Pizza 3,000
Big Smoke Burger 3,000
CoreLife 3,500
Naf Naf Grill 3,000
Olga's Kitchen 4,000
Sweet Lorraine's Mac n Cheez 1,800
18,300
Restaurants: Supportable SF= 6,690
Special Food Services Number of Stores 3 to 4
Prospect SF
Ben's Pretzels 1,000
Big Apple Bagel 1,800
Biggby Coffee 1,500
Breadsmith 1,800
Gigi's Cupcakes 1,500
Great Lakes Chocolate & Coffee 1,800
Kilwin's 1,800
Sanders 1,500
South Bend Chocolate Co. 2,500
Zoyo Neighborhood Yogurt 1,500
16,700

38. Downtown Kalamazoo, Michigan Retail Market Study Gibbs Planning Group, Inc. 25 May 2017
Home Furnishings Stores (4422): establishments primarily engaged in retailing new home
furnishings (except furniture).
Electronics and Appliance Stores (4431): establishments primarily engaged in retailing
the following new products: household-type appliances (refrigerator, dishwasher, oven),
cameras, computers/software, televisions, and other electronic goods.
Hardware Stores (4441): establishments primarily engaged in retailing new building
materials and supplies (lumber, plumbing, electrical, tools, housewares, hardware, paint,
and wallpaper)
Lawn and Garden Supply Stores (4442): establishments primarily engaged in retailing
new lawn and garden equipment and supplies. (Nursery, farm, and garden products,
outdoor power equipment)
Grocery Stores (4451): establishments primarily engaged in retailing a general line of
food products (canned/frozen food, fruits and vegetables, meat, fish, poultry, milk, bread,
eggs, soda)
Specialty Food Stores (4452): establishments primarily engaged in retailing specialized
lines of food (meat, fish/seafood, fruits/vegetables, baked goods, candy, nuts,
confections, popcorn, ice cream, items not made on the premises)
Beer, Wine, and Liquor Stores (4453): establishments primarily engaged in retailing
packaged alcoholic beverages, such as ale, beer, wine, and liquor.
Health & Personal Care Stores (4461): establishments primarily engaged in retailing
health and personal care products (pharmacies/drug stores, first aid, beauty products,
household supplies, candy, prepackaged snacks, optical goods, vitamins/supplements).
Clothing stores (4481): men’s and boys’ clothing stores; women’s and girls’ clothing
stores; children’s and infants’ clothing stores; family clothing stores; clothing accessories
stores.
Shoe Stores (4482): Shoes (men’s, women’s, child/infant, athletic)
Jewelry Stores (4483): Jewelry, luggage, and leather goods (silverware, watches, clocks,
handbags, briefcases, belts, gloves)
Sporting Goods Stores (4511): establishments primarily engaged in retailing new sporting
goods (fitness equipment, bikes, camping, uniforms, foot-wear)
Book & Music Stores (4512): establishments primarily engaged in retailing new books,
newspapers, magazines, and prerecorded audio and video media.
Department Stores (4521): establishments known as department stores primarily
engaged in retailing a wide range of the following new products with no one merchandise
line predominating: apparel; furniture; appliances and home furnishings; and selected
additional items, such as paint, hardware, toiletries, cosmetics, photographic equipment,

Downtown Kalamazoo, Michigan Retail Market Study 39. Gibbs Planning Group, Inc. 25 May 2017
jewelry, toys, and sporting goods. Merchandise lines are normally arranged in separate
departments.
General Merchandise Stores (4529): establishments primarily engaged in retailing new
goods in general merchandise stores (except department stores) (warehouse clubs,
supercenters, apparel, auto parts, dry goods, hardware, groceries, housewares, no line
predominating).
Florists (4531): establishments known as florists primarily engaged in retailing cut
flowers, floral arrangements, and potted plants purchased from others. These
establishments usually prepare the arrangements they sell.
Office Supplies & Gift Stores (4532): establishments primarily engaged in one or more of
the following: (1) retailing new stationery, school supplies, and office supplies; (2) retailing
a combination of new office equipment, furniture, and supplies; (3) retailing new office
equipment, furniture, and supplies in combination with retailing new computers; and (4)
retailing new gifts, novelty merchandise, souvenirs, greeting cards, seasonal and holiday
decorations, and curios.
Miscellaneous Retailers (4539): establishments primarily engaged in retailing new
miscellaneous specialty store merchandise (except motor vehicle and parts dealers;
furniture and home furnishings stores; consumer-type electronics and appliance stores;
building material and garden equipment and supplies dealers; food and beverage stores;
health and personal care stores; gasoline stations; clothing and clothing accessories
stores; sporting goods, hobby, book, and music stores; general merchandise stores;
florists; office supplies, stationery, and gift stores; and used merchandise stores). Pet
supplies, art dealers, manufactured home dealers, tobacco/cigar stores,
Restaurants
Full-Service Restaurants (7221): establishments primarily engaged in providing food
services to patrons who order and are served while seated (i.e., waiter/waitress service)
and pay after eating. Establishments that provide these types of food services to patrons
with any combination of other services, such as carryout services are classified in this
industry.
Limited-Service Restaurants (7222): establishments primarily engaged in providing food
services where patrons generally order or select items and pay before eating. Most
establishments do not have waiter/waitress service, but some provide limited service,
such as cooking to order (i.e., per special request), bringing food to seated customers, or
providing off-site delivery (cafeterias, snack/ juice bar, ice cream/soft serve shops, cookie
shops, popcorn shops, donut shops, coffee shops, bagel shops)
Special Food Services (7223): establishments primarily engaged in providing:
(1) one of the following food services; (2) a location designated by the customer; or
(3) from motorized vehicles or nonmotorized carts.
- Food Service Contractors: Establishments may be engaged in providing food
services at institutional, governmental, commercial, or industrial locations of
others based (cafeteria, restaurant, and fast food eating-place) on contractual

40. Downtown Kalamazoo, Michigan Retail Market Study Gibbs Planning Group, Inc. 25 May 2017
arrangements with these types of organizations for a specified period of time.
The food services contractor always provides management staff.
- Caterers: providing single event-based food services. These establishments generally
have equipment and vehicles to transport meals and snacks to events and/or prepare
food at an off-premise site. Banquet halls with catering staff are included in this
industry. Examples of events catered by establishments in this industry are graduation
parties, wedding receptions, business or retirement luncheons, and trade shows.
- Mobile Food Services: establishments primarily engaged in preparing and serving
meals and snacks for immediate consumption from motorized vehicles or non-
motorized carts. The establishment is the central location from which the caterer route
is serviced, not each vehicle, or cart. Included in this industry are establishments
primarily engaged in providing food services from vehicles, such as a hot dog cart and
ice cream truck.
Shopping Center Definitions This study utilizes the shopping centers typologies defined by the International Council of
Shopping Centers (ICSC) as follows:
• Convenience Centers: Convenience centers are 30,000 sf or less, unanchored, and
generally will service a trade area of up to one mile. These centers include banking,
carryout foods, florists, mail centers, small restaurants, small food markets, and
professional services such as real estate and financial consulting. The centers typically
include six to eight businesses.
• Neighborhood Centers: Neighborhood centers are anchored with a full-sized
supermarket and typically range from 60,000 to 100,000 sf. They service a trade area
of two to three miles and can include apparel, banks, carryout food, hardware, mail
centers, restaurants, sporting goods, and professional services such as financial
consulting and real estate.
• Community Centers: Community centers typically range from 150,000 to 300,000 sf
and are almost always anchored with a full-sized department store. They also include
junior anchor retailers selling books, crafts, shoes, and sporting goods. Community
centers often include large home improvement stores and medium-sized discount
apparel stores. Their service area is typically five to seven miles in suburban
locations.
• Lifestyle Centers: Lifestyle centers average 150,000 to 200,000 sf and feature
popular apparel, book, and home furnishing stores, as well as cinemas and a wide
selection of themed restaurants. The centers are frequently planned as walkable
areas with main streets. Recently, lifestyle centers have included large anchors such
as department stores, public libraries, and supermarkets. These centers typically
have a trade area of four to six miles when developed in suburban settings. Lifestyle
centers that include civic, employment, and residential buildings along with the retail
land use are defined as ‘town centers.’
• Regional Centers: Regional centers average trade areas of eight to 12 miles
and are anchored with multiple department stores. The centers can range from
800,000 to 1,500,000 sf, and often include cinemas along with 200,000 sf of
national brand fashion.

Downtown Kalamazoo, Michigan Retail Market Study 41. Gibbs Planning Group, Inc. 25 May 2017
Rationale
The rationale for the findings in this study follows:
• Advantageous population and income growth: Downtown Kalamazoo is located in a
growing area represented by annual population growth of 0.63 percent and average
household income growth of 2.9 percent. These base economic characteristics contrast
many other regions of Michigan and create a favorable environment for new commercial
development.
• Major institutions and employment centers: Downtown Kalamazoo is within two miles of
a robust population of over 25,000 students. College-aged consumers crave urban living,
shopping and entertainment and are a largely untapped market for downtown. Luring
them to the study area with relevant retail and entertainment could greatly expand the
sales capture of existing and future tenants. Similarly, major employers such as Bronson
Hospital, Western Michigan University, Pfizer Corporation and the Stryker Corporation
serve as economic drivers for the region and downtown. High-wage earning workers
generate significant expenditure for retailers before, during and after the workday.
• Underserved trade area: The households in the primary trade area are currently
underserved by existing retailers represented by the $51.6 million in sales that could be
captured by Downtown Kalamazoo. National trends demonstrate a resurgence in the
demand for urban, mixed-use and walkable communities to live and shop. With
continuing residential development in the study area, the opportunity to expand the
depth and variety of the shopping district will be strong.
• Tourism and Events: As the urban hub of southwestern Michigan, residents throughout
the region view Downtown Kalamazoo as a frequent destination for shopping, dining and
entertainment venues not otherwise offered in smaller towns and villages. Additionally,
exceptionally well-known craft breweries serve as anchors for the community and draw
enthusiasts from throughout the Midwest. Lastly, popular events hosted in the downtown
extend the variety of reasons area that shoppers find for heading downtown. These
conditions combine to represent a robust and varied consumer base familiar with
Kalamazoo and could be enticed to more frequently visits or lengthen existing visits to
downtown and increase the overall commercial expenditure.
Limits of Study
The findings of this study represent GPG’s best estimates for the amounts and types of retail
projects that should be supportable in the study area. Every reasonable effort has been made to
ensure that the data contained in this study reflect the most accurate and timely information
possible and are believed to be reliable. This study is based on estimates, assumptions, and
other information developed by GPG independent research effort, general knowledge of the
industry, and consultations with the client and its representatives. This study is designed as
objective third party research and GPG does not recommend that any or all of the supportable
retail be developed in the study area.
No responsibility is assumed for inaccuracies in reporting by the client, its agent and
representatives or in any other data source used in preparing or presenting this study. This report
is based on information that was current as of May 25, 2017, and GPG has not undertaken any
update of its research effort since such date.

42. Downtown Kalamazoo, Michigan Retail Market Study Gibbs Planning Group, Inc. 25 May 2017
This report may contain prospective financial information, estimates, or opinions that represent
GPG’s view of reasonable expectations at a particular time, but such information, estimates, or
opinions are not offered as predictions or assurances that a particular level of income or profit will
be achieved, that particular events will occur, or that a particular price will be offered or accepted.
Actual results achieved during the period covered by our prospective financial analysis may vary
from those described in our report, and the variations may be material. Therefore, no warranty or
representation is made by GPG that any of the projected values or results contained in this study
will be achieved.
This study should not be the sole basis for programming, planning, designing, financing, or
development of any commercial center. This study is for the use of the City of Kalamazoo for
general planning purposes only, and is void for other site locations or developers.
-- END OF ANALYSIS --

Downtown Kalamazoo, Michigan Retail Market Study 43. Gibbs Planning Group, Inc. 25 May 2017
APPENDIX EXHIBIT A1: Primary Trade Area Community Profile
Data Note: Household population includes persons not residing in group quarters. Average Household Size is the household population divided by total households.
Persons in families include the householder and persons related to the householder by birth, marriage, or adoption. Per Capita Income represents the income received by all
persons aged 15 years and over divided by the total population.
S ource: U.S. Census Bureau, Census 2010 Summary File 1. Esri forecasts for 2016 and 2021 Esri converted Census 2000 data into 2010 geography.
2021 35.3
2016 34.3
Median Age
2010 33.4
2021 $29,193
Per Capita Income
2016 $26,629
2021 $176,826
Median Home Value
2016 $143,982
2021 $52,184
Median Household Income
2016 $45,512
Vacant Housing Units 8.7%
Renter Occupied Housing Units 36.5%
Owner Occupied Housing Units 54.8%
2021 Housing Units 108,099
Vacant Housing Units 8.8%
Renter Occupied Housing Units 36.3%
Owner Occupied Housing Units 54.9%
2016 Housing Units 104,906
Vacant Housing Units 8.4%
Renter Occupied Housing Units 35.3%
Owner Occupied Housing Units 56.4%
2010 Housing Units 101,762
Vacant Housing Units 5.7%
Renter Occupied Housing Units 34.1%
Owner Occupied Housing Units 60.3%
Housing Unit Summary
2000 Housing Units 91,934
2016-2021 Annual Rate 0.47%
2021 Average Family Size 3.01
2021 Families 56,321
2016 Average Family Size 3.00
2016 Families 55,025
2010 Average Family Size 2.99
2010 Families 54,419
2016-2021 Annual Rate 0.62%
2021 Average Household Size 2.39
2021 Households 98,700
2016 Average Household Size 2.39
2016 Households 95,700
2010 Average Household Size 2.38
2010 Households 93,247
2000 Average Household Size 2.41
Household Summary
2000 Households 86,713
Residents 121,040
Workers 131,447
2016 Total Daytime Population 252,487
2016-2021 Annual Rate 0.63%
2021 Total Population 244,861
2016 Group Quarters 8,592
2016 Total Population 237,299
2010 Total Population 230,628
Community ProfileGibbs Planning Group
Population Summary
2000 Total Population 220,235
PTA Prepared by Gibbs Planning Group
Area: 308.4 square miles

44. Downtown Kalamazoo, Michigan Retail Market Study Gibbs Planning Group, Inc. 25 May 2017
APPENDIX EXHIBIT A2: Primary Trade Area Community Profile
Data Note: Income represents the preceding year, expressed in current dollars. Household income includes wage and salary earnings, interest dividends, net rents,
pensions, SSI and welfare payments, child support, and alimony.
S ource: U.S. Census Bureau, Census 2010 Summary File 1. Esri forecasts for 2016 and 2021 Esri converted Census 2000 data into 2010 geography.
Average Home Value $207,534
$1,000,000 + 0.4%
$750,000 - $999,999 0.9%
$500,000 - $749,999 3.9%
$400,000 - $499,999 4.3%
$300,000 - $399,999 6.3%
$250,000 - $299,999 7.8%
$200,000 - $249,999 15.6%
$150,000 - $199,999 23.1%
$100,000 - $149,999 14.4%
$50,000 - $99,999 15.0%
<$50,000 8.2%
2021 Owner Occupied Housing Units by Value
Total 59,277
Average Home Value $183,208
$1,000,000 + 0.5%
$750,000 - $999,999 0.7%
$500,000 - $749,999 3.4%
$400,000 - $499,999 3.9%
$300,000 - $399,999 5.7%
$250,000 - $299,999 5.3%
$200,000 - $249,999 10.2%
$150,000 - $199,999 17.9%
$100,000 - $149,999 20.8%
$50,000 - $99,999 19.4%
<$50,000 12.3%
2016 Owner Occupied Housing Units by Value
Total 57,576
Average Household Income $70,836
$200,000+ 4.3%
$150,000 - $199,999 4.4%
$100,000 - $149,999 12.6%
$75,000 - $99,999 12.5%
$50,000 - $74,999 18.6%
$35,000 - $49,999 8.5%
$25,000 - $34,999 11.4%
$15,000 - $24,999 11.6%
<$15,000 16.2%
2021 Households by Income
Household Income Base 98,700
Average Household Income $64,393
$200,000+ 3.8%
$150,000 - $199,999 3.5%
$100,000 - $149,999 10.9%
$75,000 - $99,999 11.2%
$50,000 - $74,999 17.3%
$35,000 - $49,999 13.6%
$25,000 - $34,999 11.4%
$15,000 - $24,999 12.2%
<$15,000 16.1%
Household Income Base 95,700
2016 Households by Income
Area: 308.4 square miles
PTA Prepared by Gibbs Planning Group
Community ProfileGibbs Planning Group

Downtown Kalamazoo, Michigan Retail Market Study 45. Gibbs Planning Group, Inc. 25 May 2017
APPENDIX EXHIBIT A3: Primary Trade Area Community Profile
Females 124,990
2021 Population by Sex
Males 119,871
Females 121,311
2016 Population by Sex
Males 115,988
Females 118,161
2010 Population by Sex
Males 112,467
18 + 79.2%
85 + 2.2%
75 - 84 4.7%
65 - 74 9.4%
55 - 64 11.6%
45 - 54 11.0%
35 - 44 11.4%
25 - 34 13.6%
15 - 24 18.8%
10 - 14 5.8%
5 - 9 5.6%
0 - 4 5.9%
2021 Population by Age
Total 244,859
18 + 78.7%
85 + 2.2%
75 - 84 4.1%
65 - 74 7.9%
55 - 64 11.9%
45 - 54 11.8%
35 - 44 11.3%
25 - 34 13.6%
15 - 24 19.6%
10 - 14 5.9%
5 - 9 5.8%
0 - 4 6.0%
2016 Population by Age
Total 237,298
18 + 77.4%
85 + 2.0%
75 - 84 4.0%
65 - 74 6.2%
55 - 64 11.1%
45 - 54 13.0%
35 - 44 11.7%
25 - 34 13.6%
15 - 24 19.5%
10 - 14 6.3%
5 - 9 6.2%
0 - 4 6.4%
Total 230,626
2010 Population by Age
Area: 308.4 square miles
PTA Prepared by Gibbs Planning Group
Community ProfileGibbs Planning Group

46. Downtown Kalamazoo, Michigan Retail Market Study Gibbs Planning Group, Inc. 25 May 2017
APPENDIX EXHIBIT A4: Primary Trade Area Community Profile
Data Note: Persons of Hispanic Origin may be of any race. The Diversity Index measures the probability that two people from the same area will be from different
race/ethnic groups.
S ource: U.S. Census Bureau, Census 2010 Summary File 1. Esri forecasts for 2016 and 2021 Esri converted Census 2000 data into 2010 geography.
Noninstitutionalized Population 2.9%
Institutionalized Population 0.8%
In Group Quarters 3.7%
In Nonfamily Households 23.5%
Nonrelative 2.4%
Other relative 2.4%
Child 27.5%
Spouse 16.9%
Householder 23.6%
In Family Households 72.8%
In Households 96.3%
2010 Population by Relationship and Household Type
Total 230,628
Diversity Index 46.2
Hispanic Origin 6.4%
Two or More Races 4.5%
Some Other Race Alone 2.3%
Pacific Islander Alone 0.1%
Asian Alone 3.2%
American Indian Alone 0.4%
Black Alone 12.5%
White Alone 77.1%
2021 Population by Race/Ethnicity
Total 244,863
Diversity Index 42.9
Hispanic Origin 5.3%
Two or More Races 4.0%
Some Other Race Alone 2.0%
Pacific Islander Alone 0.1%
Asian Alone 2.8%
American Indian Alone 0.4%
Black Alone 12.1%
White Alone 78.7%
2016 Population by Race/Ethnicity
Total 237,300
Diversity Index 39.2
Hispanic Origin 4.2%
Two or More Races 3.5%
Some Other Race Alone 1.6%
Pacific Islander Alone 0.0%
Asian Alone 2.2%
American Indian Alone 0.4%
Black Alone 11.8%
White Alone 80.4%
2010 Population by Race/Ethnicity
Total 230,628
PTA Prepared by Gibbs Planning Group
Area: 308.4 square miles
Community ProfileGibbs Planning Group

Downtown Kalamazoo, Michigan Retail Market Study 47. Gibbs Planning Group, Inc. 25 May 2017
APPENDIX EXHIBIT A5: Primary Trade Area Community Profile
S ource: U.S. Census Bureau, Census 2010 Summary File 1. Esri forecasts for 2016 and 2021 Esri converted Census 2000 data into 2010 geography.
Rural Population 12.4%
Population Inside Urbanized Cluster 2.6%
Population Inside Urbanized Area 85.0%
2010 Population By Urban/ Rural Status
Total Population 230,628
Transportation/Material Moving 5.6%
Production 7.6%
Installation/Maintenance/Repair 2.7%
Construction/Extraction 3.3%
Farming/Forestry/Fishing 0.5%
Blue Collar 19.7%
Services 19.6%
Administrative Support 12.3%
Sales 10.5%
Professional 23.9%
Management/Business/Financial 14.0%
White Collar 60.7%
2016 Employed Population 16+ by Occupation
Total 118,459
Public Administration 2.6%
Services 51.5%
Finance/Insurance/Real Estate 5.6%
Information 1.1%
Transportation/Utilities 2.7%
Retail Trade 11.5%
Wholesale Trade 2.3%
Manufacturing 18.1%
Construction 3.6%
Agriculture/Mining 1.1%
2016 Employed Population 16+ by Industry
Total 118,458
Civilian Unemployed 6.4%
2016 Civilian Population 16+ in Labor Force
Civilian Employed 93.6%
Divorced 11.6%
Widowed 4.9%
Married 43.3%
Never Married 40.2%
2016 Population 15+ by Marital Status
Total 195,331
Graduate/Professional Degree 14.6%
Bachelor's Degree 22.0%
Associate Degree 9.9%
Some College, No Degree 24.0%
GED/Alternative Credential 3.3%
High School Graduate 19.3%
9th - 12th Grade, No Diploma 4.8%
Less than 9th Grade 2.0%
Total 148,887
2016 Population 25+ by Educational Attainment
Area: 308.4 square miles
PTA Prepared by Gibbs Planning Group
Community ProfileGibbs Planning Group

48. Downtown Kalamazoo, Michigan Retail Market Study Gibbs Planning Group, Inc. 25 May 2017
APPENDIX EXHIBIT A6: Primary Trade Area Community Profile
Data Note: Households with children include any households with people under age 18, related or not. Multigenerational households are families with 3 or more parent-
child relationships. Unmarried partner households are usually classif ied as nonfamily households unless there is another member of the household related to the
householder. Multigenerational and unmarried partner households are reported only to the tract level. Esri estimated block group data, which is used to estimate polygons
or non-standard geography.
S ource: U.S. Census Bureau, Census 2010 Summary File 1. Esri forecasts for 2016 and 2021 Esri converted Census 2000 data into 2010 geography.
Rural Housing Units 11.5%
Housing Units Inside Urbanized Cluster 2.6%
Housing Units Inside Urbanized Area 85.9%
2010 Housing Units By Urban/ Rural Status
Total Housing Units 101,762
Renter Occupied 38.5%
Owned Free and Clear 18.0%
Owned with a Mortgage/Loan 43.5%
Owner Occupied 61.5%
2010 Households by Tenure and Mortgage Status
Total 93,247
7 + Person Household 1.1%
6 Person Household 1.9%
5 Person Household 5.3%
4 Person Household 12.1%
3 Person Household 14.8%
2 Person Household 34.2%
1 Person Household 30.6%
2010 Households by Size
Total 93,247
Same-sex 0.7%
Male-female 6.9%
Unmarried Partner Households 7.6%
Multigenerational Households 2.3%
All Households with Children 29.2%
Nonfamily Households 11.0%
With Related Children 8.6%
Other Family with Female Householder 12.3%
With Related Children 2.5%
Other Family with Male Householder 4.2%
Other Family (No Spouse Present) 16.5%
With Related Children 17.7%
Husband-wife Families 41.9%
Family Households 58.4%
Households with 2+ People 69.4%
Households with 1 Person 30.6%
2010 Households by Type
Total 93,247
PTA Prepared by Gibbs Planning Group
Area: 308.4 square miles
Community ProfileGibbs Planning Group
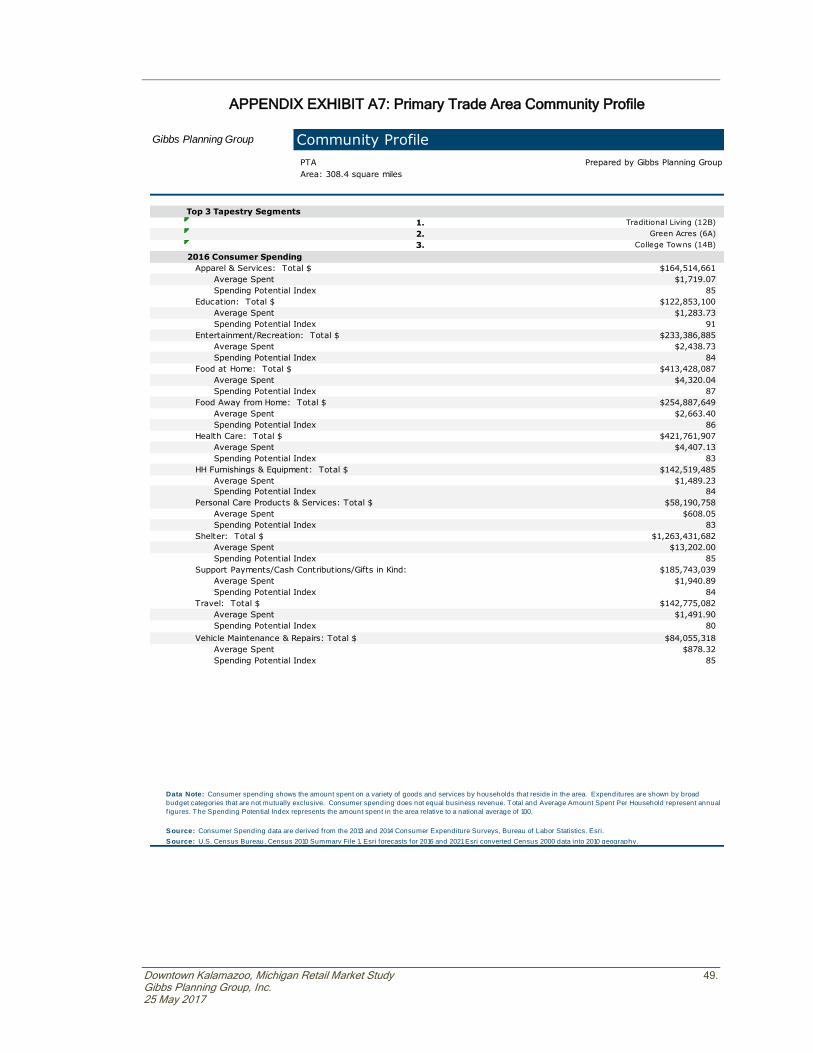
Downtown Kalamazoo, Michigan Retail Market Study 49. Gibbs Planning Group, Inc. 25 May 2017
APPENDIX EXHIBIT A7: Primary Trade Area Community Profile
Data Note: Consumer spending shows the amount spent on a variety of goods and services by households that reside in the area. Expenditures are shown by broad
budget categories that are not mutually exclusive. Consumer spending does not equal business revenue. Total and Average Amount Spent Per Household represent annual
f igures. The Spending Potential Index represents the amount spent in the area relative to a national average of 100.
S ource: Consumer Spending data are derived from the 2013 and 2014 Consumer Expenditure Surveys, Bureau of Labor Statistics. Esri.
S ource: U.S. Census Bureau, Census 2010 Summary File 1. Esri forecasts for 2016 and 2021 Esri converted Census 2000 data into 2010 geography.
Spending Potential Index 85
Average Spent $878.32
Vehicle Maintenance & Repairs: Total $ $84,055,318
Spending Potential Index 80
Average Spent $1,491.90
Travel: Total $ $142,775,082
Spending Potential Index 84
Average Spent $1,940.89
Support Payments/Cash Contributions/Gifts in Kind: $185,743,039
Spending Potential Index 85
Average Spent $13,202.00
Shelter: Total $ $1,263,431,682
Spending Potential Index 83
Average Spent $608.05
Personal Care Products & Services: Total $ $58,190,758
Spending Potential Index 84
Average Spent $1,489.23
HH Furnishings & Equipment: Total $ $142,519,485
Spending Potential Index 83
Average Spent $4,407.13
Health Care: Total $ $421,761,907
Spending Potential Index 86
Average Spent $2,663.40
Food Away from Home: Total $ $254,887,649
Spending Potential Index 87
Average Spent $4,320.04
Food at Home: Total $ $413,428,087
Spending Potential Index 84
Average Spent $2,438.73
Entertainment/Recreation: Total $ $233,386,885
Spending Potential Index 91
Average Spent $1,283.73
Education: Total $ $122,853,100
Spending Potential Index 85
Average Spent $1,719.07
2016 Consumer Spending
Apparel & Services: Total $ $164,514,661
3. College Towns (14B)
2. Green Acres (6A)
1. Traditional Living (12B)
Top 3 Tapestry Segments
Area: 308.4 square miles
PTA Prepared by Gibbs Planning Group
Community ProfileGibbs Planning Group

50. Downtown Kalamazoo, Michigan Retail Market Study Gibbs Planning Group, Inc. 25 May 2017
APPENDIX EXHIBIT B1: Total Trade Area Community Profile
Data Note: Household population includes persons not residing in group quarters. Average Household Size is the household population divided by total households.
Persons in families include the householder and persons related to the householder by birth, marriage, or adoption. Per Capita Income represents the income received by all
persons aged 15 years and over divided by the total population.
S ource: U.S. Census Bureau, Census 2010 Summary File 1. Esri forecasts for 2016 and 2021 Esri converted Census 2000 data into 2010 geography.
2021 39.3
2016 38.4
Median Age
2010 37.4
2021 $27,594
Per Capita Income
2016 $25,095
2021 $169,750
Median Home Value
2016 $133,449
2021 $52,010
Median Household Income
2016 $45,818
Vacant Housing Units 14.0%
Renter Occupied Housing Units 27.6%
Owner Occupied Housing Units 58.4%
2021 Housing Units 285,207
Vacant Housing Units 13.9%
Renter Occupied Housing Units 27.6%
Owner Occupied Housing Units 58.5%
2016 Housing Units 279,938
Vacant Housing Units 13.4%
Renter Occupied Housing Units 26.7%
Owner Occupied Housing Units 59.8%
2010 Housing Units 274,317
Vacant Housing Units 10.2%
Renter Occupied Housing Units 25.8%
Owner Occupied Housing Units 64.0%
Housing Unit Summary
2000 Housing Units 254,796
2016-2021 Annual Rate 0.22%
2021 Average Family Size 3.01
2021 Families 154,837
2016 Average Family Size 3.01
2016 Families 153,132
2010 Average Family Size 3.00
2010 Families 152,851
2016-2021 Annual Rate 0.36%
2021 Average Household Size 2.46
2021 Households 245,233
2016 Average Household Size 2.46
2016 Households 240,894
2010 Average Household Size 2.46
2010 Households 237,434
2000 Average Household Size 2.50
Household Summary
2000 Households 228,830
Residents 325,092
Workers 287,526
2016 Total Daytime Population 612,618
2016-2021 Annual Rate 0.35%
2021 Total Population 618,666
2016 Group Quarters 14,536
2016 Total Population 607,964
2010 Total Population 599,406
Community ProfileGibbs Planning Group
Population Summary
2000 Total Population 592,521
TTA Prepared by Gibbs Planning Group
Area: 2,667.29 square miles

Downtown Kalamazoo, Michigan Retail Market Study 51. Gibbs Planning Group, Inc. 25 May 2017
APPENDIX EXHIBIT B2: Total Trade Area Community Profile
Data Note: Income represents the preceding year, expressed in current dollars. Household income includes wage and salary earnings, interest dividends, net rents,
pensions, SSI and welfare payments, child support, and alimony.
S ource: U.S. Census Bureau, Census 2010 Summary File 1. Esri forecasts for 2016 and 2021 Esri converted Census 2000 data into 2010 geography.
Average Home Value $202,098
$1,000,000 + 0.5%
$750,000 - $999,999 0.8%
$500,000 - $749,999 4.0%
$400,000 - $499,999 3.4%
$300,000 - $399,999 7.4%
$250,000 - $299,999 7.9%
$200,000 - $249,999 13.5%
$150,000 - $199,999 20.6%
$100,000 - $149,999 15.1%
$50,000 - $99,999 17.1%
<$50,000 9.7%
2021 Owner Occupied Housing Units by Value
Total 166,435
Average Home Value $174,980
$1,000,000 + 0.6%
$750,000 - $999,999 0.6%
$500,000 - $749,999 3.3%
$400,000 - $499,999 2.9%
$300,000 - $399,999 6.2%
$250,000 - $299,999 5.1%
$200,000 - $249,999 9.0%
$150,000 - $199,999 15.8%
$100,000 - $149,999 19.7%
$50,000 - $99,999 22.5%
<$50,000 14.3%
2016 Owner Occupied Housing Units by Value
Total 163,680
Average Household Income $68,375
$200,000+ 3.4%
$150,000 - $199,999 4.0%
$100,000 - $149,999 12.5%
$75,000 - $99,999 13.3%
$50,000 - $74,999 19.2%
$35,000 - $49,999 9.1%
$25,000 - $34,999 11.9%
$15,000 - $24,999 11.8%
<$15,000 14.9%
2021 Households by Income
Household Income Base 245,233
Average Household Income $62,077
$200,000+ 2.9%
$150,000 - $199,999 3.1%
$100,000 - $149,999 10.5%
$75,000 - $99,999 11.8%
$50,000 - $74,999 18.5%
$35,000 - $49,999 14.6%
$25,000 - $34,999 11.7%
$15,000 - $24,999 12.1%
<$15,000 14.7%
Household Income Base 240,894
2016 Households by Income
Area: 2,667.29 square miles
TTA Prepared by Gibbs Planning Group
Community ProfileGibbs Planning Group

52. Downtown Kalamazoo, Michigan Retail Market Study Gibbs Planning Group, Inc. 25 May 2017
APPENDIX EXHIBIT B3: Total Trade Area Community Profile
S ource: U.S. Census Bureau, Census 2010 Summary File 1. Esri forecasts for 2016 and 2021 Esri converted Census 2000 data into 2010 geography.
Females 313,446
2021 Population by Sex
Males 305,220
Females 308,792
2016 Population by Sex
Males 299,171
Females 305,115
2010 Population by Sex
Males 294,291
18 + 78.3%
85 + 2.1%
75 - 84 5.3%
65 - 74 10.8%
55 - 64 13.4%
45 - 54 11.8%
35 - 44 11.6%
25 - 34 12.5%
15 - 24 14.5%
10 - 14 6.2%
5 - 9 5.9%
0 - 4 5.9%
2021 Population by Age
Total 618,668
18 + 77.8%
85 + 2.1%
75 - 84 4.5%
65 - 74 9.2%
55 - 64 13.6%
45 - 54 13.0%
35 - 44 11.6%
25 - 34 12.4%
15 - 24 15.2%
10 - 14 6.3%
5 - 9 6.1%
0 - 4 6.0%
2016 Population by Age
Total 607,962
18 + 76.1%
85 + 2.0%
75 - 84 4.4%
65 - 74 7.3%
55 - 64 12.5%
45 - 54 14.6%
35 - 44 12.2%
25 - 34 12.2%
15 - 24 15.3%
10 - 14 6.8%
5 - 9 6.5%
0 - 4 6.4%
Total 599,404
2010 Population by Age
Area: 2,667.29 square miles
TTA Prepared by Gibbs Planning Group
Community ProfileGibbs Planning Group
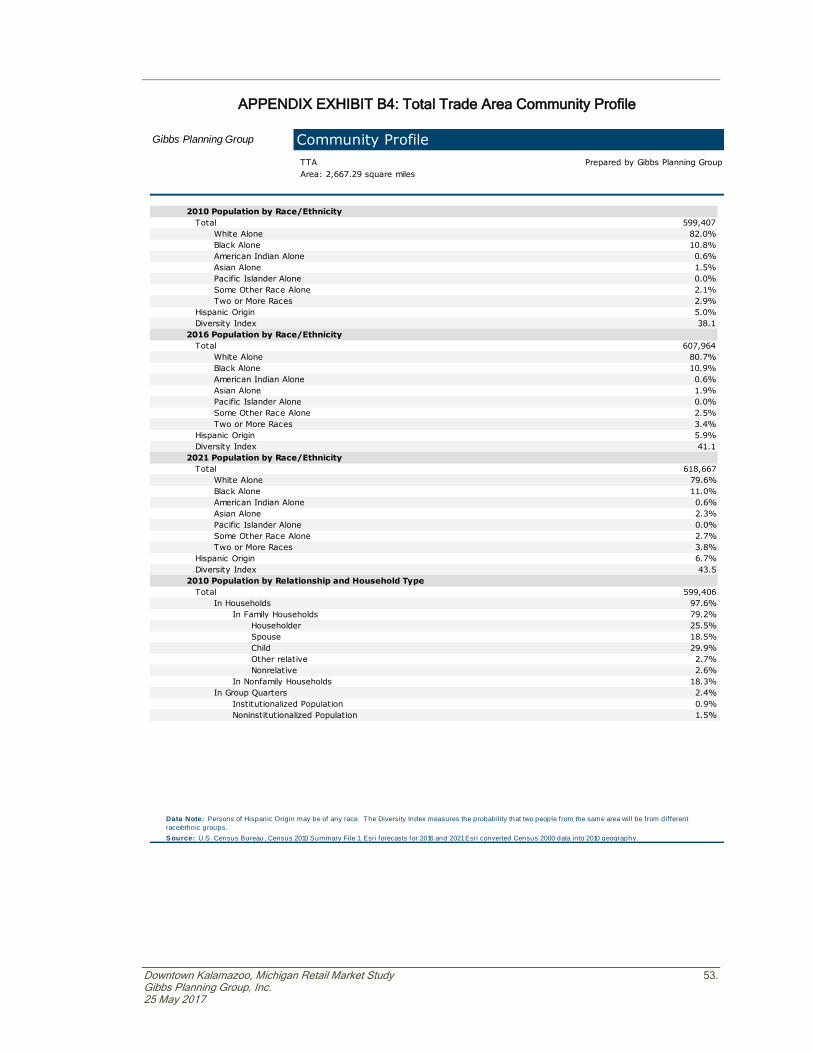
Downtown Kalamazoo, Michigan Retail Market Study 53. Gibbs Planning Group, Inc. 25 May 2017
APPENDIX EXHIBIT B4: Total Trade Area Community Profile
Data Note: Persons of Hispanic Origin may be of any race. The Diversity Index measures the probability that two people from the same area will be from different
race/ethnic groups.
S ource: U.S. Census Bureau, Census 2010 Summary File 1. Esri forecasts for 2016 and 2021 Esri converted Census 2000 data into 2010 geography.
Noninstitutionalized Population 1.5%
Institutionalized Population 0.9%
In Group Quarters 2.4%
In Nonfamily Households 18.3%
Nonrelative 2.6%
Other relative 2.7%
Child 29.9%
Spouse 18.5%
Householder 25.5%
In Family Households 79.2%
In Households 97.6%
2010 Population by Relationship and Household Type
Total 599,406
Diversity Index 43.5
Hispanic Origin 6.7%
Two or More Races 3.8%
Some Other Race Alone 2.7%
Pacific Islander Alone 0.0%
Asian Alone 2.3%
American Indian Alone 0.6%
Black Alone 11.0%
White Alone 79.6%
2021 Population by Race/Ethnicity
Total 618,667
Diversity Index 41.1
Hispanic Origin 5.9%
Two or More Races 3.4%
Some Other Race Alone 2.5%
Pacific Islander Alone 0.0%
Asian Alone 1.9%
American Indian Alone 0.6%
Black Alone 10.9%
White Alone 80.7%
2016 Population by Race/Ethnicity
Total 607,964
Diversity Index 38.1
Hispanic Origin 5.0%
Two or More Races 2.9%
Some Other Race Alone 2.1%
Pacific Islander Alone 0.0%
Asian Alone 1.5%
American Indian Alone 0.6%
Black Alone 10.8%
White Alone 82.0%
2010 Population by Race/Ethnicity
Total 599,407
TTA Prepared by Gibbs Planning Group
Area: 2,667.29 square miles
Community ProfileGibbs Planning Group

54. Downtown Kalamazoo, Michigan Retail Market Study Gibbs Planning Group, Inc. 25 May 2017
APPENDIX EXHIBIT B5: Total Trade Area Community Profile
S ource: U.S. Census Bureau, Census 2010 Summary File 1. Esri forecasts for 2016 and 2021 Esri converted Census 2000 data into 2010 geography.
Rural Population 34.1%
Population Inside Urbanized Cluster 10.2%
Population Inside Urbanized Area 55.8%
2010 Population By Urban/ Rural Status
Total Population 599,406
Transportation/Material Moving 6.4%
Production 11.0%
Installation/Maintenance/Repair 3.5%
Construction/Extraction 4.5%
Farming/Forestry/Fishing 1.4%
Blue Collar 26.8%
Services 18.6%
Administrative Support 12.3%
Sales 9.6%
Professional 20.1%
Management/Business/Financial 12.6%
White Collar 54.7%
2016 Employed Population 16+ by Occupation
Total 286,688
Public Administration 3.2%
Services 45.6%
Finance/Insurance/Real Estate 4.6%
Information 1.0%
Transportation/Utilities 3.6%
Retail Trade 10.8%
Wholesale Trade 2.2%
Manufacturing 22.0%
Construction 4.6%
Agriculture/Mining 2.3%
2016 Employed Population 16+ by Industry
Total 286,690
Civilian Unemployed 6.1%
2016 Civilian Population 16+ in Labor Force
Civilian Employed 93.9%
Divorced 12.7%
Widowed 5.8%
Married 48.1%
Never Married 33.4%
2016 Population 15+ by Marital Status
Total 496,114
Graduate/Professional Degree 10.2%
Bachelor's Degree 16.5%
Associate Degree 9.6%
Some College, No Degree 24.4%
GED/Alternative Credential 4.4%
High School Graduate 25.5%
9th - 12th Grade, No Diploma 6.2%
Less than 9th Grade 3.1%
Total 403,469
2016 Population 25+ by Educational Attainment
Area: 2,667.29 square miles
TTA Prepared by Gibbs Planning Group
Community ProfileGibbs Planning Group
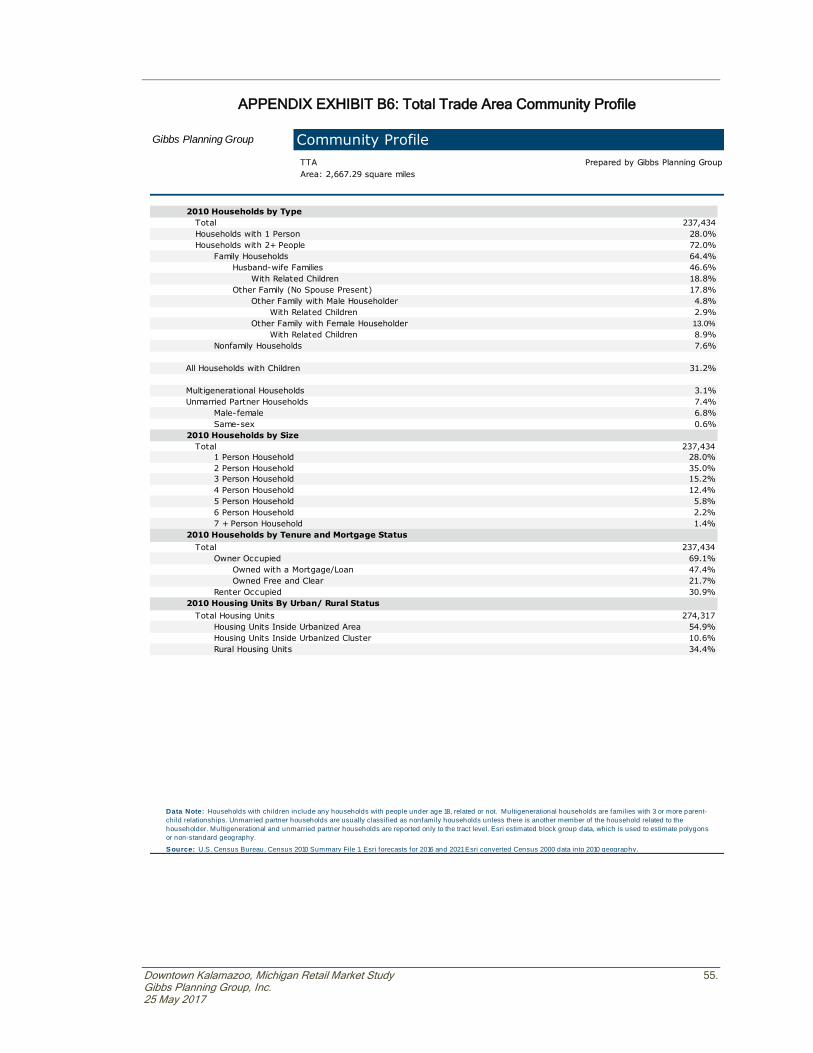
Downtown Kalamazoo, Michigan Retail Market Study 55. Gibbs Planning Group, Inc. 25 May 2017
APPENDIX EXHIBIT B6: Total Trade Area Community Profile
Data Note: Households with children include any households with people under age 18, related or not. Multigenerational households are families with 3 or more parent-
child relationships. Unmarried partner households are usually classif ied as nonfamily households unless there is another member of the household related to the
householder. Multigenerational and unmarried partner households are reported only to the tract level. Esri estimated block group data, which is used to estimate polygons
or non-standard geography.
S ource: U.S. Census Bureau, Census 2010 Summary File 1. Esri forecasts for 2016 and 2021 Esri converted Census 2000 data into 2010 geography.
Rural Housing Units 34.4%
Housing Units Inside Urbanized Cluster 10.6%
Housing Units Inside Urbanized Area 54.9%
2010 Housing Units By Urban/ Rural Status
Total Housing Units 274,317
Renter Occupied 30.9%
Owned Free and Clear 21.7%
Owned with a Mortgage/Loan 47.4%
Owner Occupied 69.1%
2010 Households by Tenure and Mortgage Status
Total 237,434
7 + Person Household 1.4%
6 Person Household 2.2%
5 Person Household 5.8%
4 Person Household 12.4%
3 Person Household 15.2%
2 Person Household 35.0%
1 Person Household 28.0%
2010 Households by Size
Total 237,434
Same-sex 0.6%
Male-female 6.8%
Unmarried Partner Households 7.4%
Multigenerational Households 3.1%
All Households with Children 31.2%
Nonfamily Households 7.6%
With Related Children 8.9%
Other Family with Female Householder 13.0%
With Related Children 2.9%
Other Family with Male Householder 4.8%
Other Family (No Spouse Present) 17.8%
With Related Children 18.8%
Husband-wife Families 46.6%
Family Households 64.4%
Households with 2+ People 72.0%
Households with 1 Person 28.0%
2010 Households by Type
Total 237,434
TTA Prepared by Gibbs Planning Group
Area: 2,667.29 square miles
Community ProfileGibbs Planning Group

56. Downtown Kalamazoo, Michigan Retail Market Study Gibbs Planning Group, Inc. 25 May 2017
APPENDIX EXHIBIT B7: Total Trade Area Community Profile
Data Note: Consumer spending shows the amount spent on a variety of goods and services by households that reside in the area. Expenditures are shown by broad
budget categories that are not mutually exclusive. Consumer spending does not equal business revenue. Total and Average Amount Spent Per Household represent annual
f igures. The Spending Potential Index represents the amount spent in the area relative to a national average of 100.
S ource: Consumer Spending data are derived from the 2013 and 2014 Consumer Expenditure Surveys, Bureau of Labor Statistics. Esri.
S ource: U.S. Census Bureau, Census 2010 Summary File 1. Esri forecasts for 2016 and 2021 Esri converted Census 2000 data into 2010 geography.
Spending Potential Index 83
Average Spent $862.57
Vehicle Maintenance & Repairs: Total $ $207,788,120
Spending Potential Index 77
Average Spent $1,440.60
Travel: Total $ $347,032,707
Spending Potential Index 83
Average Spent $1,933.36
Support Payments/Cash Contributions/Gifts in Kind: $465,734,798
Spending Potential Index 79
Average Spent $12,261.17
Shelter: Total $ $2,953,642,327
Spending Potential Index 80
Average Spent $586.80
Personal Care Products & Services: Total $ $141,357,231
Spending Potential Index 81
Average Spent $1,432.65
HH Furnishings & Equipment: Total $ $345,116,797
Spending Potential Index 84
Average Spent $4,475.20
Health Care: Total $ $1,078,049,437
Spending Potential Index 81
Average Spent $2,517.91
Food Away from Home: Total $ $606,550,058
Spending Potential Index 84
Average Spent $4,193.30
Food at Home: Total $ $1,010,141,102
Spending Potential Index 82
Average Spent $2,378.62
Entertainment/Recreation: Total $ $572,996,394
Spending Potential Index 79
Average Spent $1,121.89
Education: Total $ $270,257,758
Spending Potential Index 80
Average Spent $1,615.02
2016 Consumer Spending
Apparel & Services: Total $ $389,047,818
3. Green Acres (6A)
2. Traditional Living (12B)
1. Salt of the Earth (6B)
Top 3 Tapestry Segments
Area: 2,667.29 square miles
TTA Prepared by Gibbs Planning Group
Community ProfileGibbs Planning Group

Downtown Kalamazoo, Michigan Retail Market Study 57. Gibbs Planning Group, Inc. 25 May 2017
APPENDIX EXHIBIT C1: Primary Trade Area Business Profile
Data
for a
ll b
usin
esses in a
rea
PTA
Pre
pare
d b
y G
ibbs P
lannin
g G
roup
Are
a:
308.4
square
mile
s
Busin
ess S
um
mary
Gib
bs P
lannin
g G
roup
237,2
99
Em
plo
yee/R
esid
ential Popula
tion R
atio:
0.6
7:1
Tota
l Resid
ential Popula
tion:
9,9
31
Tota
l Em
plo
yees:
158,5
63
Tota
l Busin
esses:
Em
plo
yees
by S
IC C
odes
Num
ber
Perc
ent
Num
ber
Perc
ent
Busin
esses 2.7
%2,0
53
1.3
%
Constr
uction
699
7.0
%6,1
17
3.9
%
271
Agriculture
& M
inin
g
3.8
%16,7
30
10.6
%
Tra
nsport
ation
225
2.3
%3,8
75
2.4
%
378
Manufa
ctu
ring
0.9
%1,0
74
0.7
%
Utility
18
0.2
%391
0.2
%
86
Com
munic
ation
3.7
%10,9
78
6.9
%372
Whole
sale
Tra
de
20.4
%32,0
57
20.2
%
Hom
e I
mpro
vem
ent
133
1.3
%1,6
56
1.0
%
2,0
30
Reta
il T
rade S
um
mary
0.6
%3,2
72
2.1
%
Food S
tore
s181
1.8
%4,8
59
3.1
%
63
Genera
l M
erc
handis
e S
tore
s
2.6
%2,8
89
1.8
%
Appare
l &
Accessory
Sto
res
121
1.2
%1,1
73
0.7
%
258
Auto
Deale
rs, G
as S
tations, Auto
Aft
erm
ark
et
1.7
%1,5
21
1.0
%
Eating &
Drinkin
g P
laces
572
5.8
%11,8
33
7.5
%
169
Furn
iture
& H
om
e F
urn
ishin
gs
5.4
%4,8
54
3.1
%533
Mis
cellaneous R
eta
il
13.2
%16,3
62
10.3
%
Banks, Savin
gs &
Lendin
g I
nstitu
tions
537
5.4
%1,5
28
1.0
%
1,3
09
Fin
ance, In
sura
nce, Real Esta
te S
um
mary
1.4
%1,1
08
0.7
%
Insura
nce C
arr
iers
& A
gents
178
1.8
%1,6
06
1.0
%
135
Securities B
rokers
4.6
%12,1
20
7.6
%459
Real Esta
te, H
old
ing, O
ther
Investm
ent
Offic
es
40.1
%62,6
94
39.5
%
Hote
ls &
Lodgin
g56
0.6
%1,3
98
0.9
%
3,9
84
Serv
ices S
um
mary
2.6
%1,6
98
1.1
%
Motion P
ictu
res &
Am
usem
ents
287
2.9
%2,7
97
1.8
%
262
Auto
motive S
erv
ices
6.8
%15,4
95
9.8
%
Legal Serv
ices
175
1.8
%1,1
07
0.7
%
673
Health S
erv
ices
2.2
%16,8
18
10.6
%
Oth
er
Serv
ices
2,3
11
23.3
%23,3
81
14.7
%
221
Education I
nstitu
tions &
Lib
raries
Govern
ment
278
2.8
%5,8
25
3.7
%
Uncla
ssifie
d E
sta
blishm
ents
281
2.8
%406
0.3
%
So
urc
e:
Cop
yri
gh
t 2016
In
fog
rou
p, In
c. A
ll r
igh
ts r
eserv
ed
. E
sri
Tota
l R
esid
en
tial P
op
ula
tion
fore
casts
for
2016
.
Da
te N
ote
: D
ata
on
th
e B
usin
ess S
um
mary
rep
ort
is c
alc
ula
ted
usin
g
Es
ri’s
Da
ta a
llo
ca
tio
n
wh
ich
uses c
en
su
s b
lock g
rou
ps to a
llocate
bu
sin
ess s
um
mary
data
to c
usto
m a
reas.
Tota
ls9,9
31
100.0
%158,5
63
100.0
%

58. Downtown Kalamazoo, Michigan Retail Market Study Gibbs Planning Group, Inc. 25 May 2017
APPENDIX EXHIBIT C2: Primary Trade Area Business Profile
Busin
ess S
um
mary
Gib
bs P
lannin
g G
roup
Busin
esses
Em
plo
yees
PTA
Pre
pare
d b
y G
ibbs P
lannin
g G
roup
Are
a:
308.4
square
mile
s
Perc
ent
Num
ber
Perc
ent
Agriculture
, Fore
str
y, Fis
hin
g &
Hunting
70
0.7
%714
0.5
%
Num
ber
by N
AIC
S C
odes
0.0
%110
0.1
%
Utilities
90.1
%229
0.1
%
4M
inin
g
7.6
%6,9
50
4.4
%
Manufa
ctu
ring
395
4.0
%16,6
00
10.5
%
754
Constr
uction
3.7
%10,9
59
6.9
%
Reta
il T
rade
1,4
15
14.2
%19,7
57
12.5
%
366
Whole
sale
Tra
de
1.9
%2,6
13
1.6
%
Furn
iture
& H
om
e F
urn
ishin
gs S
tore
s74
0.7
%799
0.5
%
188
Moto
r Vehic
le &
Part
s D
eale
rs
0.8
%655
0.4
%
Bld
g M
ate
rial &
Gard
en E
quip
ment
& S
upplies
Deale
rs
132
1.3
%1,6
57
1.0
%
77
Ele
ctr
onic
s &
Appliance S
tore
s
1.6
%4,4
96
2.8
%
Health &
Pers
onal C
are
Sto
res
139
1.4
%1,8
47
1.2
%
160
Food &
Bevera
ge S
tore
s
0.7
%277
0.2
%
Clo
thin
g &
Clo
thin
g A
ccessories S
tore
s161
1.6
%1,3
64
0.9
%
70
Gasoline S
tations
1.1
%1,2
71
0.8
%
Genera
l M
erc
handis
e S
tore
s63
0.6
%3,2
72
2.1
%
113
Sport
Goods, H
obby, Book, &
Music
Sto
res
2.1
%1,3
97
0.9
%
Nonsto
re R
eta
ilers
25
0.3
%110
0.1
%
213
Mis
cellaneous S
tore
Reta
ilers
1.5
%3,2
02
2.0
%
Info
rmation
187
1.9
%2,2
25
1.4
%
150
Tra
nsport
ation &
Ware
housin
g
8.6
%4,2
64
2.7
%
Centr
al Bank/C
redit I
nte
rmedia
tion &
Rela
ted
Activitie
s
542
5.5
%1,5
40
1.0
%
859
Fin
ance &
Insura
nce
1.4
%1,1
18
0.7
%
Insura
nce C
arr
iers
& R
ela
ted A
ctivitie
s;
Funds, Tru
sts
& O
ther
Fin
ancia
l Vehic
les
178
1.8
%1,6
06
1.0
%
139
Securities, C
om
modity C
ontr
acts
& O
ther
Fin
ancia
l
Investm
ents
& O
ther
Rela
ted A
ctivitie
s
5.8
%12,3
25
7.8
%
Pro
fessio
nal, S
cie
ntific &
Tech S
erv
ices
886
8.9
%6,7
96
4.3
%
573
Real Esta
te, Renta
l &
Leasin
g
1.9
%1,2
44
0.8
%
Managem
ent
of C
om
panie
s &
Ente
rprises
50.1
%232
0.1
%
189
Legal Serv
ices
4.3
%4,4
64
2.8
%
Educational Serv
ices
260
2.6
%16,8
79
10.6
%
424
Adm
inis
trative &
Support
& W
aste
Managem
ent
&
Rem
edia
tion S
erv
ices
9.8
%22,2
48
14.0
%
Art
s, Ente
rtain
ment
& R
ecre
ation
211
2.1
%2,4
59
1.6
%
976
Health C
are
& S
ocia
l Assis
tance
6.5
%13,4
02
8.5
%
Accom
modation
56
0.6
%1,3
98
0.9
%
641
Accom
modation &
Food S
erv
ices
5.9
%12,0
04
7.6
%
Oth
er
Serv
ices (
except
Public A
dm
inis
tration)
1,1
85
11.9
%8,4
47
5.3
%
585
Food S
erv
ices &
Drinkin
g P
laces
2.0
%1,0
30
0.6
%
Public A
dm
inis
tration
281
2.8
%5,8
96
3.7
%
194
Auto
motive R
epair &
Main
tenance
Uncla
ssifie
d E
sta
blishm
ents
281
2.8
%406
0.3
%
Tota
l9,9
31
100.0
%158,5
63
100.0
%
So
urc
e:
Cop
yri
gh
t 2016
In
fog
rou
p, In
c. A
ll r
igh
ts r
eserv
ed
. E
sri
Tota
l R
esid
en
tial P
op
ula
tion
fore
casts
for
2016
.
Da
te N
ote
: D
ata
on
th
e B
usin
ess S
um
mary
rep
ort
is c
alc
ula
ted
usin
g
Es
ri’s
Da
ta a
llo
ca
tio
n
wh
ich
uses c
en
su
s b
lock g
rou
ps to a
llocate
bu
sin
ess s
um
mary
data
to c
usto
m a
reas.

Downtown Kalamazoo, Michigan Retail Market Study 59. Gibbs Planning Group, Inc. 25 May 2017
APPENDIX EXHIBIT D1: Total Trade Area Business Profile
Data
for a
ll b
usin
esses in a
rea
TTA
Pre
pare
d b
y G
ibbs P
lannin
g G
roup
Are
a:
2,6
67.2
9 s
quare
mile
s
Busin
ess S
um
mary
Gib
bs P
lannin
g G
roup
607,9
64
Em
plo
yee/R
esid
ential Popula
tion R
atio:
0.5
6:1
Tota
l Resid
ential Popula
tion:
24,1
75
Tota
l Em
plo
yees:
337,4
85
Tota
l Busin
esses:
Em
plo
yees
by S
IC C
odes
Num
ber
Perc
ent
Num
ber
Perc
ent
Busin
esses 3.5
%6,0
87
1.8
%
Constr
uction
1,8
84
7.8
%11,9
36
3.5
%
838
Agriculture
& M
inin
g
4.1
%46,0
82
13.7
%
Tra
nsport
ation
639
2.6
%8,6
03
2.5
%
998
Manufa
ctu
ring
0.8
%2,2
25
0.7
%
Utility
70
0.3
%1,4
16
0.4
%
188
Com
munic
ation
3.6
%19,8
93
5.9
%867
Whole
sale
Tra
de
19.9
%66,1
25
19.6
%
Hom
e I
mpro
vem
ent
379
1.6
%3,8
84
1.2
%
4,8
00
Reta
il T
rade S
um
mary
0.7
%7,0
41
2.1
%
Food S
tore
s485
2.0
%10,8
85
3.2
%
181
Genera
l M
erc
handis
e S
tore
s
2.8
%7,0
44
2.1
%
Appare
l &
Accessory
Sto
res
232
1.0
%1,7
16
0.5
%
683
Auto
Deale
rs, G
as S
tations, Auto
Aft
erm
ark
et
1.4
%2,5
55
0.8
%
Eating &
Drinkin
g P
laces
1,2
65
5.2
%22,1
37
6.6
%
336
Furn
iture
& H
om
e F
urn
ishin
gs
5.1
%10,8
62
3.2
%1,2
40
Mis
cellaneous R
eta
il
11.5
%21,4
88
6.4
%
Banks, Savin
gs &
Lendin
g I
nstitu
tions
1,2
18
5.0
%3,3
95
1.0
%
2,7
91
Fin
ance, In
sura
nce, Real Esta
te S
um
mary
1.0
%1,4
20
0.4
%
Insura
nce C
arr
iers
& A
gents
407
1.7
%2,5
01
0.7
%
230
Securities B
rokers
3.9
%14,1
72
4.2
%937
Real Esta
te, H
old
ing, O
ther
Investm
ent
Offic
es
38.9
%133,7
13
39.6
%
Hote
ls &
Lodgin
g234
1.0
%3,9
37
1.2
%
9,4
12
Serv
ices S
um
mary
2.9
%3,3
46
1.0
%
Motion P
ictu
res &
Am
usem
ents
619
2.6
%9,1
84
2.7
%
695
Auto
motive S
erv
ices
5.9
%32,5
60
9.6
%
Legal Serv
ices
314
1.3
%1,7
26
0.5
%
1,4
24
Health S
erv
ices
2.8
%31,7
40
9.4
%
Oth
er
Serv
ices
5,4
44
22.5
%51,2
19
15.2
%
683
Education I
nstitu
tions &
Lib
raries
Govern
ment
1,0
85
4.5
%19,3
17
5.7
%
Uncla
ssifie
d E
sta
blishm
ents
602
2.5
%599
0.2
%
So
urc
e:
Cop
yri
gh
t 2016
In
fog
rou
p, In
c. A
ll r
igh
ts r
eserv
ed
. E
sri
Tota
l R
esid
en
tial P
op
ula
tion
fore
casts
for
2016
.
Da
te N
ote
: D
ata
on
th
e B
usin
ess S
um
mary
rep
ort
is c
alc
ula
ted
usin
g
Es
ri’s
Da
ta a
llo
ca
tio
n
wh
ich
uses c
en
su
s b
lock g
rou
ps to a
llocate
bu
sin
ess s
um
mary
data
to c
usto
m a
reas.
Tota
ls24,1
75
100.0
%337,4
85
100.0
%

60. Downtown Kalamazoo, Michigan Retail Market Study Gibbs Planning Group, Inc. 25 May 2017
APPENDIX EXHIBIT D2: Total Trade Area Business Profile
Busin
ess S
um
mary
Gib
bs P
lannin
g G
roup
Busin
esses
Em
plo
yees
TTA
Pre
pare
d b
y G
ibbs P
lannin
g G
roup
Are
a:
2,6
67.2
9 s
quare
mile
s
Perc
ent
Num
ber
Perc
ent
Agriculture
, Fore
str
y, Fis
hin
g &
Hunting
342
1.4
%3,4
00
1.0
%
Num
ber
by N
AIC
S C
odes
0.1
%151
0.0
%
Utilities
40
0.2
%1,0
38
0.3
%
15
Min
ing
8.3
%13,1
60
3.9
%
Manufa
ctu
ring
1,0
39
4.3
%45,6
63
13.5
%
2,0
06
Constr
uction
3.5
%19,8
52
5.9
%
Reta
il T
rade
3,4
36
14.2
%43,1
86
12.8
%
853
Whole
sale
Tra
de
2.0
%5,6
10
1.7
%
Furn
iture
& H
om
e F
urn
ishin
gs S
tore
s143
0.6
%1,2
10
0.4
%
472
Moto
r Vehic
le &
Part
s D
eale
rs
0.6
%1,2
82
0.4
%
Bld
g M
ate
rial &
Gard
en E
quip
ment
& S
upplies
Deale
rs
370
1.5
%3,8
56
1.1
%
157
Ele
ctr
onic
s &
Appliance S
tore
s
1.9
%10,2
87
3.0
%
Health &
Pers
onal C
are
Sto
res
301
1.2
%5,2
36
1.6
%
448
Food &
Bevera
ge S
tore
s
0.9
%1,4
34
0.4
%
Clo
thin
g &
Clo
thin
g A
ccessories S
tore
s298
1.2
%2,0
09
0.6
%
211
Gasoline S
tations
1.1
%1,9
59
0.6
%
Genera
l M
erc
handis
e S
tore
s181
0.7
%7,0
41
2.1
%
254
Sport
Goods, H
obby, Book, &
Music
Sto
res
2.2
%2,8
96
0.9
%
Nonsto
re R
eta
ilers
67
0.3
%365
0.1
%
535
Mis
cellaneous S
tore
Reta
ilers
1.8
%7,0
13
2.1
%
Info
rmation
418
1.7
%4,7
85
1.4
%
443
Tra
nsport
ation &
Ware
housin
g
7.8
%7,3
78
2.2
%
Centr
al Bank/C
redit I
nte
rmedia
tion &
Rela
ted
Activitie
s
1,2
30
5.1
%3,4
24
1.0
%
1,8
77
Fin
ance &
Insura
nce
1.0
%1,4
53
0.4
%
Insura
nce C
arr
iers
& R
ela
ted A
ctivitie
s;
Funds, Tru
sts
& O
ther
Fin
ancia
l Vehic
les
407
1.7
%2,5
01
0.7
%
240
Securities, C
om
modity C
ontr
acts
& O
ther
Fin
ancia
l
Investm
ents
& O
ther
Rela
ted A
ctivitie
s
4.9
%16,6
28
4.9
%
Pro
fessio
nal, S
cie
ntific &
Tech S
erv
ices
1,7
07
7.1
%11,6
05
3.4
%
1,1
93
Real Esta
te, Renta
l &
Leasin
g
1.5
%1,9
75
0.6
%
Managem
ent
of C
om
panie
s &
Ente
rprises
13
0.1
%325
0.1
%
351
Legal Serv
ices
4.0
%9,1
59
2.7
%
Educational Serv
ices
732
3.0
%31,6
91
9.4
%
976
Adm
inis
trative &
Support
& W
aste
Managem
ent
&
Rem
edia
tion S
erv
ices
8.9
%44,6
45
13.2
%
Art
s, Ente
rtain
ment
& R
ecre
ation
512
2.1
%8,8
96
2.6
%
2,1
52
Health C
are
& S
ocia
l Assis
tance
6.3
%26,3
23
7.8
%
Accom
modation
234
1.0
%3,9
37
1.2
%
1,5
19
Accom
modation &
Food S
erv
ices
5.3
%22,3
86
6.6
%
Oth
er
Serv
ices (
except
Public A
dm
inis
tration)
3,2
08
13.3
%22,5
34
6.7
%
1,2
86
Food S
erv
ices &
Drinkin
g P
laces
2.2
%2,2
91
0.7
%
Public A
dm
inis
tration
1,0
92
4.5
%19,4
52
5.8
%
541
Auto
motive R
epair &
Main
tenance
Uncla
ssifie
d E
sta
blishm
ents
602
2.5
%599
0.2
%
Tota
l24,1
75
100.0
%337,4
85
100.0
%
So
urc
e:
Cop
yri
gh
t 2016
In
fog
rou
p, In
c. A
ll r
igh
ts r
eserv
ed
. E
sri
Tota
l R
esid
en
tial P
op
ula
tion
fore
casts
for
2016
.
Da
te N
ote
: D
ata
on
th
e B
usin
ess S
um
mary
rep
ort
is c
alc
ula
ted
usin
g
Es
ri’s
Da
ta a
llo
ca
tio
n
wh
ich
uses c
en
su
s b
lock g
rou
ps to a
llocate
bu
sin
ess s
um
mary
data
to c
usto
m a
reas.

Downtown Kalamazoo, Michigan Retail Market Study 61. Gibbs Planning Group, Inc. 25 May 2017
APPENDIX EXHIBIT E1: Tapestry Segmentation Area Profile
Area: 308.4 square miles
PTA Prepared by Gibbs Planning Group
Page 1 of 6
Tapestry Segmentation Area Profile
©2016 Esri
April 25, 2017
Data Note: This report identif ies neighborhood segments in the area, and describes the socioeconomic quality of the immediate neighborhood. The index is a comparison
of the percent of households or Total Population 18+ in the area, by Tapestry segment, to the percent of households or Total Population 18+ in the United States, by segment.
An index of 100 is the US average.
S ource: Esri
40.6% 225Total 91.3%
11.1%Subtotal 8.5%
2.8% 40.4% 4220 Soccer Moms (4A) 1.2% 91.1%
3.0% 37.6% 5119 Savvy Suburbanites (1D) 1.5% 89.9%
0.9% 34.6% 20818 City Commons (11E) 1.9% 88.4%
1.9% 33.7% 10017 Exurbanites (1E) 1.9% 86.5%
2.5% 31.8% 8116 Midlife Constants (5E) 2.0% 84.6%
9.0%Subtotal 15.2%
2.2% 29.3% 11515 Bright Young Professionals (8C) 2.6% 82.6%
1.4% 27.1% 20014 Set to Impress (11D) 2.8% 80.0%
1.2% 25.7% 23813 Hardscrabble Road (8G) 2.9% 77.2%
2.5% 24.5% 12212 Comfortable Empty Nesters (5A) 3.0% 74.3%
1.7% 22.0% 22911 Young and Restless (11B) 3.9% 71.3%
11.5%Subtotal 22.2%
1.2% 20.3% 32810 Retirement Communities (9E) 4.0% 67.4%
2.8% 19.1% 1449 Middleburg (4C) 4.1% 63.4%
2.9% 16.3% 1528 Salt of the Earth (6B) 4.4% 59.3%
2.3% 13.4% 2007 In Style (5B) 4.5% 54.9%
2.3% 11.1% 2266 Old and Newcomers (8F) 5.2% 50.4%
8.8%Subtotal 45.2%
0.5% 8.8% 1,0355 Dorms to Diplomas (14C) 5.2% 45.2%
2.2% 8.3% 3304 Rustbelt Traditions (5D) 7.3% 40.0%
0.9% 6.1% 9603 College Towns (14B) 9.1% 32.7%
3.2% 5.2% 3392 Green Acres (6A) 10.8% 23.6%
2.0% 2.0% 6561 Traditional Living (12B) 12.8% 12.8%
Percent Percent IndexRank Tapestry Segment Percent Percent
2016 U.S. Households
Cumulativ Cumulativ
2016 Households
Tapestry Segmentation Area ProfileGibbs Planning Group
Gibbs Planning Group
Top Twenty Tapestry
PTA Prepared by Gibbs Planning Group
Area: 308.4 square miles
Site
U.S.
Top Ten Tapestry Segments Site vs. U.S.Top Ten Tapestry Segments Site vs. U.S.
Traditional Living (12B)
Green Acres (6A)
College Towns (14B)
Rustbelt Traditions (5D)
Dorms to Diplomas (14C)
Old and Newcomers (8F)
In Style (5B)
Salt of the Earth (6B)
Middleburg (4C)
Retirement Communities (9E)
Percent of Households by Tapestry Segment
121086420
2016 Tapestry Indexes by Households2016 Tapestry Indexes by Households
Tapestr
y S
egm
ents
1A
1C
1E
2B
2D
3B
4A
4C
5B
5D
6A
6C
6E
7A
7C
7E
8A
8C
8E
8G
9B
9D
9F
10B
10D
11A
11C
11E
12B
12D
13B
13D
14A
14C
Index
1,0008006004002000
2016 Tapestry Indexes by Total Population 18+2016 Tapestry Indexes by Total Population 18+
Tapestr
y S
egm
ents
1A
1C
1E
2B
2D
3B
4A
4C
5B
5D
6A
6C
6E
7A
7C
7E
8A
8C
8E
8G
9B
9D
9F
10B
10D
11A
11C
11E
12B
12D
13B
13D
14A
14C
Index
8007006005004003002001000

62. Downtown Kalamazoo, Michigan Retail Market Study Gibbs Planning Group, Inc. 25 May 2017
APPENDIX EXHIBIT E2: Tapestry Segmentation Area Profile
Data Note: This report identif ies neighborhood segments in the area, and describes the socioeconomic quality of the immediate neighborhood. The index is a comparison
of the percent of households or Total Population 18+ in the area, by Tapestry segment, to the percent of households or Total Population 18+ in the United States, by segment.
An index of 100 is the US average.
S ource: Esri
Area: 308.4 square miles
PTA Prepared by Gibbs Planning Group
Tapestry Segmentation Area ProfileGibbs Planning Group
2016 Tapestry Indexes by Households2016 Tapestry Indexes by Households
Tapestr
y S
egm
ents
1A
1C
1E
2B
2D
3B
4A
4C
5B
5D
6A
6C
6E
7A
7C
7E
8A
8C
8E
8G
9B
9D
9F
10B
10D
11A
11C
11E
12B
12D
13B
13D
14A
14C
Index
1,0008006004002000
2016 Tapestry Indexes by Total Population 18+2016 Tapestry Indexes by Total Population 18+
Tapestr
y S
egm
ents
1A
1C
1E
2B
2D
3B
4A
4C
5B
5D
6A
6C
6E
7A
7C
7E
8A
8C
8E
8G
9B
9D
9F
10B
10D
11A
11C
11E
12B
12D
13B
13D
14A
14C
Index
8007006005004003002001000

Downtown Kalamazoo, Michigan Retail Market Study 63. Gibbs Planning Group, Inc. 25 May 2017
APPENDIX EXHIBIT E3: Tapestry Segmentation Area Profile
Data Note: This report identif ies neighborhood segments in the area, and describes the socioeconomic quality of the immediate neighborhood. The index is a comparison
of the percent of households or Total Population 18+ in the area, by Tapestry segment, to the percent of households or Total Population 18+ in the United States, by segment.
An index of 100 is the US average.
S ource: Esri
0.0% 0
Southwestern Families (7F) 0 0.0% 0 0 0.0% 0
Valley Growers (7E) 0 0.0% 0 0
0.0% 0
Barrios Urbanos (7D) 0 0.0% 0 0 0.0% 0
American Dreamers (7C) 0 0.0% 0 0
0.0% 0
Urban Villages (7B) 0 0.0% 0 0 0.0% 0
Up and Coming Families (7A) 0 0.0% 0 0
7. Ethnic Enclaves 0 0.0% 0 0 0.0% 0
0.0% 0
Heartland Communities (6F) 829 0.9% 37 1,549 0.8% 38
Rural Resort Dwellers (6E) 0 0.0% 0 0
0.0% 0
Prairie Living (6D) 0 0.0% 0 0 0.0% 0
The Great Outdoors (6C) 0 0.0% 0 0
11.4% 347
Salt of the Earth (6B) 4,225 4.4% 152 8,782 4.7% 161
Green Acres (6A) 10,370 10.8% 339 21,371
6. Cozy Country Living 15,424 16.1% 133 31,702 17.0% 142
7.1% 342
Midlife Constants (5E) 1,941 2.0% 81 3,766 2.0% 85
Rustbelt Traditions (5D) 7,018 7.3% 330 13,356
4.2% 198
Parks and Rec (5C) 0 0.0% 0 0 0.0% 0
In Style (5B) 4,310 4.5% 200 7,769
16.3% 148
Comfortable Empty Nesters 2,880 3.0% 122 5,626 3.0% 122
5. GenXurban 16,149 16.9% 147 30,517
4.0% 141Middleburg (4C) 3,895 4.1% 144 7,438
1.3% 44
Home Improvement (4B) 0 0.0% 0 0 0.0% 0
Soccer Moms (4A) 1,156 1.2% 42 2,474
4. Family Landscapes 5,051 5.3% 71 9,912 5.3% 69
0.0% 0
Trendsetters (3C) 0 0.0% 0 0 0.0% 0
Metro Renters (3B) 0 0.0% 0 0
0.0% 0
Laptops and Lattes (3A) 0 0.0% 0 0 0.0% 0
3. Uptown Individuals 0 0.0% 0 0
0.0% 0Enterprising Professionals 0 0.0% 0 0
0.0% 0
Pacific Heights (2C) 0 0.0% 0 0 0.0% 0
Pleasantville (2B) 0 0.0% 0 0
0.0% 0
Urban Chic (2A) 0 0.0% 0 0 0.0% 0
2. Upscale Avenues 0 0.0% 0 0
2.0% 102Exurbanites (1E) 1,856 1.9% 100 3,709
0.0% 0
Savvy Suburbanites (1D) 1,464 1.5% 51 3,170 1.7% 53
Boomburbs (1C) 0 0.0% 0 0
0.0% 0
Professional Pride (1B) 990 1.0% 64 2,217 1.2% 67
Top Tier (1A) 0 0.0% 0 0
1. Affluent Estates 4,310 4.5% 46 9,096 4.9% 47
Percent Index
Total: 95,701 100.0% 186,836 100.0%
Number Percent Index Number
Tapestry LifeMode Groups 2016 Households 2016 Adult Population
Area: 308.4 square miles
PTA Prepared by Gibbs Planning Group
Tapestry Segmentation Area ProfileGibbs Planning Group

64. Downtown Kalamazoo, Michigan Retail Market Study Gibbs Planning Group, Inc. 25 May 2017
APPENDIX EXHIBIT E4: Tapestry Segmentation Area Profile
Data Note: This report identif ies neighborhood segments in the area, and describes the socioeconomic quality of the immediate neighborhood. The index is a comparison
of the percent of households or Total Population 18+ in the area, by Tapestry segment, to the percent of households or Total Population 18+ in the United States, by segment.
An index of 100 is the US average.
S ource: Esri
Unclassified (15) 0 0.0% 0 161 0.1% 39
9.0% 873
Dorms to Diplomas (14C) 5,022 5.2% 1,035 15,199 8.1% 824
College Towns (14B) 8,671 9.1% 960 16,800
17.1% 748
Military Proximity (14A) 0 0.0% 0 0 0.0% 0
14. Scholars and Patriots 13,693 14.3% 893 31,999
0.0% 0High Rise Renters (13E) 0 0.0% 0 0
0.0% 0
Fresh Ambitions (13D) 0 0.0% 0 0 0.0% 0
NeWest Residents (13C) 0 0.0% 0 0
0.0% 0
Las Casas (13B) 0 0.0% 0 0 0.0% 0
International Marketplace 0 0.0% 0 0
13. Next Wave 0 0.0% 0 0 0.0% 0
1.2% 68
Modest Income Homes (12D) 969 1.0% 76 1,765 0.9% 73
Small Town Simplicity (12C) 1,142 1.2% 63 2,179
0.0% 0
Traditional Living (12B) 12,282 12.8% 656 23,399 12.5% 687
Family Foundations (12A) 0 0.0% 0 0
12. Hometown 14,393 15.0% 240 27,343 14.6% 247
2.5% 209
City Commons (11E) 1,791 1.9% 208 3,076 1.6% 203
Set to Impress (11D) 2,667 2.8% 200 4,661
3.2% 234
Metro Fusion (11C) 1,042 1.1% 77 1,634 0.9% 67
Young and Restless (11B) 3,753 3.9% 229 6,007
8.2% 150
City Strivers (11A) 0 0.0% 0 0 0.0% 0
11. Midtown Singles 9,253 9.7% 156 15,378
0.0% 0Rural Bypasses (10E) 0 0.0% 0 0
0.0% 0
Down the Road (10D) 876 0.9% 80 1,720 0.9% 80
Diners & Miners (10C) 0 0.0% 0 0
1.0% 31
Rooted Rural (10B) 0 0.0% 0 0 0.0% 0
Southern Satellites (10A) 1,019 1.1% 34 1,844
10. Rustic Outposts 1,895 2.0% 24 3,564 1.9% 23
3.4% 334
Social Security Set (9F) 803 0.8% 104 1,140 0.6% 91
Retirement Communities (9E) 3,812 4.0% 328 6,356
0.0% 0
Senior Escapes (9D) 0 0.0% 0 0 0.0% 0
The Elders (9C) 0 0.0% 0 0
0.0% 0
Golden Years (9B) 0 0.0% 0 0 0.0% 0
Silver & Gold (9A) 0 0.0% 0 0
9. Senior Styles 4,615 4.8% 84 7,496 4.0% 80
4.5% 223
Hardscrabble Road (8G) 2,807 2.9% 238 5,750 3.1% 261
Old and Newcomers (8F) 5,019 5.2% 226 8,397
0.0% 0
Front Porches (8E) 0 0.0% 0 0 0.0% 0
Downtown Melting Pot (8D) 0 0.0% 0 0
0.6% 46
Bright Young Professionals 2,444 2.6% 115 4,468 2.4% 119
Emerald City (8B) 648 0.7% 48 1,053
10.5% 103
City Lights (8A) 0 0.0% 0 0 0.0% 0
8. Middle Ground 10,918 11.4% 104 19,668
100.0%Total: 95,701 100.0% 186,836
Tapestry LifeMode Groups 2016 Households 2016 Adult Population
Number Percent Index Number Percent Index
PTA Prepared by Gibbs Planning Group
Area: 308.4 square miles
Tapestry Segmentation Area ProfileGibbs Planning Group

Downtown Kalamazoo, Michigan Retail Market Study 65. Gibbs Planning Group, Inc. 25 May 2017
APPENDIX EXHIBIT E5: Tapestry Segmentation Area Profile
Data Note: This report identif ies neighborhood segments in the area, and describes the socioeconomic quality of the immediate neighborhood. The index is a comparison
of the percent of households or Total Population 18+ in the area, by Tapestry segment, to the percent of households or Total Population 18+ in the United States, by segment.
An index of 100 is the US average.
S ource: Esri
16,800 9.0% 873
Dorms to Diplomas (14C) 5,022 5.2% 1,035 15,199 8.1% 824
College Towns (14B) 8,671 9.1% 960
3,076 1.6% 203
Traditional Living (12B) 12,282 12.8% 656 23,399 12.5% 687
City Commons (11E) 1,791 1.9% 208
6,007 3.2% 234
Set to Impress (11D) 2,667 2.8% 200 4,661 2.5% 209
Young and Restless (11B) 3,753 3.9% 229
6,356 3.4% 334
Social Security Set (9F) 803 0.8% 104 1,140 0.6% 91
Retirement Communities (9E) 3,812 4.0% 328
8,397 4.5% 223
Hardscrabble Road (8G) 2,807 2.9% 238 5,750 3.1% 261
Old and Newcomers (8F) 5,019 5.2% 226
1,053 0.6% 46
Front Porches (8E) 0 0.0% 0 0 0.0% 0
Emerald City (8B) 648 0.7% 48
99,607 53.3% 314
In Style (5B) 4,310 4.5% 200 7,769 4.2% 198
3. Metro Cities 51,585 53.9% 295
0 0.0% 0Las Casas (13B) 0 0.0% 0
1,765 0.9% 73
International Marketplace 0 0.0% 0 0 0.0% 0
Modest Income Homes (12D) 969 1.0% 76
1,634 0.9% 67
Family Foundations (12A) 0 0.0% 0 0 0.0% 0
Metro Fusion (11C) 1,042 1.1% 77
0 0.0% 0
Bright Young Professionals 2,444 2.6% 115 4,468 2.4% 119
City Lights (8A) 0 0.0% 0
0 0.0% 0
Southwestern Families (7F) 0 0.0% 0 0 0.0% 0
Barrios Urbanos (7D) 0 0.0% 0
0 0.0% 0
American Dreamers (7C) 0 0.0% 0 0 0.0% 0
Urban Villages (7B) 0 0.0% 0
0 0.0% 0
Rustbelt Traditions (5D) 7,018 7.3% 330 13,356 7.1% 342
Pacific Heights (2C) 0 0.0% 0
2. Urban Periphery 11,473 12.0% 71 21,223 11.4% 63
0 0.0% 0
High Rise Renters (13E) 0 0.0% 0 0 0.0% 0
Fresh Ambitions (13D) 0 0.0% 0
0 0.0% 0
NeWest Residents (13C) 0 0.0% 0 0 0.0% 0
City Strivers (11A) 0 0.0% 0
0 0.0% 0
Downtown Melting Pot (8D) 0 0.0% 0 0 0.0% 0
Trendsetters (3C) 0 0.0% 0
0 0.0% 0
Metro Renters (3B) 0 0.0% 0 0 0.0% 0
Laptops and Lattes (3A) 0 0.0% 0
1. Principal Urban Center 0 0.0% 0 0 0.0% 0
Number Percent Index
Total: 95,701 100.0% 186,836 100.0%
Number Percent Index
Tapestry Urbanization 2016 Households 2016 Adult Population
PTA Prepared by Gibbs Planning Group
Area: 308.4 square miles
Tapestry Segmentation Area ProfileGibbs Planning Group

66. Downtown Kalamazoo, Michigan Retail Market Study Gibbs Planning Group, Inc. 25 May 2017
APPENDIX EXHIBIT E6: Tapestry Segmentation Area Profile
Data Note: This report identif ies neighborhood segments in the area, and describes the socioeconomic quality of the immediate neighborhood. The index is a comparison
of the percent of households or Total Population 18+ in the area, by Tapestry segment, to the percent of households or Total Population 18+ in the United States, by segment.
An index of 100 is the US average.
S ource: Esri
Unclassified (15) 0 0.0% 0 161 0.1% 39
0 0% 0
Rural Bypasses (10E) 0 0.0% 0 0 0.0% 0
Diners & Miners (10C) 0 0.0% 0
1,844 1.0% 31
Rooted Rural (10B) 0 0.0% 0 0 0.0% 0
Southern Satellites (10A) 1,019 1.1% 34
0 0.0% 0
Rural Resort Dwellers (6E) 0 0.0% 0 0 0.0% 0
Prairie Living (6D) 0 0.0% 0
8,782 4.7% 161
The Great Outdoors (6C) 0 0.0% 0 0 0.0% 0
Salt of the Earth (6B) 4,225 4.4% 152
31,997 17.1% 101
Green Acres (6A) 10,370 10.8% 339 21,371 11.4% 347
6. Rural 15,614 16.3% 96
2,179 1.2% 68Small Town Simplicity (12C) 1,142 1.2% 63
0 0.0% 0
Down the Road (10D) 876 0.9% 80 1,720 0.9% 80
Senior Escapes (9D) 0 0.0% 0
1,549 0.8% 38
Valley Growers (7E) 0 0.0% 0 0 0.0% 0
Heartland Communities (6F) 829 0.9% 37
12,886 6.9% 76
Middleburg (4C) 3,895 4.1% 144 7,438 4.0% 141
5. Semirural 6,742 7.0% 75
0 0.0% 0Military Proximity (14A) 0 0.0% 0
0 0.0% 0
The Elders (9C) 0 0.0% 0 0 0.0% 0
Golden Years (9B) 0 0.0% 0
0 0.0% 0
Silver & Gold (9A) 0 0.0% 0 0 0.0% 0
Up and Coming Families (7A) 0 0.0% 0
0 0.0% 0
Midlife Constants (5E) 1,941 2.0% 81 3,766 2.0% 85
Parks and Rec (5C) 0 0.0% 0
0 0.0% 0
Comfortable Empty Nesters 2,880 3.0% 122 5,626 3.0% 122
Home Improvement (4B) 0 0.0% 0
0 0.0% 0
Soccer Moms (4A) 1,156 1.2% 42 2,474 1.3% 44
Enterprising Professionals (2D) 0 0.0% 0
0 0.0% 0
Pleasantville (2B) 0 0.0% 0 0 0.0% 0
Urban Chic (2A) 0 0.0% 0
3,170 1.7% 53
Exurbanites (1E) 1,856 1.9% 100 3,709 2.0% 102
Savvy Suburbanites (1D) 1,464 1.5% 51
2,217 1.2% 67
Boomburbs (1C) 0 0.0% 0 0 0.0% 0
Professional Pride (1B) 990 1.0% 64
20,962 11.2% 35
Top Tier (1A) 0 0.0% 0 0 0.0% 0
4. Suburban Periphery 10,287 10.7% 34
Number Percent Index
Total: 95,701 100.0% 186,836 100.0%
Number Percent Index
Tapestry Urbanization 2016 Households 2016 Adult Population
PTA Prepared by Gibbs Planning Group
Area: 308.4 square miles
Tapestry Segmentation Area ProfileGibbs Planning Group

Downtown Kalamazoo, Michigan Retail Market Study 67. Gibbs Planning Group, Inc. 25 May 2017
APPENDIX EXHIBIT F: 2017-2022 Annual Population Growth Rate Map
20
17
-20
22
Po
pu
lati
on
: A
nn
ua
l G
row
th R
ate
by C
en
su
s
Gro
up
s
Gib
bs P
lan
nin
g G
rou
p

68. Downtown Kalamazoo, Michigan Retail Market Study Gibbs Planning Group, Inc. 25 May 2017
APPENDIX EXHIBIT G: 2017 Median Household Income Map
Gib
bs P
lan
nin
g G
rou
p
20
17
Me
dia
n H
ou
se
ho
ld
Inc
om
e
by C
en
su
s G
rou
ps

Downtown Kalamazoo, Michigan Retail Market Study 69. Gibbs Planning Group, Inc. 25 May 2017
APPENDIX EXHIBIT H: 2022 Median Household Income Map
Gib
bs P
lan
nin
g G
rou
p
20
22
Me
dia
n H
ou
se
ho
ld
Inc
om
e
by C
en
su
s G
rou
ps

70. Downtown Kalamazoo, Michigan Retail Market Study Gibbs Planning Group, Inc. 25 May 2017
APPENDIX EXHIBIT H: 2017 Average Household Income Map
Gib
bs P
lan
nin
g G
rou
p
20
17
Ave
rag
e H
ou
se
ho
ld
Inc
om
e
by C
en
su
s G
rou
ps

Downtown Kalamazoo, Michigan Retail Market Study 71. Gibbs Planning Group, Inc. 25 May 2017
APPENDIX EXHIBIT H: 2022 Average Household Income Map
Gib
bs P
lan
nin
g G
rou
p
20
22
Ave
rag
e H
ou
se
ho
ld
Inc
om
e
by C
en
su
s G
rou
ps

72. Downtown Kalamazoo, Michigan Retail Market Study Gibbs Planning Group, Inc. 25 May 2017
APPENDIX EXHIBIT I: 2017 Total Employees
Gib
bs P
lan
nin
g G
rou
p
20
17
To
tal
Em
plo
ye
es
b
y B
loc
k G
rou
ps

Downtown Kalamazoo, Michigan Retail Market Study 73. Gibbs Planning Group, Inc. 25 May 2017
APPENDIX EXHIBIT J: 2017 Bachelor’s Degrees
Gib
bs P
lan
nin
g G
rou
p
20
17
Bac
he
lor’
s D
eg
ree
b
y C
en
su
s G
rou
ps

74. Downtown Kalamazoo, Michigan Retail Market Study Gibbs Planning Group, Inc. 25 May 2017
APPENDIX EXHIBIT K: CoStar


