- 1 - April 26, 2017 TECHNICAL MEMORANDUM Project: Downtown Off-Street Parking Study Subject: Supply and Occupancy Survey in June 2016 Date: April 26, 2017 Author: Marni C. Heffron, P.E., P.T.O.E. Julie A. Bussing This memorandum summarizes the methodology and findings of the Downtown Off-Street Parking Study performed for the Seattle Department of Transportation (SDOT) in June 2016. This survey of off-street facilities updates and expands data previously collected by SDOT (2014 Downtown Off-Street Study, 2012 and 2013 off-street parking studies along the Waterfront and in Pioneer Square), and the Puget Sound Regional Council (PSRC) (2010 and 2013 off-street parking studies in the Central Business District, International District, and the Waterfront). These data for the off-street parking facilities together with Seattle’s Annual On-Street Parking Study provide a comprehensive account of parking conditions and trends in downtown Seattle. This memorandum presents the methodology for the off-street parking inventory and data collection, and summarizes parking space type by subarea, rate trends, and parking utilization. 1. Study Area Figure 1 shows the study area for the 2016 Downtown Off-Street Parking Survey. The boundaries are generally Valley Street to the north, S Royal Brougham Way to the south, Elliott Bay to the west, and Interstate 5 to the east. The study area includes all areas from the 2014 study and extends into the South Lake Union neighborhood north of Denny Way, adding data collection in PSRC Zones 17 and 18. Additional data were collected for several off-street facilities in the Belltown North - Waterfront and Uptown Edge (Northeast) subareas identified on Figure 1. Figure 1 shows both the subareas as defined by SDOT and the Puget Sound Regional Council (PSRC), the latter of which are used by the PSRC when it performs region-wide parking surveys. For this analysis, the subareas were defined as follows: Core Commercial Areas • Financial • Retail • Waterfront Outside Core Areas • Uptown Triangle • South Lake Union • Belltown North and South • Denny Triangle North and South • Pioneer Square Core and Edge • Stadium • Chinatown/ID Core and Edge Additional Facilities • Waterfront North • Uptown Edge (Northeast)
Transcript
- 1 - April 26, 2017
TECHNICAL MEMORANDUM Project: Downtown Off-Street Parking Study
Subject: Supply and Occupancy Survey in June 2016
Date: April 26, 2017
Author: Marni C. Heffron, P.E., P.T.O.E. Julie A. Bussing
This memorandum summarizes the methodology and findings of the Downtown Off-Street Parking Study performed for the Seattle Department of Transportation (SDOT) in June 2016. This survey of off-street facilities updates and expands data previously collected by SDOT (2014 Downtown Off-Street Study, 2012 and 2013 off-street parking studies along the Waterfront and in Pioneer Square), and the Puget Sound Regional Council (PSRC) (2010 and 2013 off-street parking studies in the Central Business District, International District, and the Waterfront). These data for the off-street parking facilities together with Seattle’s Annual On-Street Parking Study provide a comprehensive account of parking conditions and trends in downtown Seattle. This memorandum presents the methodology for the off-street parking inventory and data collection, and summarizes parking space type by subarea, rate trends, and parking utilization.
1. Study Area
Figure 1 shows the study area for the 2016 Downtown Off-Street Parking Survey. The boundaries are generally Valley Street to the north, S Royal Brougham Way to the south, Elliott Bay to the west, and Interstate 5 to the east. The study area includes all areas from the 2014 study and extends into the South Lake Union neighborhood north of Denny Way, adding data collection in PSRC Zones 17 and 18. Additional data were collected for several off-street facilities in the Belltown North - Waterfront and Uptown Edge (Northeast) subareas identified on Figure 1. Figure 1 shows both the subareas as defined by SDOT and the Puget Sound Regional Council (PSRC), the latter of which are used by the PSRC when it performs region-wide parking surveys. For this analysis, the subareas were defined as follows:
Core Commercial Areas • Financial • Retail • Waterfront
Outside Core Areas • Uptown Triangle • South Lake Union • Belltown North and South • Denny Triangle North and South • Pioneer Square Core and Edge • Stadium • Chinatown/ID Core and Edge
Additional Facilities • Waterfront North • Uptown Edge
(Northeast)
N
2016 DOWNTOWNO F F - S T R E E TPARKING SURVEY
2016 DOWNTOWNO F F - S T R E E TPARKING SURVEY
Figure 1
Parking SubAreas
1
2
3
4
5
8
7
13
12
10
11
9
6
KEY
SDOT Parking Areas
PSRC Zones 1
1718
Downtown Off-Street Parking Study Supply and Occupancy Survey in June 2016
- 3 - April 26, 2017
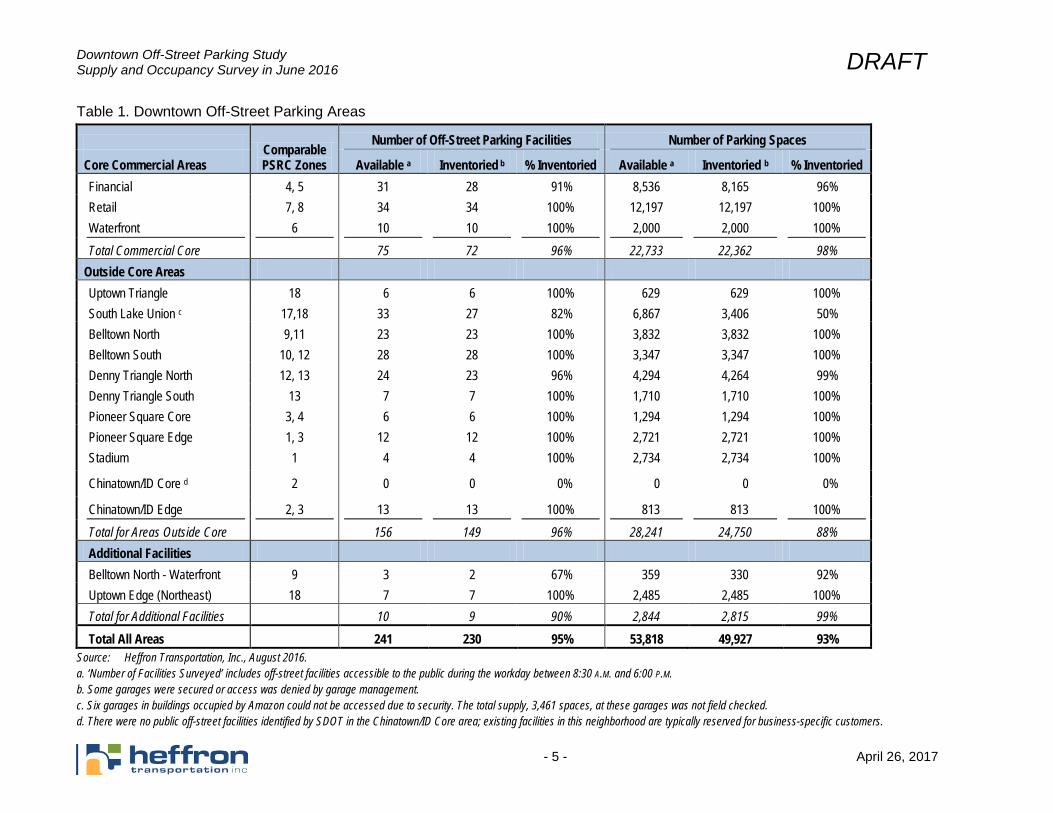
This study collected data for 230 garages with a supply of 49,927 publicly available parking spaces. Data collectors were denied entry at several facilities, but the studied supply represents about 95% of all the public parking facilities in the study area and an estimated 93% of the total public off-street parking capacity. Ranging in size from five to 1,500 parking spaces, parking facilities studied included surface lots, small one-story garages, and multi-story garages.
2. Survey Methodology
2.1. Parking Areas
Table 1 provides information about the number of facilities and spaces located in each subarea. The comparable PSRC zones are also identified. Table 1 defines the number of facilities and parking spaces that are available for public parking Monday through Friday between the hours of 8:30 A.M. and 6:00 P.M. The number of parking spaces fluctuates on the weekend. Some public facilities are closed and some facilities with parking spaces reserved during the workweek are available to the public in the evenings and on the weekends. During the survey, sections of two surface lots—with a total of 50 parking spaces—were occupied by construction activity. For those facilities, only the supply available on the day of the occupancy counts was included. At two facilities, access was denied but occupancy data were provided by the attendant. Evening and weekend data collection were performed for a sample of key facilities in each subarea. The off-street sample sites were selected to represent a mix of small and large facilities as well as surface parking lots and garages. These locations are shown in Figure 2. Specific information about each facility is included in the Appendix.
2.2. Changes from 2014
The 2014 study focused on surveying all publicly-available facilities in the Commercial Core and a sample of facilities outside the Commercial Core. The 2016 study performed weekday surveys at all publicly-available off-street facilities in the entire study area, and evening and weekend surveys at a sample of facilities in all areas. A comparison of results for facilities covered by both the 2014 and 2016 surveys are provided in Section 4.
N
2016 DOWNTOWNO F F - S T R E E TPARKING SURVEY
2016 DOWNTOWNO F F - S T R E E TPARKING SURVEY
Figure 2Locations of Off-Street Facilities
For Weekend Data Collection
1
2
3
4
5
8
7
13
12
10
11
9
6
1718
KEY
SDOT Parking Areas
PSRC Zones 1
Off-Street Facilities
DRAFT Downtown Off-Street Parking Study Supply and Occupancy Survey in June 2016
- 5 - April 26, 2017
Table 1. Downtown Off-Street Parking Areas
Comparable PSRC Zones
Number of Off-Street Parking Facilities Number of Parking Spaces
Core Commercial Areas Available a Inventoried b % Inventoried Available a Inventoried b % Inventoried Financial 4, 5 31 28 91% 8,536 8,165 96% Retail 7, 8 34 34 100% 12,197 12,197 100% Waterfront 6 10 10 100% 2,000 2,000 100% Total Commercial Core 75 72 96% 22,733 22,362 98%
Chinatown/ID Edge 2, 3 13 13 100% 813 813 100% Total for Areas Outside Core 156 149 96% 28,241 24,750 88% Additional Facilities Belltown North - Waterfront 9 3 2 67% 359 330 92% Uptown Edge (Northeast) 18 7 7 100% 2,485 2,485 100% Total for Additional Facilities 10 9 90% 2,844 2,815 99%
Total All Areas 241 230 95% 53,818 49,927 93% Source: Heffron Transportation, Inc., August 2016. a. ‘Number of Facilities Surveyed’ includes off-street facilities accessible to the public during the workday between 8:30 A.M. and 6:00 P.M. b. Some garages were secured or access was denied by garage management. c. Six garages in buildings occupied by Amazon could not be accessed due to security. The total supply, 3,461 spaces, at these garages was not field checked. d. There were no public off-street facilities identified by SDOT in the Chinatown/ID Core area; existing facilities in this neighborhood are typically reserved for business-specific customers.
DRAFT Downtown Off-Street Parking Study Supply and Occupancy Survey in June 2016
- 6 - April 26, 2017
2.3. Data Collection
Parking occupancy counts were performed over a four-week period between June 1, 2016 and June 24, 2016 during the following times:
• Weekday: Monday through Thursday, mornings between 8:45 A.M. and 12:00 P.M., and afternoons between 12:45 P.M. and 3:30 P.M.
• Weekend Evenings: Friday evening between 6:00 P.M. and 8:00 P.M. • Weekends: Saturday afternoons between 11:30 A.M. and 2:30 P.M.
In addition, the parking supply of each garage was confirmed, and data were collected regarding hours of operation, rates, and parking space attributes. Detailed data collected for this study are available in exter-nal databases and spreadsheets.
3. Survey Results
The parking survey data were compiled to show various metrics for each of the sixteen subareas. The following tables summarize the results and show:
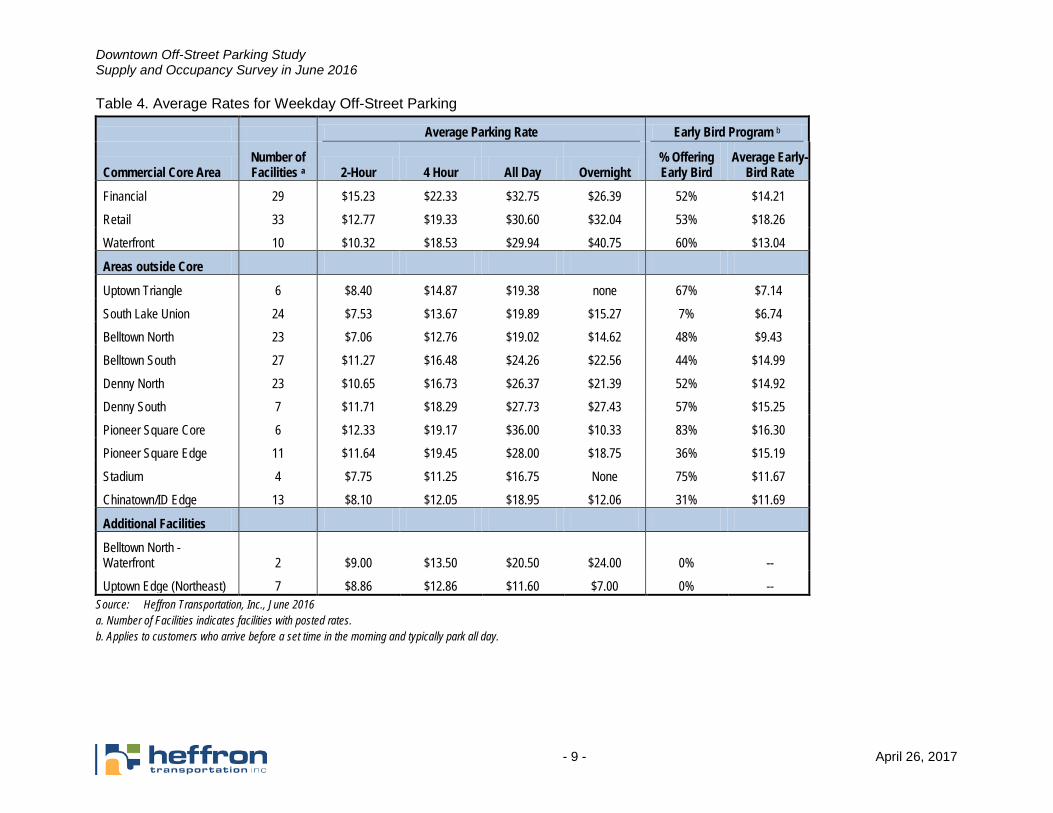
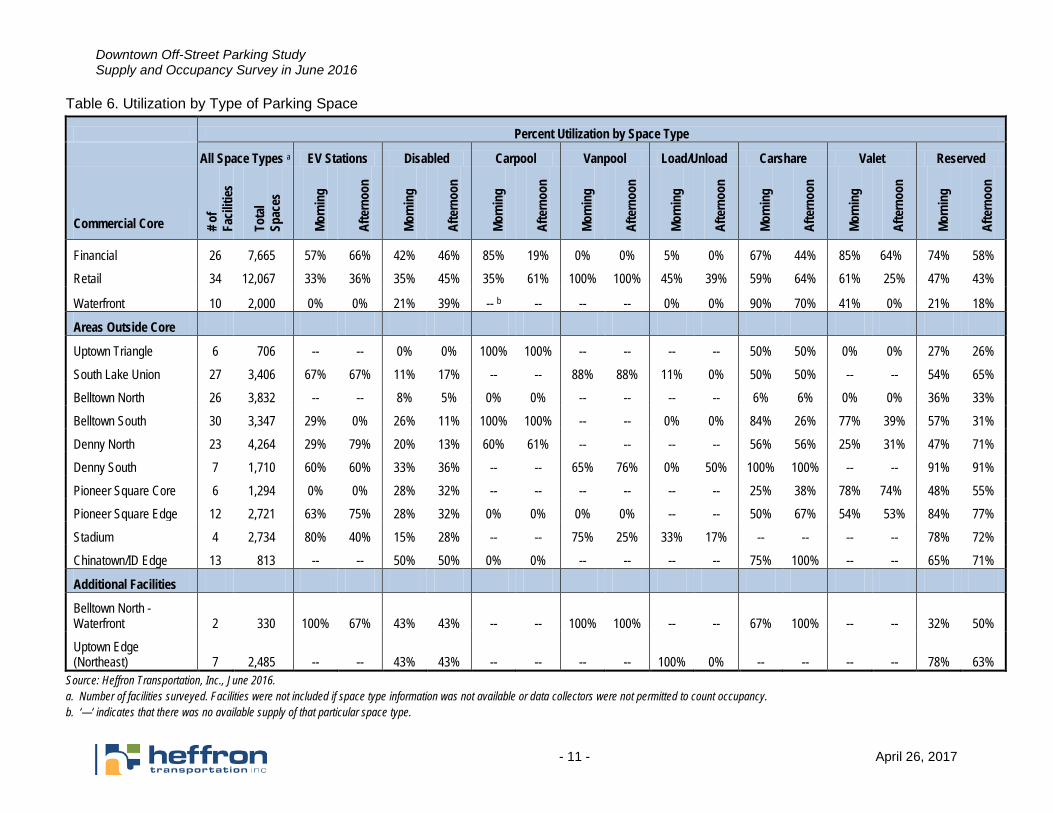
Table 2. Off-Street Parking Occupancy Survey Results, Weekday Data – This table summarizes parking utilization for each subarea during the weekday periods. Parking utilization is defined as the number of parked vehicles divided by the number of available parking spaces. Table 3. Off-Street Parking Occupancy Survey Results, Weekend Data – This table summarizes parking utilization for the evening and weekend periods. The locations of the 12 facilities included in the sample are shown on Figure 2. Some off-street facilities are closed dur-ing the evenings and weekends; thus, the number of available parking spaces fluctuates between survey time periods. Table 4. Average Rates for Off-Street Parking – This table summarizes the average posted parking rates for each subarea for various lengths of stays. Posted rates do not apply to customers who may have a monthly parking pass. Table 5. Parking by Type of Space – This table summarizes the various types of spaces that were designated in the surveyed garages. Table 6. Utilization by Type of Space – This table summarizes parking utilization by type of space.
DRAFT Downtown Off-Street Parking Study Supply and Occupancy Survey in June 2016
- 7 - April 26, 2017
Table 2. Off-Street Parking Occupancy Survey Results – Weekday Data
Number of Facilities
Surveyed a
Number of Available Spaces b
Weekdays Morning Afternoon Core Commercial Areas
% Utilized
Unused Spaces c
% Utilized
Unused Spaces c
Financial 28 8,165 77% 1,854 74% 2,261
Retail 34 12,197 e 64% 4,358 69% 3,796
Waterfront 10 2,000 68% 643 69% 627
Total Commercial Core 72 22,362 69% 6,855 71% 6,684
Areas outside Core
South Lake Union 27 3,406 55% 1,545 62% 1,280
Uptown Triangle 6 629 61% 243 70% 190
Belltown North 23 3,832 68% 1,230 69% 1,197
Belltown South 28 3,347 68% 1,078 75% 842
Denny Triangle North 23 4,264 e 67% 1,428 68% 1,356
Denny Triangle South 7 1,710 74% 445 74% 449
Pioneer Square Core 6 1,294 83% 221 84% 204
Pioneer Square Edge 12 2,721 70% 816 73% 742
Stadium 4 2,734 41% 1,611 47% 1,462
Chinatown/ID Core d 0 -- -- -- -- --
Chinatown/ID Edge 13 813 62% 313 64% 293
Total for Subareas Outside Core 149 24,827 64% 8,930 68% 8,015
Total for Additional Facilities 9 2,815 39% 1,712 43% 1,617
Total All Areas 230 49,927 65% 17,497 67% 16,316 Source: Heffron Transportation, Inc., June 2016. a. ‘Number of Facilities Surveyed’ includes off-street facilities accessible to the public during the workday between 8:30 A.M. and 6:00 P.M. b. ‘Available Spaces’ indicate total supply for the surveyed facilities. c. Unused spaces represent the number of spaces where vehicles are not parked. d. There were no public off-street facilities identified by SDOT in the Chinatown/ID Core area. e. The available spaces in these facilities reflect the actual supply observed in the field. Some surface lot spaces were blocked by construction.
Downtown Off-Street Parking Study Supply and Occupancy Survey in June 2016
- 8 - April 26, 2017
Table 3. Off-Street Parking Occupancy Survey Results – Weekend Data
Weekend Evenings Saturday Midday
Number of Number of Number of Number of Core Commercial Facilities
Source: Heffron Transportation, Inc., June 2016. a. Weekend and evening surveys were performed for a sample of all parking facilities. Available spaces indicate the total supply for the facilities surveyed. b. Unused spaces represent the number of spaces where vehicles are not parked. c. Attendant would not permit counts on Saturday midday at one of the facilities. d. There were no public off-street facilities identified by SDOT in the Chinatown/ID Core area
Downtown Off-Street Parking Study Supply and Occupancy Survey in June 2016
- 9 - April 26, 2017
Table 4. Average Rates for Weekday Off-Street Parking
Average Parking Rate Early Bird Program b
Commercial Core Area Number of Facilities a 2-Hour 4 Hour All Day Overnight
Uptown Edge (Northeast) 7 $8.86 $12.86 $11.60 $7.00 0% -- Source: Heffron Transportation, Inc., June 2016 a. Number of Facilities indicates facilities with posted rates. b. Applies to customers who arrive before a set time in the morning and typically park all day.
Downtown Off-Street Parking Study Supply and Occupancy Survey in June 2016
- 10 - April 26, 2017
Table 5. Parking by Type of Space
All Space Types a EV Stations Disabled Carpool Vanpool Load/Unload Carshare Valet Reserved
Uptown Edge (Northeast) 7 2,485 3 0.1% 70 2.8% 0 0.0% 5 0.2% 0 0.0% 3 0.1% 0 0.0% 56 2.3% Source: Heffron Transportation, Inc., June 2016. a. Number of facilities surveyed. Facilities were not included if space type information was not available or data collectors were not permitted to count occupancy.
Downtown Off-Street Parking Study Supply and Occupancy Survey in June 2016
- 11 - April 26, 2017
Table 6. Utilization by Type of Parking Space
Percent Utilization by Space Type
All Space Types a EV Stations Disabled Carpool Vanpool Load/Unload Carshare Valet Reserved
Source: Heffron Transportation, Inc., June 2016. a. Number of facilities surveyed. Facilities were not included if space type information was not available or data collectors were not permitted to count occupancy. b. ‘—‘ indicates that there was no available supply of that particular space type.
Downtown Off-Street Parking Study Supply and Occupancy Survey in June 2016
- 12 - April 26, 2017
4. Comparison of 2014 and 2016 Survey Results
As mentioned previously, the 2016 Off-Street Parking Survey was an updated and expanded version of the 2014 Off-Street Survey. To assess changes in supply and occupancy between the two study years, a comparison of facilities that were surveyed in both years was performed. In total, 98 facilities with over 30,000 parking spaces were surveyed in both the 2014 and 2016 studies. Table 7, Figure 3, and Figure 4 shown below summarize the following information:
Table 7. Comparison of Off-Street Parking Supply and Occupancy – This table compares parking supply and occupancy for facilities that were surveyed in both 2014 and 2016. Overall, the parking supply in the 98 facilities decreased by about 0.1% between the two years. The occupancy decreased by 3.6% during the morning period and by 5.5% during the afternoon. The decreased occupancy inside the Commercial Core area was slightly less than outside of the Commercial Core area. Table 8. Supply Reduction Between 2014 and 2016 – This table summarizes facilities that were counted in 2014 but no longer existed in 2016. These facilities may currently be under construction or replaced by new construction in the future that includes garage parking. Between 2014 and 2016 eleven (11) facilities with a total of 756 spaces were removed. The majority of the spaces removed were located in the Commercial Core subareas. Figure 3. Commercial Core Utilization: 2014 and 2016 Comparison – This chart compares the utilization of off-street parking spaces in the Commercial Core for facilities that were surveyed in both 2014 and 2016. A shown, except for morning utilization in the Financial Subarea, there has been an overall decrease in utilization in all subareas of the Commercial Core. As previously noted, the parking supply changed very little; therefore, it is reasonable to compare the utilization rates by subarea. Figure 4. Outside the Commercial Core Utilization: 2014 and 2016 Comparison – This chart compares the utilization of off-street parking spaces outside the Commercial Core for facilities that were surveyed in both 2014 and 2016. In 2014, South Lake Union, Uptown Triangle, Belltown North - Waterfront, Uptown Edge (Northeast), and Stadium were not included in the survey. These subareas are not included in Figure 4.
Downtown Off-Street Parking Study Supply and Occupancy Survey in June 2016
- 13 - April 26, 2017
Table 7. Comparison of 2014 and 2016 Off-Street Parking Supply and Occupancy
Parking Supply Morning Occupancy Afternoon Occupancy Core Commercial Areas
Number of Facilities a 2014 2016 2014 2016 2014 2016
Financial 21 6,603 6,612 5,041 5,333 5,150 4,978
Retail 30 11,656 11,615 8,219 7,473 8,518 8,038
Waterfront 10 2,000 2,000 1,383 1,357 1,517 1,373
Total Commercial Core 61 20,259 20,227 14,643 14,163 15,185 14,389
% Change -0.2% -3.2% -5.2%
Areas Outside Core
Belltown North 6 2,653 2,619 1,616 1,807 1,664 1,788
Belltown South 10 2,062 2,111 1,627 1,364 1,633 1,526
Denny Triangle North 8 2,103 2,103 1,357 1,097 1,567 1,321
Total Outside Core 37 10,127 10,122 6,829 6,542 7,435 6,993
% Change -0.05% -4.2% -5.9%
Total All Areas 98 30,386 30,349 21,472 20,705 22,620 21,382
% Change -0.1% -3.6% -5.5% Source: Heffron Transportation, Inc., June 2016. a. ‘Number of Facilities Surveyed’ includes off-street facilities accessible to the public during the workday between 8:30 A.M. and 6:00 P.M.
Downtown Off-Street Parking Study Supply and Occupancy Survey in June 2016
- 14 - April 26, 2017
Table 8. Supply Reduction between 2014 and 2016 Parking Surveys
Core Commercial Areas Number of Facilities
Eliminated Number of Spaces
Eliminated
Financial 1 70
Retail 2 162
Waterfront 2 150
Total Commercial Core 5 382
Areas Outside Core
Belltown North None Identified --
Belltown South 1 77
Denny Triangle North 1 121
Denny Triangle South None Identified --
Pioneer Square Core 1 130
Pioneer Square Edge 2 22
Chinatown/ID Core d -- --
Chinatown/ID Edge 1 24
Total Outside Core 6 374
Total All Areas 11 756 Source: Heffron Transportation, Inc., June 2016. Note: Facilities that were not surveyed in 2014 but were identified as not existing in 2016 are not included.
Downtown Off-Street Parking Study Supply and Occupancy Survey in June 2016
- 15 - April 26, 2017
Figure 3. Commercial Core Utilization: 2014 and 2016 Comparison
Source: Data collected by Heffron Transportation, Inc. in June 2014 and June 2016.
Figure 4. Outside Commercial Core Utilization: 2014 and 2016 Comparison
Source: Heffron Transportation, Inc., June 2016.
Downtown Off-Street Parking Study Supply and Occupancy Survey in June 2016
- 16 - April 26, 2017
Facilities surveyed in both 2014 and 2016 showed a decrease in parking occupancy over the two-year period. Overall, parking occupancy during the afternoon period decreased by about 5%. Outside of the Commercial Core area, two subareas experienced increased occupancy: Belltown North (+7.5%) and Pioneer Square Core Subarea (+15.5%). The parking supply in these two subareas also decreased slightly between 2014 and 2016, which likely factors into the increased utilization rates shown in Figure 4. The highest increase in occupancy occurred in Pioneer Square during the morning period, which is likely related to increased daytime employment in or near the neighborhood. Morning occupancy in that neighborhood is now similar to afternoon occupancy.
5. Off-Street Facilities with CTR and TMP Requirements
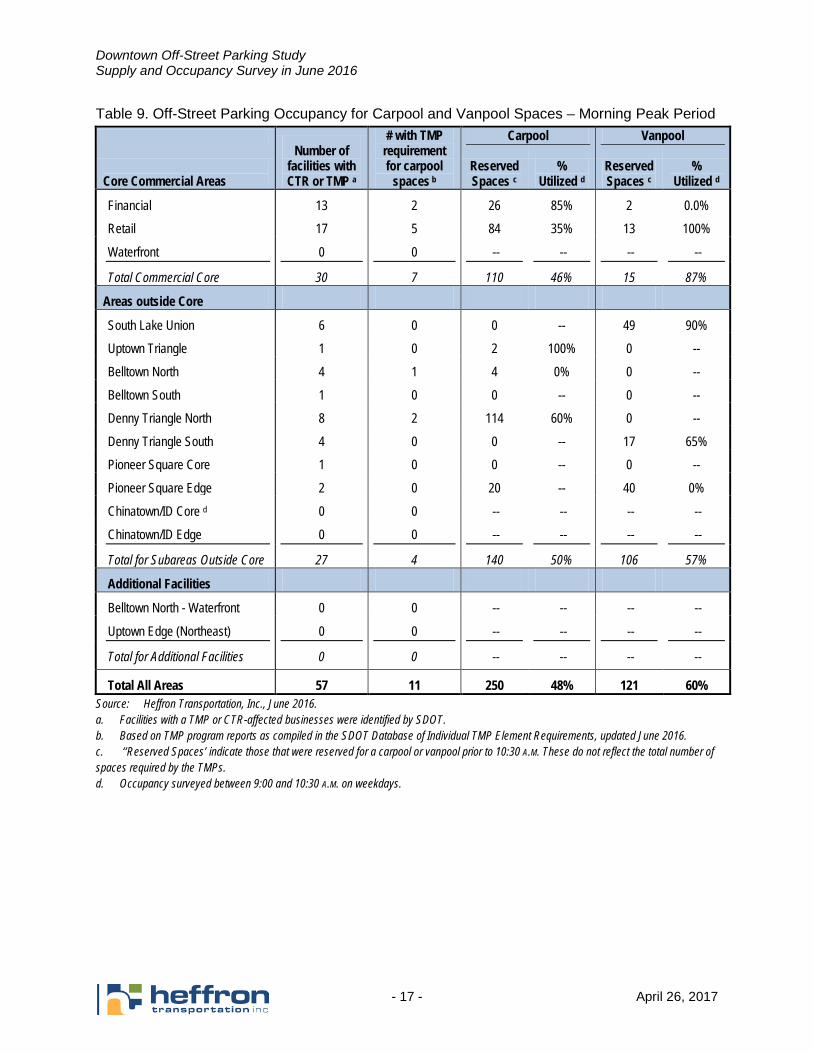
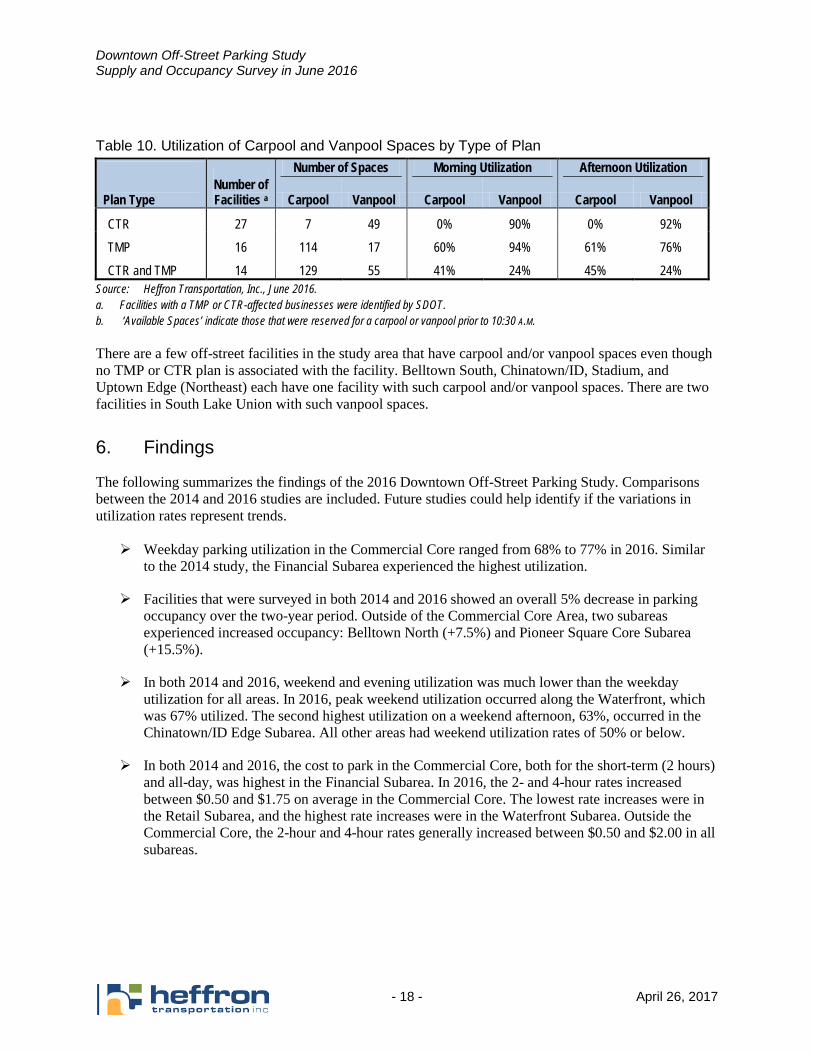
As part of the 2016 Downtown Off-Street Study, additional data related to carpool and vanpool parking supply and occupancy were collected for buildings that have Transportation Management Plans (TMP) and/or are occupied by Commute Trip Reduction (CTR) affected employers. TMPs are imposed by the City of Seattle as part of the building permitting and environmental review process under the State Environmental Policy Act (SEPA), and CTR is a state requirement that applies to businesses with more than 100 employees. The goal of both is to reduce single-occupant vehicle commute trips. One tool often used to reduce trips is to encourage use of carpooling and vanpooling, and providing reserved spaces for carpool and vanpool vehicles. A TMP, which is applied as part of the permit to construct the building, can have requirements for a specific number of designated carpool or vanpool spaces. Facilities occupied by a CTR-affected employer may provide carpool spaces even if it was not a specific permit requirement. Of the 57 facilities in the study area that are subject to a TMP or are occupied by CTR-affected employers, only 11 are identified as required to designate carpool and vanpool spaces by their TMPs. Of those, eight provide no carpool or vanpool parking on site. Thirteen of the surveyed facilities provide some designated carpool or vanpool parking, meaning ten of the facilities provide carpool parking even though it is not required. Facilities that are subject to a TMP or CTR plan were identified by SDOT.1 The number of carpool and vanpool spaces at each of those facilities was collected along with utilization of those spaces. Since some of these spaces may convert to regular spaces after 10:30 A.M., occupancy was observed during the morning between 9:00 A.M. and 10:30 A.M. The morning occupancy at off-street facilities in the study area that have either CTR or TMP plans are summarized in Table 9. As shown, two subareas, Waterfront and Chinatown/ID Edge, have no TMP or CTR-affected facilities. Of the total 250 carpool parking spaces in the study area, 48% were utilized. Of the 121 vanpool parking spaces, 60% were utilized. Table 10 summarizes the utilization of carpool and vanpool spaces based on the type of plan (i.e., TMP or CTR.) The highest utilization of carpool spaces, 61%, occurred in the afternoon at facilities with TMPs. The highest utilization of vanpool spaces, 94%, occurred in the morning at facilities with TMPs. The lowest carpool and vanpool utilization rates were in facilities with both TMP and CTR plans.
1 Database that matched CTR/TMP requirements and off-site parking by address, SDOT, October 2016.
Downtown Off-Street Parking Study Supply and Occupancy Survey in June 2016
- 17 - April 26, 2017
Table 9. Off-Street Parking Occupancy for Carpool and Vanpool Spaces – Morning Peak Period
Number of facilities with CTR or TMP a
# with TMP requirement for carpool
spaces b
Carpool Vanpool
Core Commercial Areas
Reserved Spaces c
% Utilized d
Reserved Spaces c
% Utilized d
Financial 13 2 26 85% 2 0.0%
Retail 17 5 84 35% 13 100%
Waterfront 0 0 -- -- -- --
Total Commercial Core 30 7 110 46% 15 87%
Areas outside Core
South Lake Union 6 0 0 -- 49 90%
Uptown Triangle 1 0 2 100% 0 --
Belltown North 4 1 4 0% 0 --
Belltown South 1 0 0 -- 0 --
Denny Triangle North 8 2 114 60% 0 --
Denny Triangle South 4 0 0 -- 17 65%
Pioneer Square Core 1 0 0 -- 0 --
Pioneer Square Edge 2 0 20 -- 40 0%
Chinatown/ID Core d 0 0 -- -- -- --
Chinatown/ID Edge 0 0 -- -- -- --
Total for Subareas Outside Core 27 4 140 50% 106 57%
Additional Facilities
Belltown North - Waterfront 0 0 -- -- -- --
Uptown Edge (Northeast) 0 0 -- -- -- --
Total for Additional Facilities 0 0 -- -- -- --
Total All Areas 57 11 250 48% 121 60% Source: Heffron Transportation, Inc., June 2016. a. Facilities with a TMP or CTR-affected businesses were identified by SDOT. b. Based on TMP program reports as compiled in the SDOT Database of Individual TMP Element Requirements, updated June 2016. c. ‘‘Reserved Spaces’ indicate those that were reserved for a carpool or vanpool prior to 10:30 A.M. These do not reflect the total number of spaces required by the TMPs. d. Occupancy surveyed between 9:00 and 10:30 A.M. on weekdays.
Downtown Off-Street Parking Study Supply and Occupancy Survey in June 2016
- 18 - April 26, 2017
Table 10. Utilization of Carpool and Vanpool Spaces by Type of Plan
Number of Facilities a
Number of Spaces Morning Utilization Afternoon Utilization Plan Type Carpool Vanpool Carpool Vanpool Carpool Vanpool
CTR 27 7 49 0% 90% 0% 92%
TMP 16 114 17 60% 94% 61% 76%
CTR and TMP 14 129 55 41% 24% 45% 24% Source: Heffron Transportation, Inc., June 2016. a. Facilities with a TMP or CTR-affected businesses were identified by SDOT. b. ‘Available Spaces’ indicate those that were reserved for a carpool or vanpool prior to 10:30 A.M. There are a few off-street facilities in the study area that have carpool and/or vanpool spaces even though no TMP or CTR plan is associated with the facility. Belltown South, Chinatown/ID, Stadium, and Uptown Edge (Northeast) each have one facility with such carpool and/or vanpool spaces. There are two facilities in South Lake Union with such vanpool spaces.
6. Findings
The following summarizes the findings of the 2016 Downtown Off-Street Parking Study. Comparisons between the 2014 and 2016 studies are included. Future studies could help identify if the variations in utilization rates represent trends. Weekday parking utilization in the Commercial Core ranged from 68% to 77% in 2016. Similar
to the 2014 study, the Financial Subarea experienced the highest utilization.
Facilities that were surveyed in both 2014 and 2016 showed an overall 5% decrease in parking occupancy over the two-year period. Outside of the Commercial Core Area, two subareas experienced increased occupancy: Belltown North (+7.5%) and Pioneer Square Core Subarea (+15.5%).
In both 2014 and 2016, weekend and evening utilization was much lower than the weekday utilization for all areas. In 2016, peak weekend utilization occurred along the Waterfront, which was 67% utilized. The second highest utilization on a weekend afternoon, 63%, occurred in the Chinatown/ID Edge Subarea. All other areas had weekend utilization rates of 50% or below.
In both 2014 and 2016, the cost to park in the Commercial Core, both for the short-term (2 hours) and all-day, was highest in the Financial Subarea. In 2016, the 2- and 4-hour rates increased between $0.50 and $1.75 on average in the Commercial Core. The lowest rate increases were in the Retail Subarea, and the highest rate increases were in the Waterfront Subarea. Outside the Commercial Core, the 2-hour and 4-hour rates generally increased between $0.50 and $2.00 in all subareas.