60
1 Downtown Resident Study Pittsburgh Downtown Partnership October 2008 Prepared by: STRATEGIC METRICS GROUP www.strategicmetricsgroup.com 412.480.4332

1
Downtown Resident Study
Pittsburgh Downtown Partnership October 2008
Prepared by: STRATEGIC METRICS GROUP
www.strategicmetricsgroup.com 412.480.4332

2
Resident Sample Demographics
Decision to Move Downtown
Satisfaction with Downtown Living
Shopping Behavior
Downtown Parks & Events
Transportation Usage & Attitudes
Summary of Findings

3
METHODOLOGY & OVERVIEW
2,927 paper surveys sent via mail to residents in PDP’s data base
An on-line version of survey was also available to residents on SMG website
“Reminder” postcard sent out to boost response rate
Data collected mid-August through late September
No $ incentive provided to residents
Methodology
413 surveys collected
413 out of 2,927 = 14.1% response rate
87 on-line + 326 paper = 413 total
“Reminder” postcard boosted response by almost 120 surveys (very productive)
Surveyed residents represent an even mix of Downtown’s buildings/properties
Study Results
4
PROFILE OF
RESIDENT SAMPLE

5
BUILDING / PROPERTY
63
34 33 3230
28 27 27 26
2018
1513 12 12 11
8
3
0
10
20
30
40
50
60
70
Gate
way
T
Pennsy
lvanian
Cor
k Fac
tory
Linco
ln a
t N.S
.
The E
ncore
Cha
tham
T
Cra
wford
Sq
Heinz
Lofts
Roo
s Arm
s
Was
h. P
laza
P Gar
rison
625
Stanw
ix
Midto
wn T
930
Penn Ave
May
Building
No W
all/S
mall
151
Firs
tSid
e
900
Penn Ave
Residential Property
# o
f R
es
po
nd
en
ts
n = 412 (1 respondent did not want address to be known)
Current Residences of Study Respondents
All 18 buildings/properties are
represented in the study
sample.
6
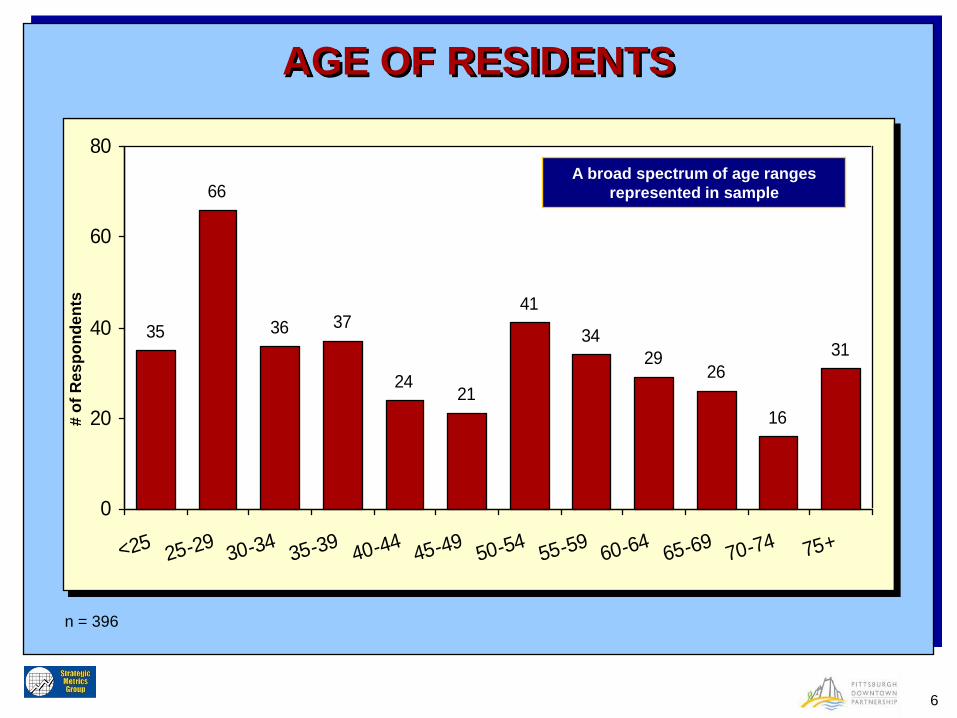
AGE OF RESIDENTS
35
66
36 37
2421
41
34
2926
16
31
0
20
40
60
80
<2525-29
30-3435-39
40-4445-49
50-5455-59
60-6465-69
70-74 75+
# o
f R
es
po
nd
en
ts
n = 396
A broad spectrum of age ranges
represented in sample

7
TOTAL ANNUAL HOUSEHOLD INCOME
40
49
72
60
50
17
9
39
61
0
20
40
60
80
100
<$25K$25K-$50K
$51K-$75K
$76K-$100K
$101K-$150K
$151K-$200K
$201K-$250K>$250K
Prefer not to say
# o
f R
es
po
nd
en
ts
n = 397 Source of HH income statistics for US, AGH County,
and City of Pgh: 2006 American Community Survey
(ACS) US Census Bureau
Downtown resident sample skews higher than
national and local income levels:
% of Households over $100K
United States = 18% City of Pittsburgh = 9%
Allegheny County = 16%
Downtown Residents = 34%

8
GENDER AND RACE
Male
44%
Female
56%
Asian
2%Black
12%
White
83%
Other
3%
n = 399 n = 389

9
HOUSEHOLD SIZE & MARITAL STATUS
2 or More
People
42%1 Person
58%
Div / Sep /
Wid
20%
Married
46%
Single
27%
Unmarried -
Living as
Couple
7%
n = 398
Average Household Size = 1.4 people
Just 3% of households have children
n = 401
10
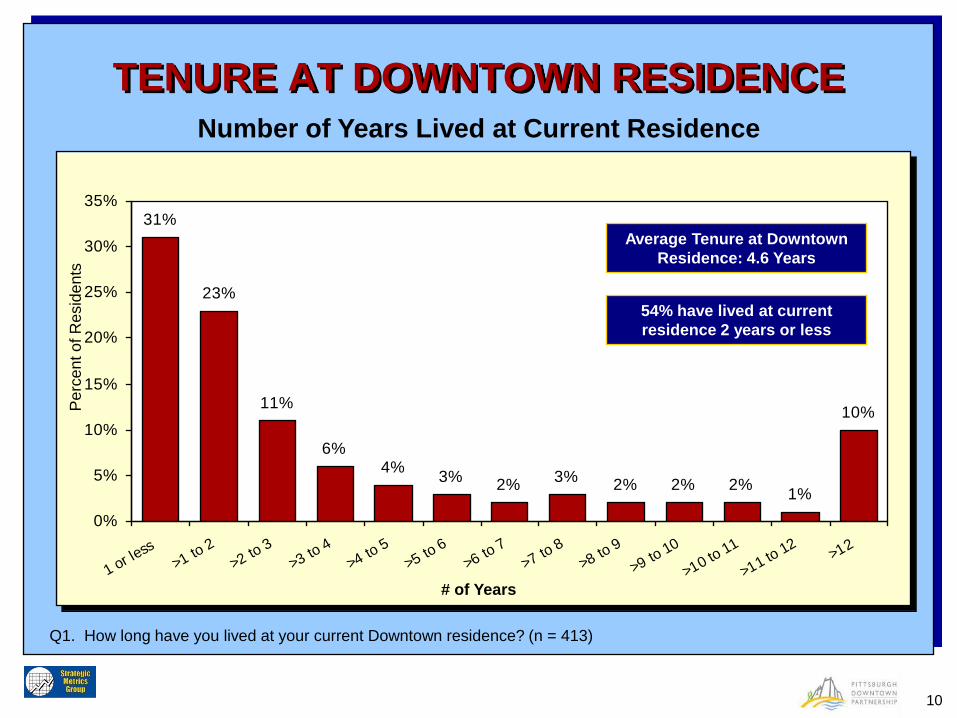
TENURE AT DOWNTOWN RESIDENCE
31%
23%
11%
6%4%
3%2%
3%2% 2% 2%
1%
10%
0%
5%
10%
15%
20%
25%
30%
35%
1 or less
>1 to 2
>2 to 3
>3 to 4
>4 to 5
>5 to 6
>6 to 7
>7 to 8
>8 to 9
>9 to 10
>10 to 11
>11 to 12
>12
# of Years
Pe
rce
nt o
f R
esid
en
ts
Q1. How long have you lived at your current Downtown residence? (n = 413)
Average Tenure at Downtown
Residence: 4.6 Years
Number of Years Lived at Current Residence
54% have lived at current
residence 2 years or less

11
TENURE AT DOWNTOWN RESIDENCE
31%
23%
11%
6%4%
3%2%
3%2% 2% 2%
1%
10%
0%
5%
10%
15%
20%
25%
30%
35%
1 or less
>1 to 2
>2 to 3
>3 to 4
>4 to 5
>5 to 6
>6 to 7
>7 to 8
>8 to 9
>9 to 10
>10 to 11
>11 to 12
>12
# of Years
Pe
rce
nt o
f R
esid
en
ts
Q1. How long have you lived at your current Downtown residence? (n = 413)
Number of Years Lived at Current Residence
Overall Average Tenure = 4.6 Years
Gateway Towers 9.0 900 Penn Ave 3.1
Midtown Towers 8.9 Lincoln at N.S. 2.7
Chatham Towers 8.6 Penn Garrison 2.4
Roosevelt Arms 7.5 Heinz Lofts 1.5
May Building 7.4 151 FirstSide 1.4
Crawford Square 5.4 The Encore 1.3
Washington Plaza 3.8 No Wall/Small 1.2
625 Stanwix St 3.6 Cork Factory 0.9
Pennsylvanian 3.5 930 Penn Ave 0.7
12
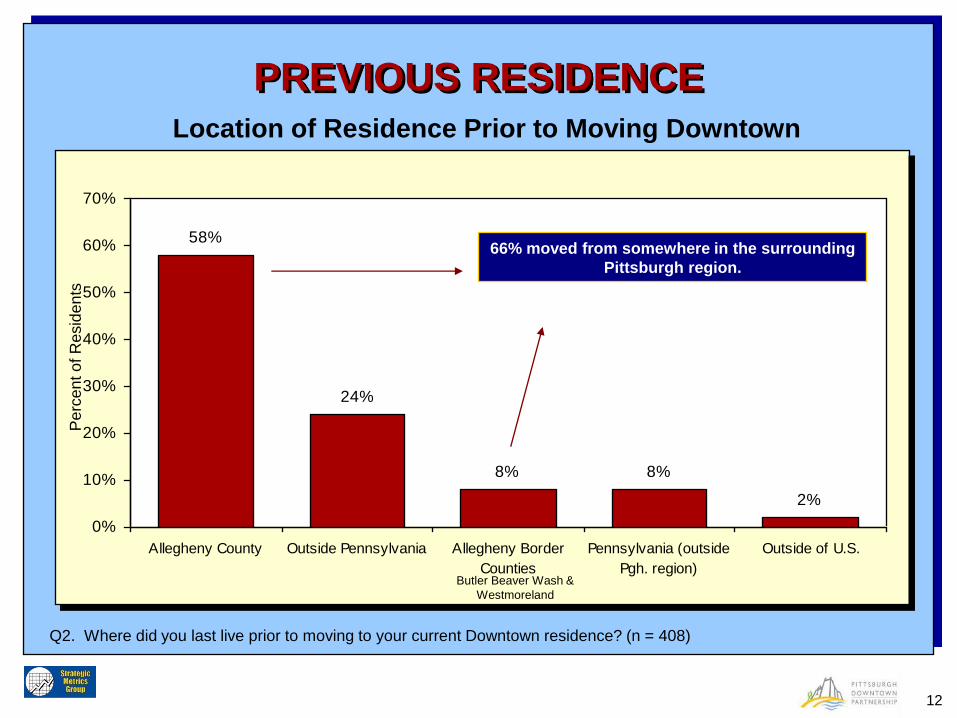
PREVIOUS RESIDENCE
58%
24%
8% 8%
2%
0%
10%
20%
30%
40%
50%
60%
70%
Allegheny County Outside Pennsylvania Allegheny Border
Counties
Pennsylvania (outside
Pgh. region)
Outside of U.S.
Pe
rcen
t o
f R
esid
en
ts
Q2. Where did you last live prior to moving to your current Downtown residence? (n = 408)
66% moved from somewhere in the surrounding
Pittsburgh region.
Location of Residence Prior to Moving Downtown
Butler Beaver Wash &
Westmoreland
13
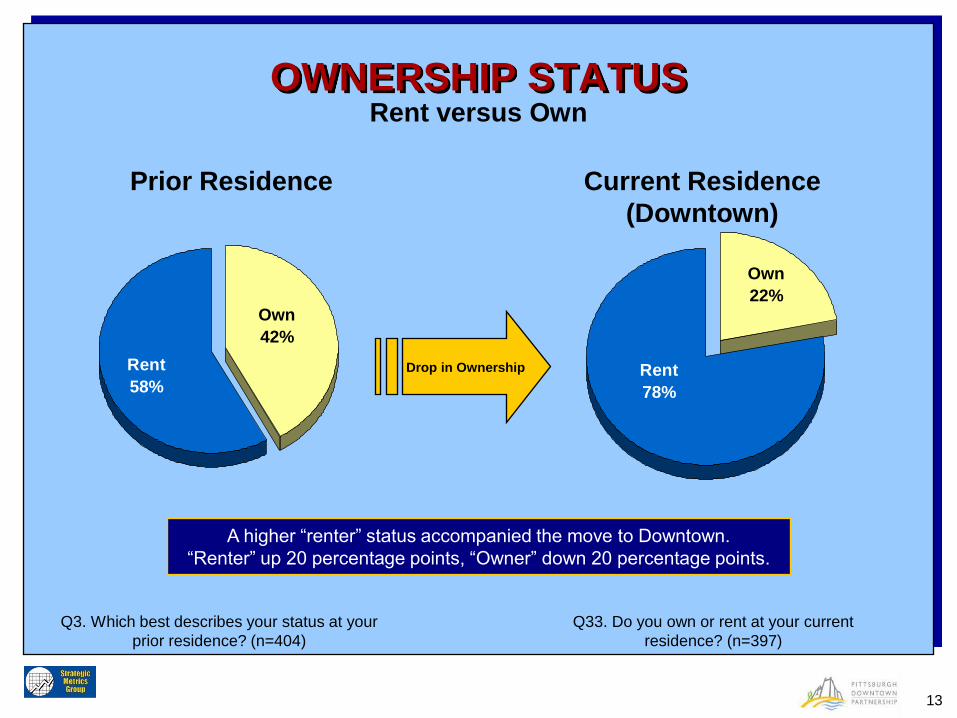
OWNERSHIP STATUS
Own
42%
Rent
58%
Q3. Which best describes your status at your
prior residence? (n=404)
Own
22%
Rent
78%
Q33. Do you own or rent at your current
residence? (n=397)
Prior Residence Current Residence
(Downtown)
Drop in Ownership
A higher “renter” status accompanied the move to Downtown.
“Renter” up 20 percentage points, “Owner” down 20 percentage points.
Rent versus Own

14
SUMMARY OF DEMOGRAPHICS
GENDER n %
Male 176 44%
Female 223 56%
Total 399 100%
MARITAL STATUS n %
Married 106 26.6%
Single 181 45.5%
Divorced/Widowed/
Separated 81 20.4%
Unmarried living as
couple 30 7.5%
RACE/ETHNICITY n %
White 325 83%
Black 45 12%
Asian 8 2%
Other 11 3%
Total 389 100%
AGE n %
Less than 25 35 9%
25 – 29 66 17%
30 – 34 36 9%
35 – 39 37 9%
40 – 44 24 6%
45 – 49 21 5%
50 – 54 41 10%
55 – 59 34 9%
60 – 64 29 7%
65 – 69 26 7%
70 – 74 16 4%
75+ 31 8%
Total 396 100%
Downtown HH Size n Average
Average HH size 401 1.4 people

15
SUMMARY OF DEMOGRAPHICS
INCOME n %
<$25K 40 10%
$25K-$50K 49 12%
$51K-$75K 72 18%
$76K-$100K 60 15%
$101K-$150K 50 13%
$151K-$200K 17 4%
$201K-$250K 9 2%
>$250K 39 10%
Prefer Not to Say 61 16%
Total 397 100%
PET OWNERSHIP n %
No Pets 295 74%
Own Dogs 50 13%
Own Cats 56 14%
Own Other Pets 8 2%
Average # of Dogs 50 1.04
Average # of Cats 56 1.46
Average # of Other
Pets
8 No responses
“Other” Types of Pets Birds, Fish, Rabbit
16
DECISION TO
MOVE DOWNTOWN

17
PRIMARY REASON FOR MOVING DOWNTOWN
2%
2%
2%
1%
6%
2%
3%
4%
8%
21%
40%
9%
0% 10% 20% 30% 40% 50%
Close to Work/School
Convenience/Accessibility
"City Lifestyle"
Appeal of Building/Property
The Cultural District/Events
Change in Marital Status
"Lively"/ "Fun"/ "Social"
Public Trnsportation
Downsizing
Lifestyle Change
Affordability
Other
Q4. What was the primary reason you chose to
live Downtown? (n=402)
Convenience of location is key driver.
The “lifestyle” & the properties/units
themselves are important factors.
“Other” includes: access to rivers, amenities, access to major roads

18
OTHER LOCATIONS CONSIDERED
IN HOUSING SEARCH
8%
8%
5%
5%
3%
1%
1%
2%
9%
10%
13%
16%
31%
34%
17%
0% 10% 20% 30% 40%
Shadyside
"Nowhere else"
South Side/Shore
North Suburbs
Squirrel Hill
Mt. Washington
North Side/Shore
South Suburbs
City East
Strip District
East Suburbs
West Suburbs
City North
City South
Other
Q5. Prior to moving Downtown, what communities
were included in your housing search? (n=374) Q5 is a multiple response question. 374 people provided 645 answers.
The above chart reflects the % of people mentioning each location.
Shadyside is the other top city location
considered before choosing Downtown
The northern & southern suburbs were the
most common of the region’s suburbs
considered.
(Cranberry, Wexford, Mt. Lebanon)
Almost one-third strictly targeted Downtown in
their search

19
RESOURCES USED IN HOUSING SEARCH
54%
38%
17%
8%6%
0%
10%
20%
30%
40%
50%
60%
70%
Other Internet Real Estate Agency Housing Tour Relocation Consultant
Pe
rcen
t o
f R
esid
en
ts
Q6. Which resources did you use to find your current
property/building? (n = 404)
Q6 is a multiple response question. 404 people provided 494 answers.
The above chart reflects the % of people mentioning each resource.
Top 3 Mentions in “Other”
33% - Contacts / Friends / Referrals
13% - Rental / Apartment Guides
13% - Newspaper
Top 5 Mentions for “Internet”
22% - rent.com
19% - apartments.com
16% - google.com
14% - craigslist.com
6% - pittsburghmoves.com
20
SATISFACTION
WITH
DOWNTOWN LIVING
21
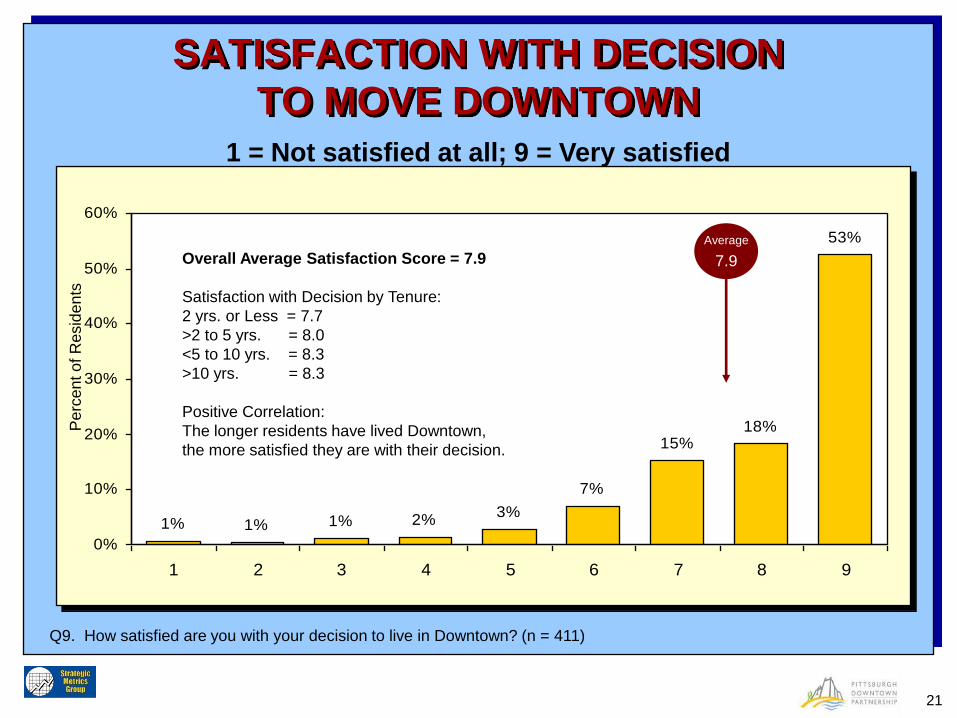
SATISFACTION WITH DECISION
TO MOVE DOWNTOWN
1% 1% 1% 2%3%
7%
15%18%
53%
0%
10%
20%
30%
40%
50%
60%
1 2 3 4 5 6 7 8 9
Pe
rcen
t o
f R
esid
en
ts
1 = Not satisfied at all; 9 = Very satisfied
Overall Average Satisfaction Score = 7.9
Satisfaction with Decision by Tenure:
2 yrs. or Less = 7.7
>2 to 5 yrs. = 8.0
<5 to 10 yrs. = 8.3
>10 yrs. = 8.3
Positive Correlation:
The longer residents have lived Downtown,
the more satisfied they are with their decision.
Average
7.9
Q9. How satisfied are you with your decision to live in Downtown? (n = 411)
22
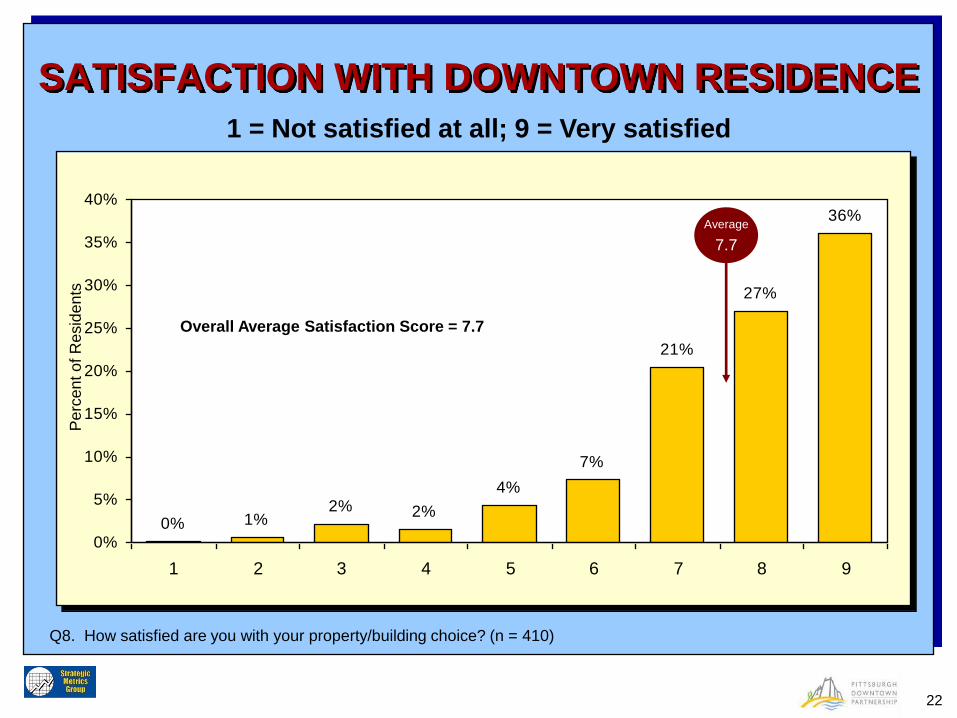
SATISFACTION WITH DOWNTOWN RESIDENCE
0% 1%2% 2%
4%
7%
21%
27%
36%
0%
5%
10%
15%
20%
25%
30%
35%
40%
1 2 3 4 5 6 7 8 9
Pe
rcen
t o
f R
esid
en
ts
Q8. How satisfied are you with your property/building choice? (n = 410)
1 = Not satisfied at all; 9 = Very satisfied
Overall Average Satisfaction Score = 7.7
Average
7.7

23
FACTORS THAT IMPACT THE QUALITY
OF “DOWNTOWN LIVING”
Q10. Which aspects of Downtown living have the greatest overall impact on
your quality of life (livability) as a Downtown resident? (n = 383)
Positive & Negative Factors Cited by Residents
Positive
Mentions
94%
Negative
Mentions
6%1,355 “quality of life" factors were cited
by the Downtown residents. 1,275 or
94% of these answers were “positive”
or favorable. Just 6% of the factors
reference “negative” or unfavorable
issues.
Positive Factors Cited Most Often
(94%): - Close to work or school
- Convenience / central location
- Access to restaurants
- Proximity to Cultural District / Events / Arts
Negative Factors Cited Most Often
(6%): - Safety / Security
- Lack of Grocery Stores & Retail
- Nothing is open at night – need to stay open
- Noise / Parking / No taxis / High costs

24
POSITIVE FACTORS IMPACTING THE
QUALITY OF “DOWNTOWN LIVING”
Q10. Which aspects of Downtown living have the greatest
overall impact on your quality of life (livability) as a
Downtown resident? (n = 1,275 responses)
13%
11%
11%
10%
9%
9%
8%
2%
13%
15%
19%
25%
30%
40%
27%
0% 10% 20% 30% 40% 50%
Close to Work / School
Convenience/Central Location
Access to Restaurants
Cultural District / Events
Public Transportation
Sporting Events / Stadiums
Activities / Entertainment
Access to Shopping
Bike & Walking Trails
Access to Theaters / Shows
People / Community
Parks / Green Spaces
Beautiful Views
"Walk-ability"
Night Life
Q10 is a multiple response question. 383 people provided 1,275
answers. The above chart reflects the % of people mentioning each
factor.

25
NEGATIVE FACTORS IMPACTING THE
QUALITYOF “DOWNTOWN LIVING”
Q10. Which aspects of Downtown living have the greatest
overall impact on your quality of life (livability) as a Downtown resident? (n = 80 responses)
• Safety / Security (33)
• Noise (3)
• Costs (high) (3)
• (need) more & safer bus routes from Oakland to Mellon arena area
• (need) places for guests to park for free
• accessibility - need to not have Pgh PD block access to apartments
• businesses that stay open
• cab service/parking
• Develop "retail services" w/ business hours catering to a residential com
• Downtown construction and congestion
• DT is dead at night; everything closes
• Frustrated with the smokers everywhere
• full use of buildings
• grocery store at reasonable pricing
• Grocery Stores (and operation hours of them)
• lack of weekend life
• loud noise, especially at night
• no shopping for food in area
• not closing streets to access building
• safety - I wouldn't feel safe walking around at night
• shopping (limited at this time)
• stuff needs to be open late and on weekends
• There is no Grocery Store!!!!
• $ parking
• air pollution
• black on white crime
• City closing the one road that leads to
• Develop retail shopping for a variety of life-
• styles w/ business hours catering to residents
• we need a grocery store with regular prices
• Game Events (added crowds/ticket sellers)
• have to drive to N Hills/Fox Chap for groceries
• lack of grocery shopping
• lack of police patrol, especially after
• more access to taxi service
• Parking difficulties. It's Expensive.
• Construction
• garbage everywhere
• state or PennDot doesn’t notify road closures
• street bums, loiterers
• punks & vagrants on street
• coal dust
• taxes
• better property management
SAFETY is the primary factor.
It accounts for 33 of 80 responses.
26
SHOPPING
BEHAVIOR

27
CATEGORIES SHOPPED
BY DOWNTOWN RESIDENTS
• Restaurants / Bars
• Pharmacy / Drug
• Convenience Store item
• Men’s Clothing
• Financial Services
• Personal Fitness
• Movies / Theater
• Groceries
• Electronics/Appliances
• Home Furnishing/Furniture
• Automotive
• Books / Music / Video
• Digital (PCs, Phones)
• Medical Services
• Sporting Goods / Hobby
• Beauty / Barber
• Dry Cleaning
• Women’s Clothing.
• Beer Wine Liquor
• Optical / Eyewear
• Legal Service
• Jewelry
• Artwork
Residents asked where they shop for 23 product/service categories
Do you shop in Downtown? (yes/no) Do you shop in suburbs? (yes/no)
28
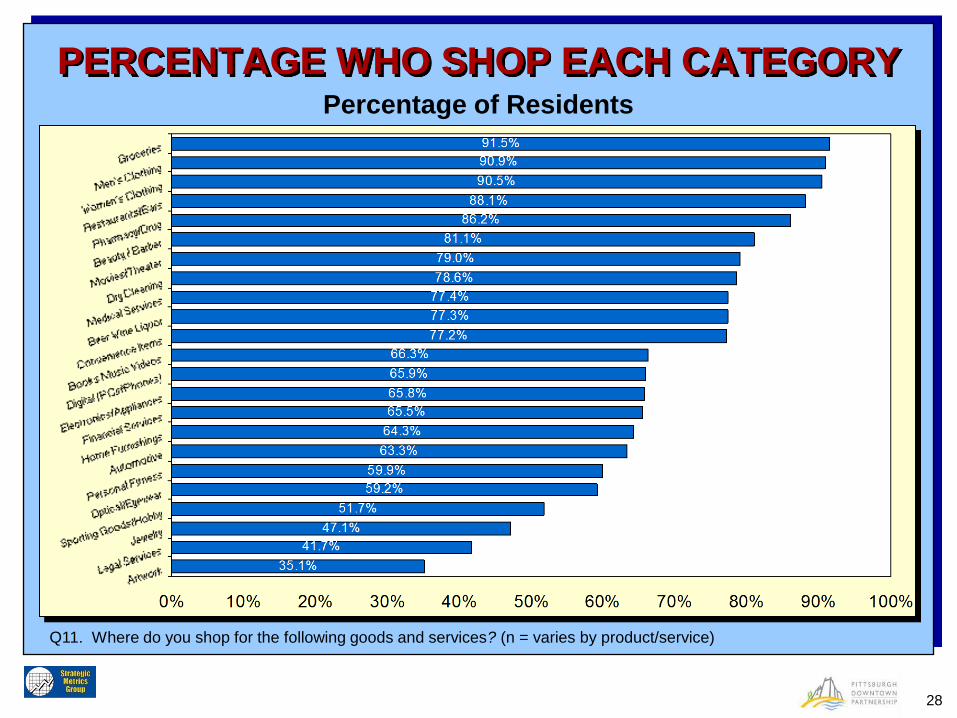
PERCENTAGE WHO SHOP EACH CATEGORY
Q11. Where do you shop for the following goods and services? (n = varies by product/service)
Percentage of Residents

29
SHOP ONLY IN DOWNTOWN
Q11. Where do you shop for the following goods and services? (n = varies by product/service )
53.9%
52.4%
46.6%
44.4%
43.4%
42.2%
37.6%
32.7%
32.3%
24.8%
23.3%
22.6%
18.0%
16.2%
15.8%
11.7%
11.2%
8.5%
8.0%
6.3%
3.4%
51%
16.5%
0% 10% 20% 30% 40% 50% 60% 70% 80%
Restaurants/Bars
Pharmacy/Drug
Convenience Items
Men's Clothing
Financial Services
Personal Fitness
Beauty / Barber
Dry Cleaning
Women's Clothing
Beer Wine Liquor
Medical Services
Optical/Eyewear
Legal Services
Movies/Theater
Digital (PCs/Phones)
Jewelry
Groceries
Artwork
Books Music Videos
Automotive
Electronics/Appliances
Home Furnishings
Sporting Goods/Hobby
6 Core Downtown Categories:
Restaurants / Bars
Pharmacy / Drug
Convenience Store Items
Men’s Clothing
Financial Services
Personal Fitness
The 6 Downtown categories have 40% +
shares of Downtown Only shopping and
low relative % shares of Suburbs Only
shopping
% of Residents Who Shop Exclusively in Downtown for Category
30
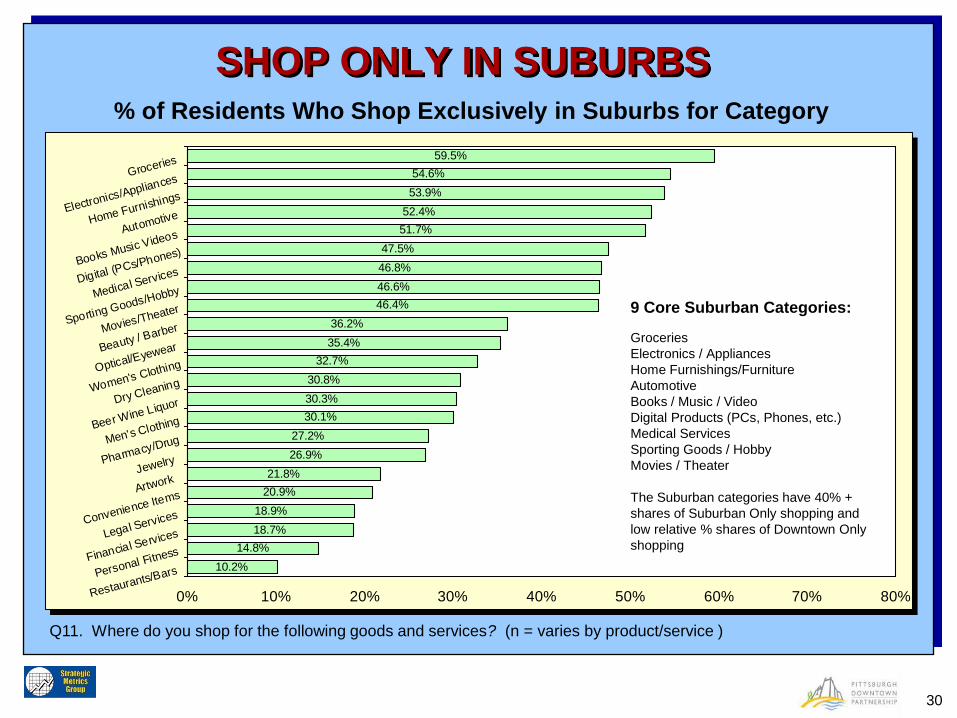
SHOP ONLY IN SUBURBS
Q11. Where do you shop for the following goods and services? (n = varies by product/service )
59.5%
54.6%
53.9%
52.4%
51.7%
47.5%
46.8%
46.6%
46.4%
36.2%
35.4%
32.7%
30.8%
30.3%
30.1%
27.2%
26.9%
21.8%
20.9%
18.9%
18.7%
14.8%
10.2%
0% 10% 20% 30% 40% 50% 60% 70% 80%
Groceries
Electronics/Appliances
Home Furnishings
Automotive
Books Music Videos
Digital (PCs/Phones)
Medical Services
Sporting Goods/Hobby
Movies/Theater
Beauty / Barber
Optical/Eyewear
Women's Clothing
Dry Cleaning
Beer Wine Liquor
Men's Clothing
Pharmacy/Drug
Jewelry
Artwork
Convenience Items
Legal Services
Financial Services
Personal Fitness
Restaurants/Bars
9 Core Suburban Categories:
Groceries
Electronics / Appliances
Home Furnishings/Furniture
Automotive
Books / Music / Video
Digital Products (PCs, Phones, etc.)
Medical Services
Sporting Goods / Hobby
Movies / Theater
The Suburban categories have 40% +
shares of Suburban Only shopping and
low relative % shares of Downtown Only
shopping
% of Residents Who Shop Exclusively in Suburbs for Category
31
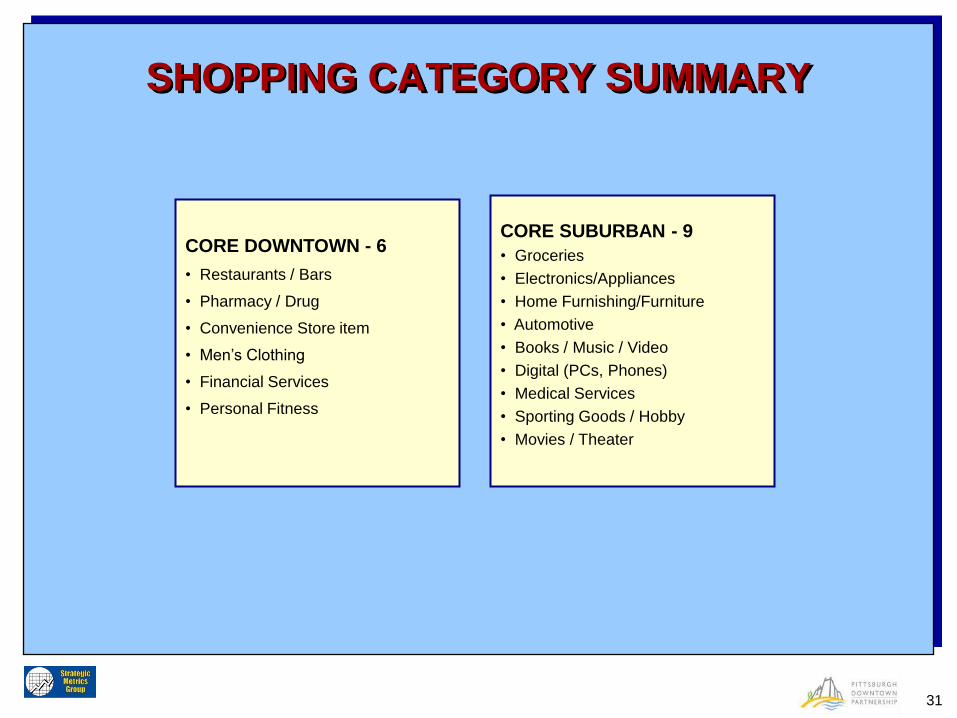
SHOPPING CATEGORY SUMMARY
CORE DOWNTOWN - 6
• Restaurants / Bars
• Pharmacy / Drug
• Convenience Store item
• Men’s Clothing
• Financial Services
• Personal Fitness
CORE SUBURBAN - 9
• Groceries
• Electronics/Appliances
• Home Furnishing/Furniture
• Automotive
• Books / Music / Video
• Digital (PCs, Phones)
• Medical Services
• Sporting Goods / Hobby
• Movies / Theater
32
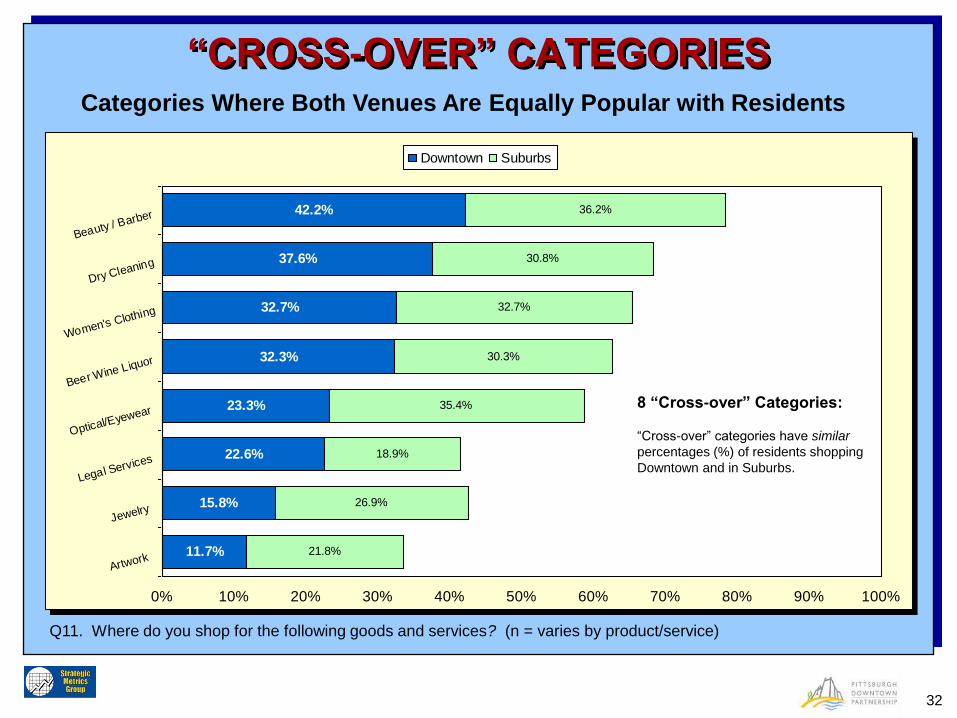
“CROSS-OVER” CATEGORIES
Q11. Where do you shop for the following goods and services? (n = varies by product/service)
42.2%
37.6%
32.7%
32.3%
23.3%
22.6%
15.8%
11.7%
36.2%
30.8%
32.7%
30.3%
35.4%
18.9%
26.9%
21.8%
0% 10% 20% 30% 40% 50% 60% 70% 80% 90% 100%
Beauty / Barber
Dry Cleaning
Women's Clothing
Beer Wine Liquor
Optical/Eyewear
Legal Services
Jewelry
Artwork
Downtown Suburbs
8 “Cross-over” Categories:
“Cross-over” categories have similar
percentages (%) of residents shopping
Downtown and in Suburbs.
Categories Where Both Venues Are Equally Popular with Residents

33
SHOPPING CATEGORY SUMMARY
CORE DOWNTOWN – 6
• Restaurants / Bars
• Pharmacy / Drug
• Convenience Store item
• Men’s Clothing
• Financial Services
• Personal Fitness
CORE SUBURBAN - 9
• Groceries
• Electronics/Appliances
• Home Furnishing/Furniture
• Automotive
• Books / Music / Video
• Digital (PCs, Phones)
• Medical Services
• Sporting Goods / Hobby
• Movies / Theater
“CROSS-OVER” – 8
• Beauty / Barber
• Dry Cleaning
• Women’s Clothing.
• Beer Wine Liquor
• Optical / Eyewear
• Legal Service
• Jewelry
• Artwork
34
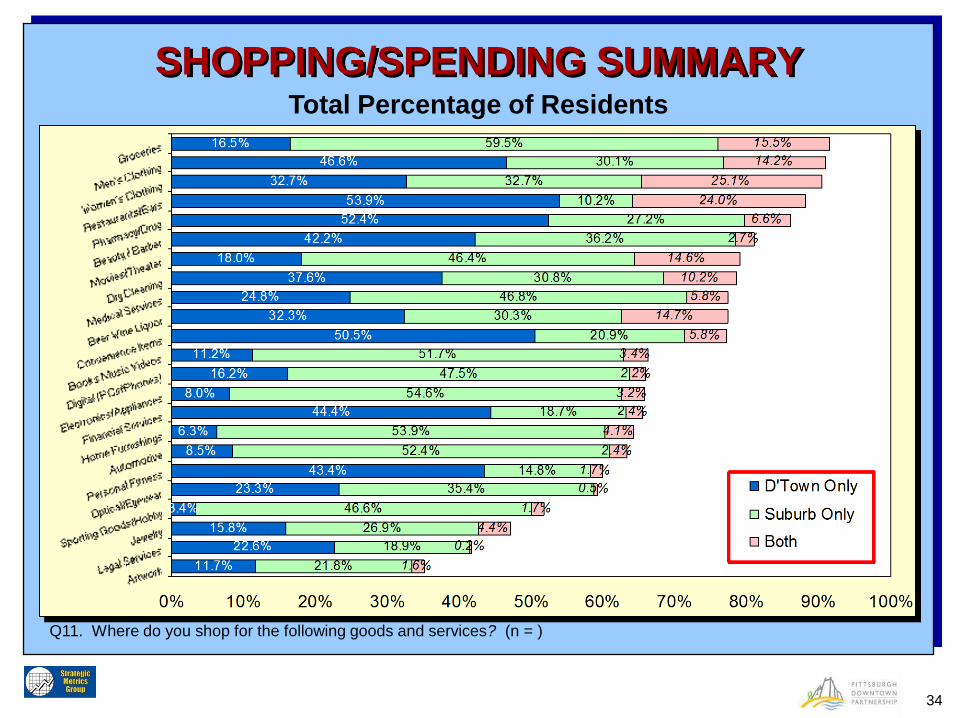
SHOPPING/SPENDING SUMMARY
Q11. Where do you shop for the following goods and services? (n = )
Total Percentage of Residents
35
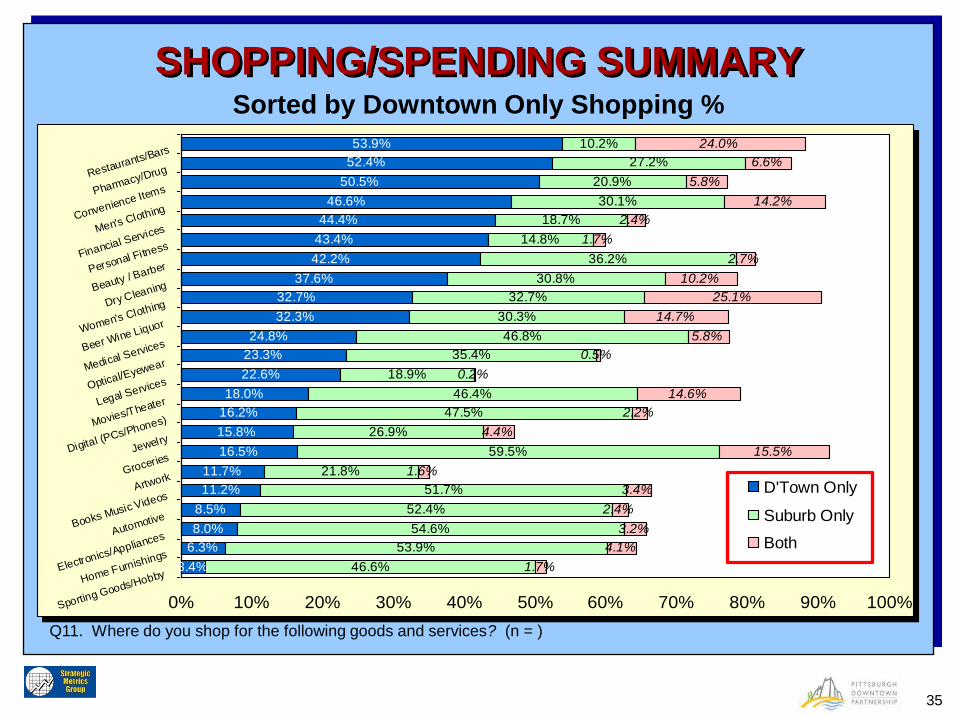
SHOPPING/SPENDING SUMMARY
Q11. Where do you shop for the following goods and services? (n = )
53.9%
52.4%
50.5%
46.6%
44.4%
43.4%
42.2%
37.6%
32.7%
32.3%
24.8%
23.3%
22.6%
18.0%
16.2%
15.8%
16.5%
11.7%
11.2%
8.5%
8.0%
6.3%
3.4%
10.2%
27.2%
20.9%
30.1%
18.7%
14.8%
36.2%
30.8%
32.7%
30.3%
46.8%
35.4%
18.9%
46.4%
47.5%
26.9%
59.5%
21.8%
51.7%
52.4%
54.6%
53.9%
46.6%
24.0%
6.6%
5.8%
14.2%
2.4%
1.7%
2.7%
10.2%
25.1%
14.7%
5.8%
0.5%
0.2%
14.6%
2.2%
4.4%
15.5%
1.6%
3.4%
2.4%
3.2%
4.1%
1.7%
0% 10% 20% 30% 40% 50% 60% 70% 80% 90% 100%
Restaurants/Bars
Pharmacy/Drug
Convenience Items
Men's Clothing
Financial Services
Personal Fitness
Beauty / Barber
Dry Cleaning
Women's Clothing
Beer Wine Liquor
Medical Services
Optical/Eyewear
Legal Services
Movies/Theater
Digital (PCs/Phones)
Jewelry
Groceries
Artwork
Books Music Videos
Automotive
Electronics/Appliances
Home Furnishings
Sporting Goods/Hobby
D'Town Only
Suburb Only
Both
Sorted by Downtown Only Shopping %

36
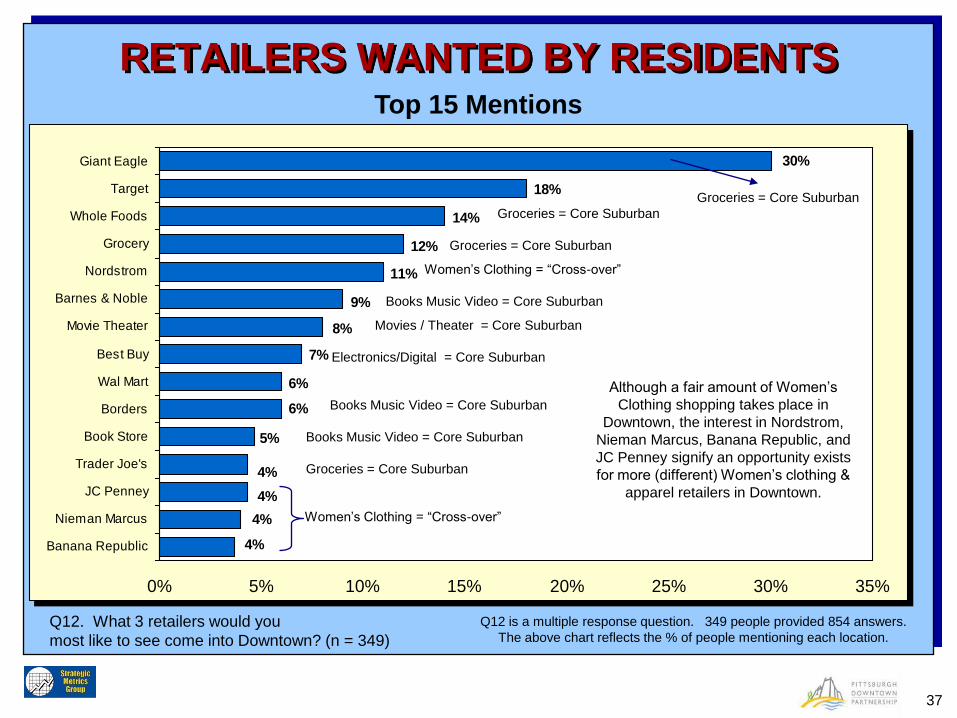
RETAILERS WANTED BY RESIDENTS
7%
6%
6%
5%
4%
4%
4%
4%
8%
9%
11%
12%
18%
30%
14%
0% 5% 10% 15% 20% 25% 30% 35%
Giant Eagle
Target
Whole Foods
Grocery
Nordstrom
Barnes & Noble
Movie Theater
Best Buy
Wal Mart
Borders
Book Store
Trader Joe's
JC Penney
Nieman Marcus
Banana Republic
Q12. What 3 retailers would you
most like to see come into Downtown? (n = 349)
Q12 is a multiple response question. 349 people provided 854 answers.
The above chart reflects the % of people mentioning each location.
Top 15 Mentions
As might be expected, most of the top
15 retailers mentioned fall into retail
categories classified as “Suburban” or
“Cross-over” (see previous charts).
Residents desire the kinds of stores in
downtown that they currently patronize
out in the suburbs.
37
RETAILERS WANTED BY RESIDENTS
7%
6%
6%
5%
4%
4%
4%
4%
8%
9%
11%
12%
18%
30%
14%
0% 5% 10% 15% 20% 25% 30% 35%
Giant Eagle
Target
Whole Foods
Grocery
Nordstrom
Barnes & Noble
Movie Theater
Best Buy
Wal Mart
Borders
Book Store
Trader Joe's
JC Penney
Nieman Marcus
Banana Republic
Q12. What 3 retailers would you
most like to see come into Downtown? (n = 349)
Q12 is a multiple response question. 349 people provided 854 answers.
The above chart reflects the % of people mentioning each location.
Top 15 Mentions
Women’s Clothing = “Cross-over”
Groceries = Core Suburban
Groceries = Core Suburban
Groceries = Core Suburban
Groceries = Core Suburban
Books Music Video = Core Suburban
Books Music Video = Core Suburban
Books Music Video = Core Suburban
Movies / Theater = Core Suburban
Electronics/Digital = Core Suburban
Women’s Clothing = “Cross-over”
Although a fair amount of Women’s
Clothing shopping takes place in
Downtown, the interest in Nordstrom,
Nieman Marcus, Banana Republic, and
JC Penney signify an opportunity exists
for more (different) Women’s clothing &
apparel retailers in Downtown.

38
MOST PATRONIZED
DOWNTOWN BUSINESES
Q11. Write in the specific Downtown store you patronize the
most (measured in dollars spent)? (n = varies by store)
• Artwork: Art festivals, local galleries, Wood Street Framing
• Automotive: Goodyear, Meineke, ZipCar
• Beauty/Barber: Sally Beauty Supply, Luigi Caruso, Brett James Salon, Sognatore
• Beer Wine Liquor: State store, Wine & Spirits, Oxford Center Wine & Spirits
• Books/Music/Video: Barnes & Noble, Library, The Exchange
• Men’s Clothing: Macy’s, Saks, Burlington, Brooks Bros.
• Women’s Clothing: Macy’s, Saks, Burlington
• Convenience Items: CVS, 7-Eleven, Rite Aid, Rosebud
• Digital Products: Radio Shack, Verizon, T-Mobile, Cricket
• Dry Cleaning: Galardi’s, Chuong’s (Gateway T.), “apt. / building service”
• Electronics/Appliances: Macy’s, Radio Shack, The Exchange
• Financial Services: PNC, Citizens Bank, National City, Dollar Bank
39
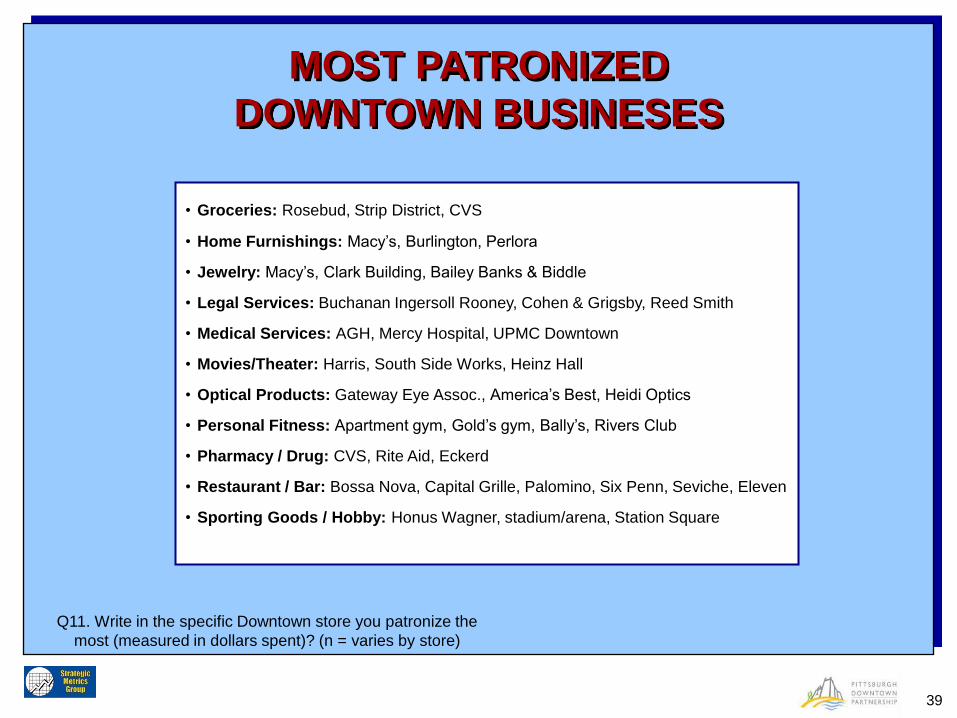
Q11. Write in the specific Downtown store you patronize the
most (measured in dollars spent)? (n = varies by store)
• Groceries: Rosebud, Strip District, CVS
• Home Furnishings: Macy’s, Burlington, Perlora
• Jewelry: Macy’s, Clark Building, Bailey Banks & Biddle
• Legal Services: Buchanan Ingersoll Rooney, Cohen & Grigsby, Reed Smith
• Medical Services: AGH, Mercy Hospital, UPMC Downtown
• Movies/Theater: Harris, South Side Works, Heinz Hall
• Optical Products: Gateway Eye Assoc., America’s Best, Heidi Optics
• Personal Fitness: Apartment gym, Gold’s gym, Bally’s, Rivers Club
• Pharmacy / Drug: CVS, Rite Aid, Eckerd
• Restaurant / Bar: Bossa Nova, Capital Grille, Palomino, Six Penn, Seviche, Eleven
• Sporting Goods / Hobby: Honus Wagner, stadium/arena, Station Square
MOST PATRONIZED
DOWNTOWN BUSINESES
40
PARKS
& GREEN SPACES

41
DOWNTOWN’S PARKS & OUTDOOR SPACES
53%
53%
48%
47%
41%
38%
38%
58%
60%
64%
68%
90%
90%
79%
Point State Park
Market Square
PPG Plaza
Mellon Square
Gatew ay Center Park
Allegheny Riverfront Park
Four Gatew ay Center Plaza
PNC Firstside Park
Plaza at Oxford Center
Courtyard @ Cty Courthouse
Katz Plaza
Mellon Green
Dominion Plaza
Ft. Duq. Blvd. & 10th St. bypass
Q18. Please (a) check if you are familiar with each green space/outdoor area listed (know where it is)
and (b) how many times you have visited/used each area in the past year. (n = 411)
Avg # Visits Past Year
21
40
24
5
54
26
22
12
8
6
37
9
15
12
% Familiar with Downtown Area
Familiarity and Usage

42
LIKELIHOOD TO USE DOG PARK
72%
4%2% 1% 3% 2% 3% 2%
13%
0%
10%
20%
30%
40%
50%
60%
70%
80%
1 2 3 4 5 6 7 8 9
Pe
rcen
t o
f R
esid
en
ts
1 = Not Likely at All; 9 = Very Likely
Not Likely At All Very Likely
Average
2.6
Overall Average Score = 2.6
Residents who own dogs = 7.4
Residents who do not own dogs = 1.9
Q19. If a small off-leash dog park was established near
Gateway Center, how likely would you be to use it? (n = 390)

43
EVENTS
&
PROGRAMMING
44
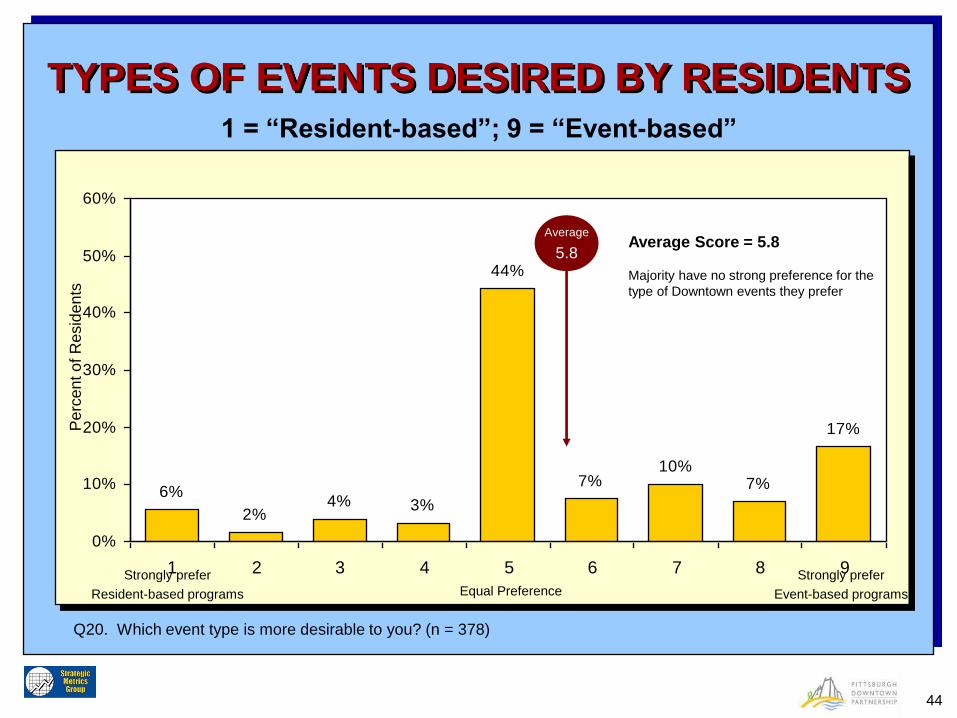
TYPES OF EVENTS DESIRED BY RESIDENTS
6%
2%4% 3%
44%
7%10%
7%
17%
0%
10%
20%
30%
40%
50%
60%
1 2 3 4 5 6 7 8 9
Pe
rcen
t o
f R
esid
en
ts
Q20. Which event type is more desirable to you? (n = 378)
1 = “Resident-based”; 9 = “Event-based”
Strongly prefer
Resident-based programs Equal Preference
Strongly prefer
Event-based programs
Average
5.8 Average Score = 5.8
Majority have no strong preference for the
type of Downtown events they prefer

45
EVENTS & PROGRAMS DESIRED
BY DOWNTOWN RESIDENTS
Q21. What specific types of events programs would you like to see made available
(or see more often) for you in your Downtown neighborhood? (n = 214)
Q21 is a multiple response question.
214 people provided 343 answers. Shown above
the % of people mentioning each type of event.
6%
6%
5%
3%
2%
8%
9%
10%
10%
12%
36%
11%
0% 10% 20% 30% 40%
Concerts / Live Music
Food Fairs / Wine Tasting
Arts Festivals
Movies / Movie Theater
Happy Hour
"Mixers" / Block Parties
Street Fairs
Book Club
Exercise Class / Athletics
Cooking Classes
Flea Markets
Gallery "Crawl"
46
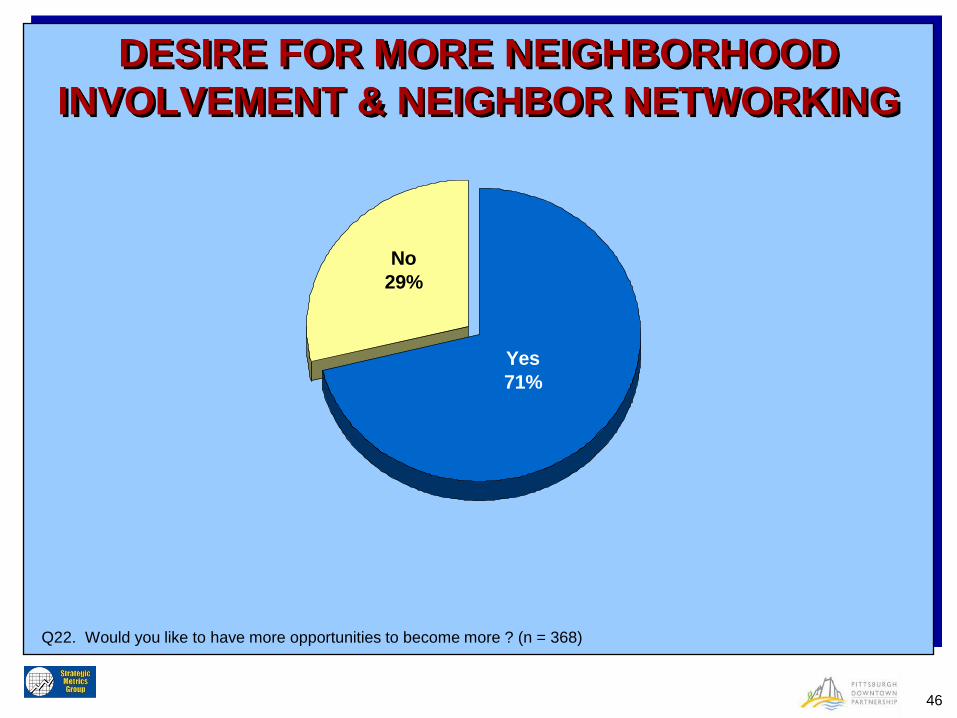
DESIRE FOR MORE NEIGHBORHOOD
INVOLVEMENT & NEIGHBOR NETWORKING
No
29%
Yes
71%
Q22. Would you like to have more opportunities to become more ? (n = 368)
47
TRANSIT ATTITUDES
& USAGE

48
SUGGESTIONS TO IMPROVE PARKING
Q24. If you consider the parking situation for Downtown residents
a problem, please share any ideas you have to improve it. (n = 170)
Q24 is a multiple response question. 170 people provided
196 answers. The above table reflects the % of people
mentioning each idea to improve parking.
4%
3%
3%
5%
5%
5%
7%
13%
43%
8%
0% 10% 20% 30% 40% 50%
Lower the Price/Cost
Need More Spaces/Garages
Create Assigned Spaces
Visitor Discounts
Permits for DT Residents
Reduce/Eliminate Tax
Make Parking Free
Better Security
Build Cost Into Lease/Price
Put Garages in Each Bldg.

49
ADD BUS SERVICE BETWEEN RUSH HOURS
22%
5% 5%
8%
15%
9% 9%
6%
21%
0%
10%
20%
30%
40%
1 2 3 4 5 6 7 8 9
Pe
rcen
t o
f R
esid
en
ts
Q25a. Level of support for enhancing Downtown bus service by adding service between the 2 rush hour periods and
after the evening rush hour peak. (n = 363 )
1 = No support at all; 9 = Very supportive
Overall Level of Support: Neutral
Average Score = 5.1

50
CHANGE BUS ROUTES TO INCREASE
USAGE OF “T” SYSTEM
16%
3%4%
6%
15%
6%
11%9%
30%
0%
10%
20%
30%
40%
1 2 3 4 5 6 7 8 9
Pe
rcen
t o
f R
esid
en
ts
Q25b. Level of support for making bus routing changes that increase the usage of Downtown’s T system. (n = 356)
1 = No support at all; 9 = Very supportive
Overall Level of Support: Neutral
Average Score = 5.9

51
CREATE NEW LABELING SYSTEM FOR BUSES
AND BUS ROUTES
10%
2%3%
4%
11%
5%
14%12%
39%
0%
10%
20%
30%
40%
1 2 3 4 5 6 7 8 9
Pe
rcen
t o
f R
esid
en
ts
Q25c. Level of support for developing and implementing a new bus “labeling” system that makes the bus system
easier to comprehend than the current one. (n = 365)
1 = No support at all; 9 = Very supportive
Overall Level of Support: High
Average Score = 6.7
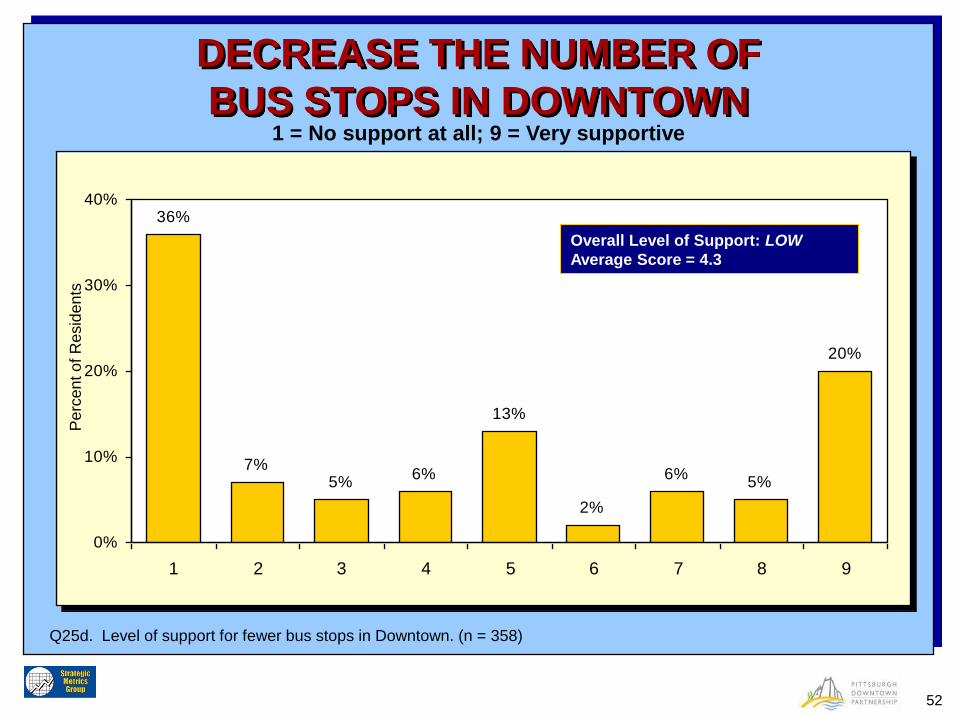
52
DECREASE THE NUMBER OF
BUS STOPS IN DOWNTOWN
36%
7%5%
6%
13%
2%
6%5%
20%
0%
10%
20%
30%
40%
1 2 3 4 5 6 7 8 9
Pe
rcen
t o
f R
esid
en
ts
Q25d. Level of support for fewer bus stops in Downtown. (n = 358)
1 = No support at all; 9 = Very supportive
Overall Level of Support: LOW
Average Score = 4.3

53
SUMMARY OF SUPPORT FOR
BUS SYSTEM CHANGES
6.7
5.9
5.1
4.3
1
2
3
4
5
6
7
8
9
New Bus Labeling Change Bus to Increase
"T" Usage
Add Bus Service
Between Rush
Decrease # Bus Stops
in Downtown
1 = No support at all; 9 = Very supportive
54
CAR SHARING
55
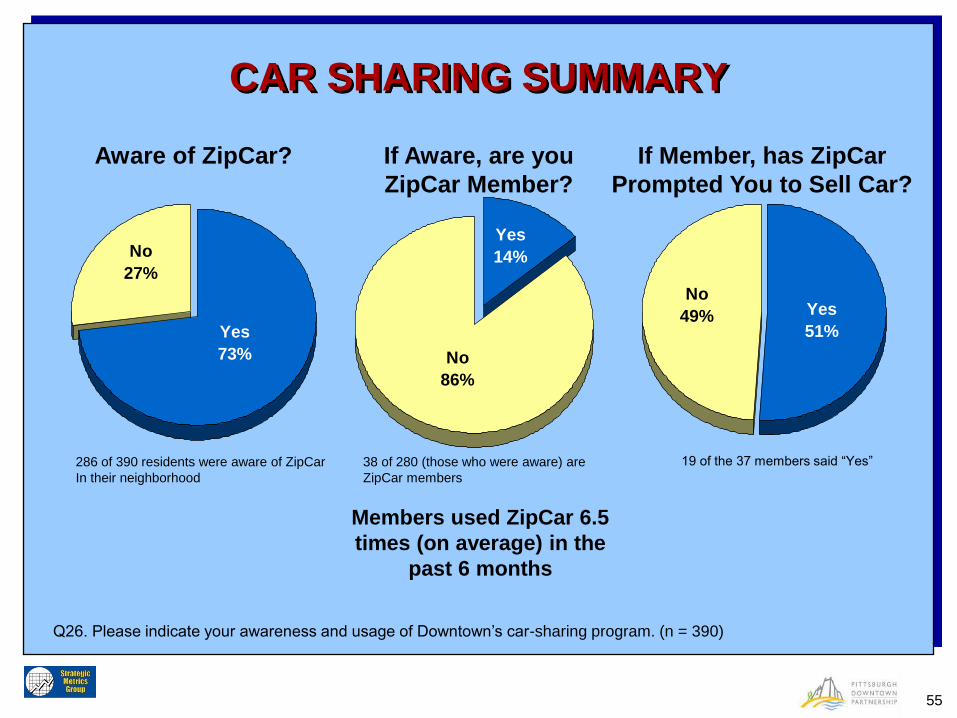
CAR SHARING SUMMARY
No
27%
Yes
73%
Q26. Please indicate your awareness and usage of Downtown’s car-sharing program. (n = 390)
No
86%
Yes
14%
Yes
51%
No
49%
Aware of ZipCar? If Aware, are you
ZipCar Member?
If Member, has ZipCar
Prompted You to Sell Car?
286 of 390 residents were aware of ZipCar
In their neighborhood
38 of 280 (those who were aware) are
ZipCar members
19 of the 37 members said “Yes”
Members used ZipCar 6.5
times (on average) in the
past 6 months

56
MOTIVATION TO TRY CAR SHARING
OR USE IT MORE OFTEN
Q26e. What would motivate you to try or use
the ZipCar service more often? (n = 142)
• Nothing 26.8%
• Cheaper rates 13.4%
• I have my own car (nothing) 7.0%
• Nothing - I don't drive 6.3%
• Eliminate the county tax 5.6%
• More availability 5.6%
• Free trial 4.2%
• If I had a need 4.2%
• If I didn't have a car 3.5%
• More information 2.8%
• If it were cheaper than owning a car 2.8%
• If I worked downtown 2.1%
• Raise the age limit 2.1%
• Need to know the system & cars are reliable 2.1%
• If my car breaks down 1.4%
• when I retire 1.4%
• Will use when my car lease expires 1.4%
• Will use when my son is able to drive 1.4%
• If gas prices go up 0.7%
• If Zip Cars had tow hitches 0.7%
• Longer usage times 0.7%
• When my car dies 0.7%
• If I could leave it at the airport 0.7%
• If I didn't have indoor parking 0.7%
• More help with customer service 0.7%
• Increase in parking cost & decrease
usage of my car 0.7%

57
SUMMARY
COMMENTS

58
66% of Downtown residents lived in Allegheny County or bordering counties prior to moving Downtown. 24% previously lived outside of Pennsylvania.
22% own their Downtown residence – 78% currently rent.
A wide age range in sample - the single largest group is 25-29 yrs. old.
All income levels represented in sample - however income skews higher than comparable national, Allegheny County, or City of Pittsburgh measures.
The majority (58%) of Downtown households are 1 person – with an average overall household size of 1.4 people.
The number of married households is equal to the number of single, separated, and divorced households.
Children (<18 yrs.) are present in just 3% of Downtown households.
54% have lived in their Downtown home for 2 years or less. The average length of time is 4.6 years.
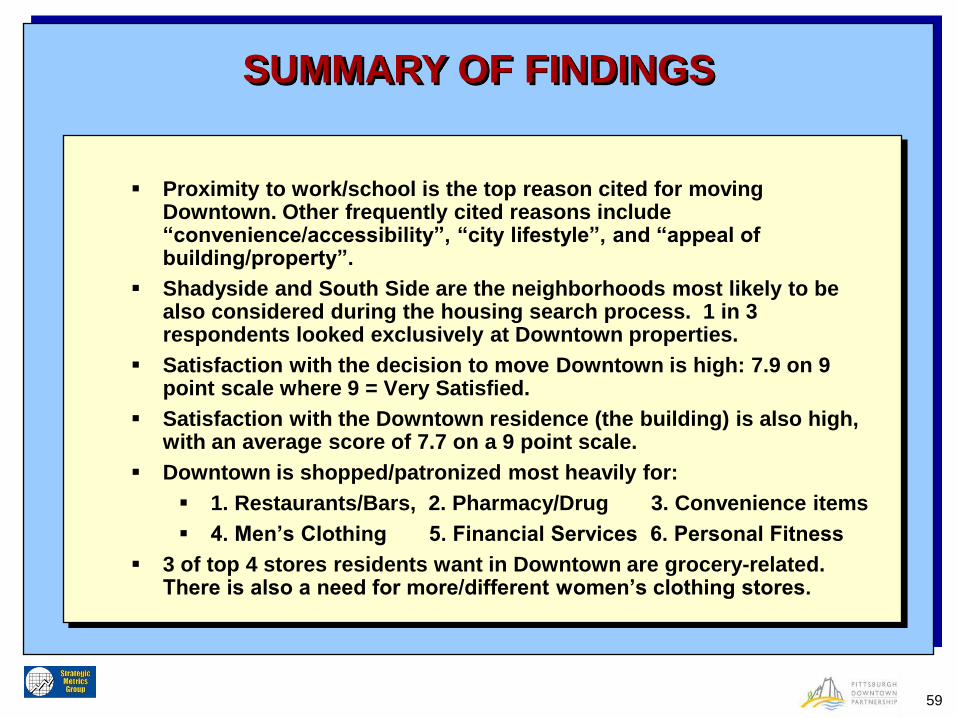
SUMMARY OF FINDINGS
59
Proximity to work/school is the top reason cited for moving Downtown. Other frequently cited reasons include “convenience/accessibility”, “city lifestyle”, and “appeal of building/property”.
Shadyside and South Side are the neighborhoods most likely to be also considered during the housing search process. 1 in 3 respondents looked exclusively at Downtown properties.
Satisfaction with the decision to move Downtown is high: 7.9 on 9 point scale where 9 = Very Satisfied.
Satisfaction with the Downtown residence (the building) is also high, with an average score of 7.7 on a 9 point scale.
Downtown is shopped/patronized most heavily for:
1. Restaurants/Bars, 2. Pharmacy/Drug 3. Convenience items
4. Men’s Clothing 5. Financial Services 6. Personal Fitness
3 of top 4 stores residents want in Downtown are grocery-related. There is also a need for more/different women’s clothing stores.
SUMMARY OF FINDINGS

60
Saturday is the alternative or “other" day most residents would like to see the Farmer’s Market open. Produce, Meat/Seafood, and Dairy products are the goods most wish they could find at the market.
Familiarity with Downtown parks ranges from a high of 90% (Point Park) to a low of 38% (Mellon Green). Number of visits to 14 parks varies greatly by park.
7 of 10 residents do want more opportunities to get involved with their Downtown neighbors and community.
The most desired type of event (to be held in Downtown) is live music/concerts.
A new bus “labeling” system is supported by Downtown residents, while fewer bus stops in Downtown is not.
73% aware of ZipCar - 14% are members – Average 1 use per month.
Residents’ top 3 suggestions to improve parking situation: Lower the cost Create more spaces/garages Create assigned spaces
SUMMARY OF FINDINGS


