148 DPWA Winner 3 rd place NEW DESIGN METHOD OF ARMOUR UNITS COVERING RUBBLE MOUND OF COMPOSITE BREAKWATER AGAINST TSUNAMI OVERFLOW MITSUI JUN Fudo Tetra Corporation e-mail: [email protected]AKIRA MATSUMOTO and MINORU HANZAWA Fudo Tetra Corporation KAZUO NADAOKA Tokyo Institute of Technology, Japan KEYWORDS: tsunami, overflow, armour units, sta- bility, breakwater, design method MOTS-CLES: tsunami, surverse, éléments de car- apaces, stabilité, digue, méthode de dimension- nement 1. INTRODUCTION Numerous composite breakwaters were severely damaged in the 2011 Off the Pacific Coast of To- hoku Earthquake Tsunami. One of the causes of failure was scouring of the rubble foundation and subsoil at the harbour-side of breakwaters due to overflow. This was a formerly inconceivable type of failure [Ministry of Land, Infrastructure, Transport and Tourism, 2013]. After this disaster, it became necessary to consider resilience against tsunamis. One possible method was a placement of wid- ened protection using additional rubble stones behind the breakwater to prevent sliding of the caisson. Figure 1: Countermeasure against tsunami of breakwaters Installing armour units on the rubble mound on the harbour-side would also be required to pre- vent scouring around the rubble mound (Figure 1). However, there are as yet few studies on the stability of armour units against tsunami overflow. 1.1 Conventional Estimation Method of the Required Mass of Armour Units The Isbash formula [Coastal Engineering Research Centre, 1977] has been applied previously as the method to estimate the required mass of armour units against tsunamis. This formula is expressed as follows: (1) where, M is the mass of the armour unit, ρ r is the density of the armour unit, U is the flow velocity near the armour unit, g is the gravitational accel- eration, y is the Isbash constant, S r is the specific gravity of the armour unit with respect to water, and θ is the angle of slope. The required mass cal- culated by this formula is proportional to the sixth power of the flow velocity. This causes a practi- cal problem that the required mass is too sensitive to variations in the estimated flow velocity. Also, it requires a lot of labour and time to obtain the flow velocity by numerical computation. In addi- tion, the Isbash constant is required to be set prop- erly because the required mass varies in inverse proportion to the sixth power of the Isbash con- stant. For concrete blocks, y = 1.08 has been ap- plied previously regardless of the kind of the block shape. This value was based on experiments using
Transcript
148
DPWA Winner 3rd place
NEW DESIGN METHOD OF ARMOUR UNITS COVERING RUBBLE MOUND OF COMPOSITE BREAKWATER AGAINST
MOTS-CLES: tsunami, surverse, éléments de car-apaces, stabilité, digue, méthode de dimension-nement
1. INTRODUCTION
Numerous composite breakwaters were severely damaged in the 2011 Off the Pacifi c Coast of To-hoku Earthquake Tsunami. One of the causes of failure was scouring of the rubble foundation and subsoil at the harbour-side of breakwaters due to overfl ow. This was a formerly inconceivable type of failure [Ministry of Land, Infrastructure, Transport and Tourism, 2013]. After this disaster, it became necessary to consider resilience against tsunamis. One possible method was a placement of wid-ened protection using additional rubble stones behind the breakwater to prevent sliding of the caisson.
Figure 1: Countermeasure against tsunami of breakwaters
Installing armour units on the rubble mound on the harbour-side would also be required to pre-vent scouring around the rubble mound (Figure 1). However, there are as yet few studies on the stability of armour units against tsunami overfl ow.
1.1 Conventional Estimation Method of the Required Mass of Armour Units
The Isbash formula [Coastal Engineering Research Centre, 1977] has been applied previously as the method to estimate the required mass of armour units against tsunamis. This formula is expressed as follows:
(1)
where, M is the mass of the armour unit, ρr is the density of the armour unit, U is the fl ow velocity near the armour unit, g is the gravitational accel-eration, y is the Isbash constant, Sr is the specifi c gravity of the armour unit with respect to water, and θ is the angle of slope. The required mass cal-culated by this formula is proportional to the sixth power of the fl ow velocity. This causes a practi-cal problem that the required mass is too sensitive to variations in the estimated fl ow velocity. Also, it requires a lot of labour and time to obtain the fl ow velocity by numerical computation. In addi-tion, the Isbash constant is required to be set prop-erly because the required mass varies in inverse proportion to the sixth power of the Isbash con-stant. For concrete blocks, y = 1.08 has been ap-plied previously regardless of the kind of the block shape. This value was based on experiments using
149
tetrapods conducted by Iwasaki et al. (1984), and it is not appropriate to use the same value to all blocks. Moreover, the applicability of the Isbash formula to the tsunami overflow in which a fast flow acts locally on armour units has not been suf-ficiently validated.
In this context, the establishment of a more practi-cal method to determine the mass of armour units is one urgent issue towards the achievement of re-silient breakwaters against tsunamis.
1.2 Aims of this Paper
This paper presents a new design method for ar-mour units, which estimates the stability against tsunami overflow using an overflow depth of tsu-nami instead of a flow velocity. Hydraulic model experiments in a wide range of conditions were conducted to extract key factors for armour sta-bility. Numerical computation was also conduct-ed to investigate the detailed failure mechanism. Empirical formulae were then derived based on these results.
2. HYDRAULIC MODEL EXPERIMENTS
2.1 Experimental Setup
Experiments were conducted in a 50-m long, 1.0-m wide, and 1.5-m deep wave flume, as shown in Fig-ure 2. A horizontal mortar seabed was partitioned into two sections along the length, and a break-water model was installed in one 50-cm wide wa-terway. A submersible pump and discharge port were located on the harbour-side and sea-side of the breakwater model respectively to generate a steady overflow. The capacity of the pump was 4 m3/min. A water level difference was generated between the inside and outside of the breakwa-ter by operating the pump. The height of the sea-side water level could be changed by varying the height of the overflow weir installed on the sea-side of the breakwater model. The height of the overflow weir could be varied in a range of 0 to 50 cm. A vent hole with a diameter of about 25 mm was provided in the partition wall close be-hind the caisson to maintain the space between the caisson and the overflow nappe in ambient atmospheric pressure conditions.
A schematic layout of the breakwater model is shown in Figure 3. The model scale is 1/50. Experi-ments were conducted by changing the shape of the harbour-side rubble mound, the harbour-side water level, and the shape and mass of the armour units. Two kinds of flat-type armour blocks and wave-dissipating blocks shown in Figure 4 were used. The ‘armour block A’ is a recently de-veloped block produced by refining the ‘armour block B’. The large holes in the block have been found to contribute to high stability against wave action due to the reduction of the uplift force
[Hamaguchi et al., 2007 ; Kubota et al., 2008]. The caisson model was made of wood and was fixed with a weight so that it would not be moved by tsunami action since this study was focused on the stability of armour units.
Figure 2: Test setup in the flume
Figure 3: Schematic layout of the tested breakwater
Figure 4: Armour units used in the experiments
The duration time of the steady overflow of tsunami was set to 127 s (15 minutes in the prototype scale) to simulate the actual event observed in Hachi-nohe port during the Tohoku tsunami on March 11, 2011. As it took about 60 s until the water level achieved a steady state from the start of operat-ing the pump, the total operation time of the pump was set to 187 s. The stability limits of the armour units were examined by increasing the overflow depth in increments of 1 cm. The overflow depth was defined as the difference between the sea-side water level (measured at 2 m on the offshore side from the front of the caisson) and the crest height of the caisson. The harbour-side water level was measured at 2 m on the onshore side from the rear surface of the caisson. The section was not rebuilt after tsunami attack with each overflow depth. The number of the moved armour units
150
was counted as an accumulated number. The damage to armour units were defined using the relative damage N0, which is the actual number of displaced units related to the width of one nomi-nal diameter Dn [Van der Meer, 1988]. The nominal diameter Dn is the cube root of the volume of the armour unit. In this study, N0 = 0.3 was applied as the criterion of damage.
2.2 Feature of the Damage by Tsunami Overflow
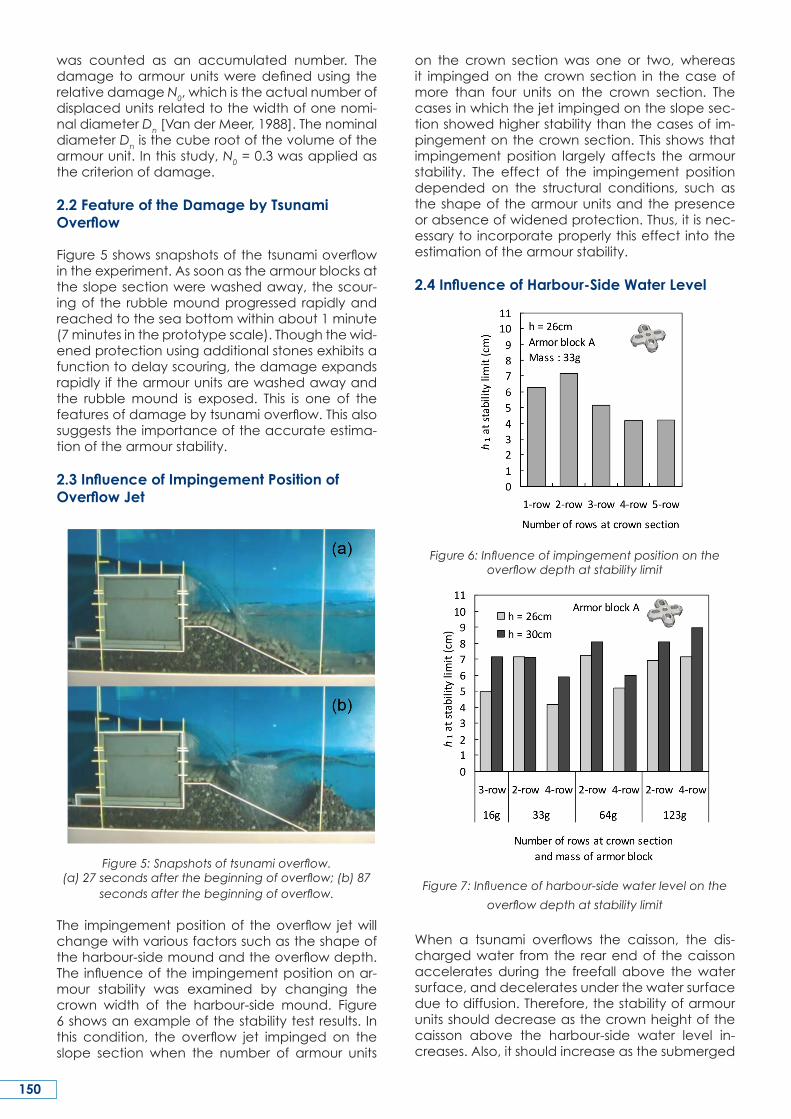
Figure 5 shows snapshots of the tsunami overflow in the experiment. As soon as the armour blocks at the slope section were washed away, the scour-ing of the rubble mound progressed rapidly and reached to the sea bottom within about 1 minute (7 minutes in the prototype scale). Though the wid-ened protection using additional stones exhibits a function to delay scouring, the damage expands rapidly if the armour units are washed away and the rubble mound is exposed. This is one of the features of damage by tsunami overflow. This also suggests the importance of the accurate estima-tion of the armour stability.
2.3 Influence of Impingement Position of Overflow Jet
Figure 5: Snapshots of tsunami overflow. (a) 27 seconds after the beginning of overflow; (b) 87
seconds after the beginning of overflow.
The impingement position of the overflow jet will change with various factors such as the shape of the harbour-side mound and the overflow depth. The influence of the impingement position on ar-mour stability was examined by changing the crown width of the harbour-side mound. Figure 6 shows an example of the stability test results. In this condition, the overflow jet impinged on the slope section when the number of armour units
on the crown section was one or two, whereas it impinged on the crown section in the case of more than four units on the crown section. The cases in which the jet impinged on the slope sec-tion showed higher stability than the cases of im-pingement on the crown section. This shows that impingement position largely affects the armour stability. The effect of the impingement position depended on the structural conditions, such as the shape of the armour units and the presence or absence of widened protection. Thus, it is nec-essary to incorporate properly this effect into the estimation of the armour stability.
2.4 Influence of Harbour-Side Water Level
Figure 6: Influence of impingement position on the overflow depth at stability limit
Figure 7: Influence of harbour-side water level on the
overflow depth at stability limit
When a tsunami overflows the caisson, the dis-charged water from the rear end of the caisson accelerates during the freefall above the water surface, and decelerates under the water surface due to diffusion. Therefore, the stability of armour units should decrease as the crown height of the caisson above the harbour-side water level in-creases. Also, it should increase as the submerged
151
depth above the armour units increases. Figure 7 shows a comparison of the stability test results with two different harbour-side water levels. On the whole, the results of deep-water cases showed higher stability than those of shallow-water cases.
Figure 8: Relationship between the nominal diameter and the overflow depth at the occurrence of damage
by each failure mode
2.5 Failure Modes of Armour Units
Two failure modes for flat-type armour blocks were observed in the experiments. One was an over-turning mode in which armour blocks near the im-pingement position overturned. The other was a sliding mode in which all the blocks on the slope section slid together. Figure 8 shows the relation-ship between the nominal diameter of the armour block Dn and the overflow depth h1 on the oc-currence of damage. In the cases of overturning mode, overflow depth at the occurrence of dam-age was almost proportional to the nominal diam-eter Dn. On the other hand, in the cases of sliding mode, it had only small dependence on Dn. These results suggest that enlargement of the block size causes an increase in the acting force as much as the increase in the resistance force with regard to the sliding mode. For the wave-dissipating blocks, almost every failure pattern was that of blocks near the impingement position being displaced individually.
3. NUMERICAL ANALYSIS
As mentioned above, two failure modes were ob-served in the experiments. The failure mechanism was investigated in detail by numerical analysis. First, the computation method of the flow field at the harbour-side of the breakwater was investigat-ed. The method was validated by comparing the measured and computed flow field. The stability of the armour units was then investigated by com-
puting the hydrodynamic force acting on each armour unit.
3.1 Computation Method
With regard to the numerical computation of the tsunami overtopping the caisson, Mitsui et al. (2012) adequately reproduced the laboratory experiment of an impinging bore-like tsunami by using the VOF method implemented in the Open-FOAM (OpenCFD Ltd.) CFD model. In the case of the steady overflow of tsunami, however, compu-tation result using VOF method did not reproduce well due to the excessive entrainment of air into the impinging jet. Bricker et al. (2013) pointed out that this model overestimates the eddy viscosity at the air-water interface, and that it can be improved by neglecting all the turbulence in the air phase. In this study, the overflow jet above the water sur-face and the flow field on the harbour-side were solved separately to avoid excessive entrainment of air. Firstly, the landing position and flow veloc-ity of the overtopped water on the harbour-side water surface were calculated theoretically using some empirical formulae. The flow field under the water surface and the hydrodynamic forces act-ing on each block were then calculated by using a CFD model.
3.2 Calculation of the Trajectory of the Overflow Nappe
This section describes how to calculate the tra-jectory and velocity of the overflow nappe. The definition of each symbol is shown in Figure 9. The overflow discharge per unit width q is calculated by using the Hom-ma formula [Hom-ma, 1940b]:
(2)
where, h1 is the overflow depth. The application condition in this formula is h1/Bc < 1/2. The effect of the approaching velocity u1 can be disregarded if h1/hd < 0.5 [Hom-ma, 1940a]. The water depth above the caisson at the rear end of the caisson h2 and the cross sectional averaged flow velocity u2 are calculated according to Hom-ma (1940a) as shown below.
Figure 9: Definition of the symbols used in the calculation of the trajectory of the overflow nappe
152
Applying the Bernoulli’s theorem to Section I and II yields following relation:
(3)
where, z is the height measured from the top of the caisson, p(z) is the pressure, and u(z) is the flow velocity. The overflow discharge q is obtained by integrating the flow velocity u(z) as follows:
(4)
If the pressure distribution p(z) is obtained, h2 can be calculated using Eq. (2) and Eq. (4). The pres-sure distributions were assumed as the following triangle distributions:
(5)
Using Eq. (2), Eq. (4), and Eq. (5), one obtain Eq. (6):
(6)
The relationship between h1 and h2 are solved nu-merically with Newton’s method as follows:
(7)
In this study, the following relationship was used considering its suitability to the experimental re-sults:
(8)
The centre of trajectory of the overtopped water was then obtained under the following assump-tions:
• The overtopped water discharges horizontally from the rear end of the caisson at the flow ve-locity u2 = q/h2.
• The trajectory of the overflow nappe above the water surface is a parabola.
The landing position of the overtopped water on the harbour-side water surface, L0, and the flow velocity u0x, u0z are calculated as follows:
(9)
(10)
The width of the water jet at the water surface, h0, is calculated as:
(11)
3.3 Calculation of the Flow Field under the Water Surface
The flow field under the water surface on the har-bour-side was solved by a single-phase numerical model. An incompressible flow solver within the OpenFOAM was used. The governing equations were the Reynolds-Averaged Navier-Stokes (RANS) equation and the continuity equation. The Finite Volume Method with an unstructured grid was used to reproduce the complicated shape of the armour blocks. The computational domain shown in Figure 10 was cross-sectional 2-dimensions, and the standard grid size was set to 2 mm. In the cases of computing the hydrodynamic forces acting on the armour blocks, the grid was subdivided into 3 dimensions. The grid size around the block was set to about 1 mm so that the block shapes could be reproduced in detail.
Figure 10: Computation method of the flow field under the water surface
The landing position of the overtopped water L0
and the flow velocity ux0, uz0 at the harbour-side water surface were given as boundary conditions. These values were obtained by preliminary calcu-lation as shown in the previous section. The water surface on the harbour-side was assumed as a fixed boundary. The rubble mound was modelled as a porous structure to reproduce the seepage flow under the caisson. The hydraulic flow resis-tance R in the porous medium was expressed by a Dupuit-Forchheimer relationship as shown below:
(12)
where, U is the flow velocity vector, α is the lami-nar resistance coefficient, and β is the turbulent resistance coefficient. These coefficients were ex-pressed using the empirical formulae by Engelund (1953) as follows:
(13)
153
where, ν is the kinematic viscosity of water, d is the characteristic diameter of the stone, n is the po-rosity, and α0 and β0 are the material constants. The material constants were investigated by the preliminary experiment. The relationship between the pressure difference and the discharge of the seepage was obtained in the experiment, and the constants were determined as α0 = 2,100 and β0 = 1.5. The pressure difference due to the water level difference between the inside and outside of breakwater was given at both ends of the compu-tational domain.
Figure 11: Comparison of measured and computed flow field.h1 = 9 cm
A Reynolds stress model was used as a relatively high accuracy turbulence model among the RANS models, since preliminary computation re-sults showed that the degree of diffusion of the impinging jet was influenced by the turbulence model. The Reynolds stress model improved the diffusion of the jet comparing to the result with a standard k-ε turbulence model. Also there was a problem that excessive turbulence was generat-ed at the surface of the rubble mound when the jet flowed along the rubble mound. In this study, the turbulence inside the rubble mound was set to zero as a countermeasure for this problem. Figure 11 shows the comparison of the computed flow field with the measured one in a steady state. The measured data was obtained by using an elec-tromagnetic current meter, and was averaged for 20 seconds. The computed result with the coun-termeasures mentioned above adequately repro-duced the measured flow field.
3.4 Stability Analysis of Armour Blocks against Overturning Mode
The stability of the armour blocks was analysed, based on the fluid force acting on each block. An
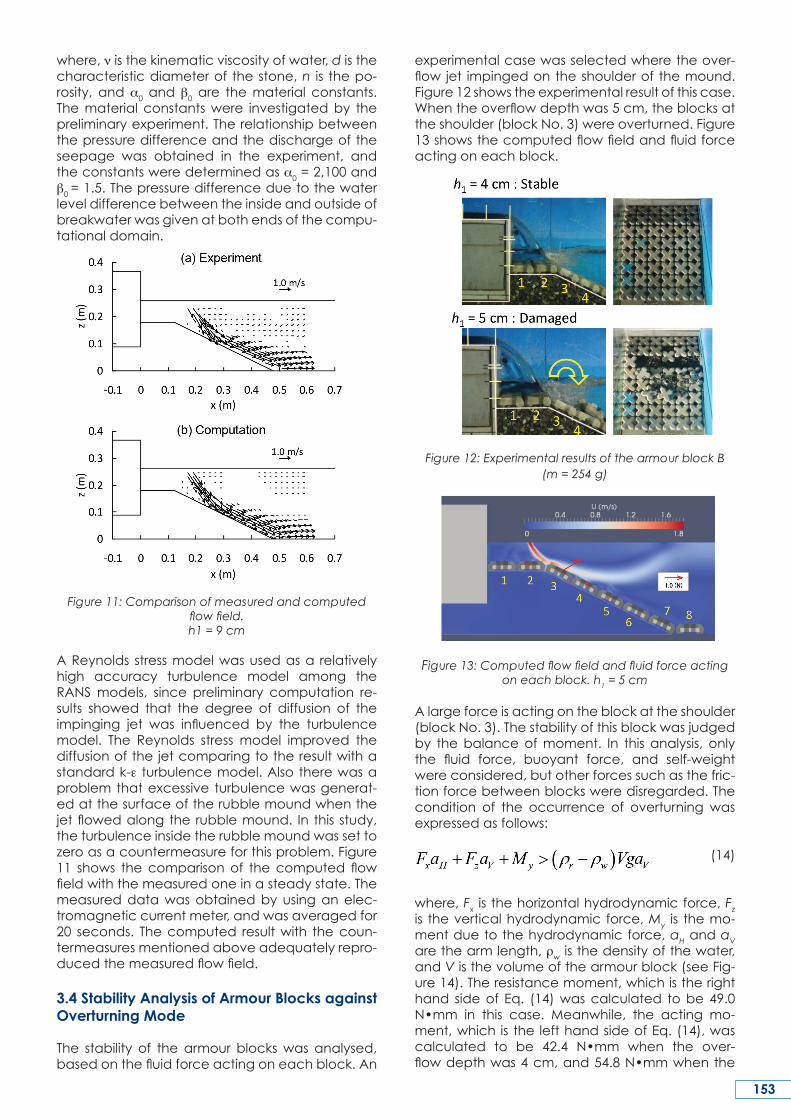
experimental case was selected where the over-flow jet impinged on the shoulder of the mound. Figure 12 shows the experimental result of this case. When the overflow depth was 5 cm, the blocks at the shoulder (block No. 3) were overturned. Figure 13 shows the computed flow field and fluid force acting on each block.
Figure 12: Experimental results of the armour block B (m = 254 g)
Figure 13: Computed flow field and fluid force acting on each block. h1 = 5 cm
A large force is acting on the block at the shoulder (block No. 3). The stability of this block was judged by the balance of moment. In this analysis, only the fluid force, buoyant force, and self-weight were considered, but other forces such as the fric-tion force between blocks were disregarded. The condition of the occurrence of overturning was expressed as follows:
(14)
where, Fx is the horizontal hydrodynamic force, Fz is the vertical hydrodynamic force, My is the mo-ment due to the hydrodynamic force, aH and aV are the arm length, ρw is the density of the water, and V is the volume of the armour block (see Fig-ure 14). The resistance moment, which is the right hand side of Eq. (14) was calculated to be 49.0 N•mm in this case. Meanwhile, the acting mo-ment, which is the left hand side of Eq. (14), was calculated to be 42.4 N•mm when the over-flow depth was 4 cm, and 54.8 N•mm when the
154
overflow depth was 5 cm. Thus, this result agreed with the experimental one. Further validation is re-quired, but this analysis suggested that the failure of the armor units in the overturning mode could be explained by the balance of the moment act-ing on the block.
Figure 14: Definition of the symbols used for the analysis of the balance of moment of the block
3.5 Stability Analysis of Armour Blocks against Sliding Mode
The stability of armour blocks against sliding mode was examined. An example of computed flow field and hydrodynamic force acting on each block is shown in Figure 15. A large force in the tangential direction of the mound is acting on the block No.5 which locates near the impingement position of the overflow jet. Also, a large force is acting on the block No. 11 which locates at the toe of the mound. The stability of the armour blocks was in-vestigated using these forces.
Figure 15: Computed flow field and fluid force acting on each block. Armour block A (m = 33 g), h1 = 6 cm.
Table 1: Computed sliding force and resistance force of each block.
Firstly, a balance of force in the normal direction of the mound was considered for each block. The condition where the block uplifts is expressed as follows:
(15)
where, Ni is the hydrodynamic force in the normal direction acting on i th block, W’ is the underwater weight of the block. If the block does not uplift, the difference between the left and right side of Eq. (15) becomes the reaction force from the mound, Ri.
A balance of the total tangential force of all the blocks located below the impingement position was then considered. The condition where the blocks slides is expressed as follows:
(16)
where, Ti is the hydrodynamic force in the tangen-tial direction acting on i th block, μi is the friction coefficient. The resistance due to the interlocking between the block and stones was included in the friction force. The friction coefficient of each block was determined by tuning. The coefficient of the block at the toe of the mound was set to 0.6 regardless of the block shape as the block at the toe was placed on the mortal seabed in the ex-periments. The left and right side of Eq. (16) show the total sliding force and the total resistance force, respectively. Computed sliding force and resistance force of each block are shown in Table 1. The sliding forces are larger than the resistance forces for the blocks No. 5 to No. 7 which locate near the impingement position and the block No. 11 at the toe, meanwhile the resistance forces are larger for the other blocks. Therefore, the stability against sliding should be judged by the balance of the total force of the blocks No.5 to No. 10. The total sliding force was calculated to be 0.952 N and the total resistance force was calculated to be 0.753 N, which means sliding occurs in this cal-culation. Actually, the blocks on the slope section did not slide in the experiment where the overflow depth was 6 cm, though the blocks at the toe slid. When the overflow depth was 8 cm, all the blocks below the impingement position slid together (Fig-ure 16).
Figure 16: Failure situation of the armour block A (m = 33 g). h1 = 8 cm
155
Figure 17 shows a comparison of the computed and experimented overflow depth at the occur-rence of damage. The computed results almost agreed with the experimental ones. Therefore, this analysis suggested that the failure of the armour units in the sliding mode could be explained by the balance of the total force of the blocks on the slope section.
Figure 17: Comparison of the computed and experimented overflow depth at the occurrence
of damage
4. STABILITY ESTIMATION METHOD
4.1 Derivation of Stability Formulae
Empirical formulae were developed based on the findings of experiments and numerical analy-sis mentioned above. In this method, the overflow depth h1 was used in the formulae to represent the external force. The overflow depth of the stability limit corresponding to each failure mode was ob-tained by two formulae. The final stability limit was determined by the severer one. The formulae for the overturning mode and sliding mode are ex-pressed as follows:
Overturning mode :
(17)
Sliding mode :
(18)
where, S is the slope length of the harbour-side rub-ble mound, NS1 and NS2 are the stability numbers, B is the crown width of the harbour-side mound, L is the impingement position of the overflow jet, d1 is the crown height of the caisson above the harbour-side water level, and d2 is the submerged depth above the armour units (regarding the defi-nition of symbols, see Figure 3). The impingement position L is calculated assuming that the trajec-
tory of the water below the water surface is a straight line:
(19)
in which u0x, u0z, and L0 are calculated by the meth-od mentioned in the section 3.2. Stability numbers NS1 and NS2 are functions of B/L and d2/d1, which are the parameters representing the influence of the impingement position and the harbor-side water level respectively. The stability is determined only by Eq. (17) if B/L is larger than 1.1 since failure by sliding mode does not occur when the over-flow jet impinges on the crown section. Similarly, the stability of wave-dissipating blocks is also de-termined only by Eq. (17).
Figure 18: Influence of B/L on NS1
Figure 19: Influence of d2/d1 on NS1
For the overturning mode, the overflow depth h1 represents the acting force on armour units, whereas the nominal diameter of armour units Dn represents the resistance force as shown in Eq. (17). For the sliding mode, on the other hand, the slope length S is used to represent the resistance force as shown in Eq. (18). This is because the resistance force should be represented by the total length of the blocks on the slope as the whole blocks on the slope section slide together in the sliding mode. As a result, the overflow depth of the stability limit in the sliding mode is not dependent on the block size as can be seen from Eq. (18), whereas, that
156
in the overturning mode is proportional to the block size. This corresponds with the experimental results described above (see Figure 8).
4.2 Determination of Stability Numbers
The stability numbers NS1 and NS2 for each block were determined through experimental results. Figure 18 shows the influence of the impinge-ment position by plotting the stability number NS1 against B/L. The conditions of water depth are al-most at the same level (d2/d1 = 0.47 to 0.66). The damage data with sliding mode is excluded in the figure to reveal the stability limit of overturning mode. The stability limit is expressed in a single line as a function of B/L regardless of the mass of the block. Also, the difference in the stability due to the impingement position appears clearly. Figure 19 shows the influence of the harbour-side water depth by plotting the NS1 against d2/d1. The data on the conditions of B/L > 1.0 is used. The stability tends to increase as d2/d1 increases.
Figure 20: Stability numbers for flat-type armour blocks
Figure 20 shows the stability numbers NS1 and NS2 for flat-type armour blocks determined through all the test results. Different lines are used accord-ing to the B/L in Figure 20(a). When B/L is between
0.8 and 1.0, the value is obtained by linear inter-polation. The stability of the ‘armour block A’ is higher than that of the ‘armour block B’ for both failure modes. The stability number for the wave-dissipating block is shown in Figure 21. In the case of the wave-dissipating block, the influence of the impingement position was different from the case of the flat-type armour blocks. Namely, the cases in which the jet impinged on the crown section showed higher stability than the cases of impinge-ment on the slope section. This result was reflected in Figure 21.
Figure 21: Stability numbers for wave-dissipating block
4.3 Comparison with Experimental Results
Figure 22 shows a comparison of the estimated overflow depth of stability limit with the damaged overflow depth in the experiments. The estimated results are on the safe side as a whole, and they show good agreement for both failure modes.
Figure 22: Calculated and experimented overflow depth of the stability limit
157
5. CONCLUSIONS To achieve resilient breakwaters against tsunami, a practical design method for armour units to cover a rubble mound at the rear side of a cais-son breakwater against tsunami overflow was de-veloped based on hydraulic model experiments and numerical analysis. The features of this are as follows:
1) The overflow depth is used to represent the ex-ternal force. This enables the estimation of the required mass of the armour units to be done more robustly and easily than in the conven-tional method based on the flow velocity.
2) Two formulae are used corresponding to the two failure modes, overturning and sliding.
3) This method takes into account two important factors for armour stability, namely, influence of the impingement position of overflow jet and the influence of the harbour-side water depth.
The stability numbers NS1 and NS2 for each armour unit were determined through experiments con-ducted in a wide range of conditions. The validity of this method was verified by comparing the esti-mated results with the experimental ones.
REFERENCES
Bricker, J.D., Takagi, H. and Mitsui, J. (2013): “Tur-bulence model effects on VOF analysis of Break-water overtopping during the 2011 Great East Japan Tsunami”, Proceedings of the 2013 IAHR World Congress, Chengdu, Sichuan, China, paper A10153.
Coastal Engineering Research Center (1977): “Shore Protection Manual, U.S. Army Corps of En-gineers”, U.S. Government Printing Office, Vol. II, 7_213-7_216.
Engelund, F. (1953): “On the laminar and turbu-lent flows of ground water through homogeneous sand”, Transactions of the Danish Academy of Technical Sciences, Vol. 3, No. 4.
Hamaguchi, M., Kubota, S., Matsumoto, A., Han-zawa, M., Yamamoto, M., Moritaka, H. and Shi-mosako, K. (2007): “Hydraulic stability of new flat type armor block with very large openings for use in composite breakwater rubble mound pro-tection”, Proceedings of Coastal Structures 2007, ASCE, 116-127.
Hom-ma, M. (1940a): “Discharge coefficient on overflow weir (part-1)”, JSCE Magazine, Civil Engi-neering, Vol. 26, No. 6, 635-645 (in Japanese).
Hom-ma, M. (1940b): “Discharge coefficient on overflow weir (part-2)”, JSCE Magazine, Civil Engi-neering, Vol. 26, No. 9, 849-862 (in Japanese).
Iwasaki, T., Mano, A., Nakamura, T. and Horikoshi, N. (1984): “Experimental study on hydraulic force acting on mound and pre-packed caisson of sub-merged breakwater under steady flows”, Annual Journal of Coastal Engineering, JSCE, Vol. 31, 527-531 (in Japanese).
Kubota, S., Hamaguchi, M., Matsumoto, A., Han-zawa, M. and Yamamoto, M. (2008): “Wave force and stability of new flat type concrete block with large openings for submerged breakwaters”, Proceedings of 31st International Conference on Coastal Engineering, ASCE, 3423-3435.
Ministry of Land, Infrastructure, Transport and Tour-ism, Port and Harbor Bureau (2013): “Design guide-line of breakwaters against tsunami” (in Japa-nese).
Mitsui, J., Maruyama, S., Matsumoto, A. and Han-zawa, M. (2012): “Stability of armor units covering harbor-side rubble mound of composite breakwa-ter against tsunami overflow”, Journal of JSCE, Ser. B2 (Coastal Engineering), Vol. 68, No. 2, I_881-I_885 (in Japanese).
OpenCFD Ltd.: OpenFOAM User Guide version 2.0.1, http://www.openfoam.com
Van der Meer, J.W. (1988): “Stability of cubes, tet-rapods and accropode”, Proceedings of Conf. Breakwaters ’88, 71-80.
158
SUMMARY
This article presents a practical design method of ar-mour units to cover a rubble mound at the rear side of a caisson breakwater against tsunami overfl ow. In this method, the overfl ow depth of tsunami is used to represent the external force. This enables the estima-tion of the required mass of the armour units to be done more robustly and easily than in the conven-tional method based on the fl ow velocity. Hydraulic model experiments were conducted to investigate the armour stability. We found two important factors for armour stability, which were the impingement po-sition of the overfl ow jet and the harbour-side water level. These effects were taken into account in the method. Numerical analysis was also conducted
to investigate the failure mechanism for the failure modes of overturning and sliding. The stability of the armour blocks was evaluated by computing the fl uid force acting on each block. In the case of the over-turning mode, the stability is predicted by the bal-ance of the moment of a block. In the case of the sliding mode, it is necessary to consider the balance of forces of all the blocks on the slope. Empirical for-mulae for the stability estimation were then derived based on the fi ndings from experiments and numeri-cal analysis. The overfl ow depth of the stability limit corresponding to each failure mode was obtained by two formulae. The stability numbers for each ar-mour unit were determined through the experiments. The estimated results by this method agreed well with the experimental ones.
RÉSUMÉ
Cet article présente une méthode pratique de di-mensionnement des éléments de carapace du parement côté terre d’une digue en caissons pour résister à la surverse en cas de tsunami. Dans cette méthode, la hauteur de surverse du tsunami est utili-sée pour représenter la force extérieure. Ceci rend possible une estimation plus robuste et facile de la masse requise pour les éléments de carapace que la méthode conventionnelle basée sur les débits de surverse. Des essais sur modèle hydraulique ont été menés pour tester la stabilité de la carapace. Deux facteurs importants pour la stabilité de la cara-pace ont été mis en évidence, à savoir la position de l’impact du jet de surverse sur le parement aval et la hauteur d’eau côté terre. Ces effets ont été pris en compte dans la méthode de dimensionnement. Des analyses numériques ont également été menées
pour tester les mécanismes de rupture pour la dé-faillance par renversement des blocs et pour la dé-faillance par glissement des blocs. La stabilité des blocs de carapace a été évaluée par le calcul des forces hydrauliques agissant sur chaque bloc. Dans le cas d’une rupture par renversement, la stabilité est évaluée par le calcul de l’équilibre du moment d’un bloc. Dans le cas d’une rupture par glissement, il est nécessaire de considérer l’équilibre des forces sur chaque bloc de la pente. Des formules empiriques pour estimer la stabilité ont ensuite été déduites des résultats de ces essais et simulations numériques. La hauteur de surverse limite de stabilité correspon-dant à chaque mode de rupture est obtenue par deux formules. Les facteurs de stabilité de chaque type d’élément de carapace ont été déterminés au grâce aux essais. Les résultats obtenus par cette mé-thode de dimensionnement concordent bien avec les résultats expérimentaux.
ZUSAMMENFASSUNG
Dieser Artikel präsentiert ein praktisches Bemes-sungsverfahren für Decksteine zur Abdeckung einer Aufschüttung an der Rückseite eines Senkkasten-Wellenbrechers als Schutz gegen Tsunamis. In diesem Verfahren wird die Überströmungstiefe bei einem Tsunami verwendet, um die äußere Kraft darzustel-len. Das ermöglicht eine sicherere und einfachere Schätzung der benötigten Masse der Decksteine als im konventionellen Verfahren, das auf der Fließge-schwindigkeit basiert. Um die Stabilität der Deck-steine zu untersuchen, wurden hydraulische Mod-ellversuche durchgeführt. Es wurden zwei wichtige Faktoren für die Stabilität der Decksteine gefunden: Die Aufprallposition des Überfl utungsstrahls und der hafenseitige Wasserstand. Diese Faktoren wurden im Verfahren berücksichtigt. Um den Versagensmecha-
nismus für die Versagensarten Kippen und Rutschen zu untersuchen, wurden numerische Analyse durch-geführt. Die Stabilität der Decksteine wurde mittels Berechnung der auf jeden Block einwirkenden hy-draulischen Kraft untersucht. Für die Versagensart Kip-pen wird die Stabilität über die Impulsbilanz für einen Block vorhergesagt. Für die Versagensart Rutschen ist es erforderlich, das Kräftegleichgewicht aller Blöcke auf dem Hang zu berücksichtigen. Basierend auf den Ergebnissen der experimentellen und numerischen Analysen wurden dann empirische Formeln für die Stabilitätsberechnung entwickelt. Die kritische Über-strömungstiefe wurde für jede Versagensart mit zwei Formeln ermittelt. Die Stabilitätswerte für jeden Deck-stein wurden in den Experimenten ermittelt. Die mit Hilfe des vorgestellten Verfahrens geschätzten Ergeb-nisse stimmten gut mit denen aus den Experimenten überein.
159
RESÚMEN
Este artículo presenta un método práctico para el diseño de mantos de protección en la cara interi-or de diques de cajones que protegen frente a re-bases derivados de tsunamis. En esta metodología la altura del rebase se usa para representar una fuerza externa. Esto permite que la estimación del peso de las piezas de protección se realice de una forma más robusta y sencilla que mediante el mé-todo tradicional basado en la velocidad de fl ujo. Se han desarrollado modelos físicos para analizar el comportamiento hidráulico del manto. En ellos se han encontrado dos factores de importancia para su estabilidad, como son la dirección del fl u-jo del rebase y el nivel de agua en la cara interior de la estructura. Ambos efectos se han tenido en cuanta en la metodología planteada. También se han llevado a cabo modelos numéricos para evaluar el comportamiento frente a los modos de
fallo de vuelco y deslizamiento. La estabilidad de las piezas del manto se ha evaluado modelizando computacionalmente las fuerzas con que el fl u-jo de agua afecta a cada pieza. En el caso del modo de fallo frente a vuelco, la estabilidad se evalúa a través del equilibrio de momentos que afecta al bloque. En el caso del deslizamiento, es necesario considerar el equilibrio de fuerzas sobre cada bloque del manto. A continuación, se plan-tean fórmulas empíricas para la estimación de las condiciones de estabilidad, basadas en las con-clusiones obtenidas a partir de los modelos físicos y numéricos llevados a cabo. La altura de rebase que provoca unas condiciones de equilibrio límite para cada uno de los modos de fallo considera-dos se obtiene a través de dos formulaciones. Los resultados del método propuesto se ajustan de manera satisfactoria a los obtenidos a través de modelos experimentales.