25
The hydrogen option as a carbon free energy carrier Dr. Andreas Opfermann Head of Technology & Innovation Management Ludwigshafen, 10 th of March 2015
The hydrogen option as a
carbon free energy carrier
Dr. Andreas Opfermann
Head of Technology & Innovation Management
Ludwigshafen, 10th of March 2015

2
The Linde Group
The Linde Group (in € million) 2013 2012 Change
Revenue 16,655 15,833 5.2%
Operating profit1 3,966 3,686 7.6%
Operating margin 23.8% 23.3% +50 bp2
EBIT 2,171 2,055 5.6%
Profit for the year 1,430 1,341 6.6%
Number of employees as at 31.12. 63,487 62,765 1.2%
2

3
BASF and Linde: partners for more than 100 years
BASF SE
PAST PRESENT
plant Ludwigshafen & historic logo with bavarian lion
plant Höllriegelskreuth and historic logo
100 years of
BUSINESS PARTNERSHIP
Steam Methane Reforming Plant
in Ludwigshafen
(contracted 2008)
One of several Watergas-Plants
(contracted 1910)

Linde with wide portfolio of energy topics in its business
and technology portfolio
4
Hydrogen as fuel
Photo-voltaic
Clean coalN2 EOR
Fossil (gaseous)
BaseloadLNG
OxyFuel
FloatingLNG
Refinery Hydrogen
Biomass conv.
GreenHydrogen
Renewable
CO2 EOR
LPG
Unconv. gas
NGProcess.
Merchant LNG
GTL
Fossil (liquid, solid)
PCC
CO2 networks
Energy value chain
Energy conversion
Energy transport,storage and usage
Feed
stock
Energy storage
NRU
Geo-thermal
Solar-thermal
Heat recovery
Energy extraction
Cogene-ration
Wind energy

55
De-carbonisation of energy carriers in history
CO2 ratio
Industrialisation Tomorrow
Coal Crude oil Natural gas Hydrogen
C/H
ratio approx. 2 approx. 0.45 0.25 0

6
Why Hydrogen?
Hydrogen offers…
… CO2 reduction potential … diversification of primary
energy sources
… zero emissions at the tailpipe… multiple application usages

7
Why Hydrogen is on the plate now?
Financing: funding for infrastructure
Legislation: push for emission reduction OEM progress: serial production
Hydrogen stations: serial production

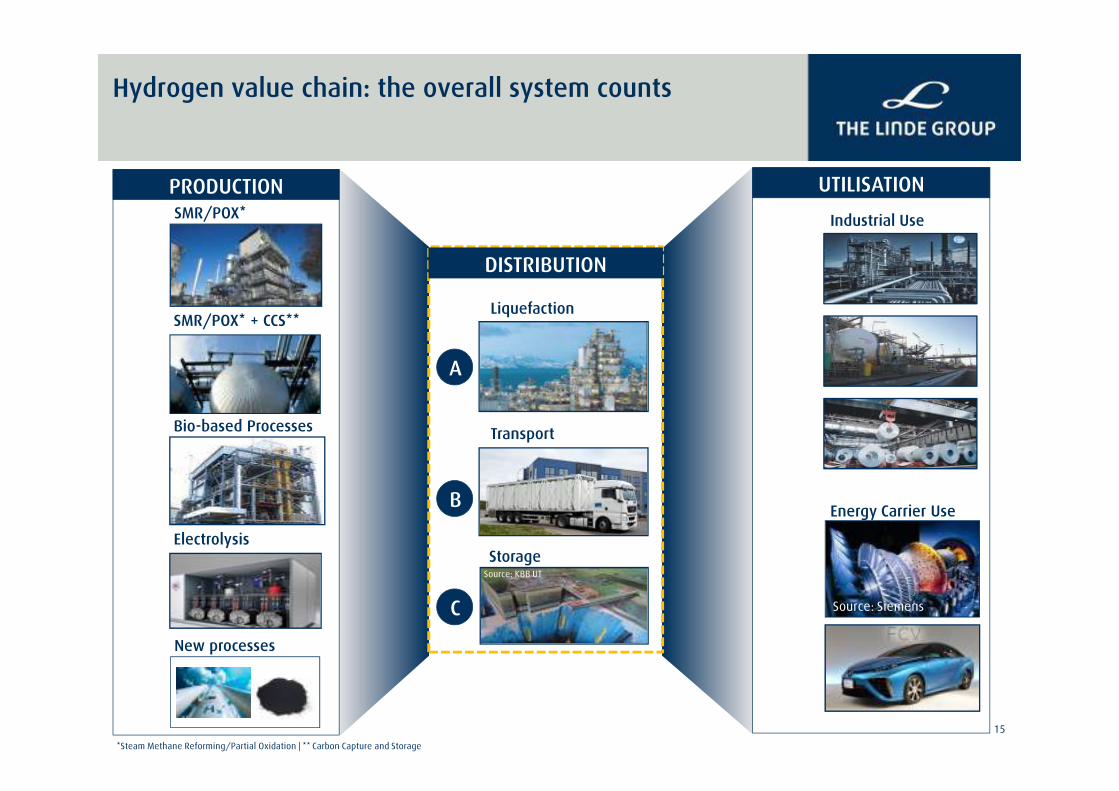
Hydrogen value chain: the overall system counts
8
*Steam Methane Reforming/Partial Oxidation | ** Carbon Capture and Storage
PRODUCTIONSMR/POX*
SMR/POX* + CCS**
Bio-based Processes
Electrolysis
New processes
UTILISATION
Industrial Use
Energy Carrier Use
Source: Siemens
Source: KBB UT
Liquefaction
Transport
Storage
DISTRIBUTION

Hydrogen value chain: the overall system counts
9
*Steam Methane Reforming/Partial Oxidation | ** Carbon Capture and Storage
PRODUCTIONSMR/POX*
SMR/POX* + CCS**
Bio-based Processes
Electrolysis
New processes
UTILISATION
Industrial Use
Energy Carrier Use
Source: Siemens
Source: KBB UT
Liquefaction
Transport
Storage
DISTRIBUTION1
2
3
4
5

Steam methane reforming:
dominant industrial production method for hydrogen
10
1

11
Steam methane reforming with carbon capture:
CO2 reduction potential for conventional plants
Demin
water
Feed
Air
Fuel
Reformer
Steam System
CO-shift H2-PSA Hydrogen
Fluegas
Steam
1 Medium pressure, low CO2 content � Absorption (MDEA)
2 Low pressure, medium CO2 content � PSA, FlashCO2, CO2LDSep, MTR
1 Low pressure, low CO2 content � Absorption (Amine )
Process Assessment
+ CO2 purity
+ fuel demand
- retrofitting
+ CAPEX
+ fuel demand
- power consumption
- retrofitting
- CO2 purity
+ CO2 content
+ CO2 purity
+ retrofitting
- space
- pressure
2
1
3
2
1
2
31
2
3
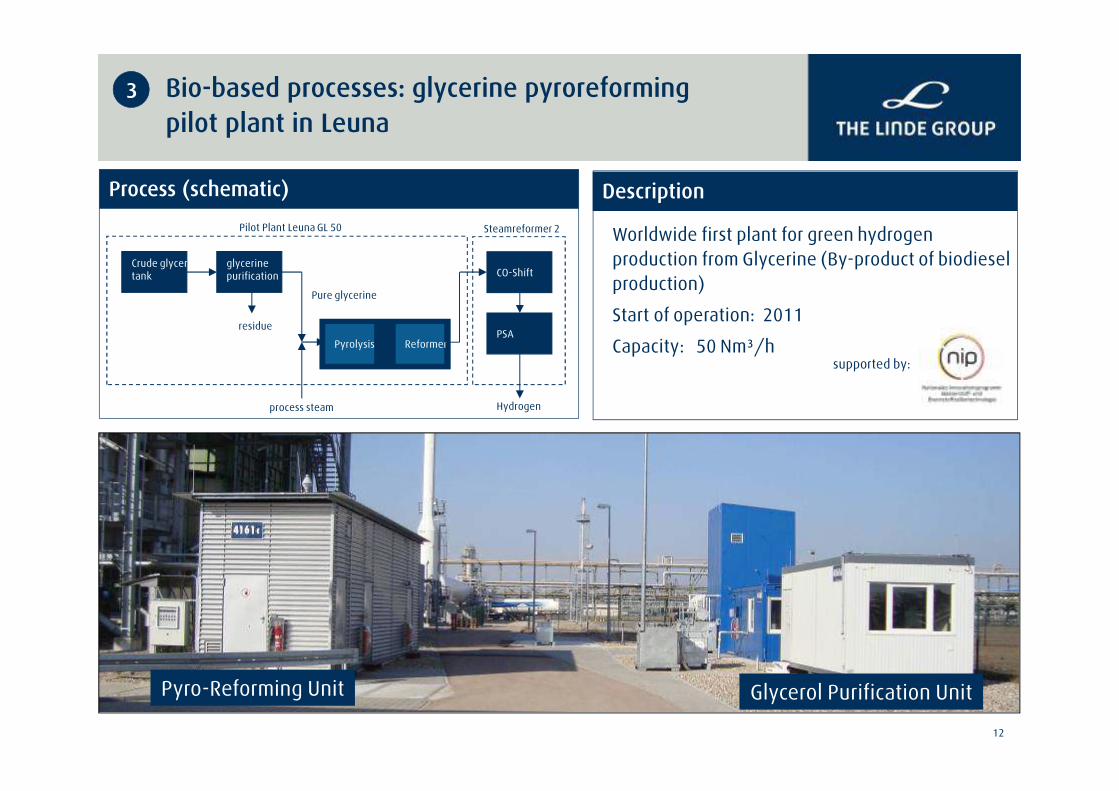
Bio-based processes: glycerine pyroreforming
pilot plant in Leuna
Worldwide first plant for green hydrogen
production from Glycerine (By-product of biodiesel
production)
Start of operation: 2011
Capacity: 50 Nm³/h
Glycerol Purification UnitPyro-Reforming Unit
Crude glycerine tank
glycerine purification
Pyrolysis Reformer
CO-Shift
Steamreformer 2
PSAresidue
Hydrogenprocess steam
Pure glycerine
Pilot Plant Leuna GL 50
12
3
supported by:
Process (schematic) Description

Electrolysis: Power-to-Gas pilot plant in Mainz
13
Project set-up:
● World’s largest power-to-gas pilot to manage local grid bottleneck in Mainz (start-up: 2015)
● Production: PEM electrolysis with 6 MW peak
● Conditioning: Ionic Compressor for flexible and energy-efficient operation
● Storage: 1000 kg pressure storage (~33 MWh)
● Use: industrial gas & H2 as fuel & grid injection (power-to-gas)
Targets:
● Management of grid bottleneck
● Testing and experience with components
● Intelligent control and market integration
supported by:
Electrolysis with 6 MW
peak load
Status 26th of January 2015
4
Key facts
Partners: Stadtwerke Mainz, Linde, Siemens & Hochschule RheinMain
Electrolysis & plant overview

New process technology: methane pyrolysis
• Products: Hydrogen and Carbon
• Process: cost-competitive world scale H2 (10 - 100 kta) with
CO2-footprint advantage & carbon to steel or non-ferrous
value applications
• Funding: BMBF funding of 9 m€
• Timeline: development activities until 2016
Unique selling proposition
• Energy efficiency:
for H2/SynGas technologies for central
production sites
• Two-Product-Approach:
Captive use of industrial hydrogen and
high-purity Carbon for metallurgical
markets (global market)
• Emission reduction:
up to 50% emission reduction for
pyrolysis-H2 compared to steam
methane reforming
• Utilisation:
flexible use in industry and as low-
emission fuel in mobility
5
14
NG pyrolysis
Natural Gas (NG)
Power Quality carbons
H2
Key Facts
Process (schematic)
supported by:
Partners: BASF, Linde, ThyssenKrupp Steel, ThyssenKrupp Industrial Solutions, the, BFI & TU Dortmund
Hydrogen value chain: the overall system counts
15
*Steam Methane Reforming/Partial Oxidation | ** Carbon Capture and Storage
PRODUCTIONSMR/POX*
SMR/POX* + CCS**
Bio-based Processes
Electrolysis
New processes
UTILISATION
Industrial Use
Energy Carrier Use
Source: Siemens
Source: KBB UT
Liquefaction
Transport
Storage
DISTRIBUTION
A
B
C

Liquefaction: current technology and potential for
enhanced efficiency
Dry Piston
Type
Compress
ors
Adsor
bers
Joule-Thomson Expansion
in Ejector
Liquid H2
(to
Storage)
Expan
sion
Turbin
e 1
Gaseous H2
Feed
Cooling Water Liquid N2
for
Precooling
Vacuum
Pump
to
Atmosphe
re
Compression System Liquefier Coldbox
300 K
80 K
20 K
Liquefaction
and
o-p Conversion
Expansion
Turbines 2
and 3
Hydrogen Cooling Cycle
Gaseous
H2
(from
Storage)
Gaseous H2
(from
Trailer)
Potential Improvements
● Status:
globally six liquefaction plants built
in the last 10 years
● Energy consumption today:
~ 12.0 kWh/kg
● Improvement potential:
Compressor cooling
�multi-stage setting with inter-
cooling
� higher CAPEX
Advanced pre-cooling cycle
� closed N2 loop
� integration of LNG
Turbine Technology
�dynamic gas bearing machine with
highest efficiency
● Energy Consumption potential:
7.5 to 9.0 kWh/kg
A
16
DescriptionClaude-based liquefaction cycle

1 equals approx. 66 – 120 vehicles/ Trailer; 2 equals approx. 700 vehicles / Trailer; 3 equals approx. 180 – 1.800 vehicles/hour (assuming 5kg/vehicles)
- Economics strongly related to
distance and transport volume
- Very high capacity
- Relatively high investment cost
- Potentially long approval time
- Little flexibility if customer
demand changes
- Economic transport
distance for HFS < ~ 150 km
- Higher number of CGH2 sources
compared to LH2 sources (in
most countries)
- Lower capacity
� high demand requires
frequent deliveries
- Relatively high storage space
requirements
Transport: hydrogen distribution depends mainly on
distance and required volumes
- Economic transport
distance for HFS > ~ 150 km
- High capacity increases
delivery flexibility
- Significantly higher payload
- Relatively lower storage space
requirements
- Relatively high energy
consumption for liquefaction
- Transport @ -253 °C
- Capacity:
ca. 3.500 kg LH2 2
- Transport @ up to 300 bar
- Capacity (varying):
ca. 330 kg – 600 kg CGH2 1
- Transport @ 20 - 100 bar
- Capacity:
1.000 – 10.000 kg/h CGH2 3
Facts Advantage Disadvantag
e
Pip
elin
e
dis
trib
uti
on
Liq
uid
dis
trib
uti
on
Gase
ou
s
dis
trib
uti
on
B
17
18
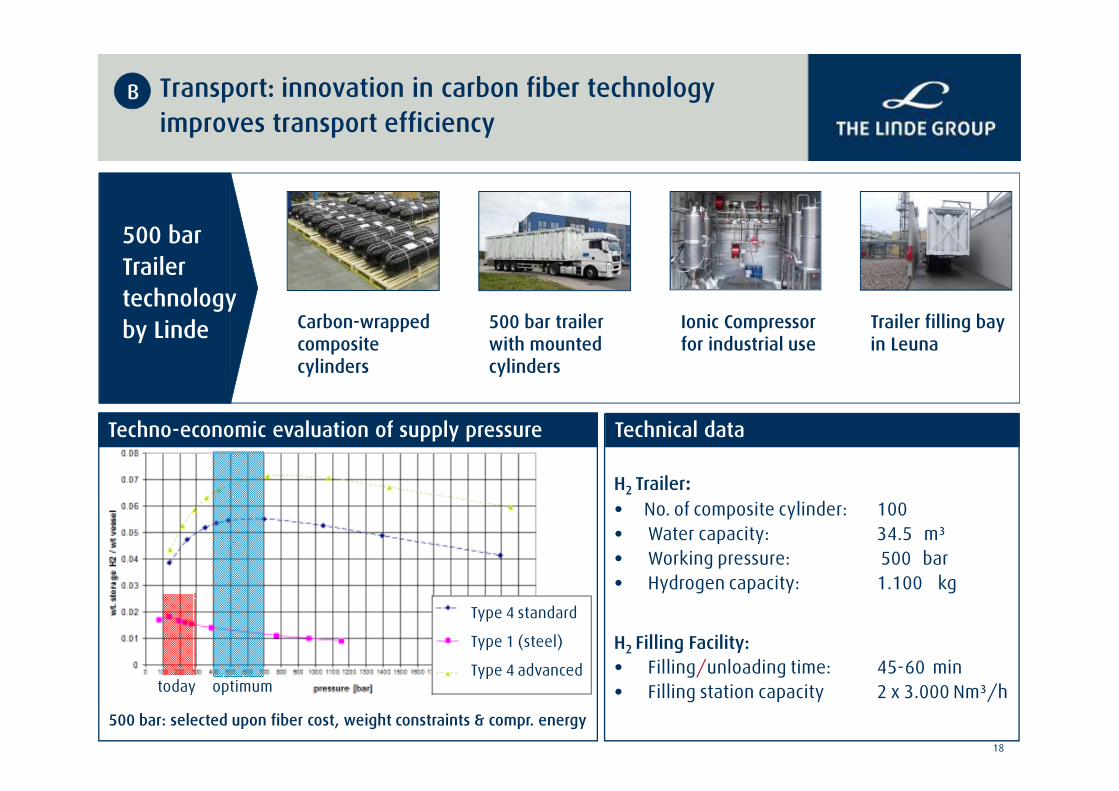
Transport: innovation in carbon fiber technology
improves transport efficiency
Techno-economic evaluation of supply pressure Technical data
H2 Trailer:● No. of composite cylinder: 100
● Water capacity: 34.5 m³
● Working pressure: 500 bar
● Hydrogen capacity: 1.100 kg
H2 Filling Facility:
● Filling/unloading time: 45-60 min
● Filling station capacity 2 x 3.000 Nm³/h
B
Carbon-wrapped composite cylinders
500 bar: selected upon fiber cost, weight constraints & compr. energy
Type 4 standard
Type 1 (steel)
Type 4 advancedoptimum
500 bar
Trailer
technology
by Linde
today
Ionic Compressor for industrial use
Trailer filling bay in Leuna
500 bar trailer with mounted cylinders
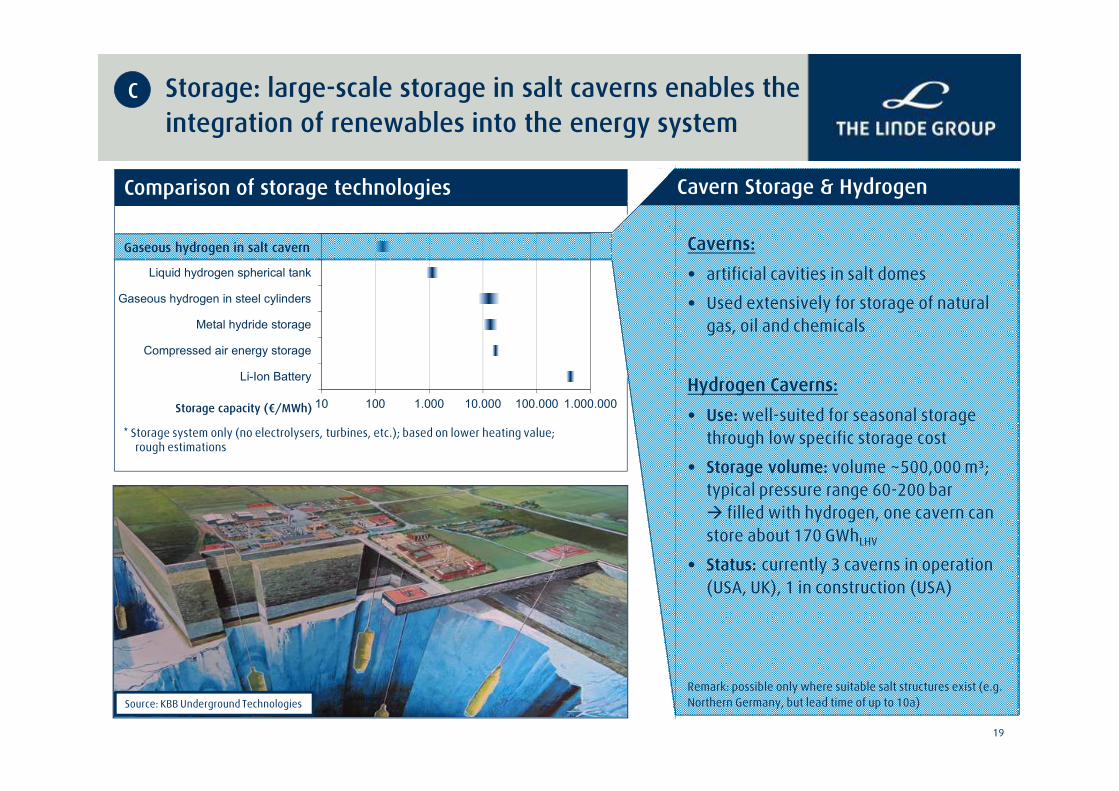
Storage: large-scale storage in salt caverns enables the
integration of renewables into the energy system
19
Source: KBB Underground Technologies
10 100 1.000 10.000 100.000 1.000.000
Methane in salt cavern
Gaseous hydrogen in salt cavern
Liquid hydrogen spherical tank
Gaseous hydrogen in steel cylinders
Metal hydride storage
Compressed air energy storage
Li-Ion Battery
Storage capacity (€/MWh)
* Storage system only (no electrolysers, turbines, etc.); based on lower heating value;rough estimations
C
Comparison of storage technologies Cavern Storage & Hydrogen
Caverns:
● artificial cavities in salt domes
● Used extensively for storage of natural
gas, oil and chemicals
Hydrogen Caverns:
● Use: well-suited for seasonal storage
through low specific storage cost
● Storage volume: volume ~500,000 m³;
typical pressure range 60-200 bar
� filled with hydrogen, one cavern can
store about 170 GWhLHV
● Status: currently 3 caverns in operation
(USA, UK), 1 in construction (USA)
Remark: possible only where suitable salt structures exist (e.g.
Northern Germany, but lead time of up to 10a)
Gaseous hydrogen in salt cavern

Hydrogen value chain: the overall system counts
20
*Steam Methane Reforming/Partial Oxidation | ** Carbon Capture and Storage
PRODUCTIONSMR/POX*
SMR/POX* + CCS**
Bio-based Processes
Electrolysis
New processes
UTILISATION
Industrial Use
Energy Carrier Use
Source: Siemens
Source: KBB UT
Liquefaction
Transport
Storage
DISTRIBUTION
II
I
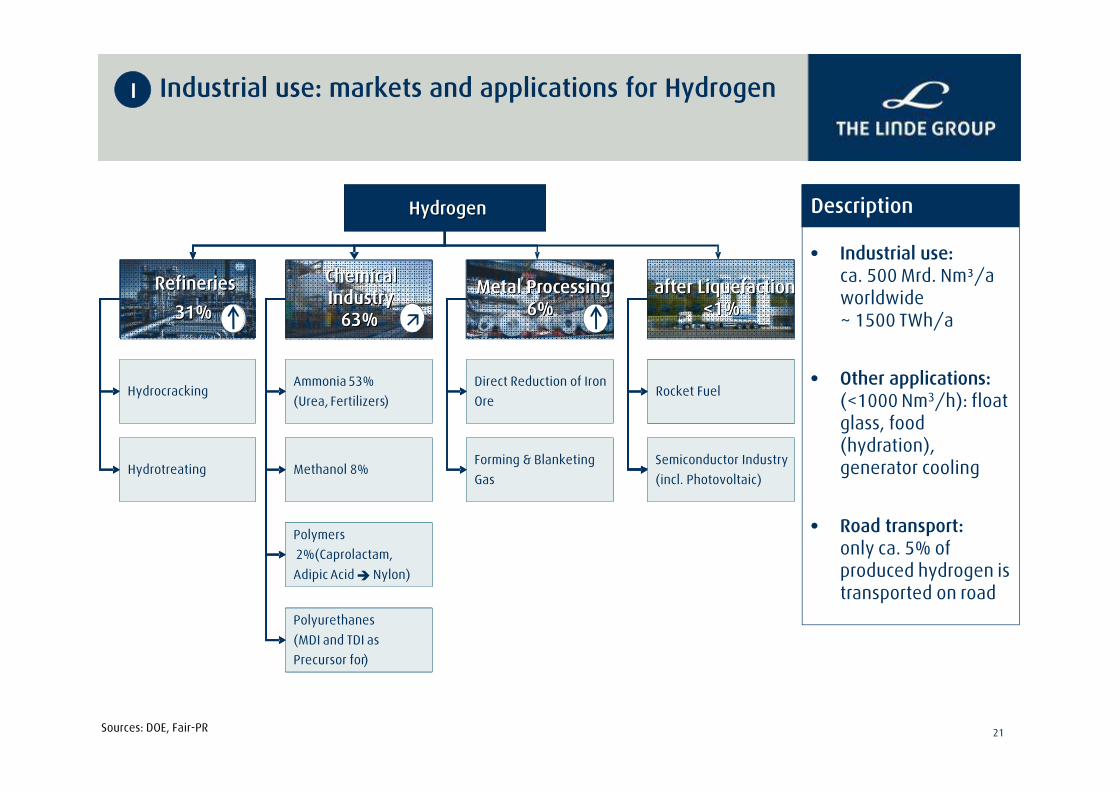
Industrial use: markets and applications for Hydrogen
21
● Industrial use:ca. 500 Mrd. Nm³/a worldwide~ 1500 TWh/a
● Other applications: (<1000 Nm3/h): float glass, food (hydration), generator cooling
● Road transport:only ca. 5% of produced hydrogen is transported on road
Sources: DOE, Fair-PR
HydrogenHydrogen
Chemical Chemical
Hydrocracking
Hydrotreating
Ammonia 53%
(Urea, Fertilizers)
Semiconductor Industry
(incl. Photovoltaic)
Rocket Fuel
Methanol 8%
Polymers
2%(Caprolactam,
Adipic Acid �Nylon)
Direct Reduction of Iron
Ore
Forming & Blanketing
Gas
Polyurethanes
(MDI and TDI as
Precursor for)
HydrogenHydrogen
Chemical
Hydrocracking
Hydrotreating
Ammonia 53%
(Urea, Fertilizers)
Semiconductor Industry
(incl. Photovoltaic)
Rocket Fuel
Methanol 8%
Polymers
2%(Caprolactam,
Adipic Acid �Nylon)
Direct Reduction of Iron
Ore
Forming & Blanketing
Gas
Polyurethanes
(MDI and TDI as
Precursor for)
Refineries Refineries
31%31%
after Liquefaction after Liquefaction <1%<1%
IndustryIndustry63%63%
Metal Processing Metal Processing 6%6%
�
Refineries Refineries
31%31%
after Liquefaction after Liquefaction <1%<1%
Chemical IndustryIndustry
63%63%
Metal Processing Metal Processing 6%6%
�
I
Description

22
0
20
40
60
80
100
120
140
160
180
200
Range
[km]
CO2 emissions
[gCO2 / km]
800600400200 1,6001,4001,2001,0000
ICE – gasoline1
2050
ICE – diesel1
2010
BEV
2050
1 ICE range for 2050 based on fuel economy improvement and assuming tank size stays constant. Assuming 24% CO2 reduction due to biofuels by 2050This study assumes biofuels blending in gasoline and diesel is limited to 24% beyond 2030SOURCE: EU Study analysis, “A portfolio of power-trains for Europe: a fact-based analysis”
FCEV
2010
2050
2010
2010
2050
PHEV
C/D SEGMENT
Low emissions and high range
Energy carrier use: FCEV achieving near zero CO2
emissions from well-to-wheel with high rangeII
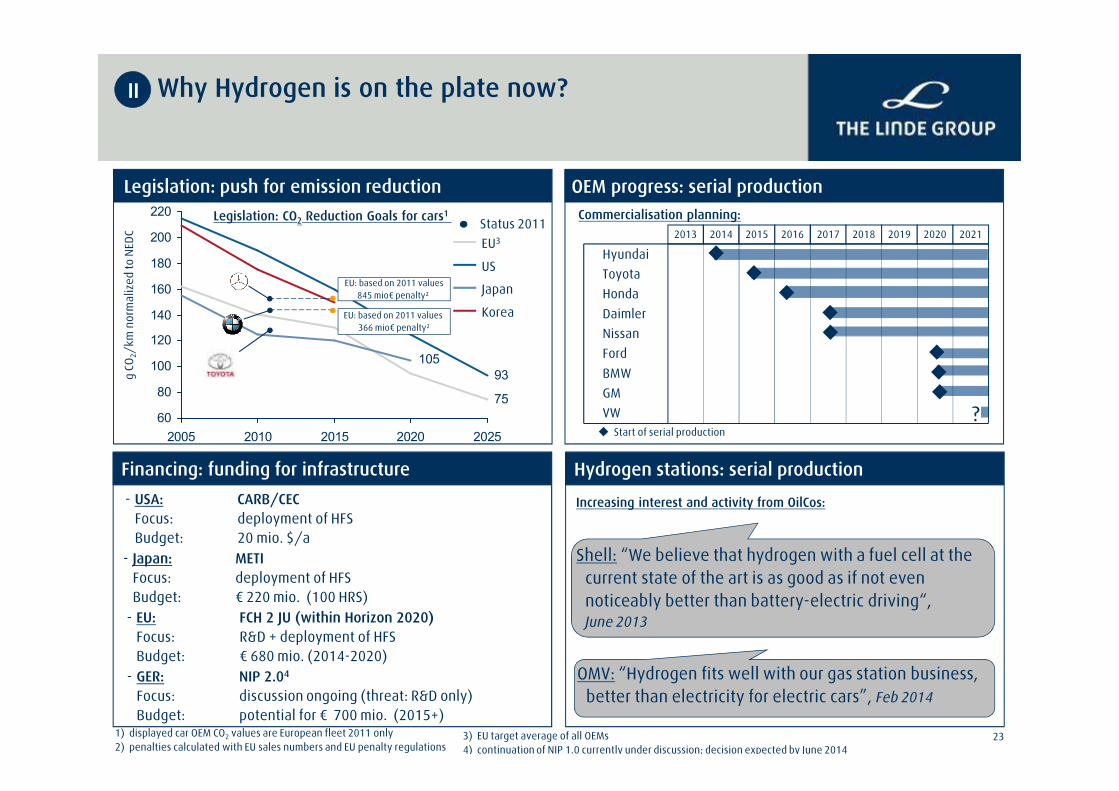
Why Hydrogen is on the plate now?
Hydrogen stations: serial productionFinancing: funding for infrastructure
OMV: “Hydrogen fits well with our gas station business,
better than electricity for electric cars”, Feb 2014
Shell: “We believe that hydrogen with a fuel cell at the
current state of the art is as good as if not even
noticeably better than battery-electric driving“, June 2013
OEM progress: serial production
2013 2014 2015 2016 2017 2018 2019 2020 2021
Daimler
Toyota
GM
Hyundai
VW
BMW
Ford
Nissan
Honda
Start of serial production
g C
O2/
km n
orm
aliz
ed
to
NED
C
?75
93
105
60
80
100
120
140
160
180
200
220
2005 2010 2015 2020 2025
Korea
US
Japan
EU3
1) displayed car OEM CO2 values are European fleet 2011 only
2) penalties calculated with EU sales numbers and EU penalty regulations
Legislation: CO2 Reduction Goals for cars1
Status 2011
EU: based on 2011 values
845 mio€ penalty²
EU: based on 2011 values
366 mio€ penalty²
3) EU target average of all OEMs
4) continuation of NIP 1.0 currently under discussion; decision expected by June 2014
II
23
- EU: FCH 2 JU (within Horizon 2020)
Focus: R&D + deployment of HFS
Budget: € 680 mio. (2014-2020)
- Japan: METI
Focus: deployment of HFS
Budget: € 220 mio. (100 HRS)
- USA: CARB/CEC
Focus: deployment of HFS
Budget: 20 mio. $/a
- GER: NIP 2.04
Focus: discussion ongoing (threat: R&D only)
Budget: potential for € 700 mio. (2015+)
Legislation: push for emission reduction
Commercialisation planning:
Increasing interest and activity from OilCos:
Advanced hydrogen refuelling technology for the
commercialisation of FCEVs
24
II

Thank you.


