62
David A. Ansell, Chief Medical Officer, Rush Univer From County to Cong 35 years as a primary car physician on Chicago’s Westside and the unfin business of health reform
| Date post: | 18-Dec-2015 |
| Category: |
Documents |
| Upload: | sharon-patterson |
| View: | 214 times |
| Download: | 0 times |

Dr. David A. Ansell, Chief Medical Officer, Rush University
From County to Congress:
35 years as a primary care physician on Chicago’s Westside and the unfinished
business of health reform

I’m David AnsellI have no disclosures
A Talk in 3 Parts • Part 1: 3 hospitals, 1 street, 2 worlds
• Part 2: A poll
• Part 3: Achieving the Triple Aim: the promise of real health reform- improved Medicare for All

Part 1: 3 hospitals,1 street,
2 worlds

I am Chief Medical Officer at Rush University Medical Center.


35 years ago……

Health Care a Human Right
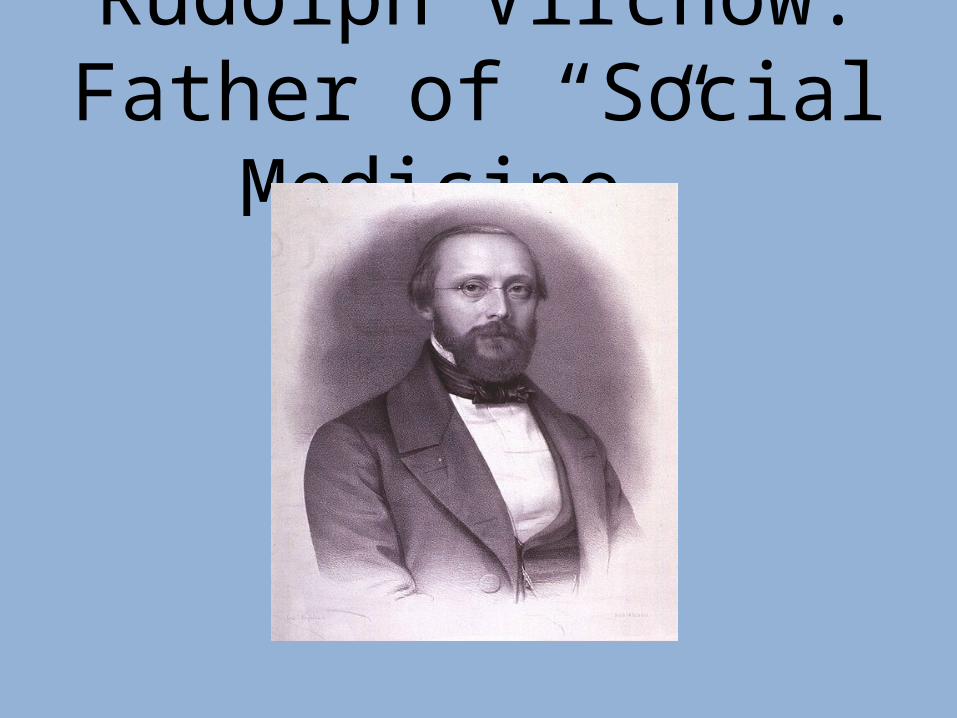
Rudolph Virchow: Father of “Social Medicine”

Cook County Hospital

Once a storied teaching institution
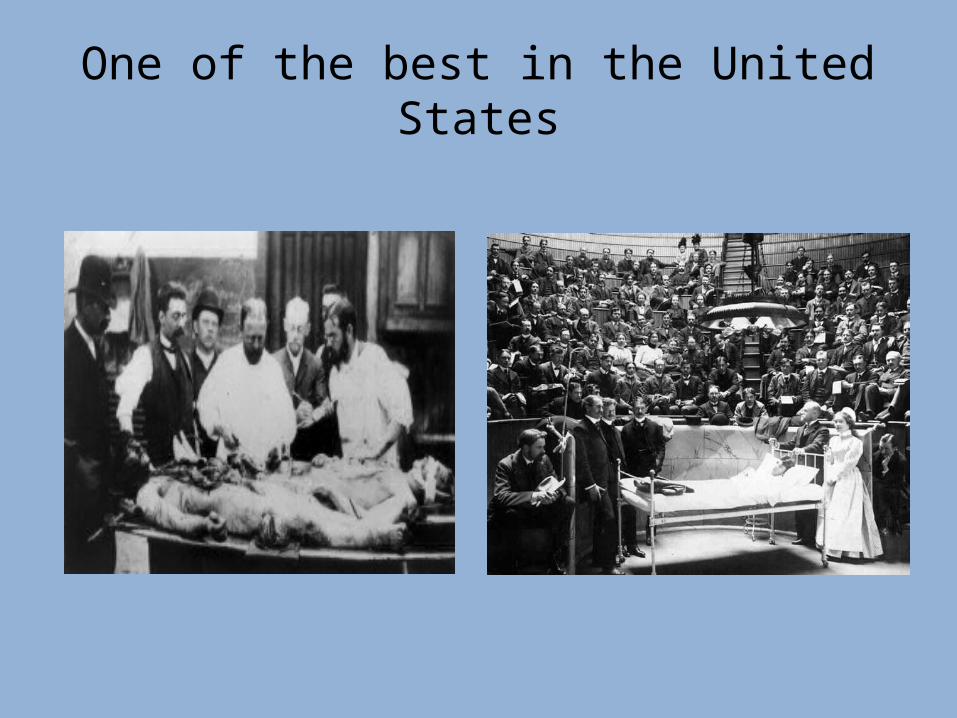
One of the best in the United States

But by 1978, at the crossroads at the war for health equity in the United States

Run down, threatened with closure
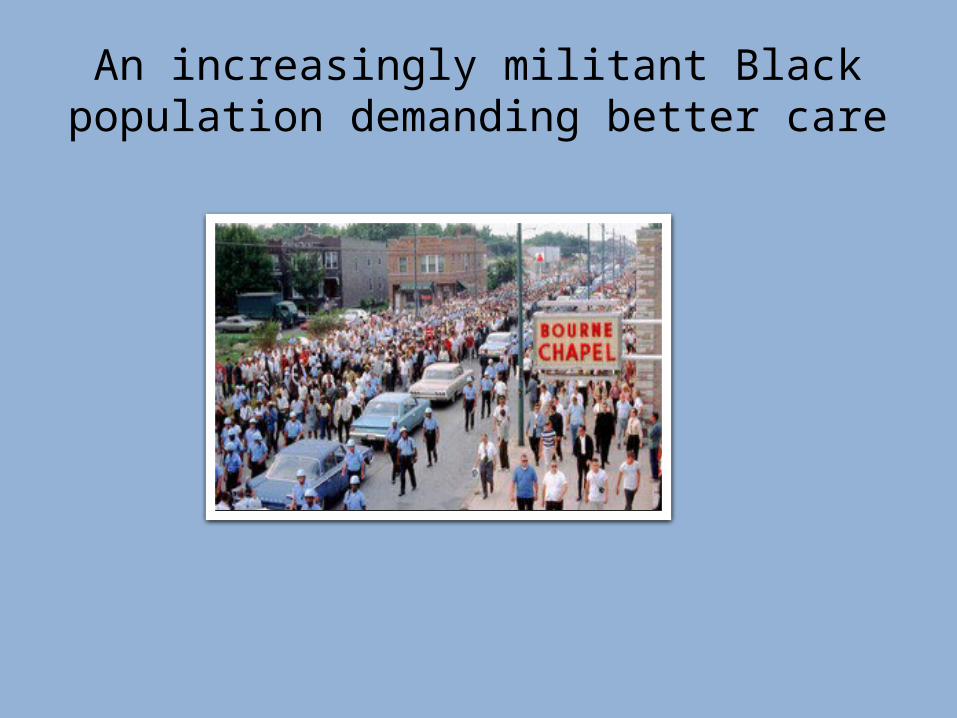
An increasingly militant Black population demanding better care
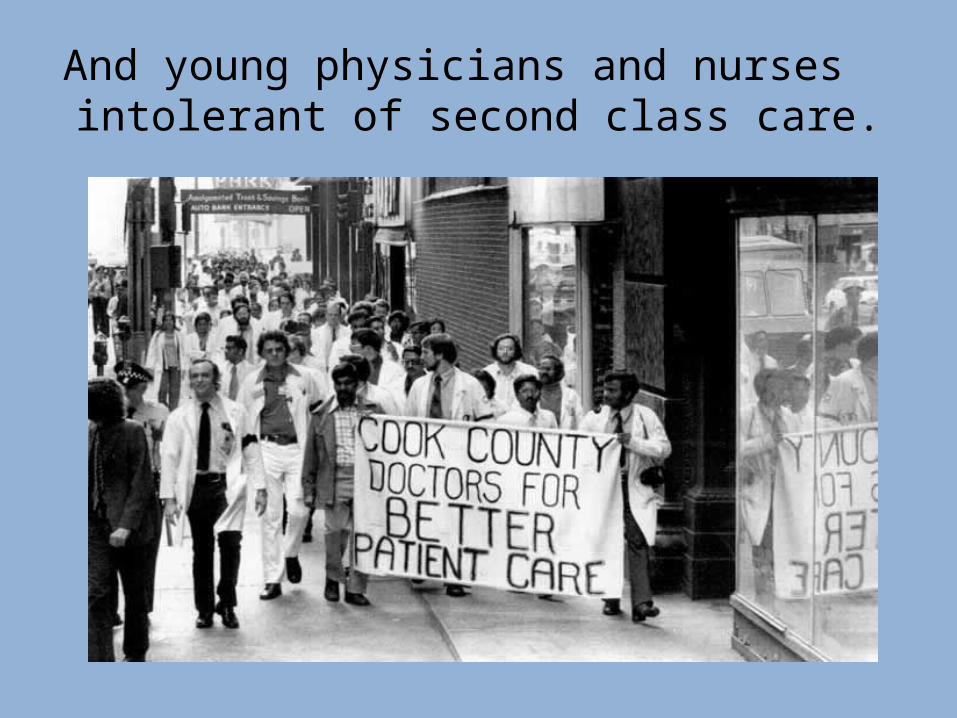
And young physicians and nurses intolerant of second class care.
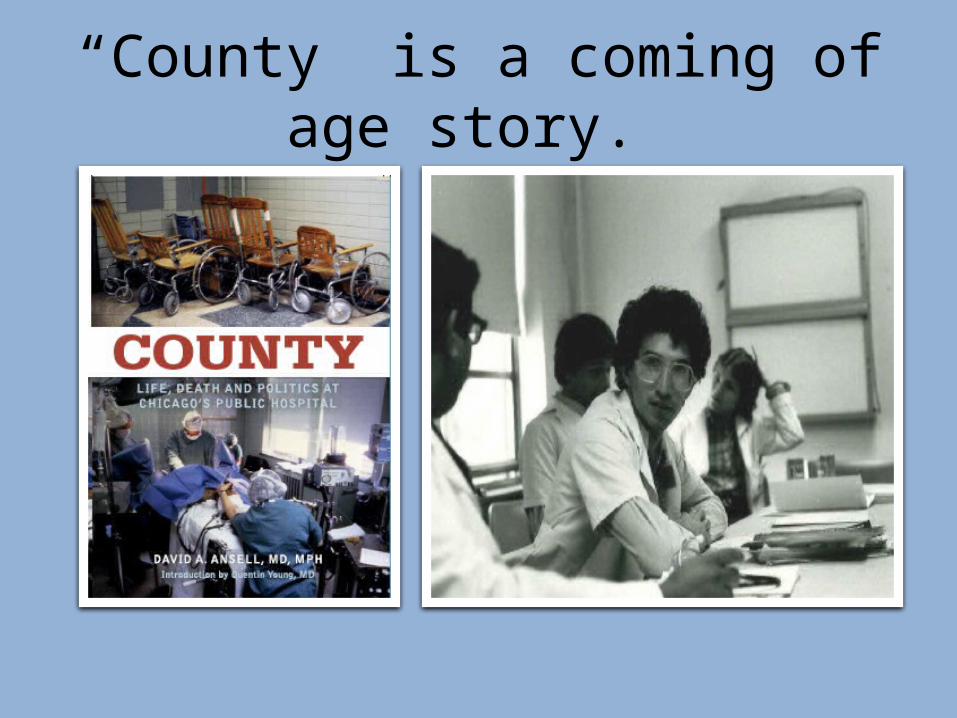
“County” is a coming of age story.
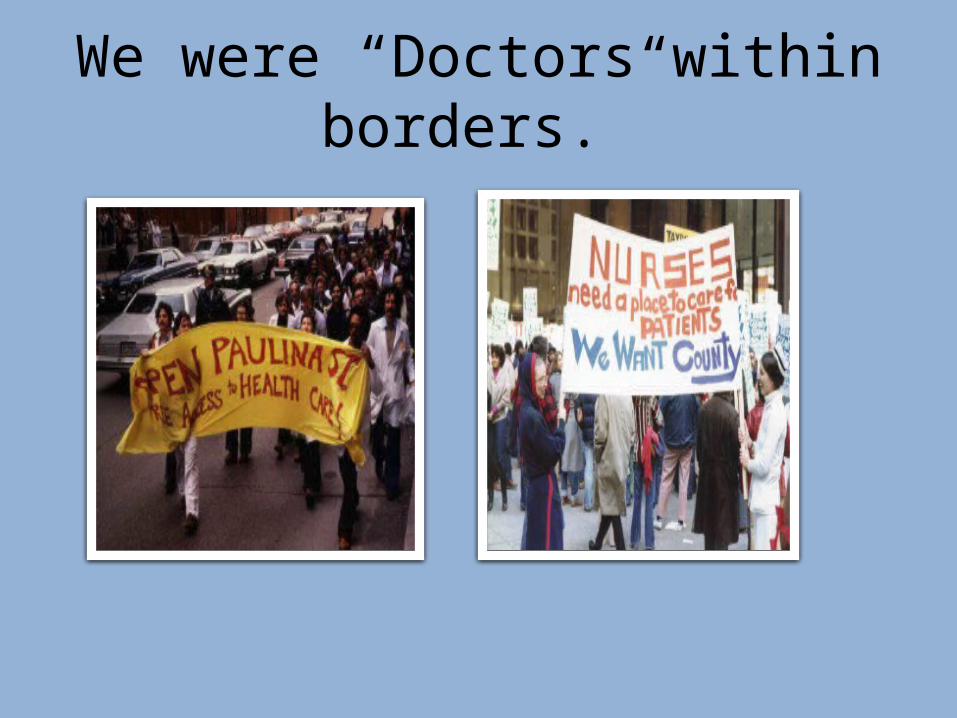
We were “Doctors within borders.”
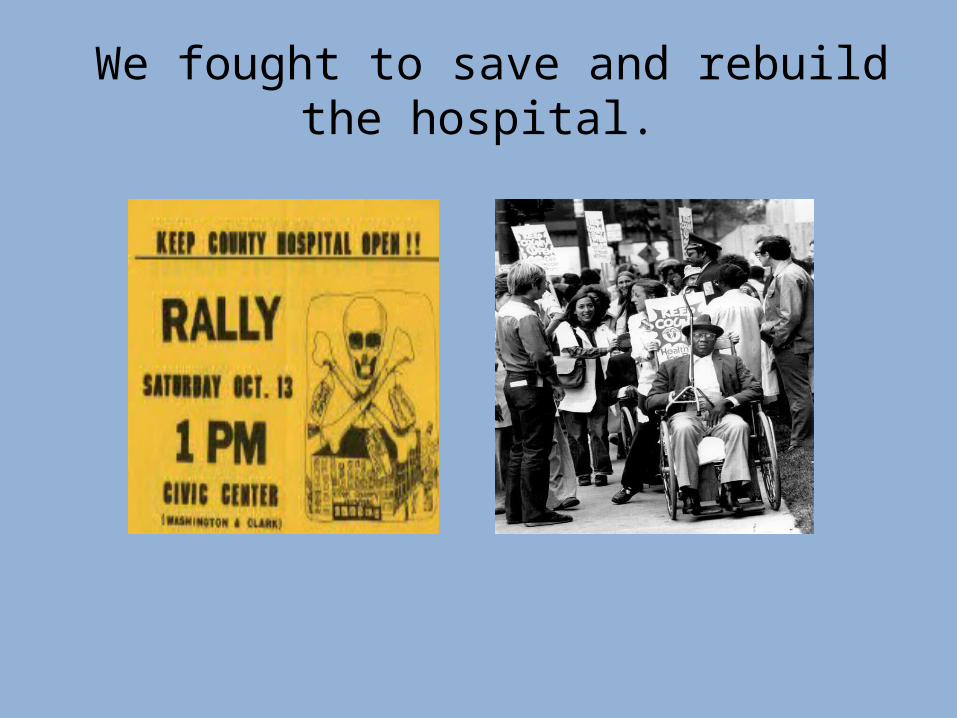
We fought to save and rebuild the hospital.

The Patients
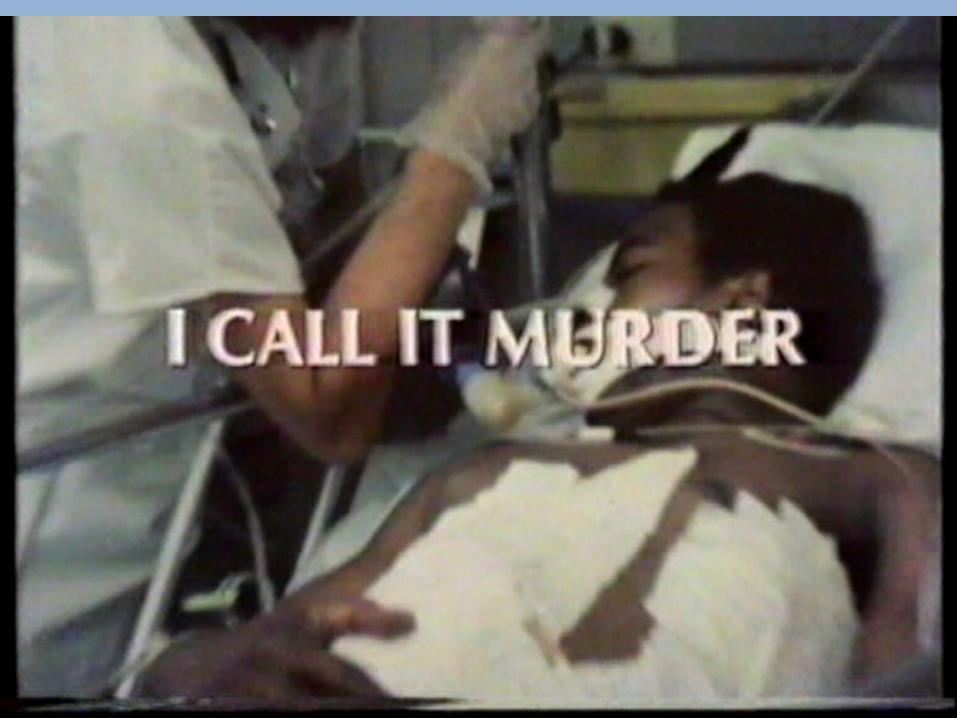

We believed we could improve things
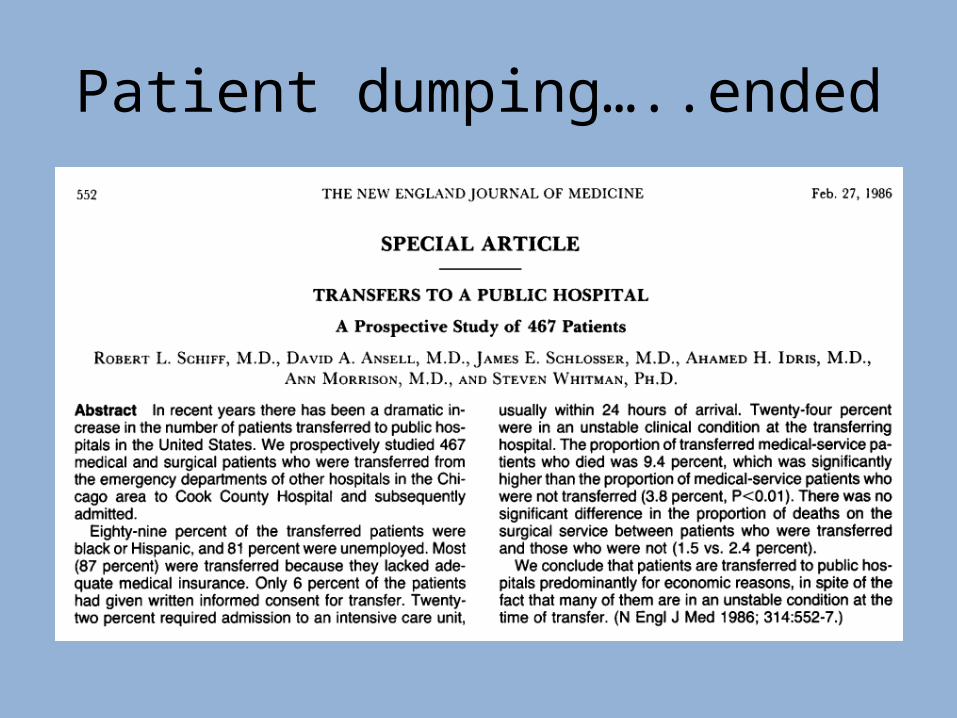
Patient dumping…..ended
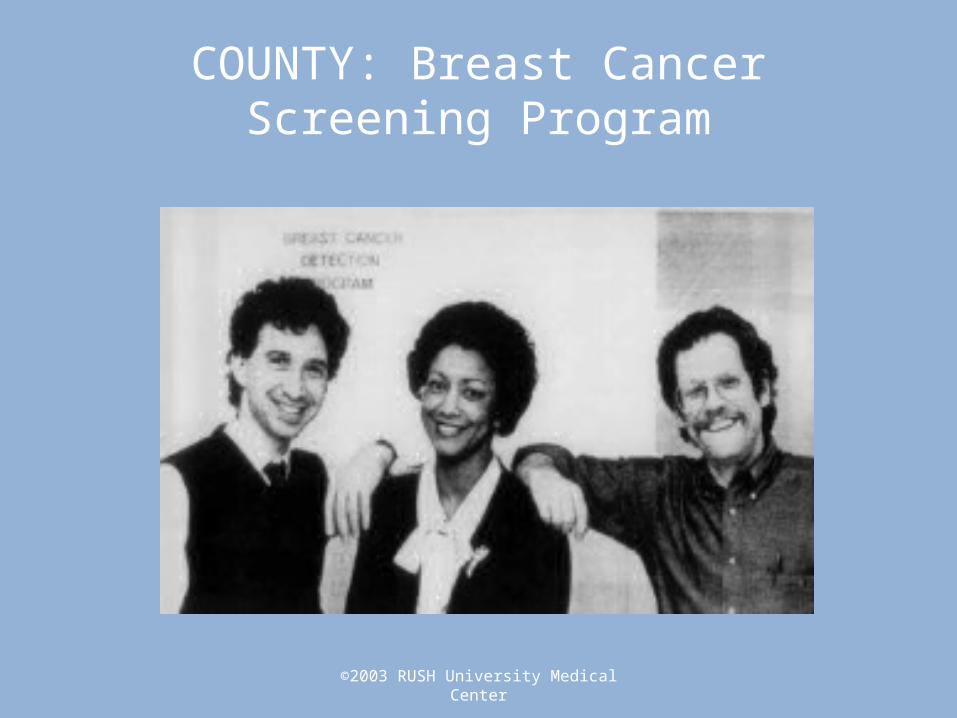
COUNTY: Breast Cancer Screening Program
©2003 RUSH University Medical Center
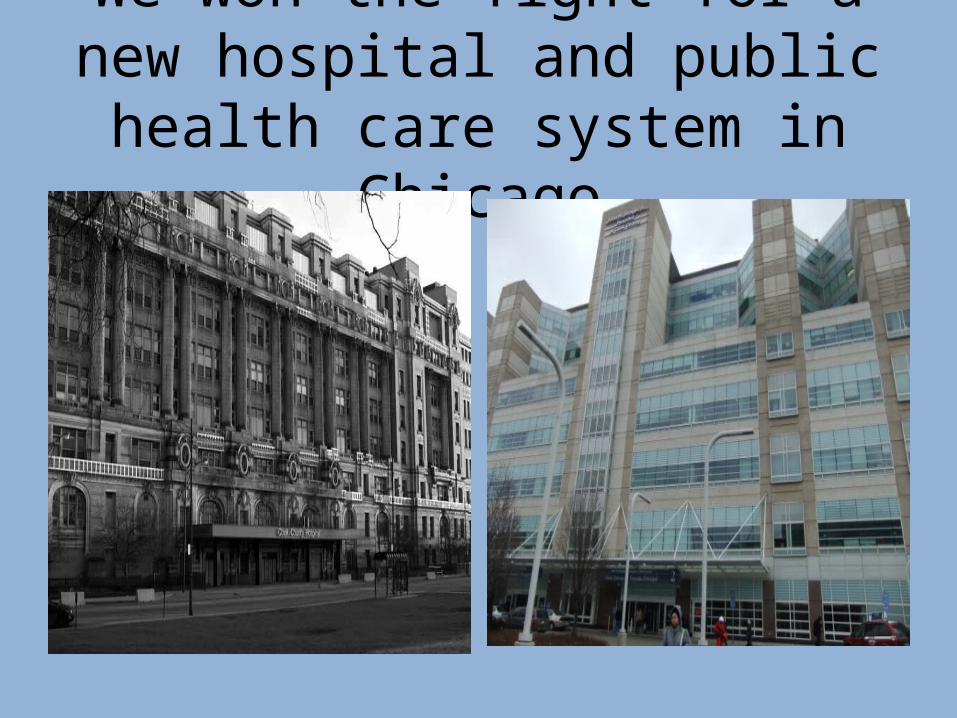
We won the fight for a new hospital and public health care
system in Chicago
The Death Gap
36
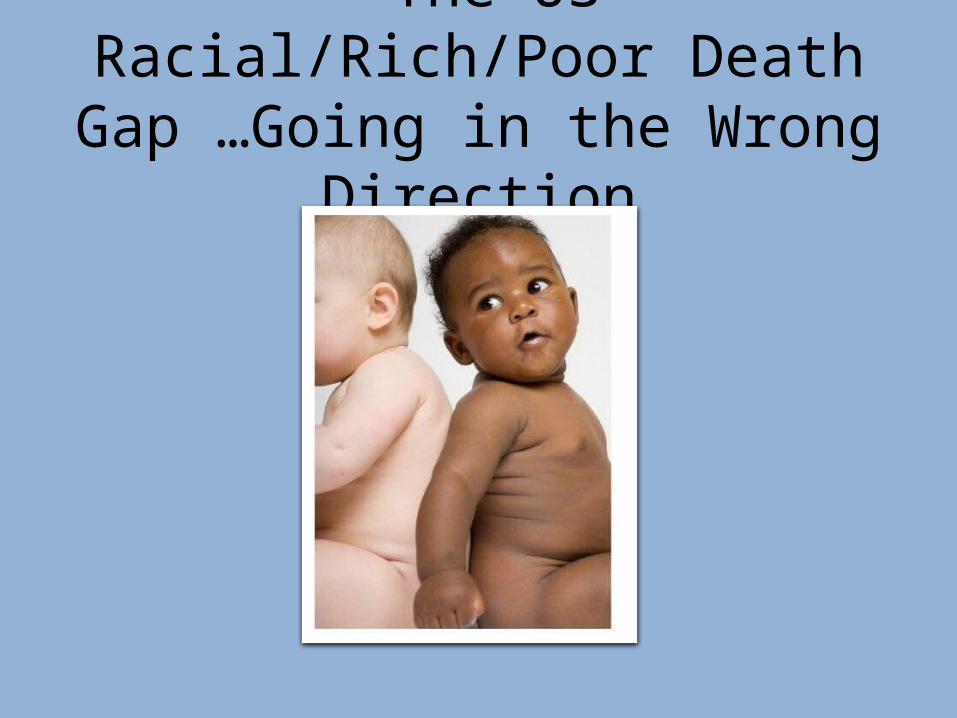
The US Racial/Rich/Poor Death Gap …Going in the Wrong
Direction

Chicago Black Women 62% More Likely To Die Of Breast Cancer
Age-Adjusted Female Breast Cancer Mortality for Chicago, Per 100,000 Population.
Prepared by The Sinai Urban Health Institute
Death
s p
er
10
0,0
00
w
om
en
1981-1983
1984-1986
1987-1989
1990-1992
1993-1995
1996-1998
1999-2001
2002-2004
50
40
30
20
10
0
38
24
35
39
BlackWhite
38 per 100,000 is
62% more deaths
than 24 per 100,000
2005-2007

Not Just Chicago:
The Death Gap Is National
Prepared by The Sinai Urban Health Institute
New York City United States Chicago0%
10%
20%
30%
40%
50%
60%
70%
27%
41%
62%

Geography Of the Death GapChicago Community Areas with the Highest Annual Breast Cancer Mortality Rates2000 - 2005
Predominately African American Communities
Non- African American Communities
Hospitals with American College of Surgeons Approved Cancer Programs
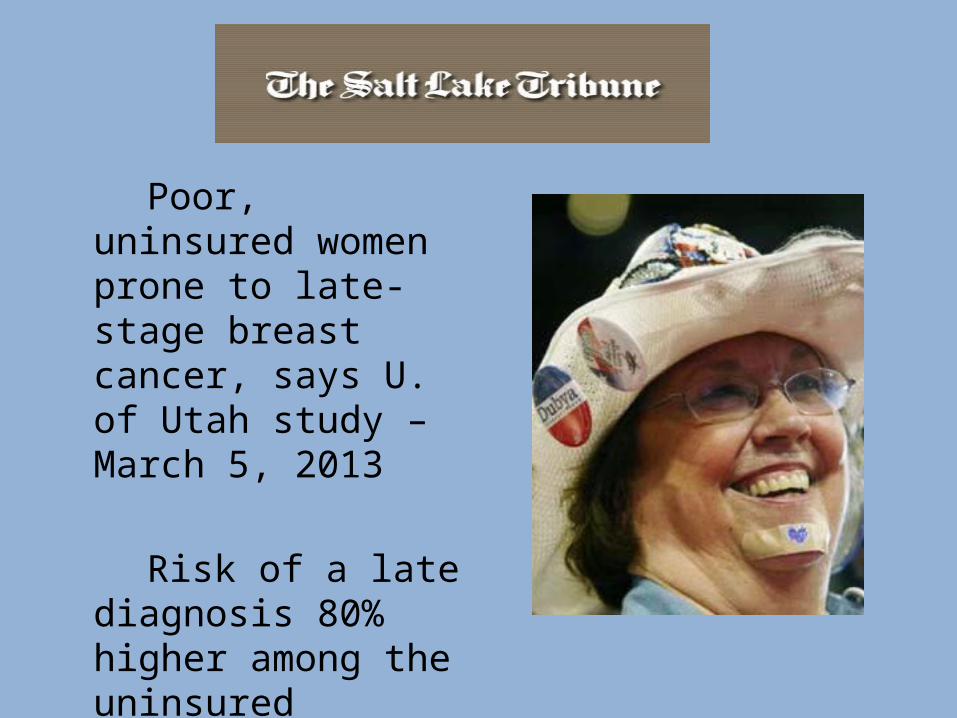
Poor, uninsured women prone to late-stage breast cancer, says U. of Utah study – March 5, 2013
Risk of a late diagnosis 80% higher among the uninsured
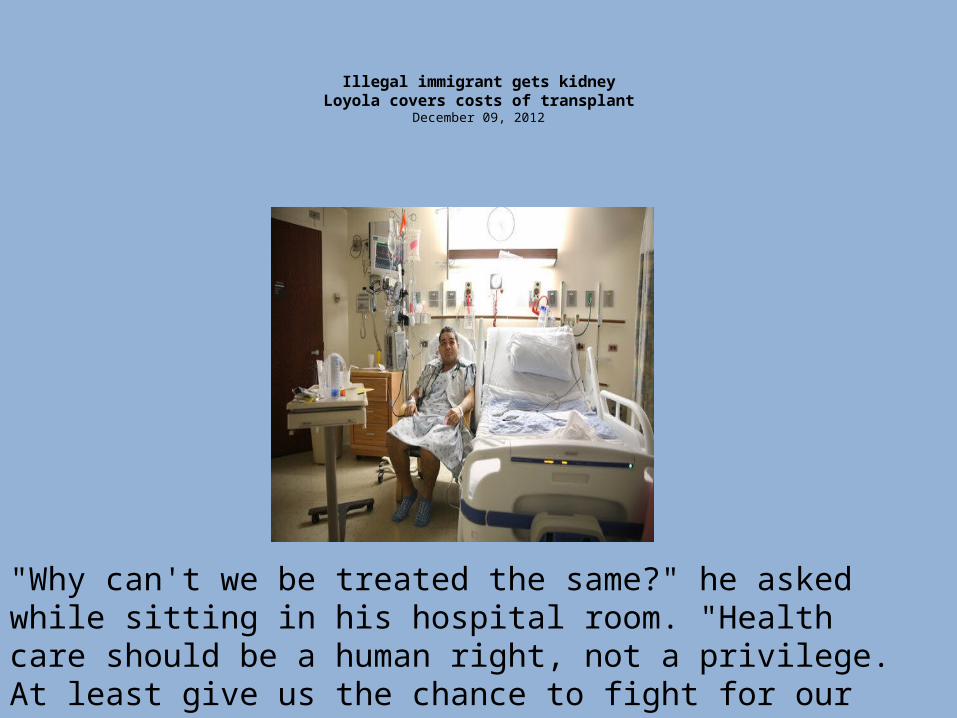
Illegal immigrant gets kidneyLoyola covers costs of transplant
December 09, 2012
"Why can't we be treated the same?" he asked while sitting in his hospital room. "Health care should be a human right, not a privilege. At least give us the chance to fight for our lives with dignity."

Part 2: A survey of doctors
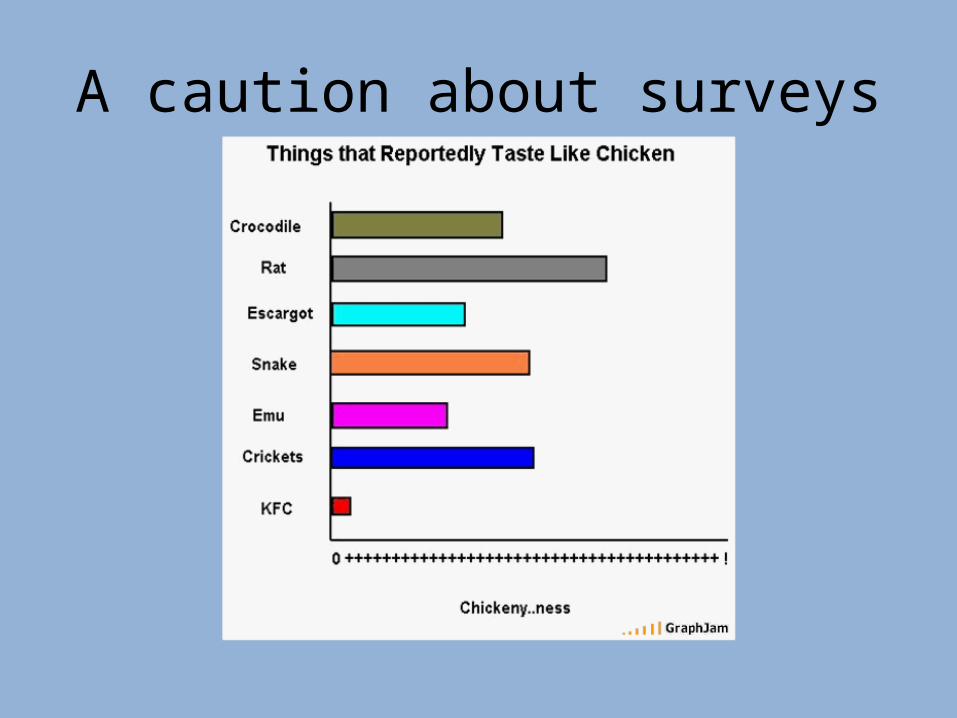
A caution about surveys

Poll: Dr. Ansell's presentation is

Poll: My patients often have difficulty with h...

Poll: The US health care system works well, on...

Poll: Insurance restrictions to patients for m...

Poll: I am very satisfied with the practice of...

41
Doctors’ Perception of Patient Access Barriers
Percent reporting their patients OFTEN have:
AUS CAN FR GER NETH NZ NOR SWE SWIZ UK US
Difficulty paying out-of-pocket costs
25 26 29 21 42 26 4 6 16 13 59
Difficulty getting diagnostic tests 16 38 41 27 7 59 10 15 3 14 23
Long waits to see a specialist 60 73 59 68 21 75 60 49 10 28 28
Source: 2012 Commonwealth Fund International Health Policy Survey of Primary Care Physicians.
42
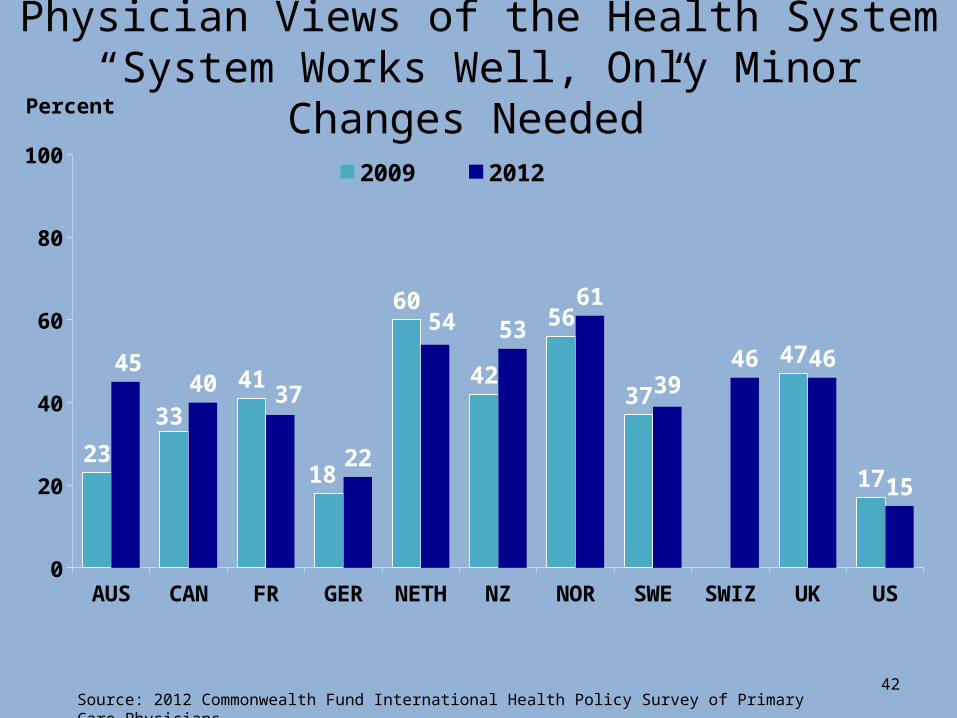
AUS CAN FR GER NETH NZ NOR SWE SWIZ UK US0
20
40
60
80
100
23
33
41
18
60
42
56
37
47
17
4540 37
22
54 5361
3946 46
15
2009 2012
Percent
Physician Views of the Health System“System Works Well, Only Minor Changes Needed”
Source: 2012 Commonwealth Fund International Health Policy Survey of Primary Care Physicians.
43
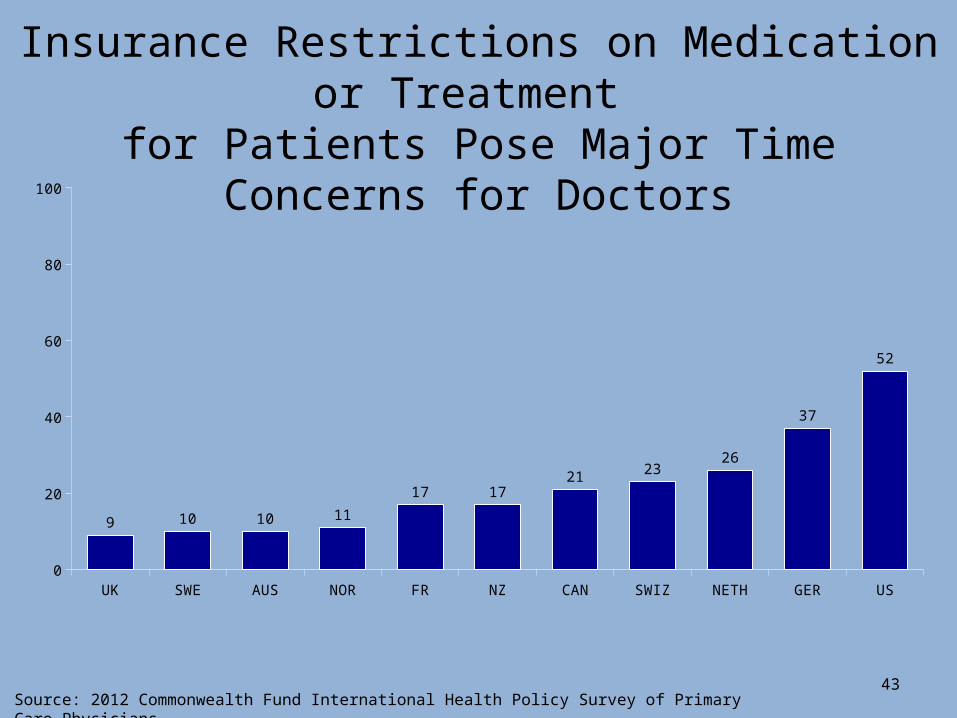
UK SWE AUS NOR FR NZ CAN SWIZ NETH GER US0
20
40
60
80
100
9 10 10 11
17 1721 23
26
37
52
Insurance Restrictions on Medication or Treatment for Patients Pose Major Time Concerns for Doctors
Source: 2012 Commonwealth Fund International Health Policy Survey of Primary Care Physicians.

44
NETH NOR SWIZ UK CAN NZ AUS FR SWE US GER0
20
40
60
80
100
88 87 84 84 82 82 80 76 75 6854
11 12 16 16 18 18 20 23 24 3145
Very satisfied/satisfied Somewhat/very dissatisfied
Percent
Physician Satisfaction with Practicing Medicine
Source: 2012 Commonwealth Fund International Health Policy Survey of Primary Care Physicians.
Part 3: The promise of real health reform
The Triple Aim: Better Care, Better Population Health, Lower Cost
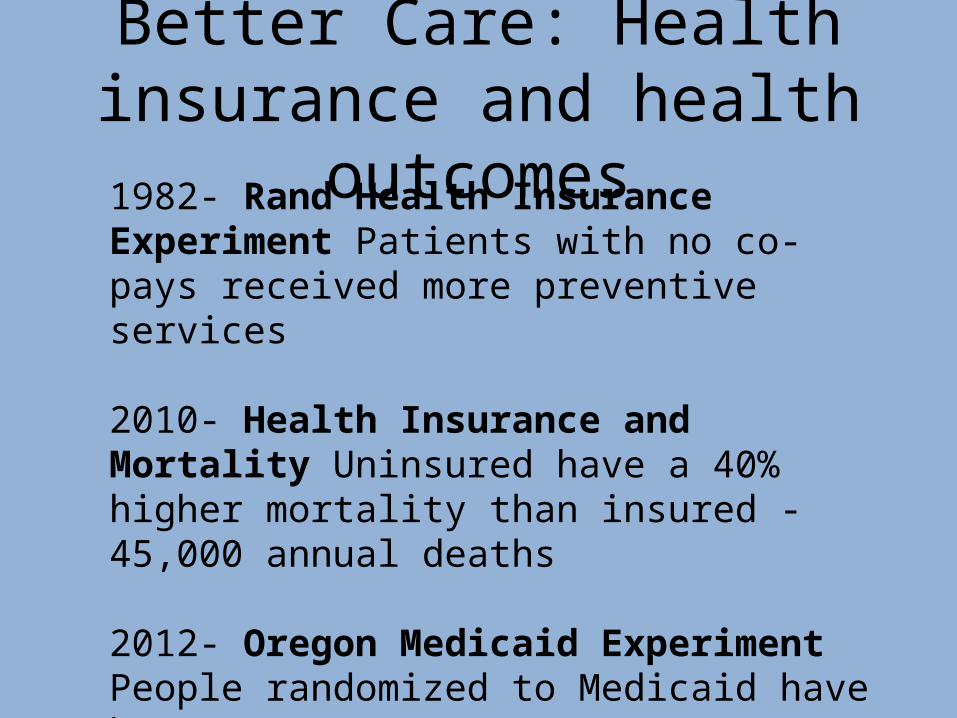
Better Care: Health insurance and health outcomes
1982- Rand Health Insurance Experiment Patients with no co-pays received more preventive services
2010- Health Insurance and Mortality Uninsured have a 40% higher mortality than insured - 45,000 annual deaths
2012- Oregon Medicaid Experiment People randomized to Medicaid have better outcomes

The Oregon Experiment Medicaid enrollees are 25% more likely to
indicate that they're in good, very good, or excellent health
They are 25% less likely to screen positive for depression.
They are even 30% more likely to report that
they are pretty happy or very happy (vs. not too happy).

Increasing Co-Pays for Medicare Recipients decreases outpatient visits and increases
hospitalization rates
Trivedi AN et al. N Engl J Med 2010;362:320-328.

We Spend More but Live Less
Canada average life expectancy for 2007. Italy life expectancy for 2008.
Australia, Japan, Portugal, and Turkey healthcare spending for 2008.
Greece healthcare spending for 2007. Source: OECD updated November 2011.
$0 $2,000 $4,000 $6,000 $8,00070
75
80
85
Healthcare Spending per Capita
Lif
e E
xp
ecta
ncy
Tur-key
JapanCanadaFranc
e
U.S.Ger-many
U.K.
Spain
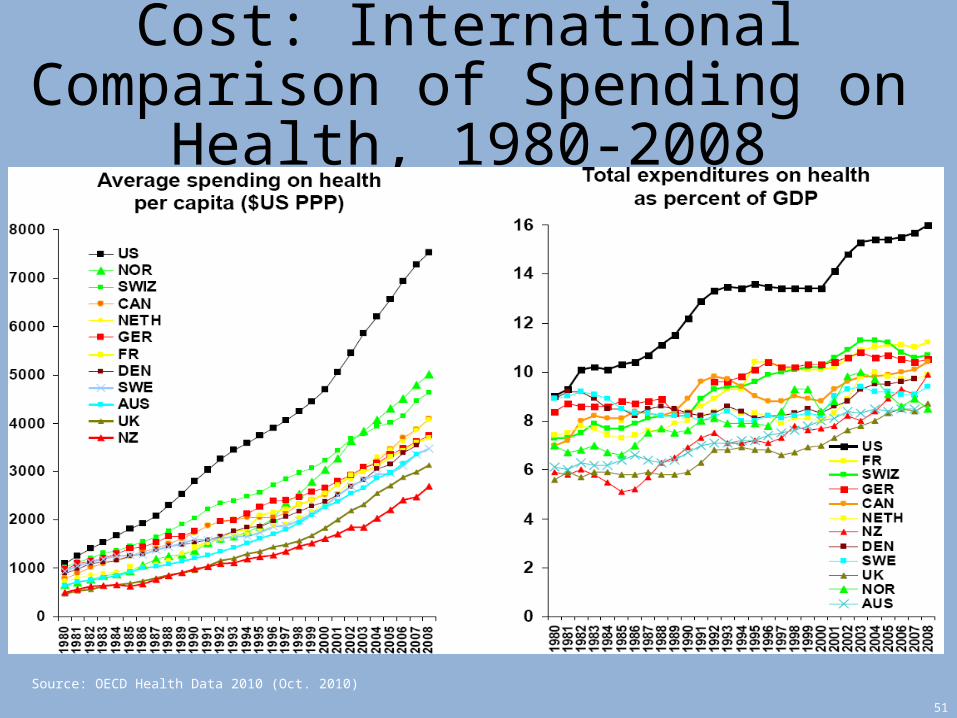
Cost: International Comparison of Spending on Health, 1980-2008
51
Source: OECD Health Data 2010 (Oct. 2010)

0%
500%
1000%
1500%
2000%
2500%
1970 1975 1980 1985 1990 1995 2000
Administrators Physicians
Who Delivers Health Care?
Growth in Physicians and Administrators since 1970
Source: BLS & Himmelstein/Woolhandler/Lewontin Analysis of CPS Data

Americans Pay World’s Highest Taxes For Healthcare
$0
$1,000
$2,000
$3,000
$4,000
$5,000
$6,000
UK Sweden Germany Canada Norway U.S.
Public Expenditures Private Expenditures
Per Capita Health Spending, 2002
OECD and “Paying for National Health Insurance—And Not Getting It”
Health Affairs: July / August 2003
Affordable Care Act: Separate and Unequal Health Care

Better Care: Does the Affordable Care Act Achieve It?
• “If you like your health care insurance… you can keep it”
• But, if you do not like it…..
• Marketplaces
• Medicaid expansion

Health Insurance MarketsPlatinum: 10 % co-pay Gold: 20% co-pay
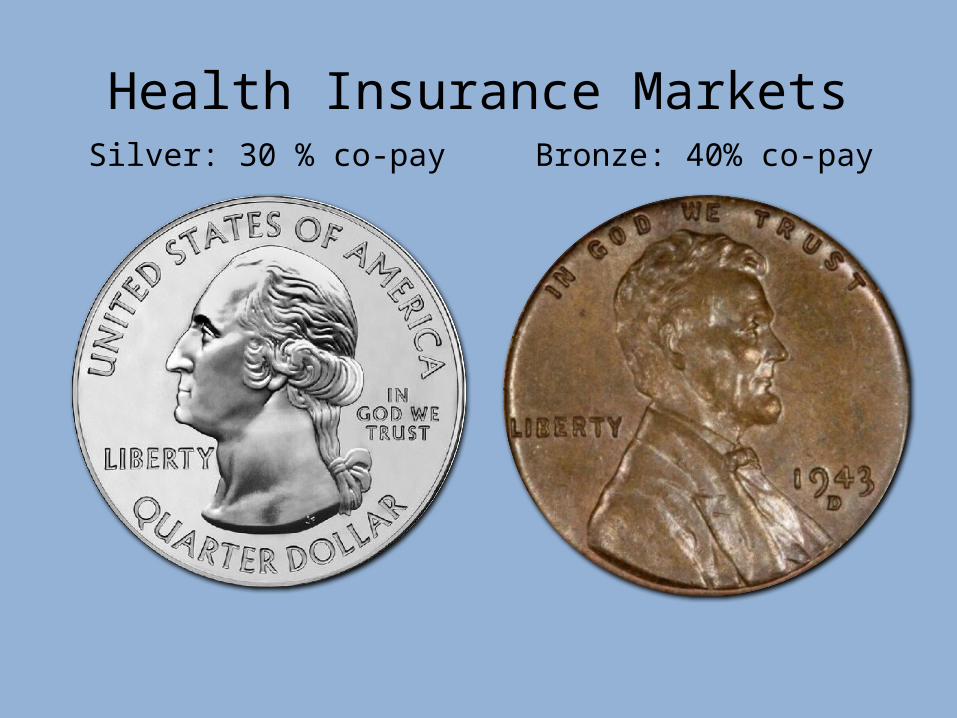
Health Insurance MarketsSilver: 30 % co-pay Bronze: 40% co-pay
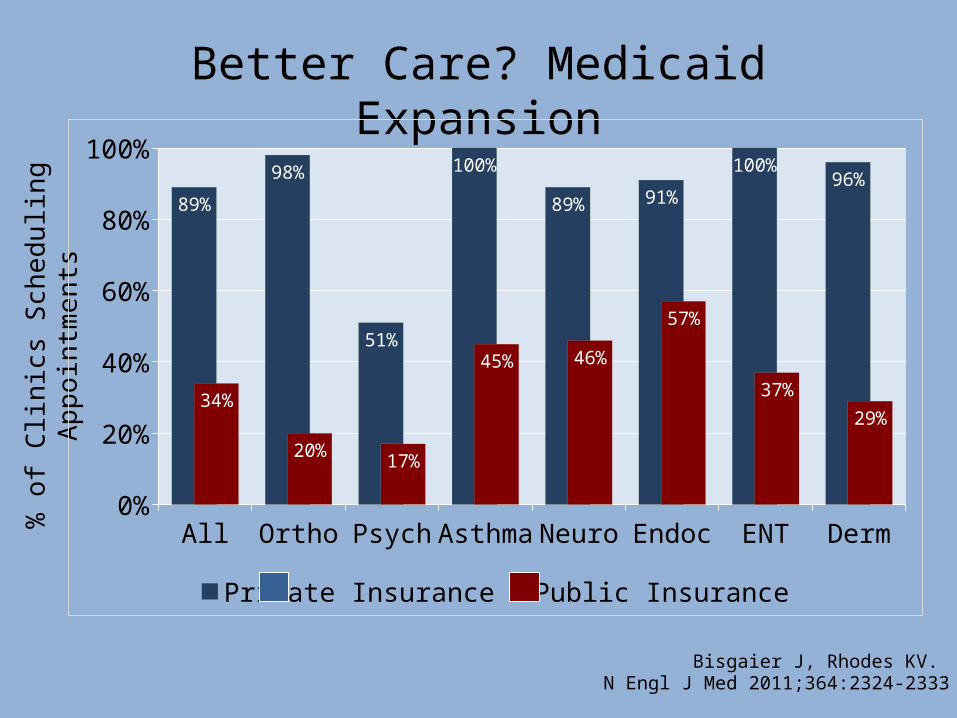
Bisgaier J, Rhodes KV. N Engl J Med 2011;364:2324-2333
Better Care? Medicaid Expansion%
of
Clin
ics
Sch
ed
ulin
g
Ap
poin
tmen
ts
All
Ortho
Psyc
h
Asthm
a
Neuro
Endo
cEN
T
Derm
0%
20%
40%
60%
80%
100%
89%
98%
51%
100%
89% 91%
100%96%
34%
20% 17%
45% 46%
57%
37%29%
Private Insurance Public Insurance
Differential Incentives leads to Inequality
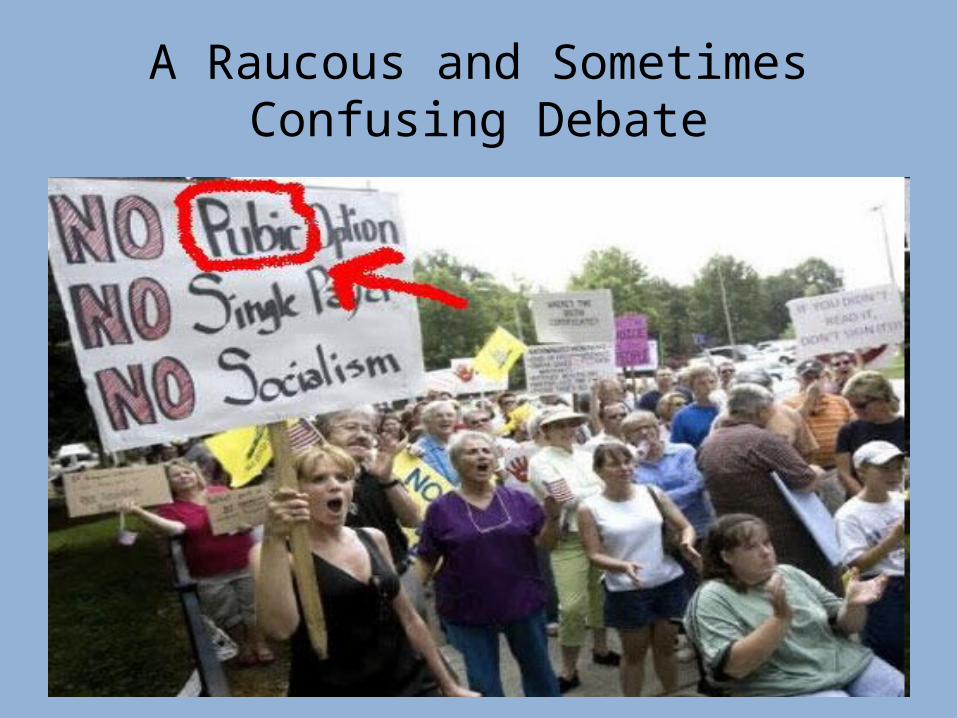
A Raucous and Sometimes Confusing Debate
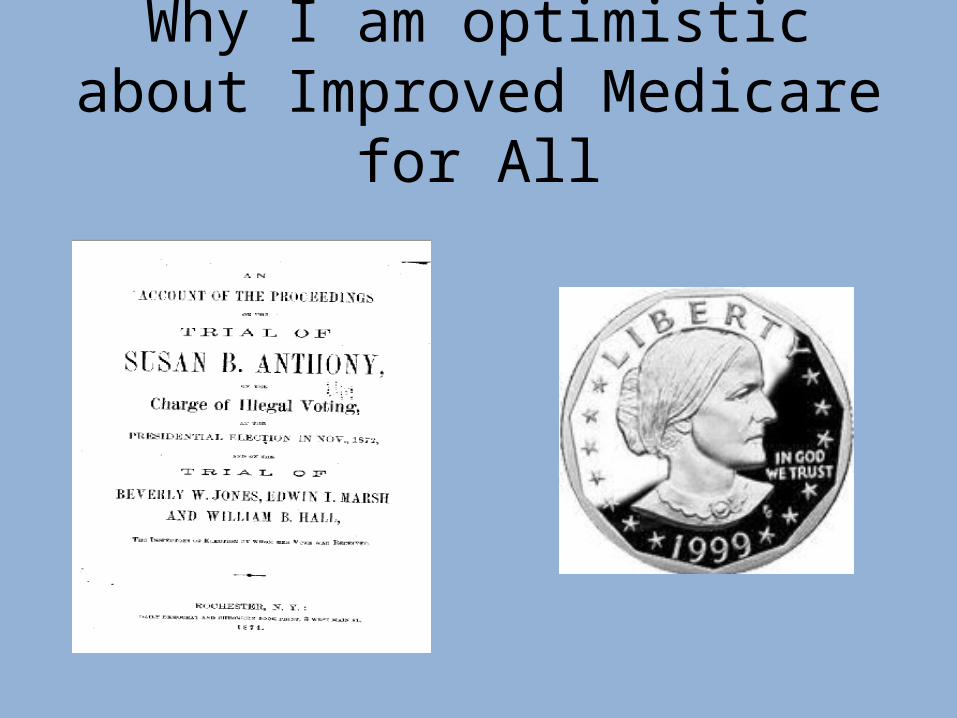
Why I am optimistic about Improved Medicare for All

Why I Became a
Doctor
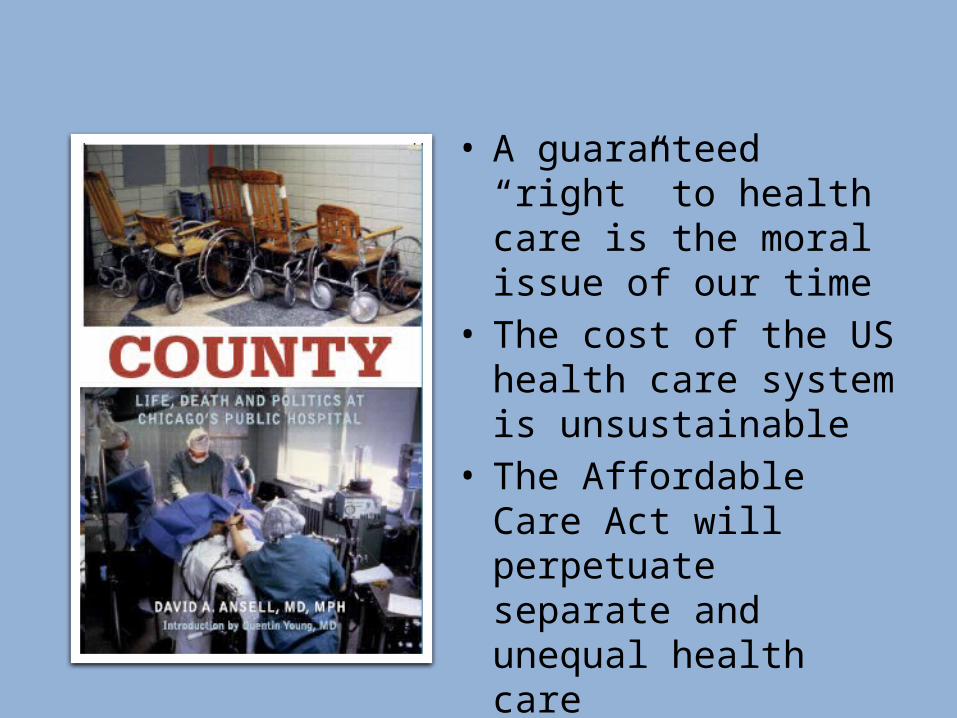
• A guaranteed “right” to health care is the moral issue of our time
• The cost of the US health care system is unsustainable
• The Affordable Care Act will perpetuate separate and unequal health care
• Only with “Improved Medicare for All” can we achieve the Triple Aim


