Financialization of Agriculture Commodity Markets and Price Volatility Dr Larry C.Y. Wong Visiting Fellow, ISIS Malaysia/ Visiting Senior Research Fellow MDRI-CESD Leaders in ASEAN Agriculture and Development - An Executive Forum 16-20 June 2014, SEARCA, College, Los Banos, Laguna, Philippines
Transcript
Financialization of Agriculture Commodity Markets and Price Volatility
Dr Larry C.Y. Wong
Visiting Fellow, ISIS Malaysia/
Visiting Senior Research Fellow MDRI-CESD
Leaders in ASEAN Agriculture and Development - An Executive Forum
16-20 June 2014, SEARCA, College, Los Banos,
Laguna, Philippines
OUTLINE: 1. Backdrop – How Commodity Markets Work – price volatility
Conundrum - ‘new reality’ – impact on Commodity markets,
Agriculture Commodity market
3. Aftermath of 2008 Food Crisis – re-regulation
4. Moving Forward – contained, but….
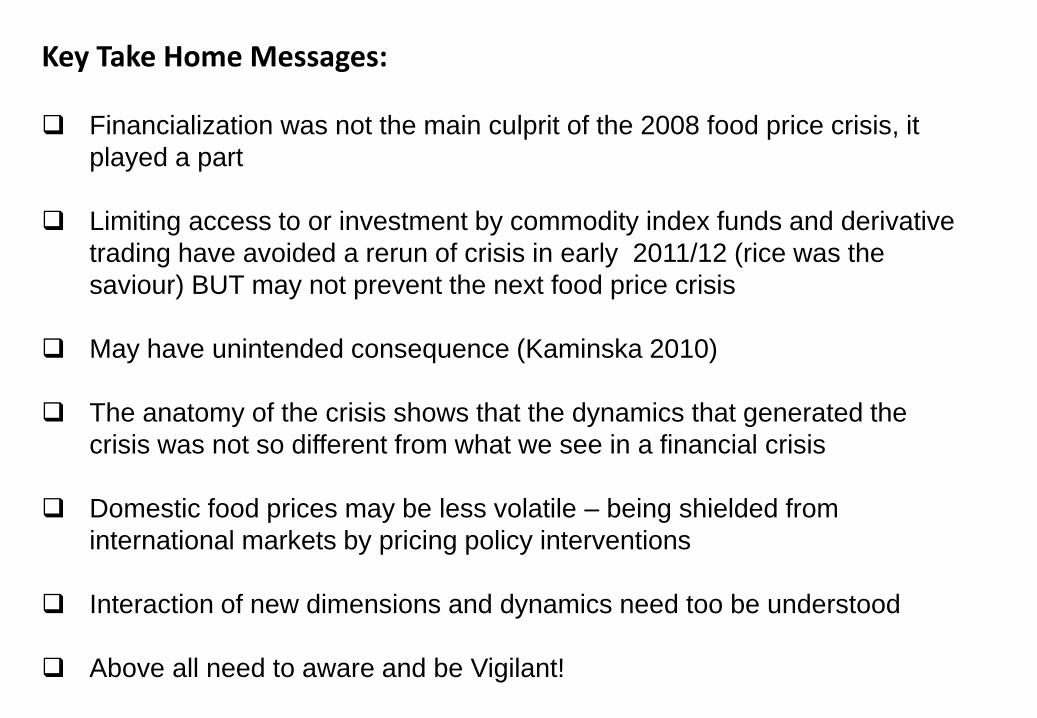
5. Key Take Home Messages
INTRODUCTION:
• Purpose: Two fold. (i) Consider ‘financialization’ of agricultural commodity
markets and impact on price volatility, Food Crisis and Food Security –
tomorrow’s issues (ii) Given the objective and orientation of this Executive
Forum, stimulate discussion at this Forum and beyond
• Underlying theme: policy makers, researchers, stakeholders should view the
Financialization of agricultural commodity markets in proper perspective as
well as understand the extent of interplay of the ‘new dimensions’ and
dynamics and be prepared to make the necessary adjustments so as to ‘get
the basics and balance right’.
• Definitions: Commodities – Goods that are capable of being traded/delivered,
including metals, agricultural products, and energy products such as gas and
oil.
• Financialization – the increasing role of financial motives, financial markets,
financial actors and financial institutions
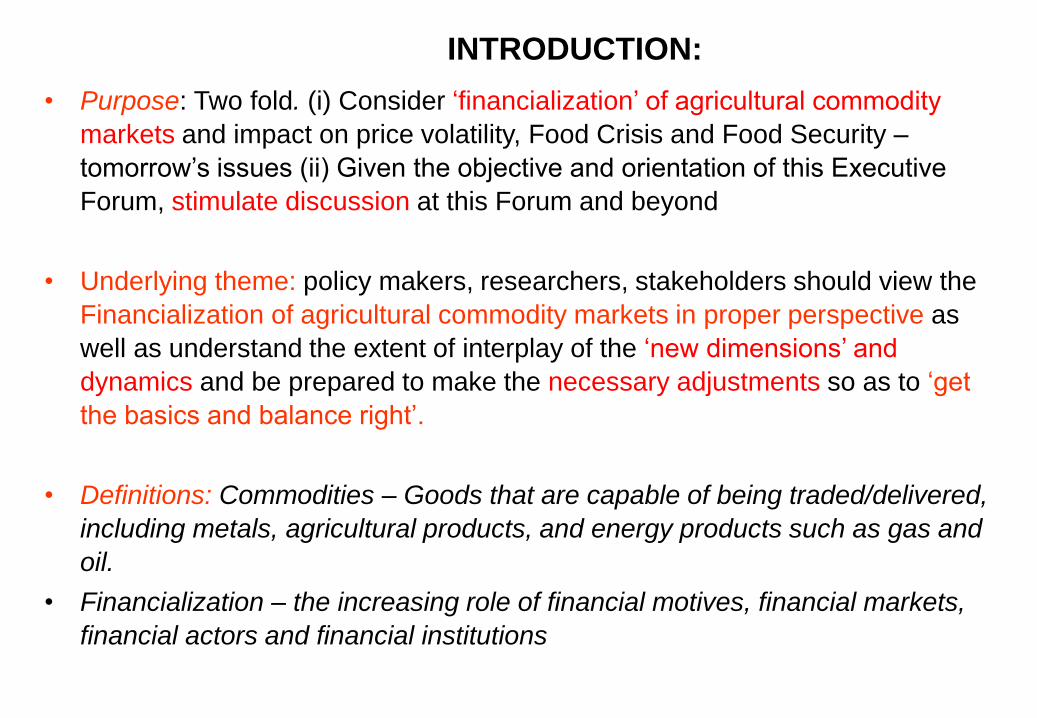
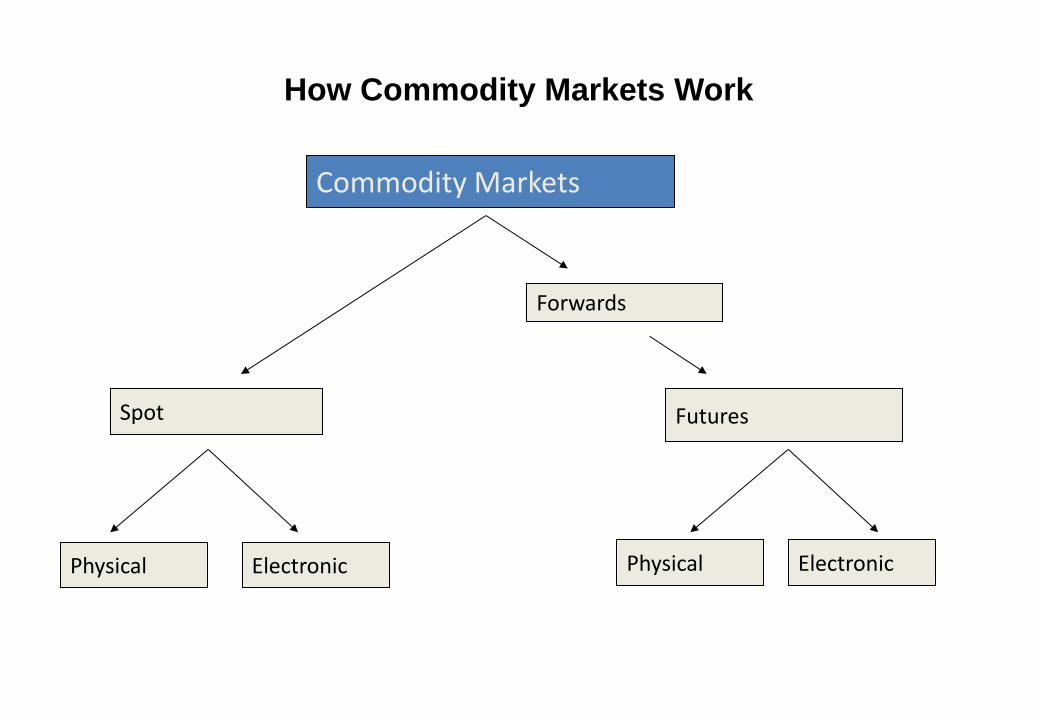
How Commodity Markets Work
Commodity Markets
Spot
Forwards
Futures
Physical Electronic Physical Electronic
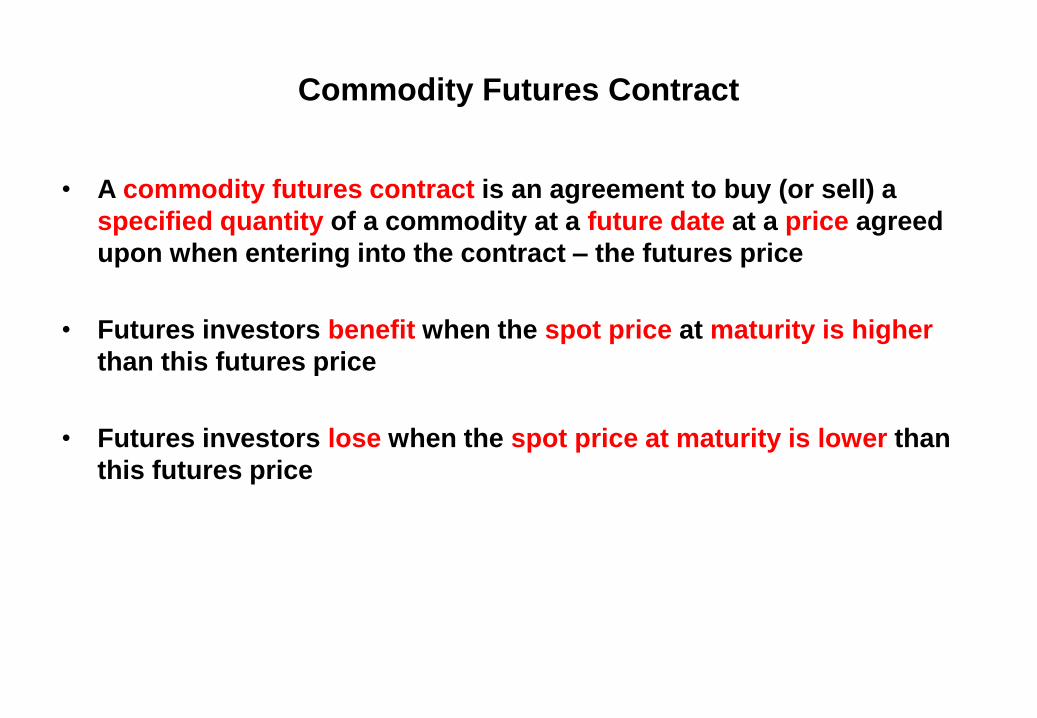
Commodity Futures Contract
• A commodity futures contract is an agreement to buy (or sell) a
specified quantity of a commodity at a future date at a price agreed
upon when entering into the contract – the futures price
• Futures investors benefit when the spot price at maturity is higher
than this futures price
• Futures investors lose when the spot price at maturity is lower than
this futures price
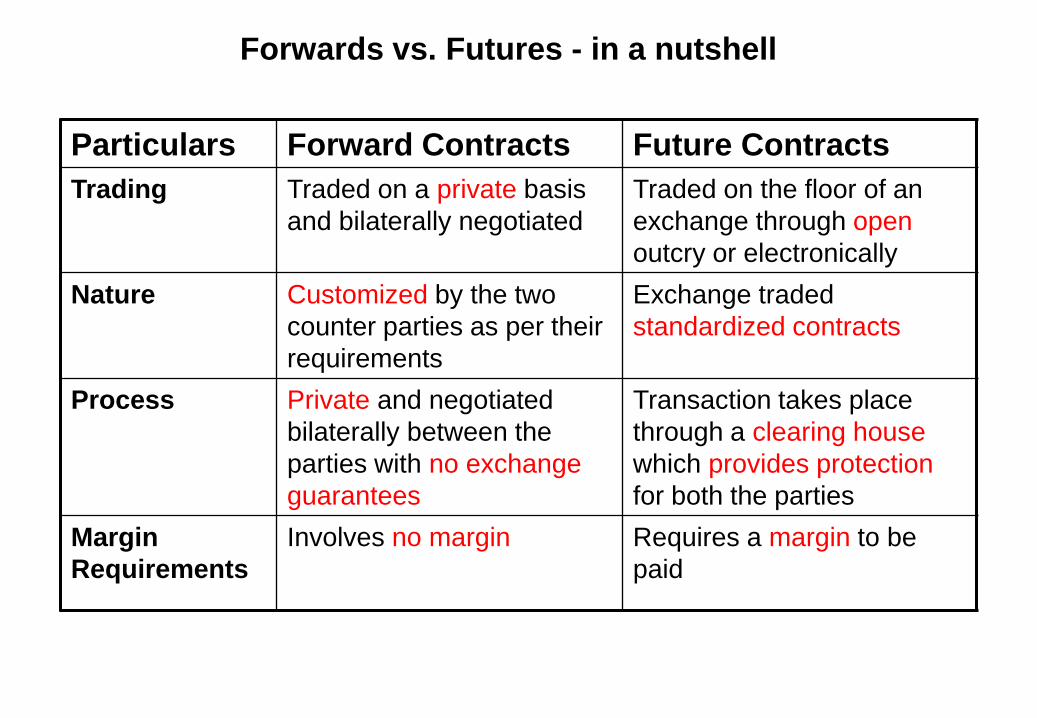
Forwards vs. Futures - in a nutshell
Particulars Forward Contracts Future Contracts
Trading Traded on a private basis
and bilaterally negotiated
Traded on the floor of an
exchange through open
outcry or electronically
Nature Customized by the two
counter parties as per their
requirements
Exchange traded
standardized contracts
Process Private and negotiated
bilaterally between the
parties with no exchange
guarantees
Transaction takes place
through a clearing house
which provides protection
for both the parties
Margin
Requirements
Involves no margin Requires a margin to be
paid
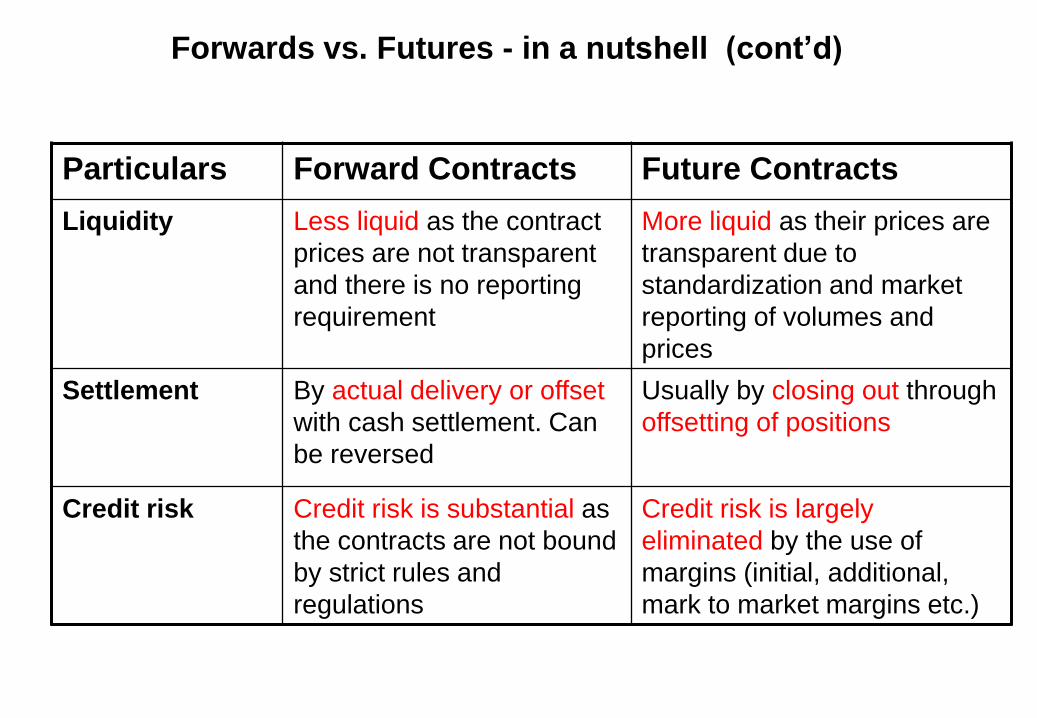
Forwards vs. Futures - in a nutshell (cont’d)
Particulars Forward Contracts Future Contracts
Liquidity Less liquid as the contract
prices are not transparent
and there is no reporting
requirement
More liquid as their prices are
transparent due to
standardization and market
reporting of volumes and
prices
Settlement By actual delivery or offset
with cash settlement. Can
be reversed
Usually by closing out through
offsetting of positions
Credit risk Credit risk is substantial as
the contracts are not bound
by strict rules and
regulations
Credit risk is largely
eliminated by the use of
margins (initial, additional,
mark to market margins etc.)
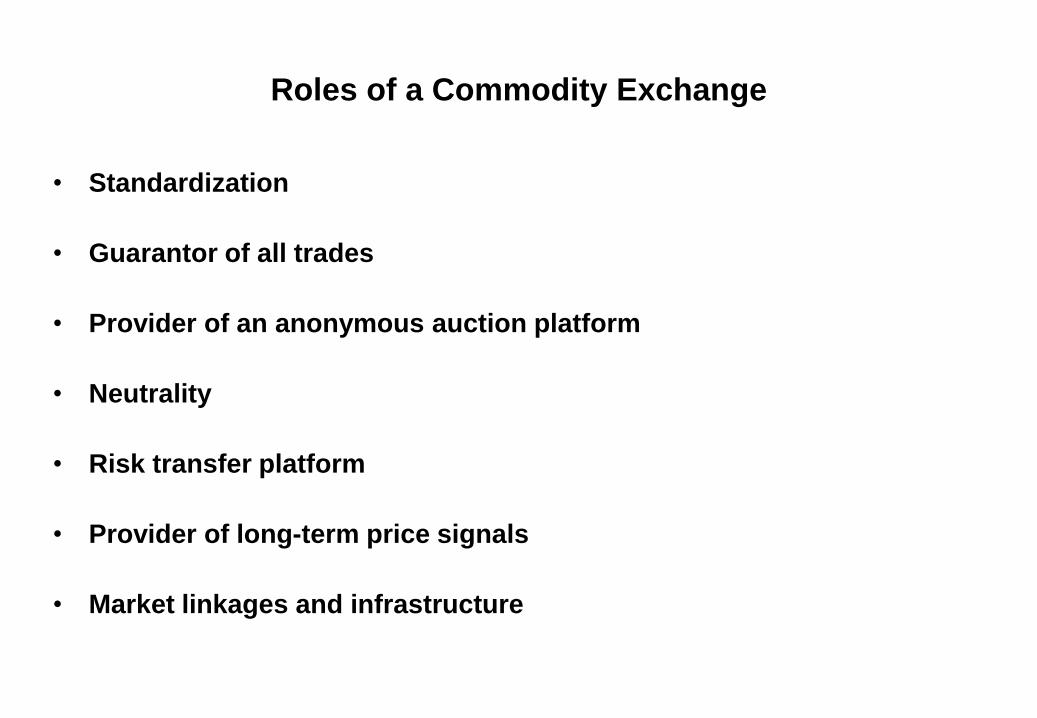
Roles of a Commodity Exchange
• Standardization
• Guarantor of all trades
• Provider of an anonymous auction platform
• Neutrality
• Risk transfer platform
• Provider of long-term price signals
• Market linkages and infrastructure
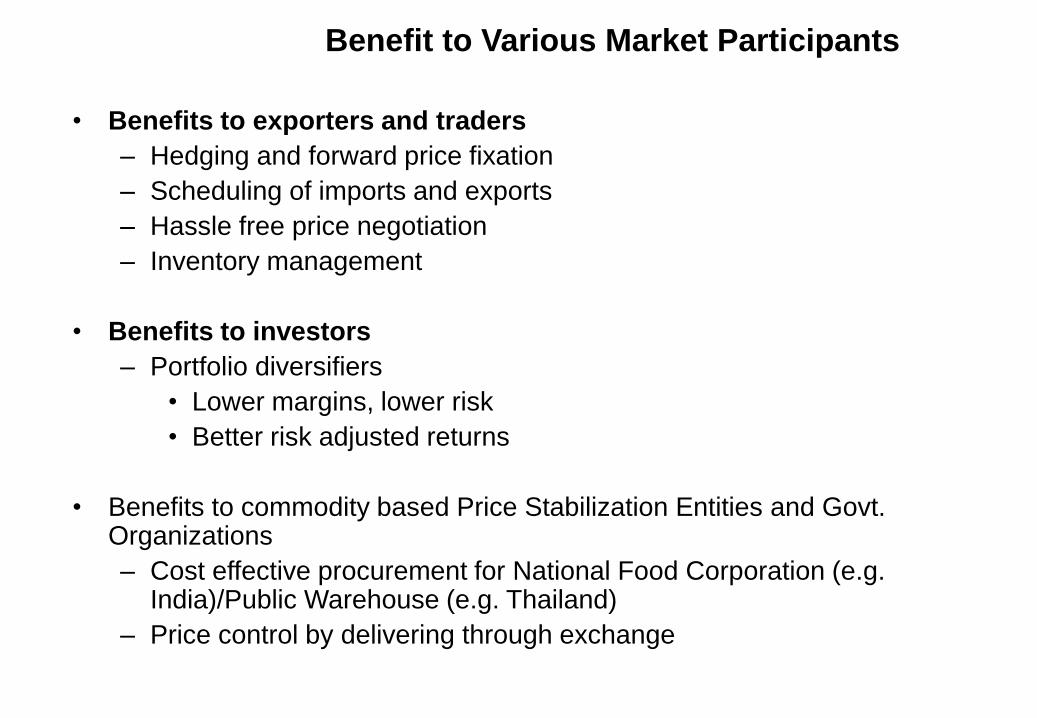
Benefit to Various Market Participants
• Benefits to exporters and traders
– Hedging and forward price fixation
– Scheduling of imports and exports
– Hassle free price negotiation
– Inventory management
• Benefits to investors
– Portfolio diversifiers
• Lower margins, lower risk
• Better risk adjusted returns
• Benefits to commodity based Price Stabilization Entities and Govt. Organizations
– Cost effective procurement for National Food Corporation (e.g. India)/Public Warehouse (e.g. Thailand)
– Price control by delivering through exchange
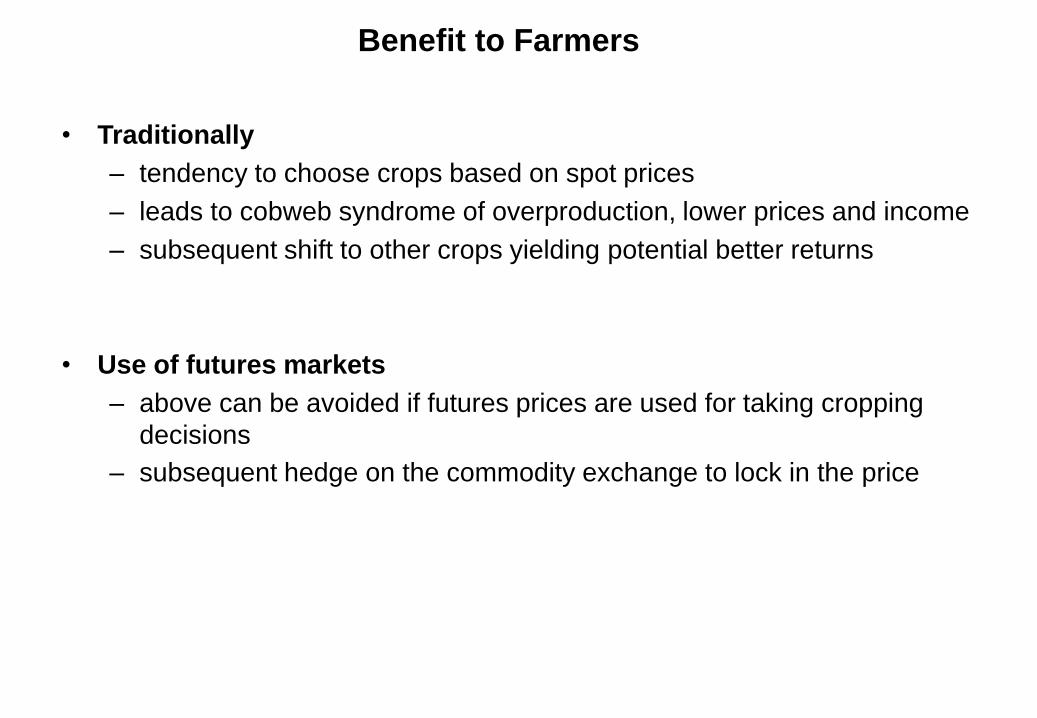
Benefit to Farmers
• Traditionally
– tendency to choose crops based on spot prices
– leads to cobweb syndrome of overproduction, lower prices and income
– subsequent shift to other crops yielding potential better returns
• Use of futures markets
– above can be avoided if futures prices are used for taking cropping
decisions
– subsequent hedge on the commodity exchange to lock in the price
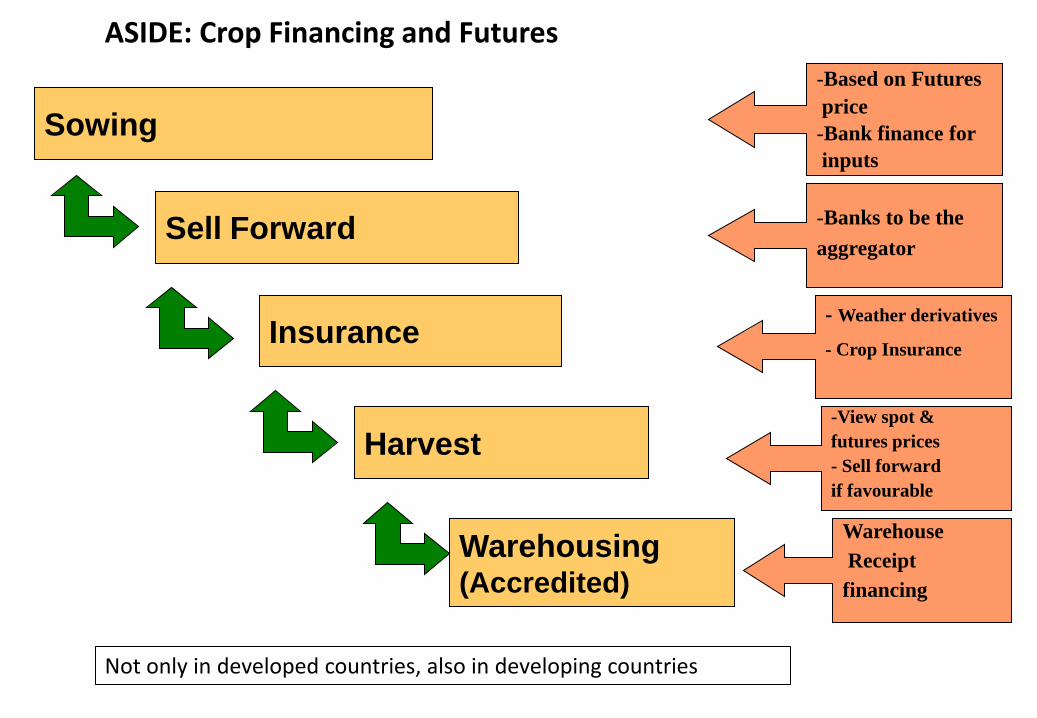
Sowing
Harvest
Warehousing (Accredited)
Insurance
Sell Forward
Warehouse
Receipt
financing
-View spot &
futures prices
- Sell forward
if favourable
- Weather derivatives
- Crop Insurance
-Banks to be the
aggregator
-Based on Futures
price
-Bank finance for
inputs
ASIDE: Crop Financing and Futures
Not only in developed countries, also in developing countries
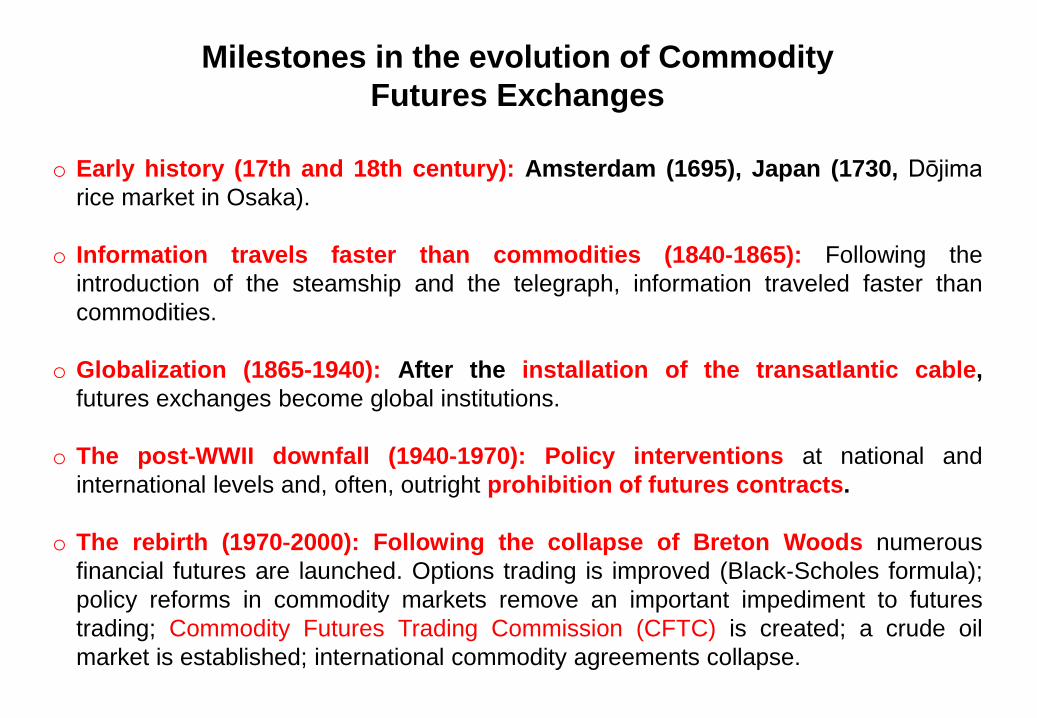
o Early history (17th and 18th century): Amsterdam (1695), Japan (1730, Dōjima
rice market in Osaka).
o Information travels faster than commodities (1840‐1865): Following the
introduction of the steamship and the telegraph, information traveled faster than
commodities.
o Globalization (1865‐1940): After the installation of the transatlantic cable,
futures exchanges become global institutions.
o The post‐WWII downfall (1940‐1970): Policy interventions at national and
international levels and, often, outright prohibition of futures contracts.
o The rebirth (1970‐2000): Following the collapse of Breton Woods numerous
financial futures are launched. Options trading is improved (Black‐Scholes formula);
policy reforms in commodity markets remove an important impediment to futures
trading; Commodity Futures Trading Commission (CFTC) is created; a crude oil
market is established; international commodity agreements collapse.
Milestones in the evolution of Commodity
Futures Exchanges
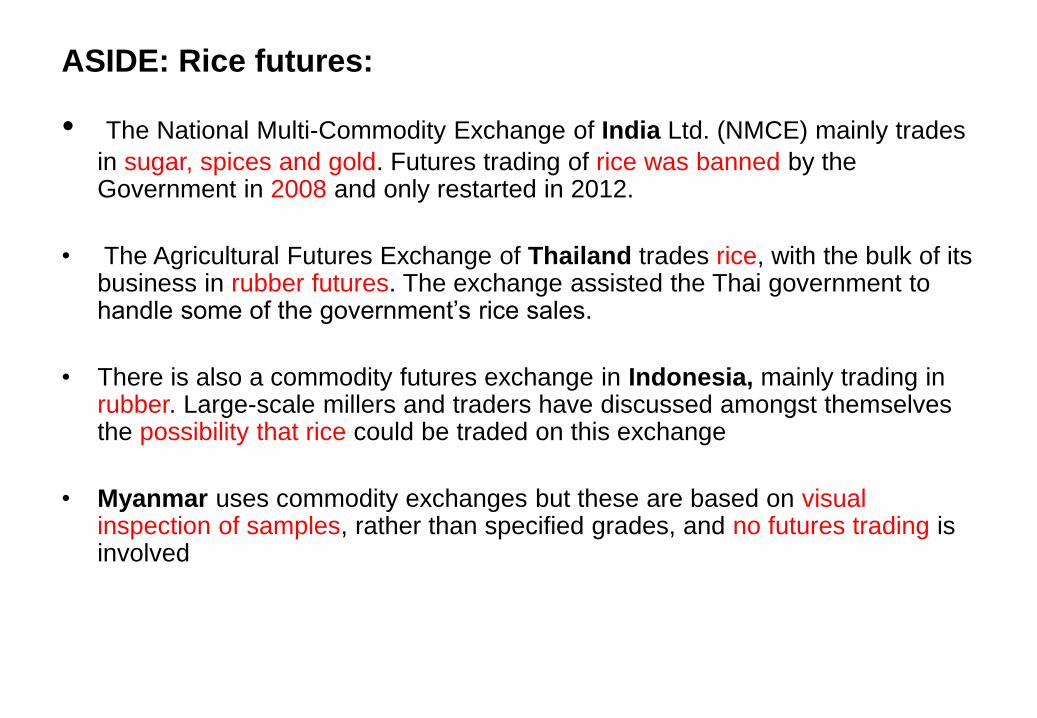
ASIDE: Rice futures:
• The National Multi-Commodity Exchange of India Ltd. (NMCE) mainly trades
in sugar, spices and gold. Futures trading of rice was banned by the Government in 2008 and only restarted in 2012.
• The Agricultural Futures Exchange of Thailand trades rice, with the bulk of its business in rubber futures. The exchange assisted the Thai government to handle some of the government’s rice sales.
• There is also a commodity futures exchange in Indonesia, mainly trading in rubber. Large-scale millers and traders have discussed amongst themselves the possibility that rice could be traded on this exchange
• Myanmar uses commodity exchanges but these are based on visual inspection of samples, rather than specified grades, and no futures trading is involved
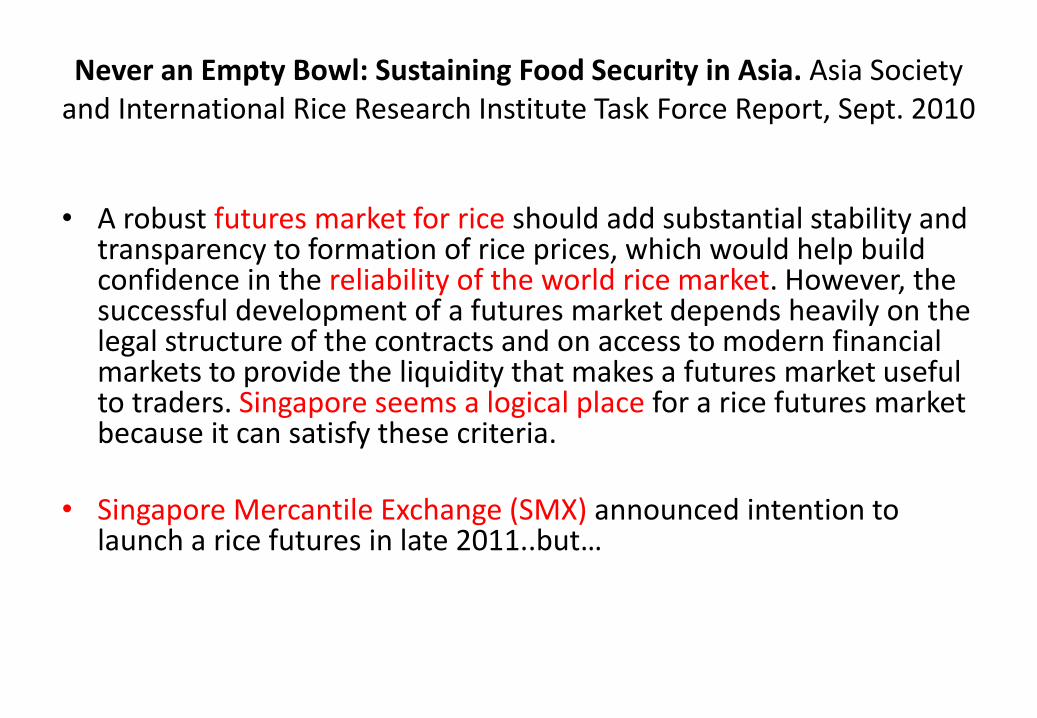
Never an Empty Bowl: Sustaining Food Security in Asia. Asia Society and International Rice Research Institute Task Force Report, Sept. 2010
• A robust futures market for rice should add substantial stability and transparency to formation of rice prices, which would help build confidence in the reliability of the world rice market. However, the successful development of a futures market depends heavily on the legal structure of the contracts and on access to modern financial markets to provide the liquidity that makes a futures market useful to traders. Singapore seems a logical place for a rice futures market because it can satisfy these criteria.
• Singapore Mercantile Exchange (SMX) announced intention to launch a rice futures in late 2011..but…
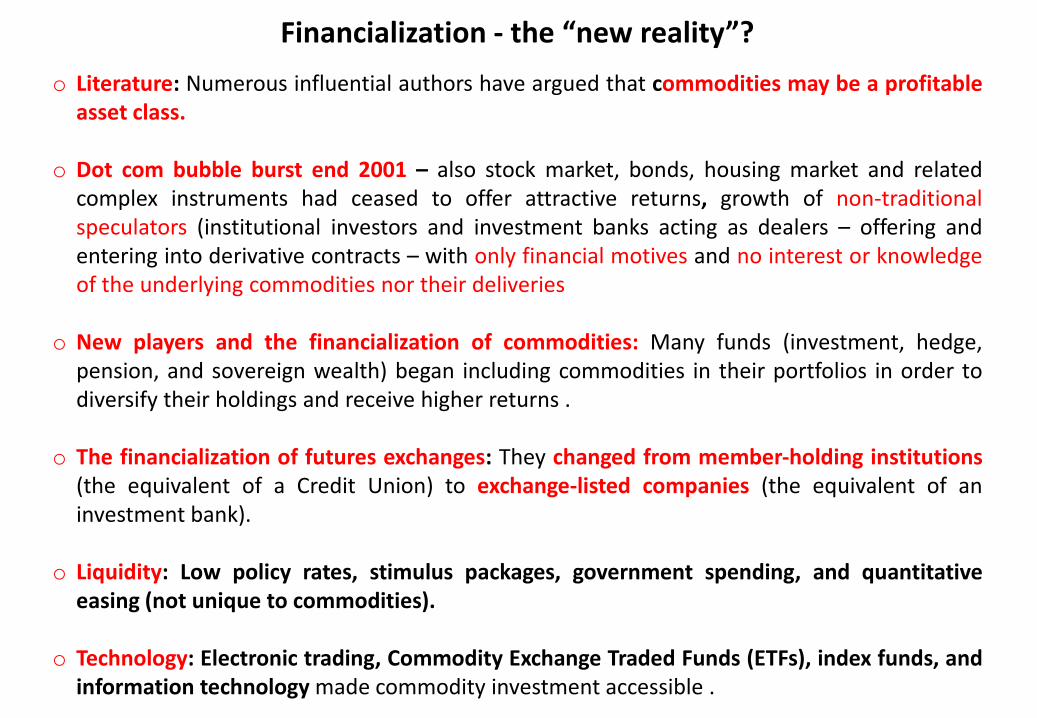
o Literature: Numerous influential authors have argued that commodities may be a profitable asset class.
o Dot com bubble burst end 2001 – also stock market, bonds, housing market and related complex instruments had ceased to offer attractive returns, growth of non-traditional speculators (institutional investors and investment banks acting as dealers – offering and entering into derivative contracts – with only financial motives and no interest or knowledge of the underlying commodities nor their deliveries
o New players and the financialization of commodities: Many funds (investment, hedge, pension, and sovereign wealth) began including commodities in their portfolios in order to diversify their holdings and receive higher returns .
o The financialization of futures exchanges: They changed from member‐holding institutions (the equivalent of a Credit Union) to exchange‐listed companies (the equivalent of an investment bank).
o Liquidity: Low policy rates, stimulus packages, government spending, and quantitative easing (not unique to commodities).
o Technology: Electronic trading, Commodity Exchange Traded Funds (ETFs), index funds, and information technology made commodity investment accessible .
Financialization - the “new reality”?
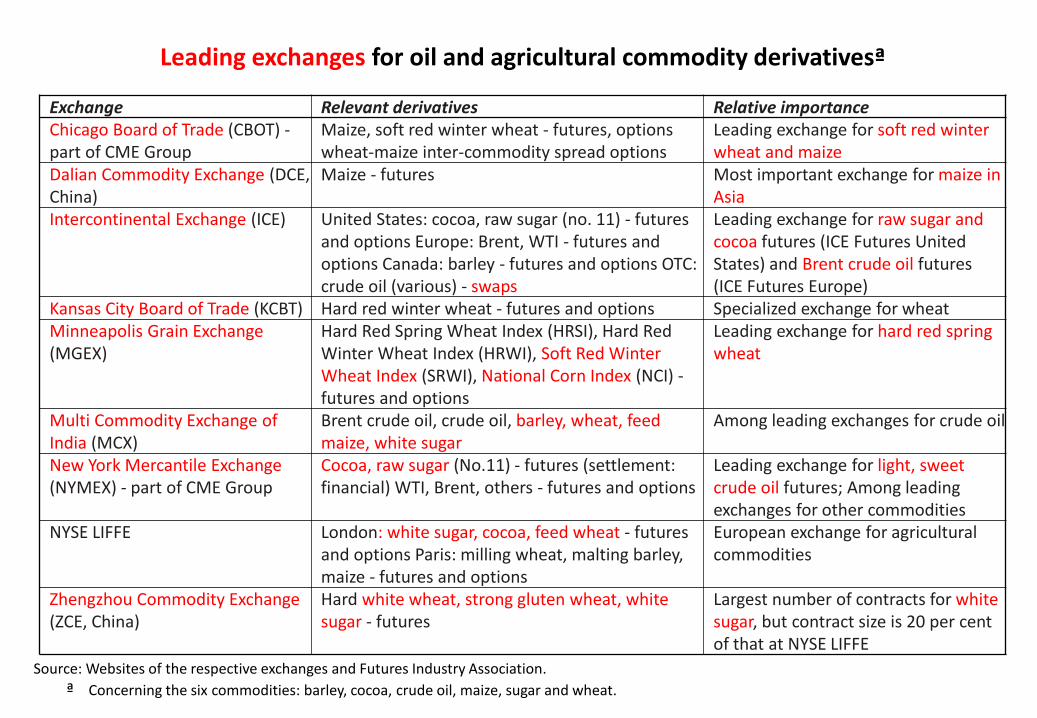
Leading exchanges for oil and agricultural commodity derivativesª
Exchange Relevant derivatives Relative importance Chicago Board of Trade (CBOT) - part of CME Group
Leading exchange for soft red winter wheat and maize
Dalian Commodity Exchange (DCE, China)
Maize - futures Most important exchange for maize in Asia
Intercontinental Exchange (ICE) United States: cocoa, raw sugar (no. 11) - futures and options Europe: Brent, WTI - futures and options Canada: barley - futures and options OTC: crude oil (various) - swaps
Leading exchange for raw sugar and cocoa futures (ICE Futures United States) and Brent crude oil futures (ICE Futures Europe)
Kansas City Board of Trade (KCBT) Hard red winter wheat - futures and options Specialized exchange for wheat Minneapolis Grain Exchange (MGEX)
Hard Red Spring Wheat Index (HRSI), Hard Red Winter Wheat Index (HRWI), Soft Red Winter Wheat Index (SRWI), National Corn Index (NCI) - futures and options
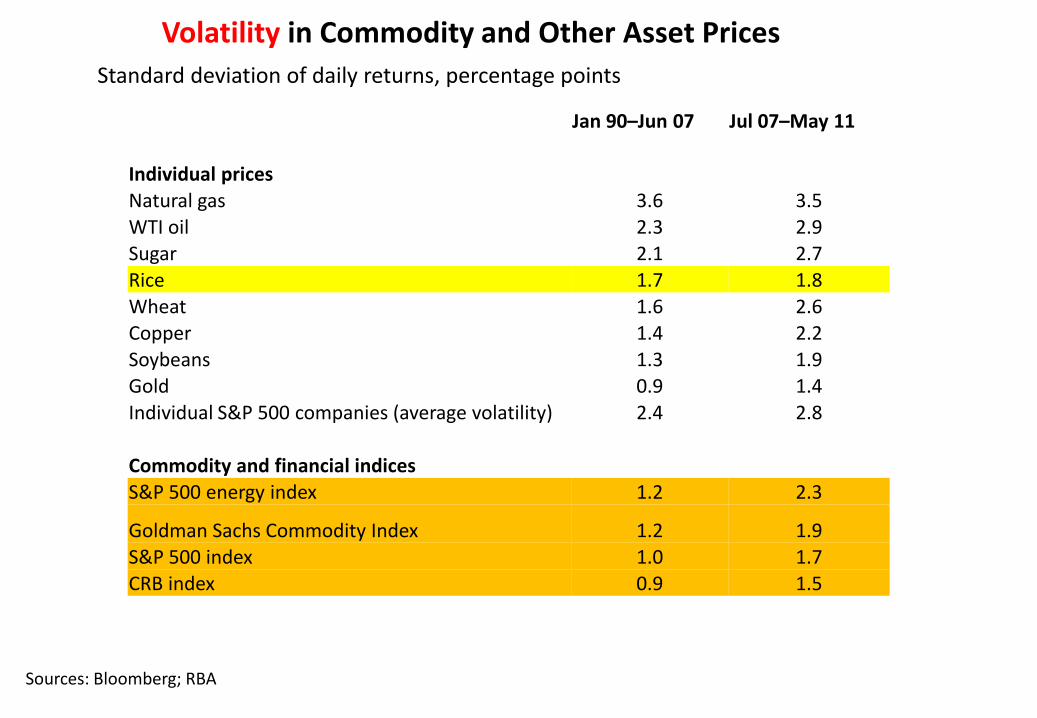
Commodity and financial indices S&P 500 energy index 1.2 2.3
Goldman Sachs Commodity Index 1.2 1.9 S&P 500 index 1.0 1.7 CRB index 0.9 1.5
Sources: Bloomberg; RBA
Standard deviation of daily returns, percentage points
Volatility in Commodity and Other Asset Prices
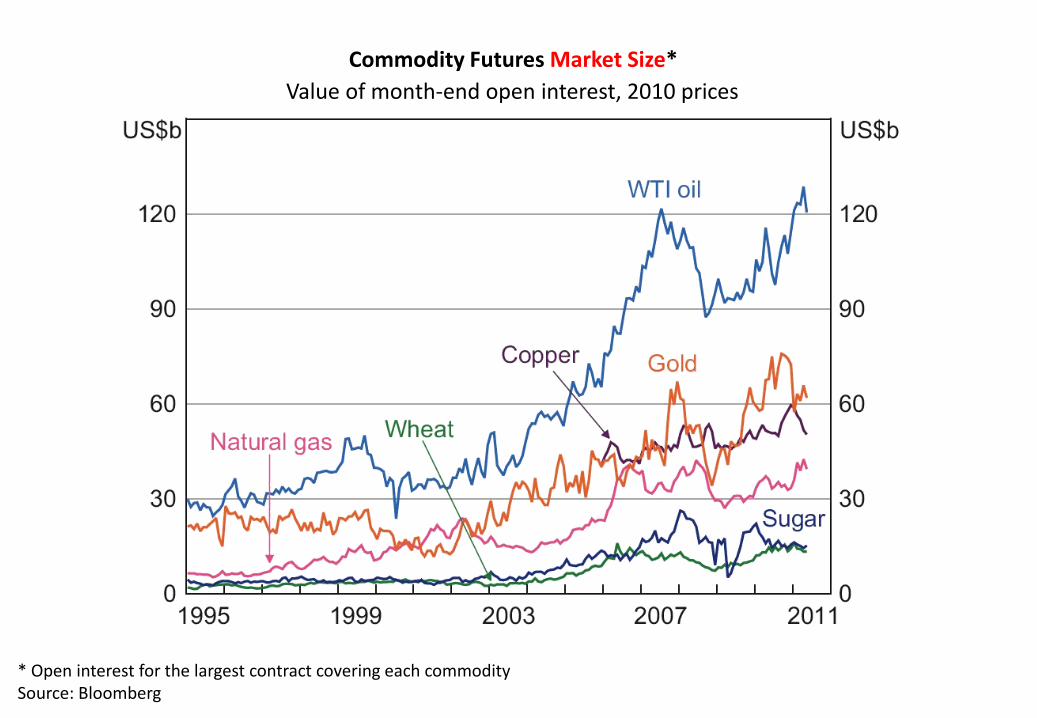
Commodity Futures Market Size*
Value of month-end open interest, 2010 prices
* Open interest for the largest contract covering each commodity Source: Bloomberg
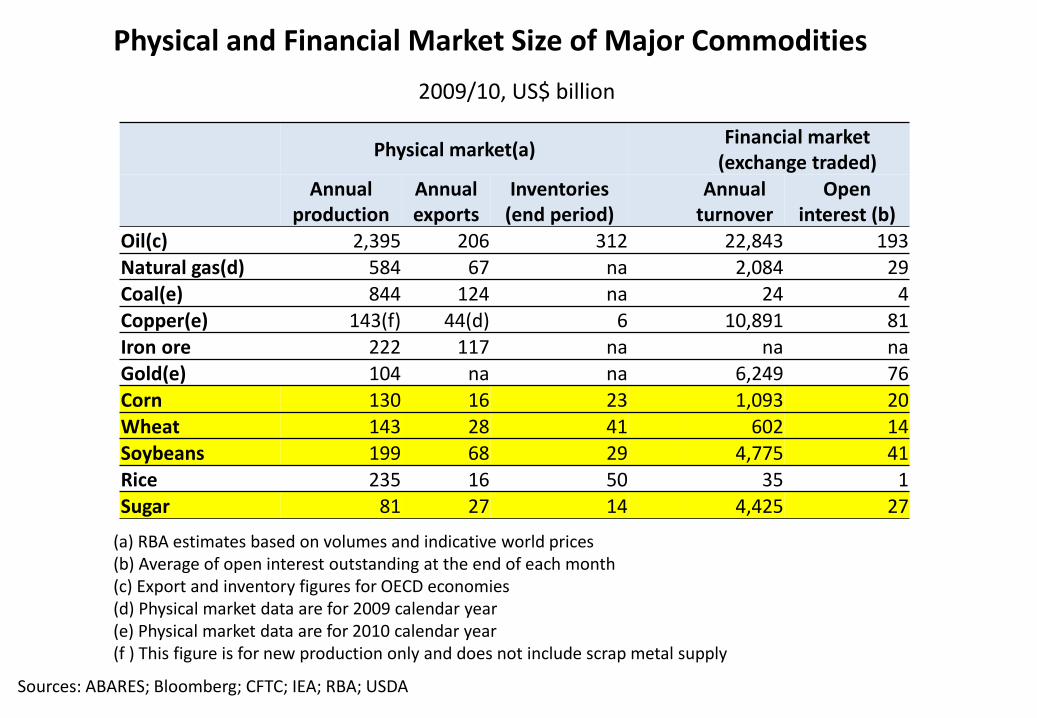
Physical market(a) Financial market
(exchange traded)
Annual
production Annual exports
Inventories (end period)
Annual
turnover Open
interest (b) Oil(c) 2,395 206 312 22,843 193
Natural gas(d) 584 67 na 2,084 29
Coal(e) 844 124 na 24 4
Copper(e) 143(f) 44(d) 6 10,891 81 Iron ore 222 117 na na na Gold(e) 104 na na 6,249 76
Corn 130 16 23 1,093 20 Wheat 143 28 41 602 14
Soybeans 199 68 29 4,775 41
Rice 235 16 50 35 1
Sugar 81 27 14 4,425 27
(a) RBA estimates based on volumes and indicative world prices (b) Average of open interest outstanding at the end of each month (c) Export and inventory figures for OECD economies (d) Physical market data are for 2009 calendar year (e) Physical market data are for 2010 calendar year (f ) This figure is for new production only and does not include scrap metal supply
Sources: ABARES; Bloomberg; CFTC; IEA; RBA; USDA
Physical and Financial Market Size of Major Commodities
2009/10, US$ billion
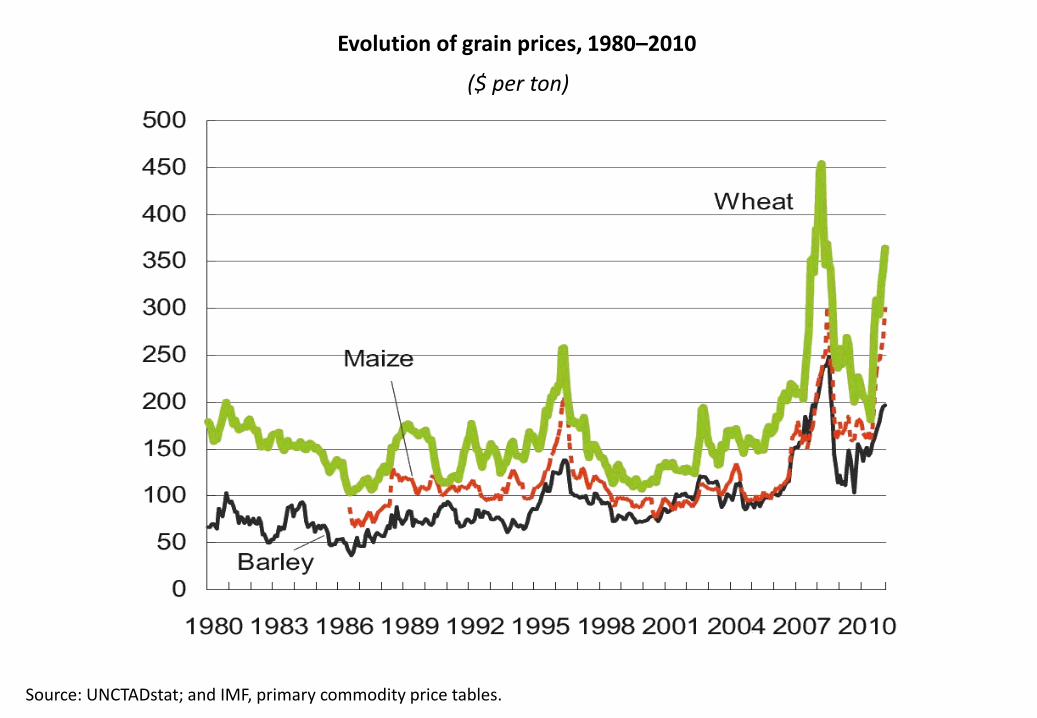
Evolution of grain prices, 1980–2010
($ per ton)
Source: UNCTADstat; and IMF, primary commodity price tables.
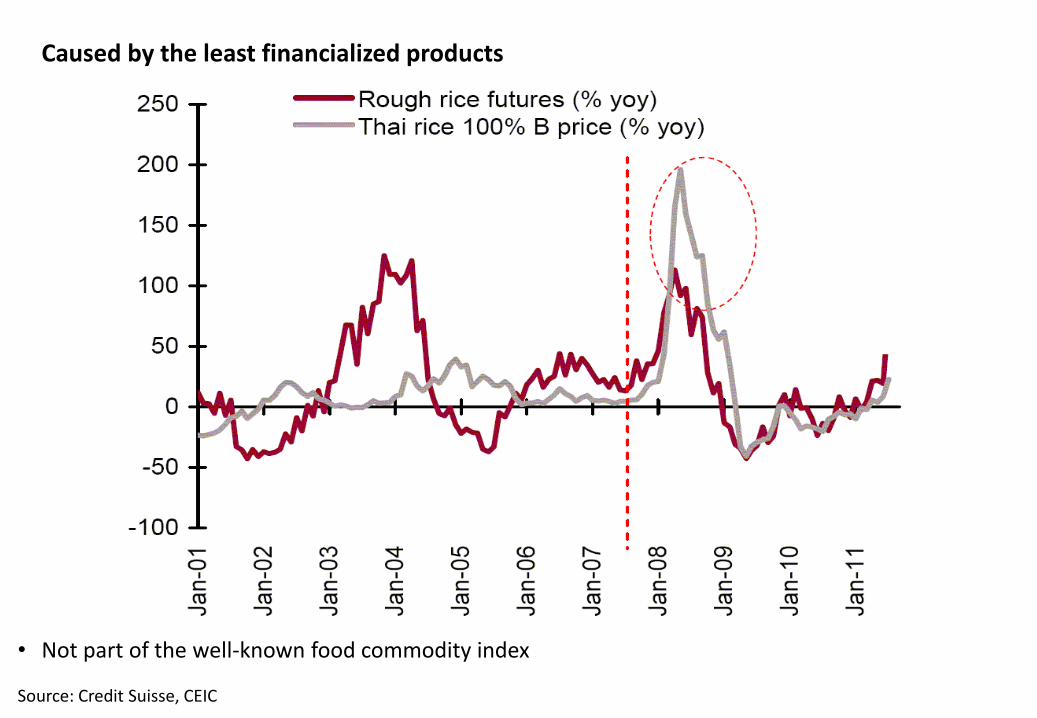
Caused by the least financialized products
• Not part of the well-known food commodity index
Source: Credit Suisse, CEIC
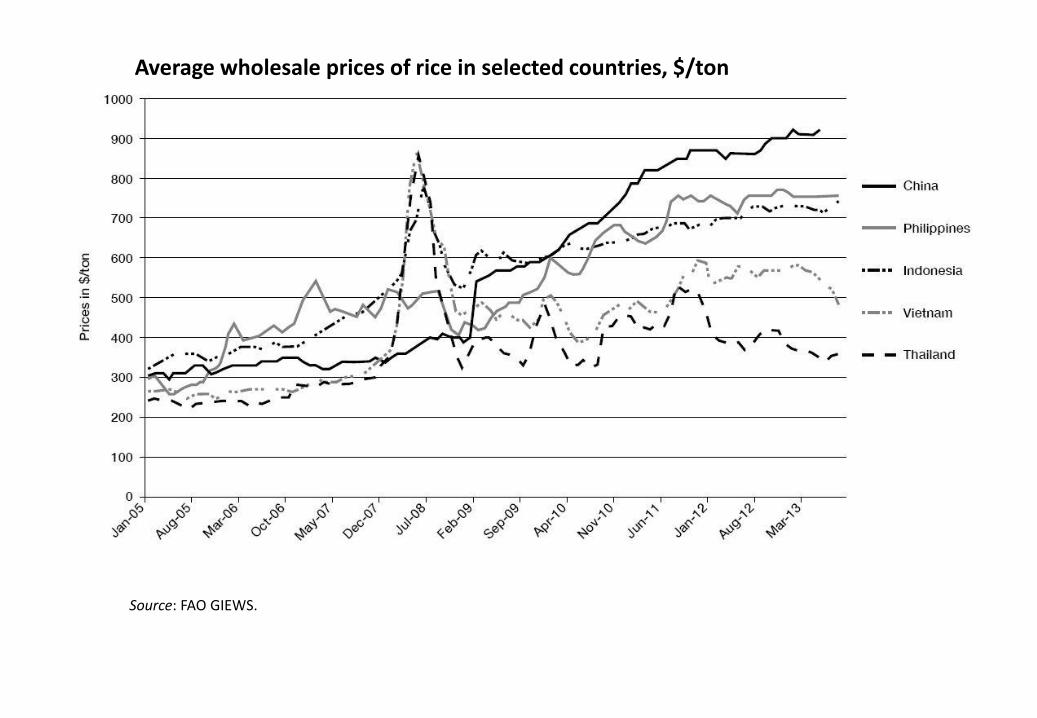
Average wholesale prices of rice in selected countries, $/ton
Source: FAO GIEWS.
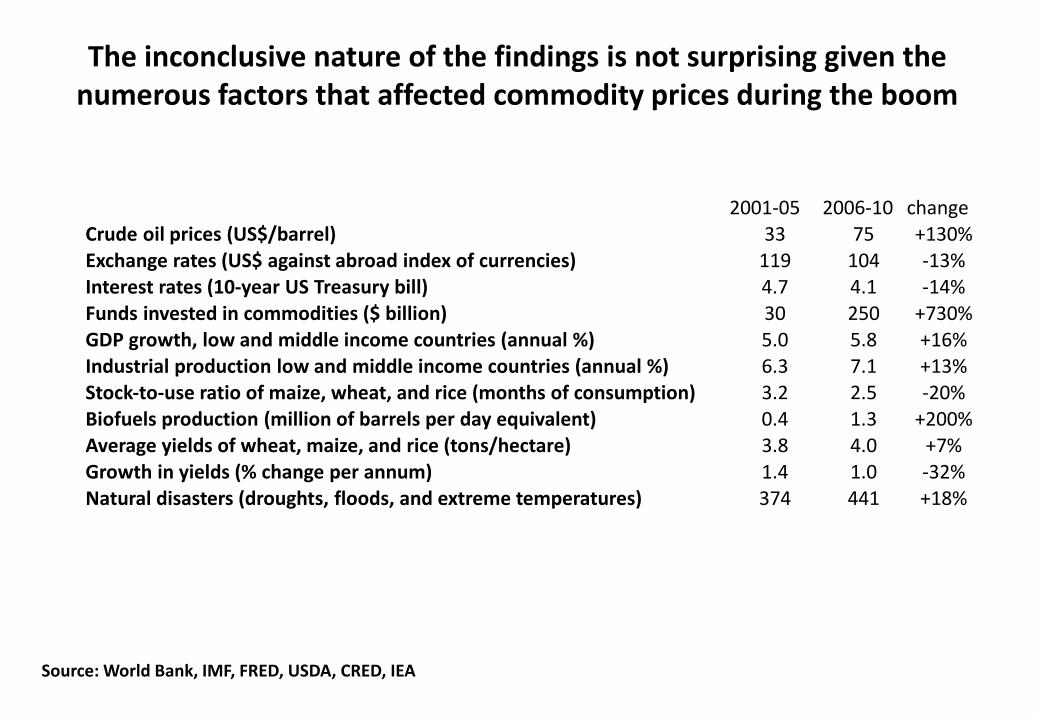
2001‐05 2006‐10 change Crude oil prices (US$/barrel) 33 75 +130% Exchange rates (US$ against abroad index of currencies) 119 104 -13% Interest rates (10‐year US Treasury bill) 4.7 4.1 -14% Funds invested in commodities ($ billion) 30 250 +730% GDP growth, low and middle income countries (annual %) 5.0 5.8 +16% Industrial production low and middle income countries (annual %) 6.3 7.1 +13% Stock‐to‐use ratio of maize, wheat, and rice (months of consumption) 3.2 2.5 -20% Biofuels production (million of barrels per day equivalent) 0.4 1.3 +200% Average yields of wheat, maize, and rice (tons/hectare) 3.8 4.0 +7% Growth in yields (% change per annum) 1.4 1.0 -32% Natural disasters (droughts, floods, and extreme temperatures) 374 441 +18%
The inconclusive nature of the findings is not surprising given the numerous factors that affected commodity prices during the boom
Source: World Bank, IMF, FRED, USDA, CRED, IEA
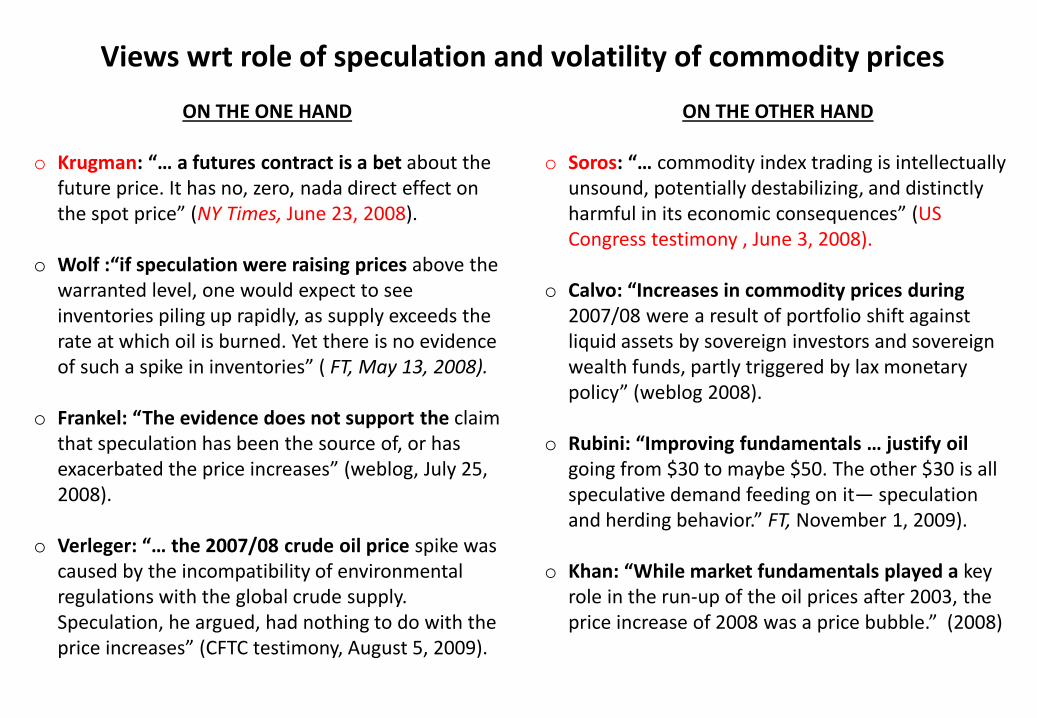
ON THE ONE HAND
o Krugman: “… a futures contract is a bet about the future price. It has no, zero, nada direct effect on the spot price” (NY Times, June 23, 2008).
o Wolf :“if speculation were raising prices above the warranted level, one would expect to see inventories piling up rapidly, as supply exceeds the rate at which oil is burned. Yet there is no evidence of such a spike in inventories” ( FT, May 13, 2008).
o Frankel: “The evidence does not support the claim that speculation has been the source of, or has exacerbated the price increases” (weblog, July 25, 2008).
o Verleger: “… the 2007/08 crude oil price spike was caused by the incompatibility of environmental regulations with the global crude supply. Speculation, he argued, had nothing to do with the price increases” (CFTC testimony, August 5, 2009).
ON THE OTHER HAND
o Soros: “… commodity index trading is intellectually unsound, potentially destabilizing, and distinctly harmful in its economic consequences” (US Congress testimony , June 3, 2008).
o Calvo: “Increases in commodity prices during 2007/08 were a result of portfolio shift against liquid assets by sovereign investors and sovereign wealth funds, partly triggered by lax monetary policy” (weblog 2008).
o Rubini: “Improving fundamentals … justify oil going from $30 to maybe $50. The other $30 is all speculative demand feeding on it— speculation and herding behavior.” FT, November 1, 2009).
o Khan: “While market fundamentals played a key role in the run‐up of the oil prices after 2003, the price increase of 2008 was a price bubble.” (2008)
Views wrt role of speculation and volatility of commodity prices
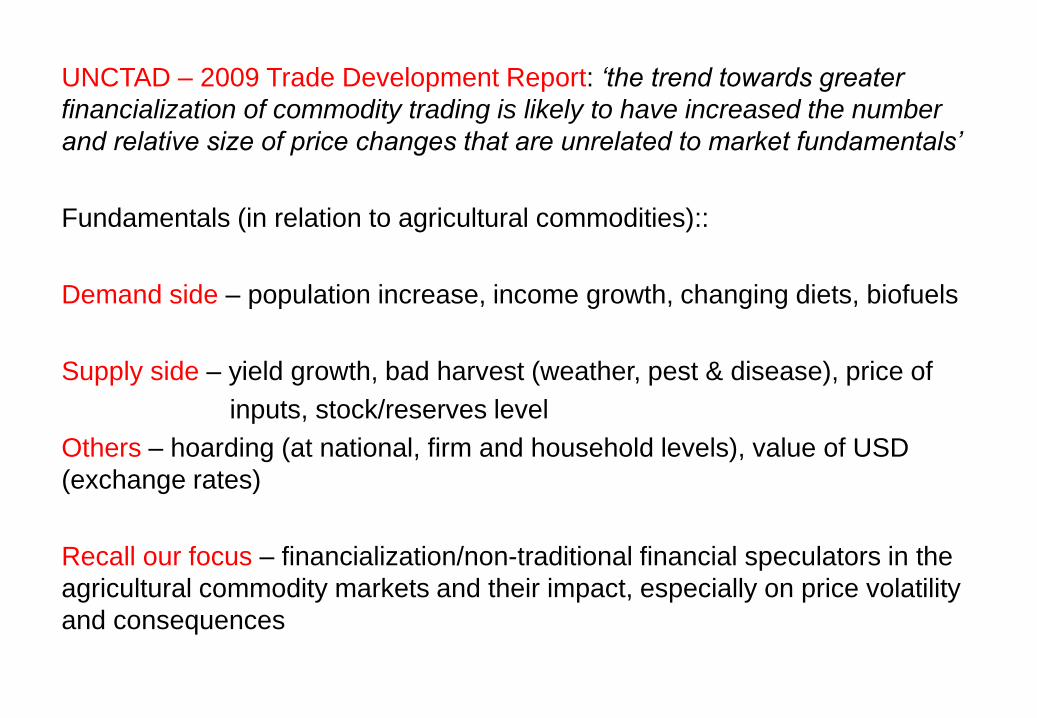
UNCTAD – 2009 Trade Development Report: ‘the trend towards greater
financialization of commodity trading is likely to have increased the number
and relative size of price changes that are unrelated to market fundamentals’
Fundamentals (in relation to agricultural commodities)::
Demand side – population increase, income growth, changing diets, biofuels
Supply side – yield growth, bad harvest (weather, pest & disease), price of
inputs, stock/reserves level
Others – hoarding (at national, firm and household levels), value of USD
(exchange rates)
Recall our focus – financialization/non-traditional financial speculators in the
agricultural commodity markets and their impact, especially on price volatility
and consequences
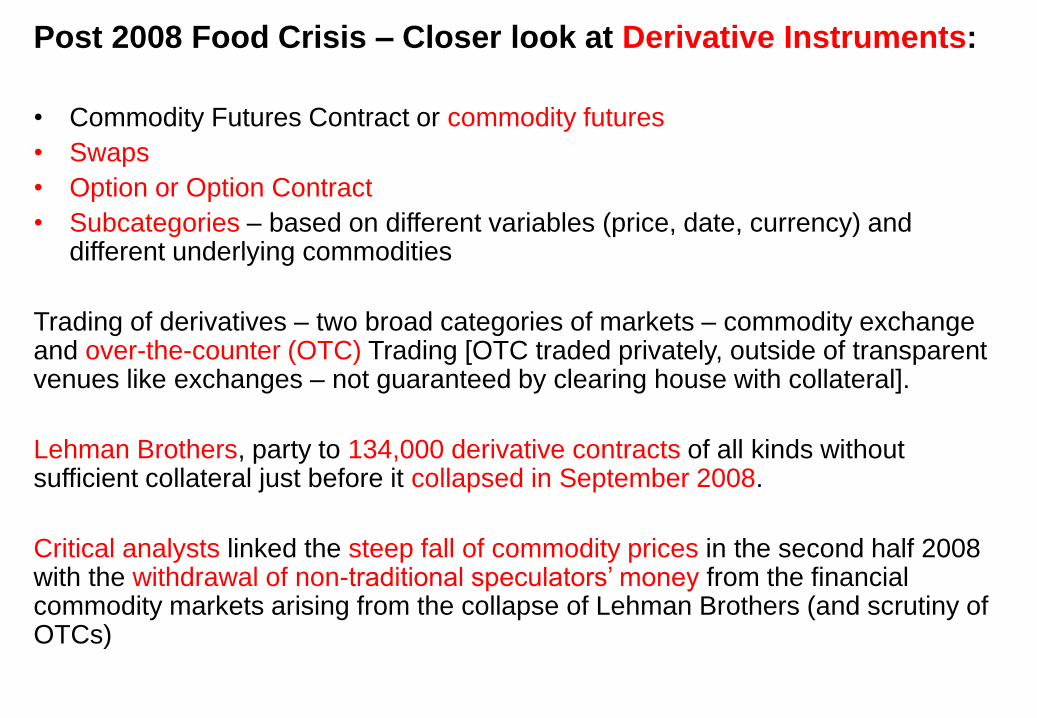
Post 2008 Food Crisis – Closer look at Derivative Instruments:
• Commodity Futures Contract or commodity futures
• Swaps
• Option or Option Contract
• Subcategories – based on different variables (price, date, currency) and different underlying commodities
Trading of derivatives – two broad categories of markets – commodity exchange and over-the-counter (OTC) Trading [OTC traded privately, outside of transparent venues like exchanges – not guaranteed by clearing house with collateral].
Lehman Brothers, party to 134,000 derivative contracts of all kinds without sufficient collateral just before it collapsed in September 2008.
Critical analysts linked the steep fall of commodity prices in the second half 2008 with the withdrawal of non-traditional speculators’ money from the financial commodity markets arising from the collapse of Lehman Brothers (and scrutiny of OTCs)
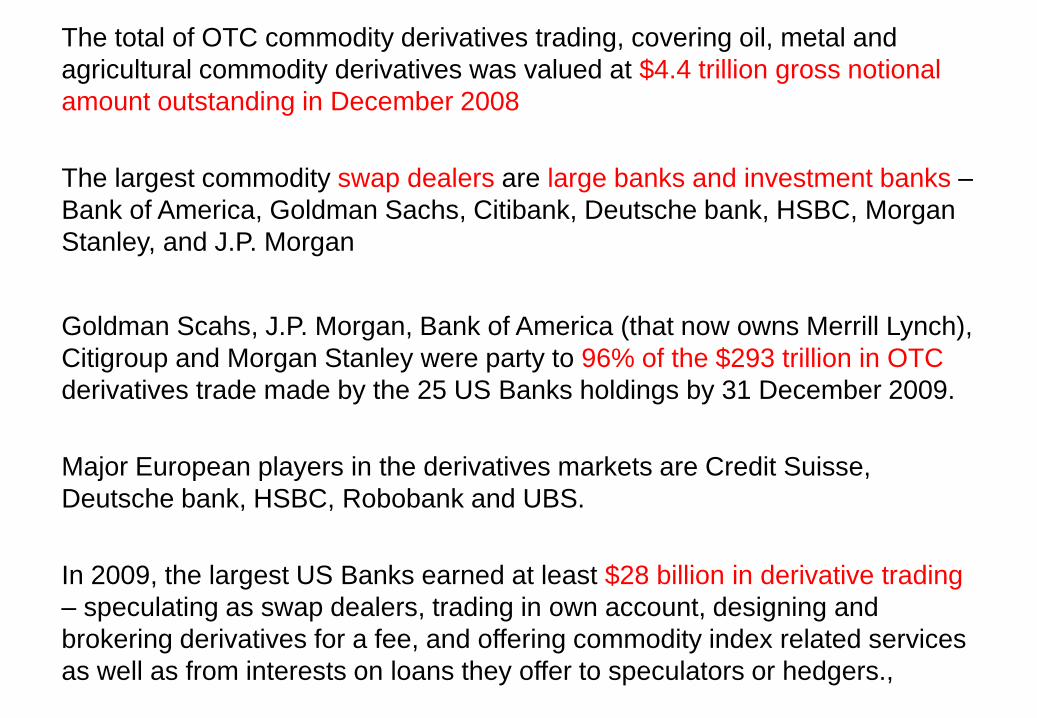
The total of OTC commodity derivatives trading, covering oil, metal and
agricultural commodity derivatives was valued at $4.4 trillion gross notional
amount outstanding in December 2008
The largest commodity swap dealers are large banks and investment banks –
Bank of America, Goldman Sachs, Citibank, Deutsche bank, HSBC, Morgan
Stanley, and J.P. Morgan
Goldman Scahs, J.P. Morgan, Bank of America (that now owns Merrill Lynch),
Citigroup and Morgan Stanley were party to 96% of the $293 trillion in OTC
derivatives trade made by the 25 US Banks holdings by 31 December 2009.
Major European players in the derivatives markets are Credit Suisse,
Deutsche bank, HSBC, Robobank and UBS.
In 2009, the largest US Banks earned at least $28 billion in derivative trading
– speculating as swap dealers, trading in own account, designing and
brokering derivatives for a fee, and offering commodity index related services
as well as from interests on loans they offer to speculators or hedgers.,
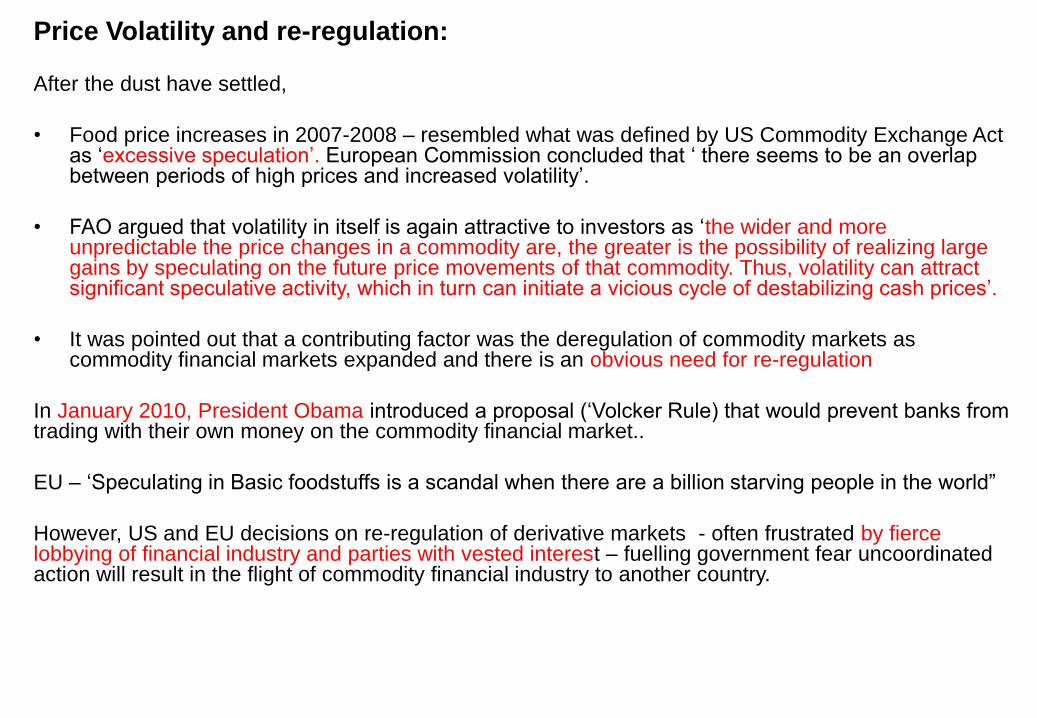
Price Volatility and re-regulation:
After the dust have settled,
• Food price increases in 2007-2008 – resembled what was defined by US Commodity Exchange Act as ‘excessive speculation’. European Commission concluded that ‘ there seems to be an overlap between periods of high prices and increased volatility’.
• FAO argued that volatility in itself is again attractive to investors as ‘the wider and more unpredictable the price changes in a commodity are, the greater is the possibility of realizing large gains by speculating on the future price movements of that commodity. Thus, volatility can attract significant speculative activity, which in turn can initiate a vicious cycle of destabilizing cash prices’.
• It was pointed out that a contributing factor was the deregulation of commodity markets as commodity financial markets expanded and there is an obvious need for re-regulation
In January 2010, President Obama introduced a proposal (‘Volcker Rule) that would prevent banks from trading with their own money on the commodity financial market..
EU – ‘Speculating in Basic foodstuffs is a scandal when there are a billion starving people in the world”
However, US and EU decisions on re-regulation of derivative markets - often frustrated by fierce lobbying of financial industry and parties with vested interest – fuelling government fear uncoordinated action will result in the flight of commodity financial industry to another country.
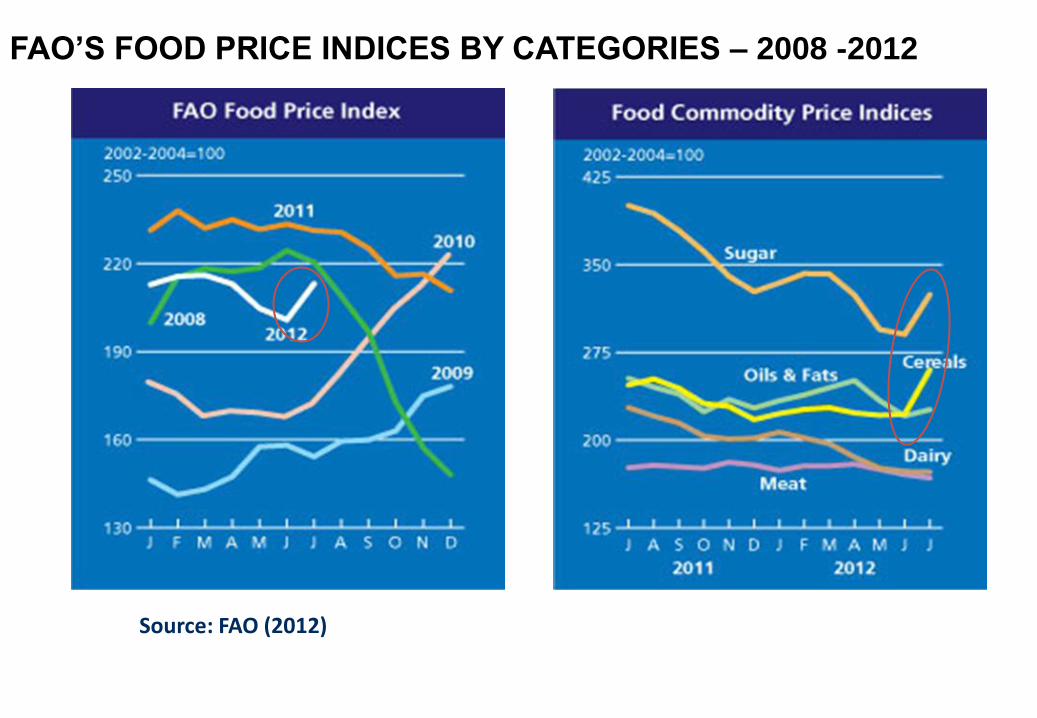
Source: FAO (2012)
FAO’S FOOD PRICE INDICES BY CATEGORIES – 2008 -2012
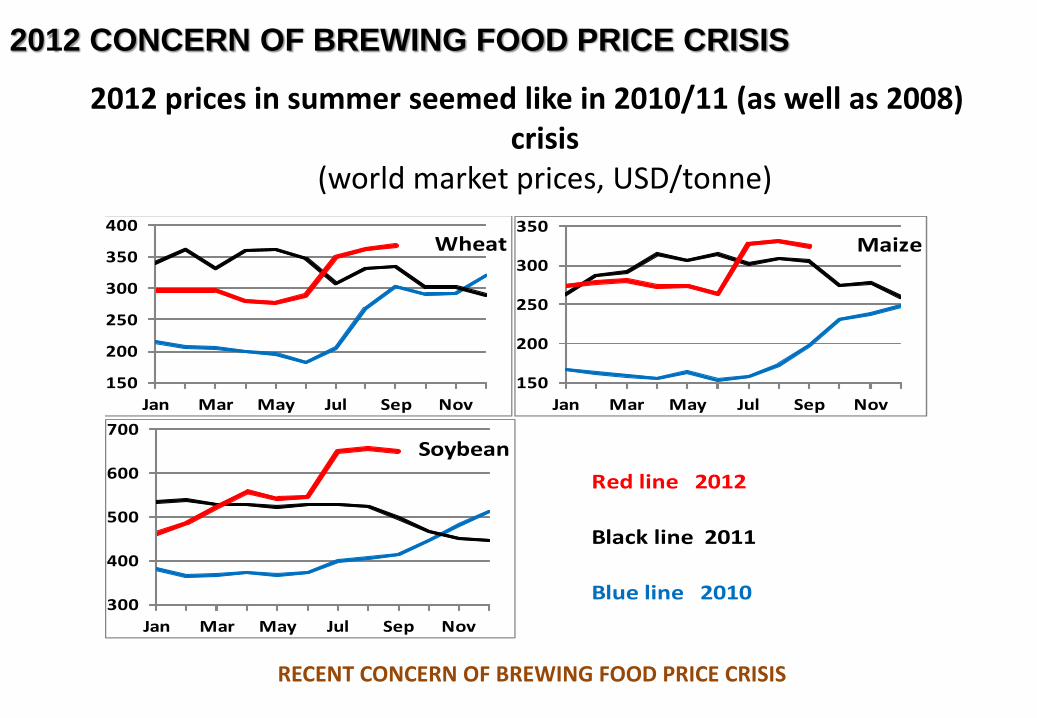
2012 prices in summer seemed like in 2010/11 (as well as 2008) crisis
(world market prices, USD/tonne)
Red line 2012
Black line 2011
Blue line 2010
150
200
250
300
350
400
Jan Mar May Jul Sep Nov
Wheat
150
200
250
300
350
Jan Mar May Jul Sep Nov
Maize
300
400
500
600
700
Jan Mar May Jul Sep Nov
Soybean
RECENT CONCERN OF BREWING FOOD PRICE CRISIS
2012 CONCERN OF BREWING FOOD PRICE CRISIS
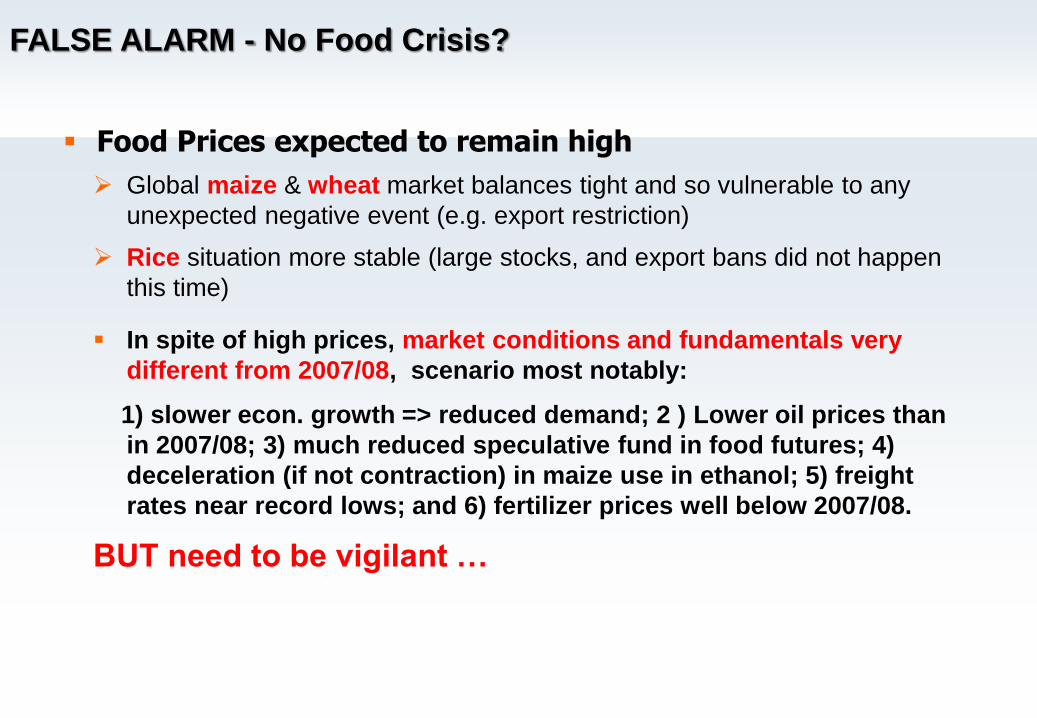
Food Prices expected to remain high
Global maize & wheat market balances tight and so vulnerable to any