36
Visualization in the big data era Dr. Mihael Ankerst Allianz Deutschland AG Munich, April, 7th 2016
| Date post: | 16-Apr-2017 |
| Category: |
Technology |
| Upload: | dataconomy-media |
| View: | 482 times |
| Download: | 0 times |
Visualization
in the big data era
Dr. Mihael Ankerst
Allianz Deutschland AG
Munich, April, 7th 2016
Introduction of myself – something big about me
• I have worked for big employers
• I have big interest in
data mining, visualization and scalability
• My daughter has big expectations
2 © Copyright Allianz 08.04.2016
Visualization in the big data era – Mihael Ankerst
👱
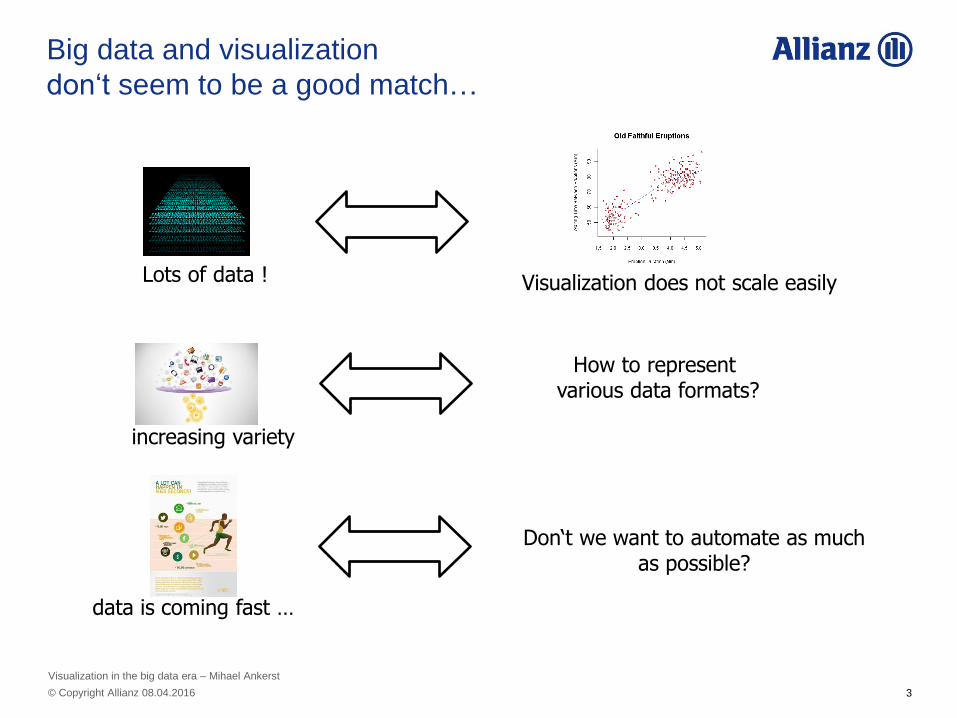
Big data and visualization
don‘t seem to be a good match…
Lots of data ! Visualization does not scale easily
increasing variety
data is coming fast …
Don‘t we want to automate as much as possible?
How to represent various data formats?
3 © Copyright Allianz 08.04.2016
Visualization in the big data era – Mihael Ankerst
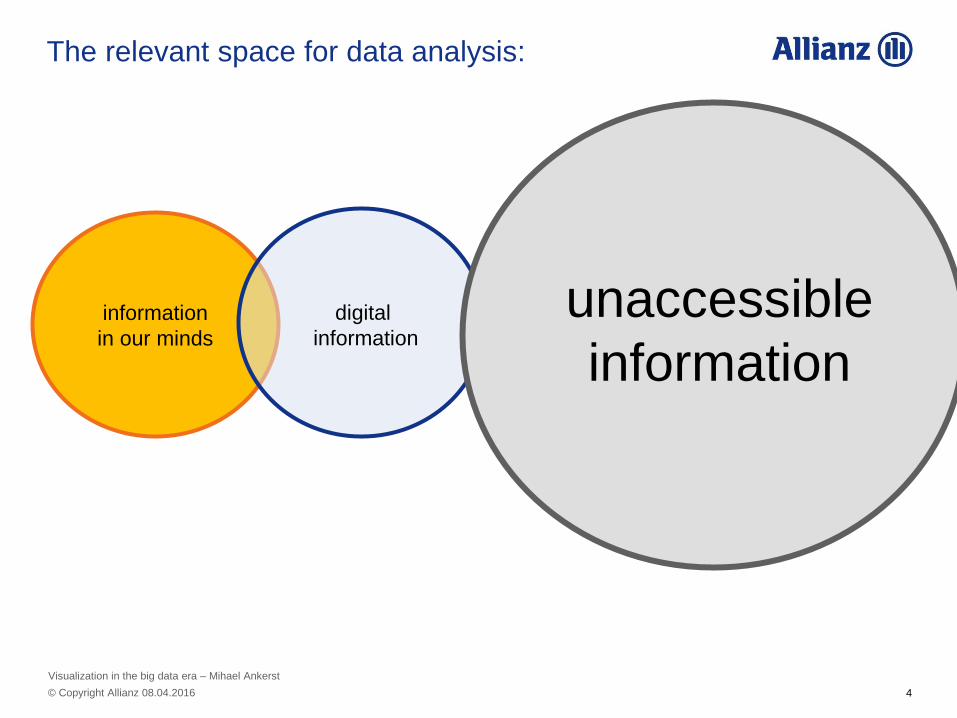
The relevant space for data analysis:
information
in our minds
digital
information
unaccessible
information
4 © Copyright Allianz 08.04.2016
Visualization in the big data era – Mihael Ankerst
The goal of any big data analysis is a result, that is…
… valid
… new
… and applicable!
5 © Copyright Allianz 08.04.2016
Visualization in the big data era – Mihael Ankerst
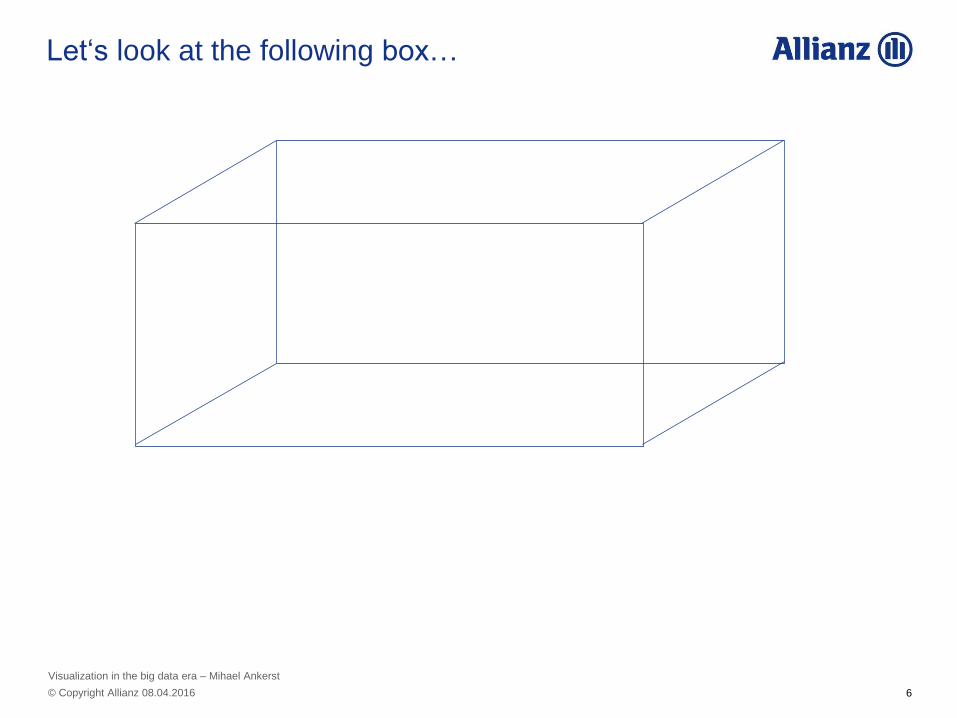
Let‘s look at the following box…
6 © Copyright Allianz 08.04.2016
Visualization in the big data era – Mihael Ankerst
x
y
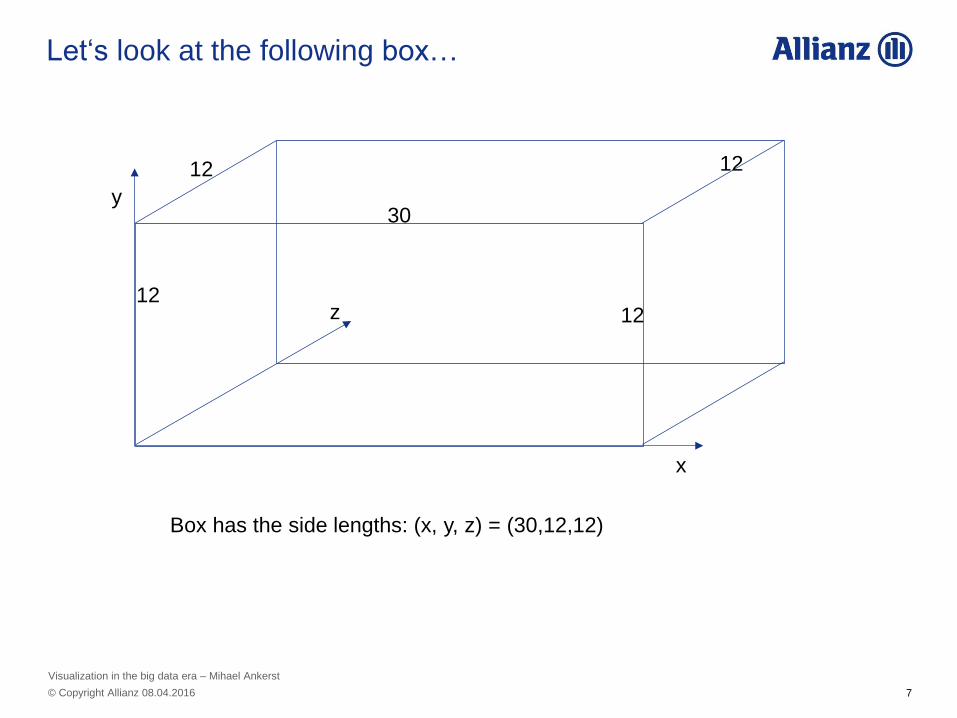
Box has the side lengths: (x, y, z) = (30,12,12)
z
30
12
12
12
Let‘s look at the following box…
12
7 © Copyright Allianz 08.04.2016
Visualization in the big data era – Mihael Ankerst
x
y
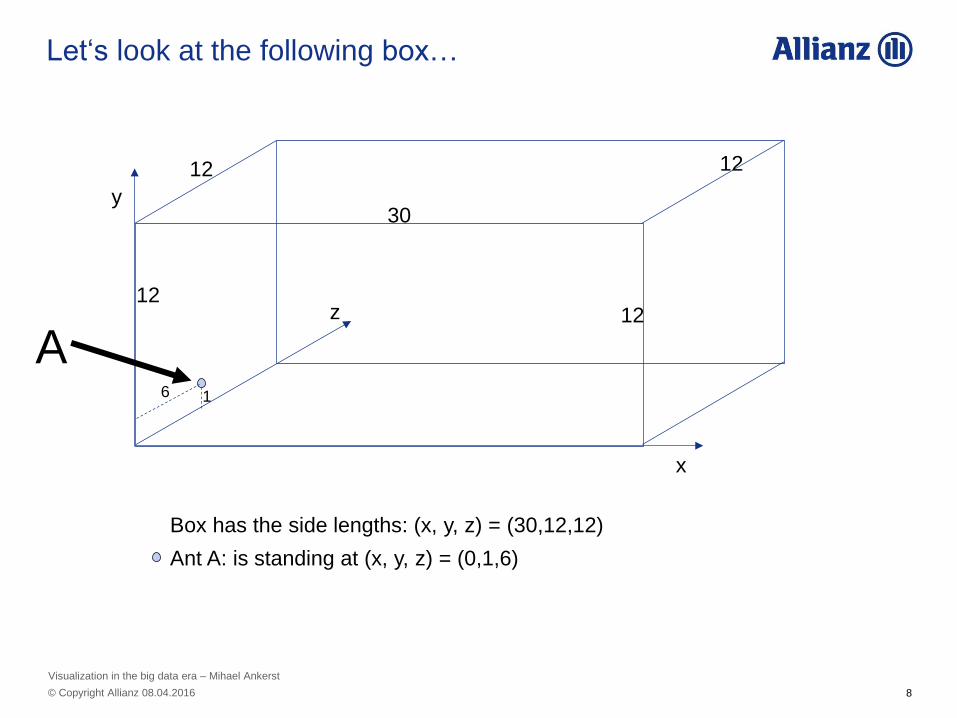
Box has the side lengths: (x, y, z) = (30,12,12)
Ant A: is standing at (x, y, z) = (0,1,6)
z
6 1
30
12
12
12
Let‘s look at the following box…
A
12
8 © Copyright Allianz 08.04.2016
Visualization in the big data era – Mihael Ankerst
x
y
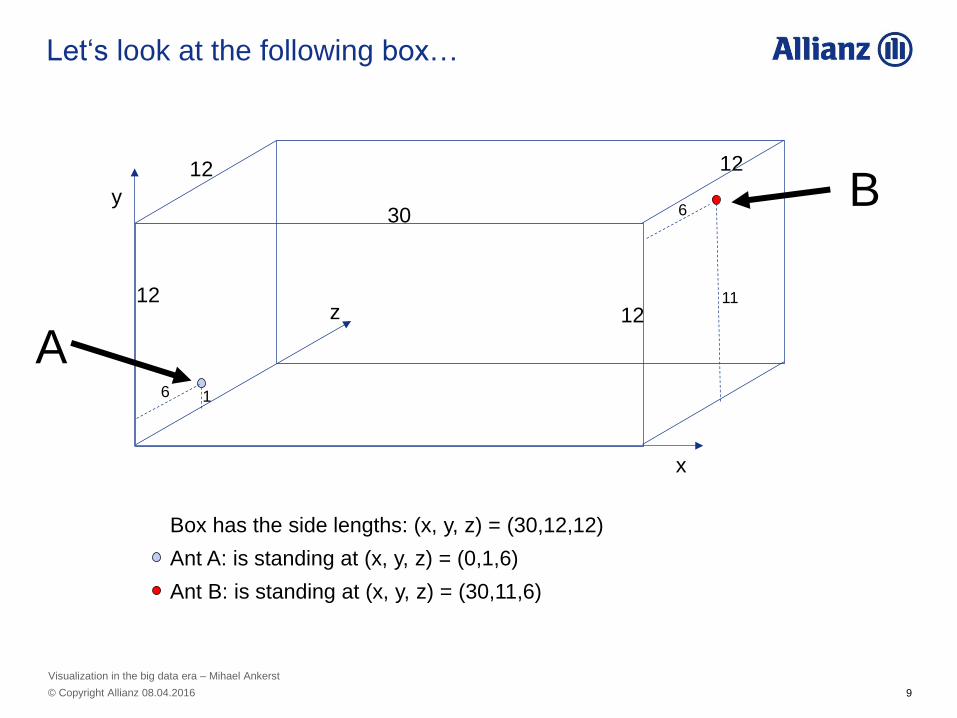
Box has the side lengths: (x, y, z) = (30,12,12)
Ant A: is standing at (x, y, z) = (0,1,6)
Ant B: is standing at (x, y, z) = (30,11,6)
z
6
6
1
11
30
12
12
12
Let‘s look at the following box…
A
B
12
9 © Copyright Allianz 08.04.2016
Visualization in the big data era – Mihael Ankerst
x
y
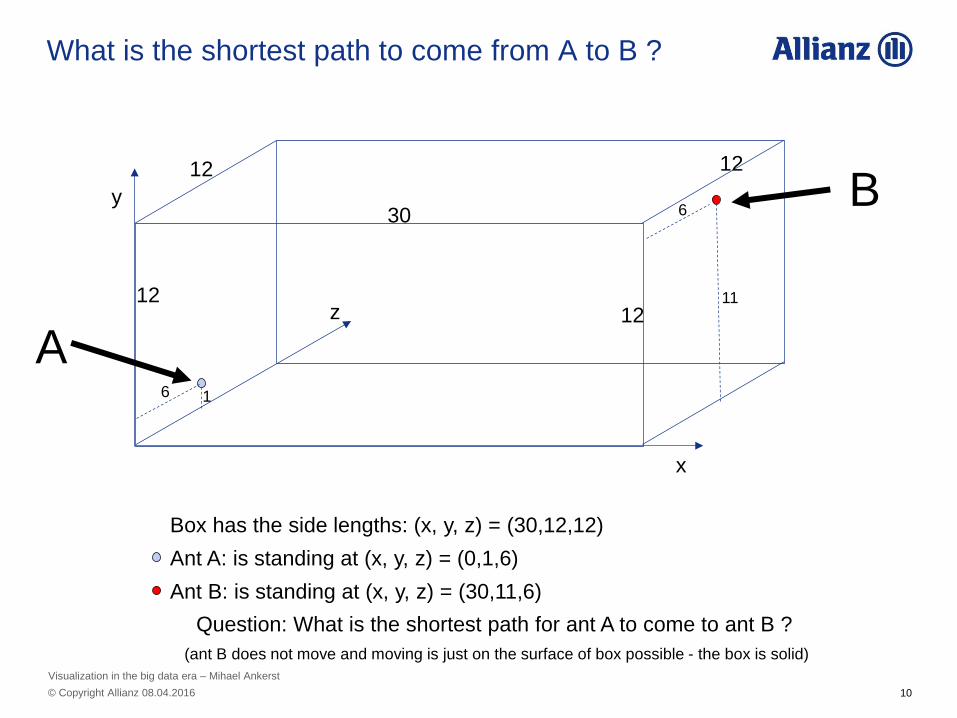
Box has the side lengths: (x, y, z) = (30,12,12)
Ant A: is standing at (x, y, z) = (0,1,6)
Ant B: is standing at (x, y, z) = (30,11,6)
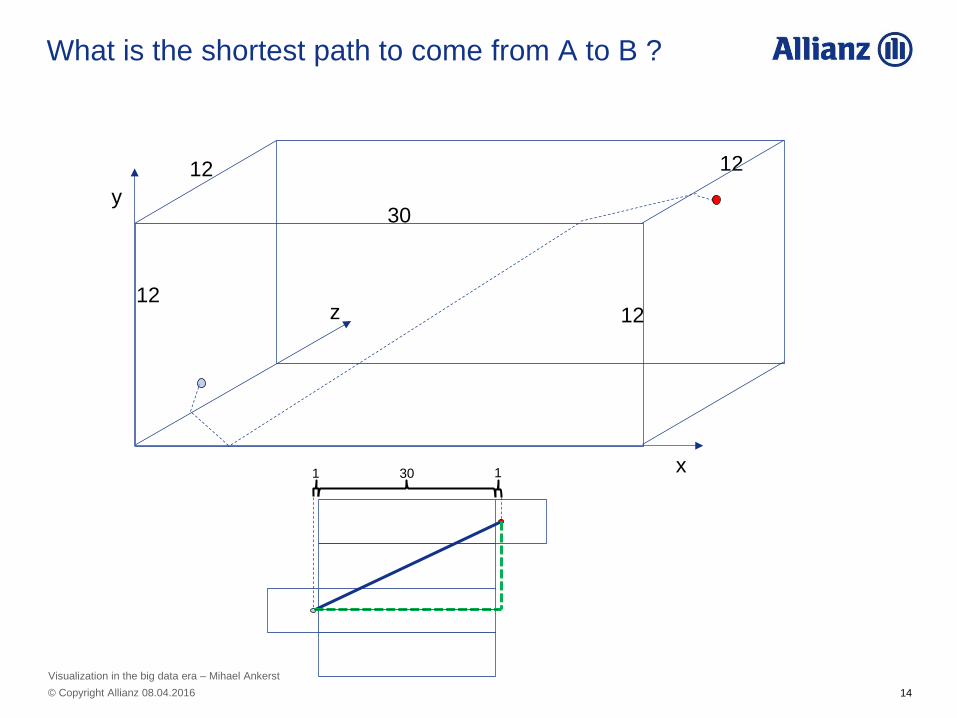
Question: What is the shortest path for ant A to come to ant B ?
(ant B does not move and moving is just on the surface of box possible - the box is solid)
z
6
6
1
11
30
12
12
12
What is the shortest path to come from A to B ?
A
B
12
10 © Copyright Allianz 08.04.2016
Visualization in the big data era – Mihael Ankerst
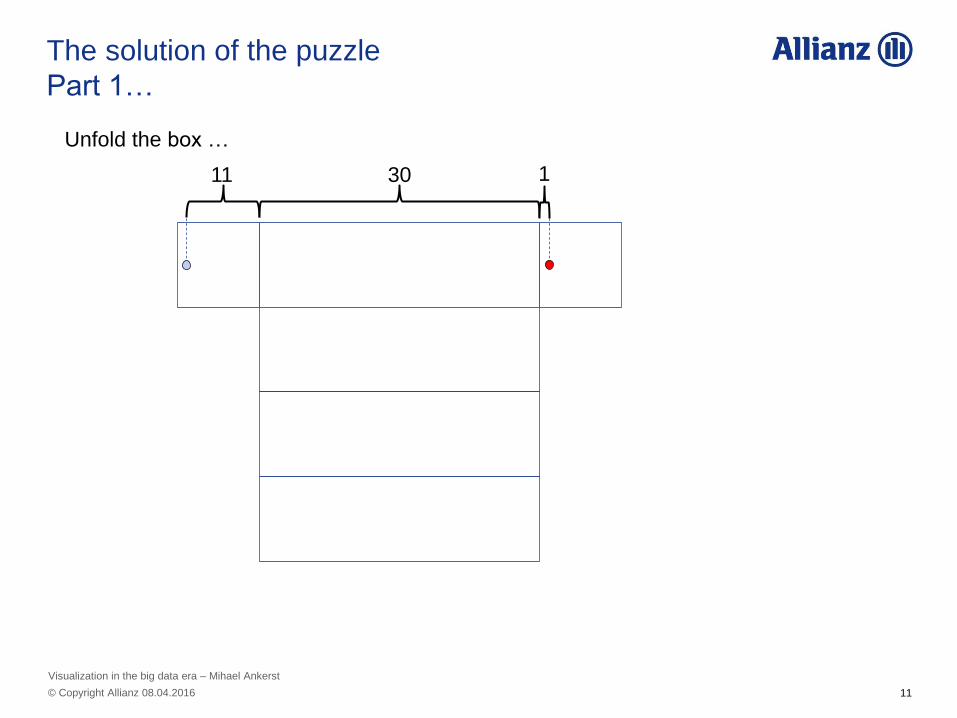
The solution of the puzzle
Part 1…
30 11 1
Unfold the box …
11 © Copyright Allianz 08.04.2016
Visualization in the big data era – Mihael Ankerst
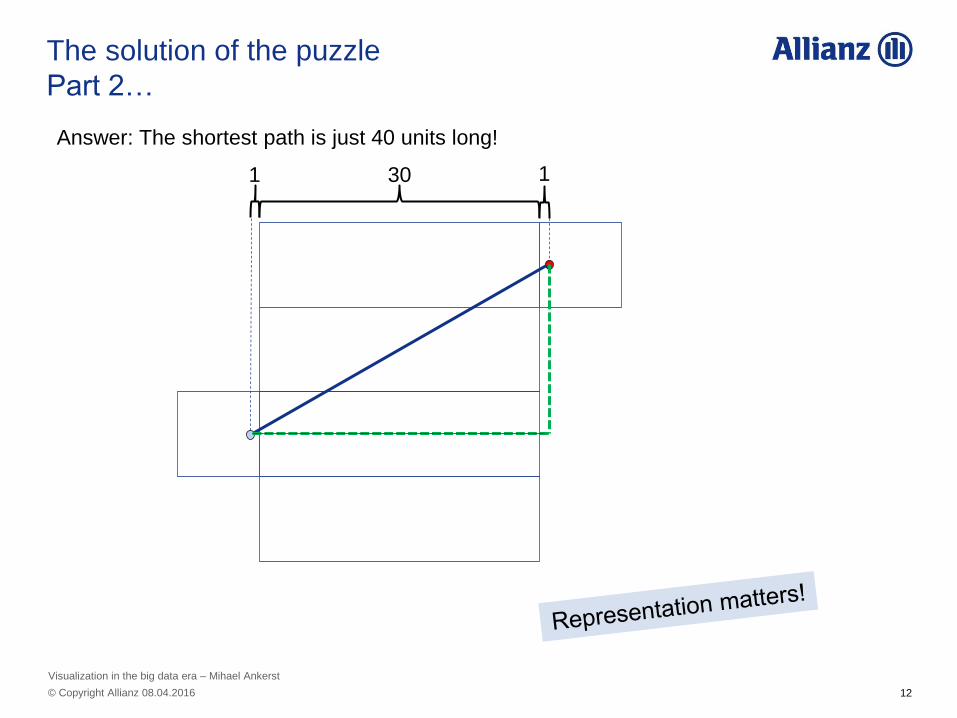
The solution of the puzzle
Part 2…
30 1 1
Answer: The shortest path is just 40 units long!
12 © Copyright Allianz 08.04.2016
Visualization in the big data era – Mihael Ankerst

x
y
z
30
12
12
12
What is the shortest path to come from A to B ?
12
30 1 1
13 © Copyright Allianz 08.04.2016
Visualization in the big data era – Mihael Ankerst
x
y
z
30
12
12
12
What is the shortest path to come from A to B ?
12
30 1 1
14 © Copyright Allianz 08.04.2016
Visualization in the big data era – Mihael Ankerst
Visualization is the data analysts‘ best friend if …
1) it is based upon an intuitive representation
15 © Copyright Allianz 08.04.2016
Visualization in the big data era – Mihael Ankerst
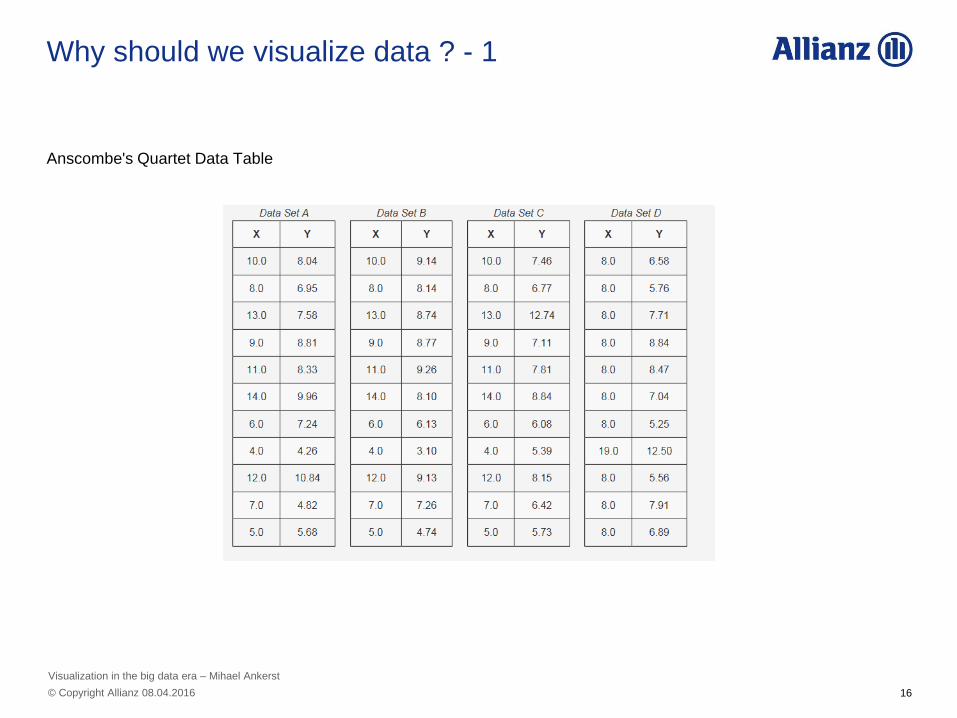
Why should we visualize data ? - 1
Anscombe's Quartet Data Table
16 © Copyright Allianz 08.04.2016
Visualization in the big data era – Mihael Ankerst
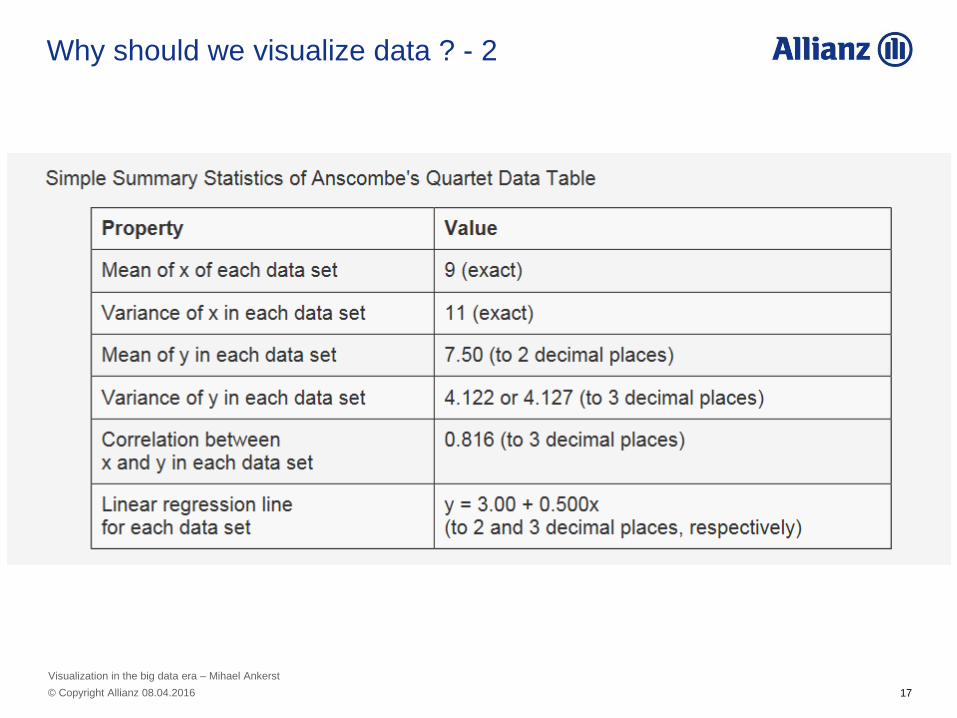
Why should we visualize data ? - 2
17 © Copyright Allianz 08.04.2016
Visualization in the big data era – Mihael Ankerst
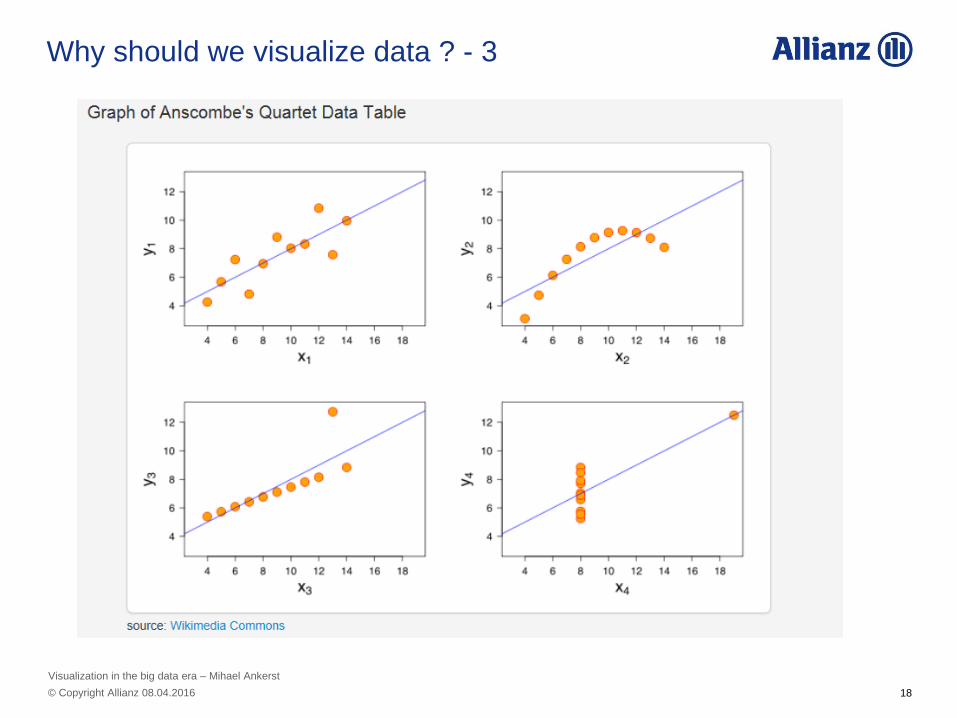
Why should we visualize data ? - 3
18 © Copyright Allianz 08.04.2016
Visualization in the big data era – Mihael Ankerst
Visualization is the data analysts‘ best friend if …
1) it is based upon an intuitive representation
2) it leverages the perceptual capabilities of the user
19 © Copyright Allianz 08.04.2016
Visualization in the big data era – Mihael Ankerst
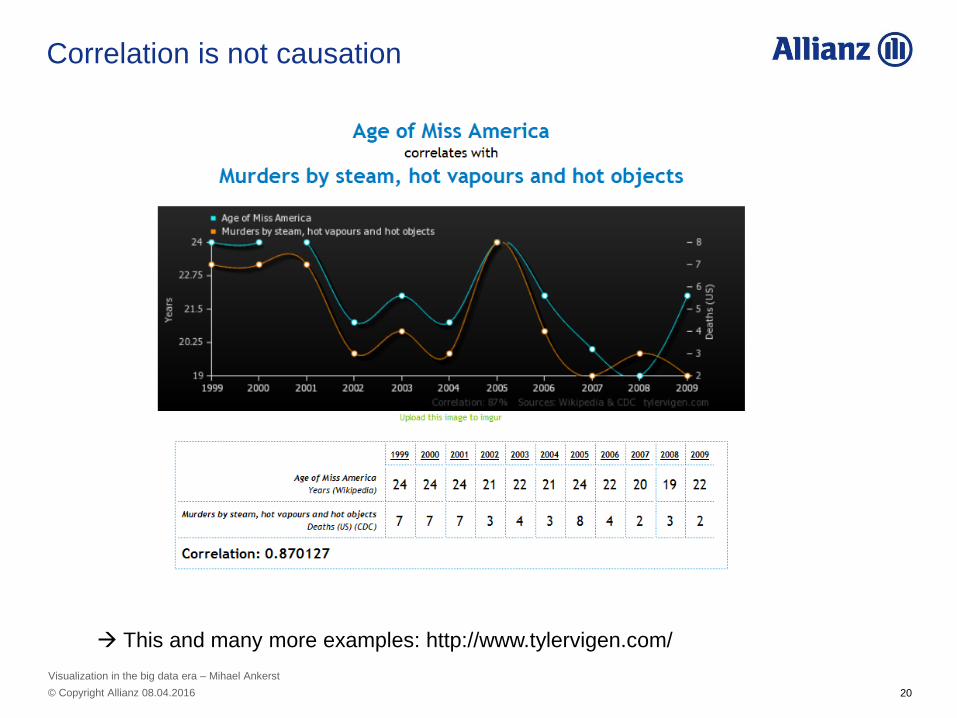
Correlation is not causation
This and many more examples: http://www.tylervigen.com/
20 © Copyright Allianz 08.04.2016
Visualization in the big data era – Mihael Ankerst
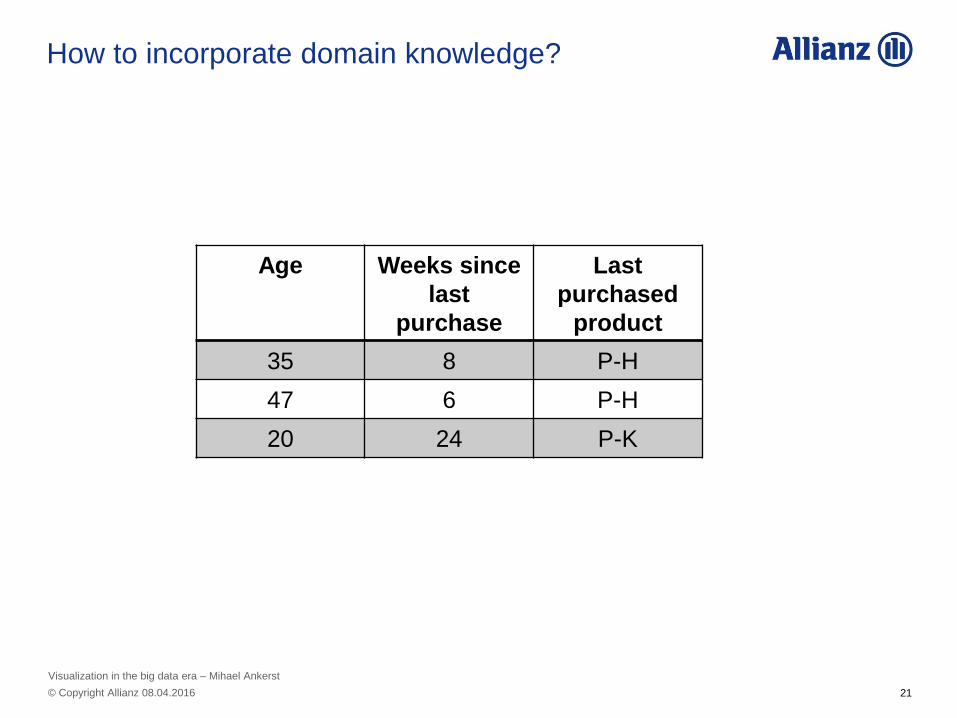
How to incorporate domain knowledge?
Age Weeks since
last
purchase
Last
purchased
product
35 8 P-H
47 6 P-H
20 24 P-K
21 © Copyright Allianz 08.04.2016
Visualization in the big data era – Mihael Ankerst
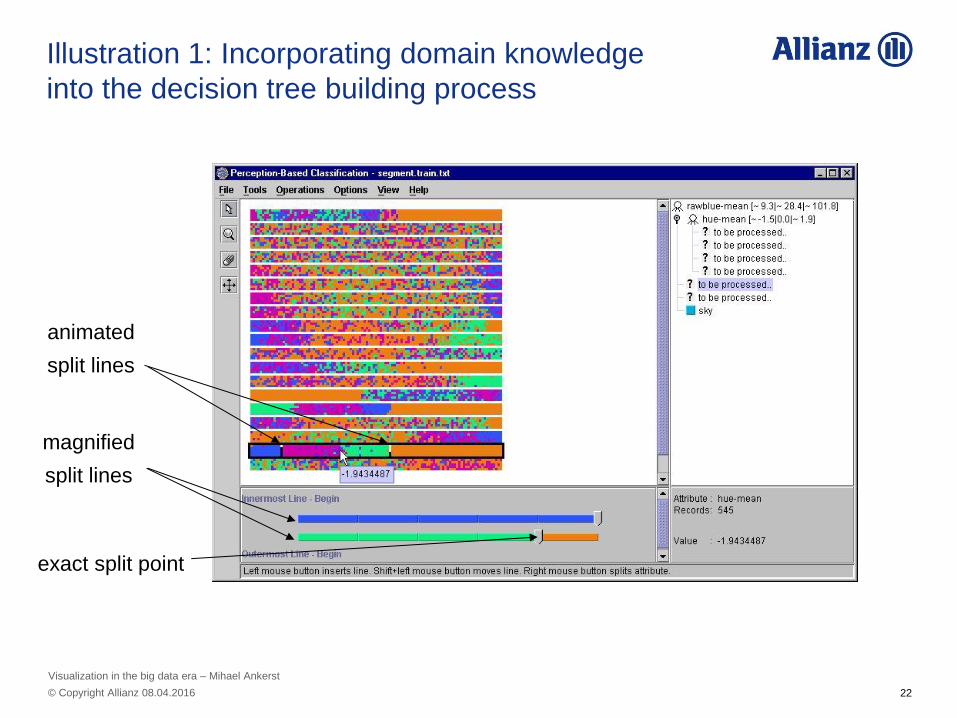
Illustration 1: Incorporating domain knowledge
into the decision tree building process
animated
split lines
magnified
split lines
exact split point
22 © Copyright Allianz 08.04.2016
Visualization in the big data era – Mihael Ankerst
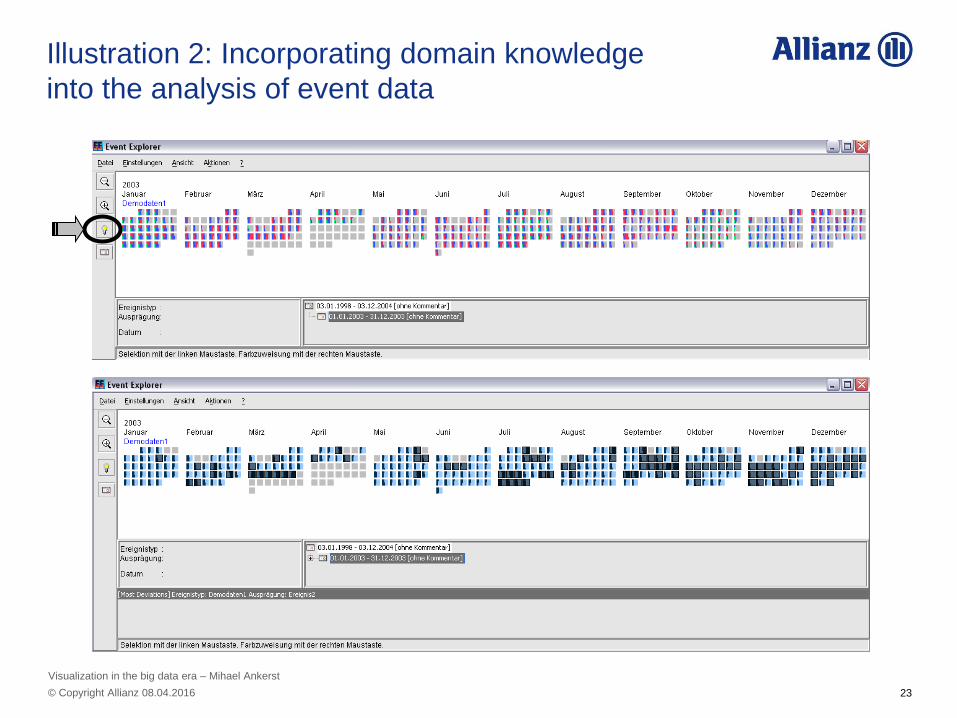
Illustration 2: Incorporating domain knowledge
into the analysis of event data
23 © Copyright Allianz 08.04.2016
Visualization in the big data era – Mihael Ankerst
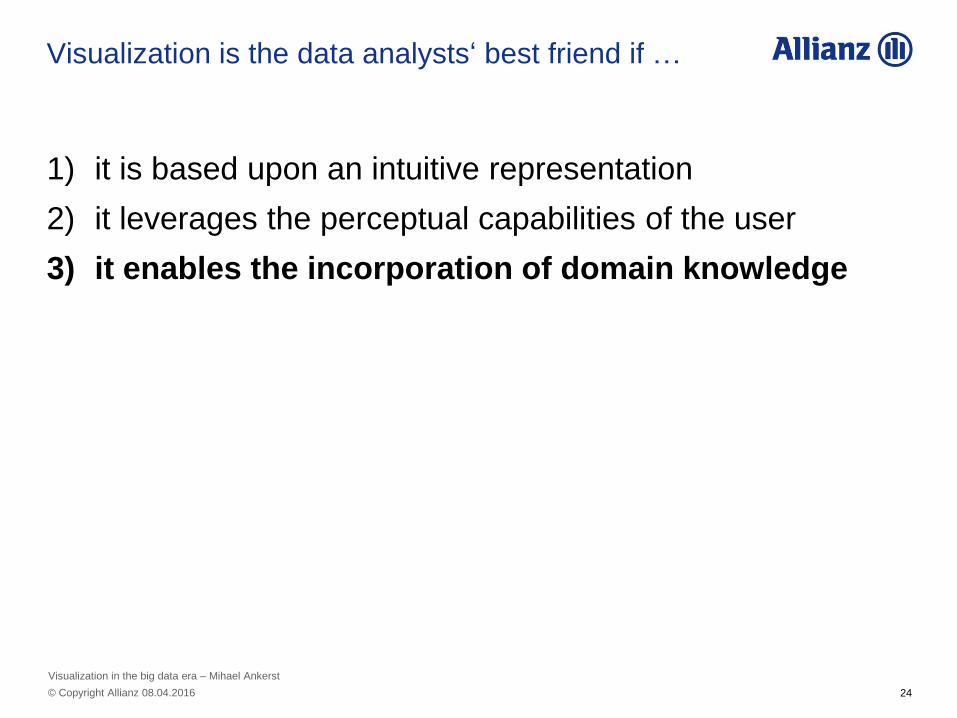
Visualization is the data analysts‘ best friend if …
1) it is based upon an intuitive representation
2) it leverages the perceptual capabilities of the user
3) it enables the incorporation of domain knowledge
24 © Copyright Allianz 08.04.2016
Visualization in the big data era – Mihael Ankerst
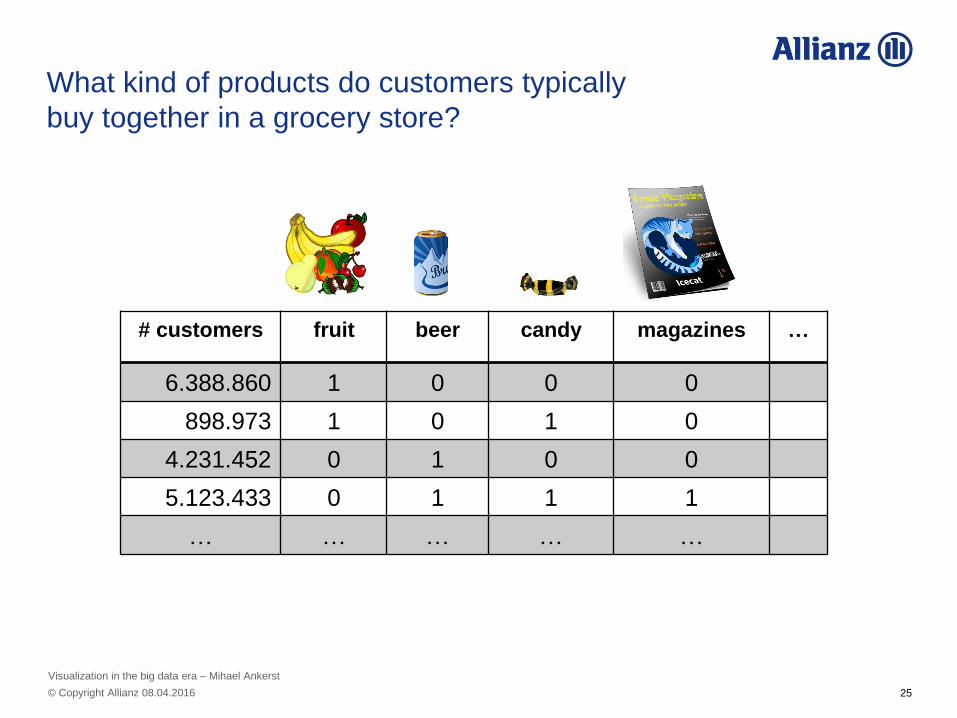
What kind of products do customers typically
buy together in a grocery store?
# customers fruit beer candy magazines …
6.388.860 1 0 0 0
898.973 1 0 1 0
4.231.452 0 1 0 0
5.123.433 0 1 1 1
… … … … …
25 © Copyright Allianz 08.04.2016
Visualization in the big data era – Mihael Ankerst
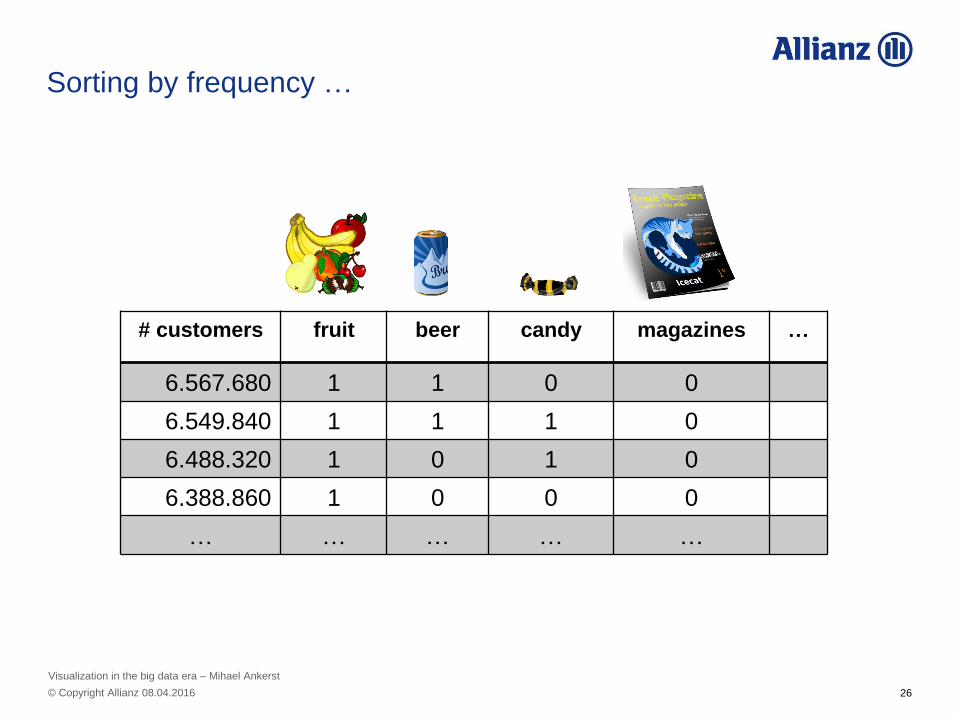
Sorting by frequency …
# customers fruit beer candy magazines …
6.567.680 1 1 0 0
6.549.840 1 1 1 0
6.488.320 1 0 1 0
6.388.860 1 0 0 0
… … … … …
26 © Copyright Allianz 08.04.2016
Visualization in the big data era – Mihael Ankerst
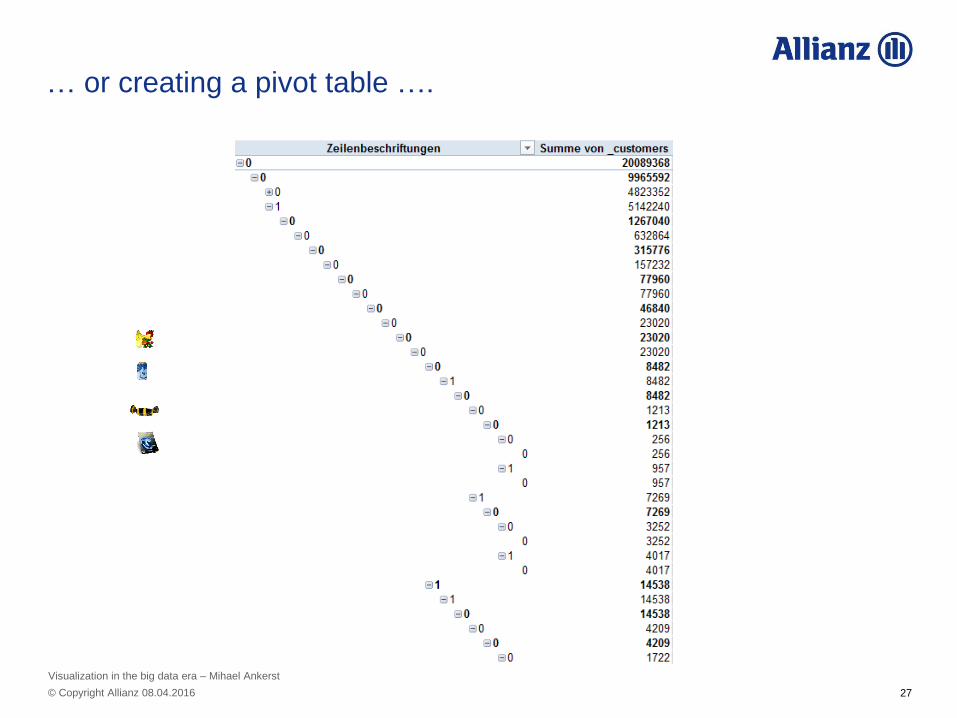
… or creating a pivot table ….
27 © Copyright Allianz 08.04.2016
Visualization in the big data era – Mihael Ankerst
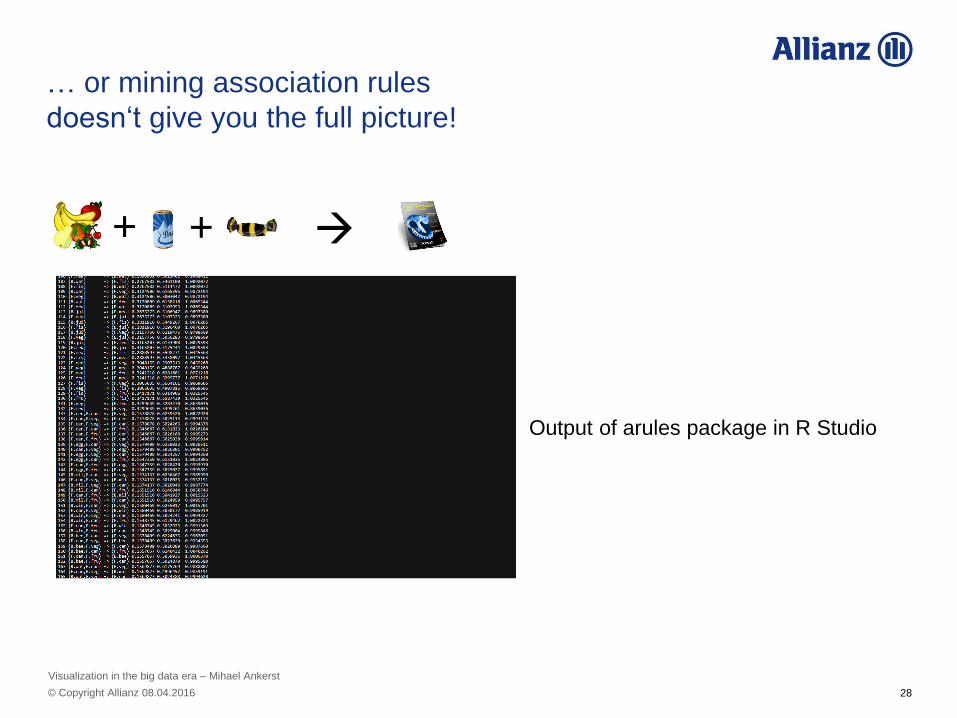
… or mining association rules
doesn‘t give you the full picture!
+ +
Output of arules package in R Studio
28 © Copyright Allianz 08.04.2016
Visualization in the big data era – Mihael Ankerst
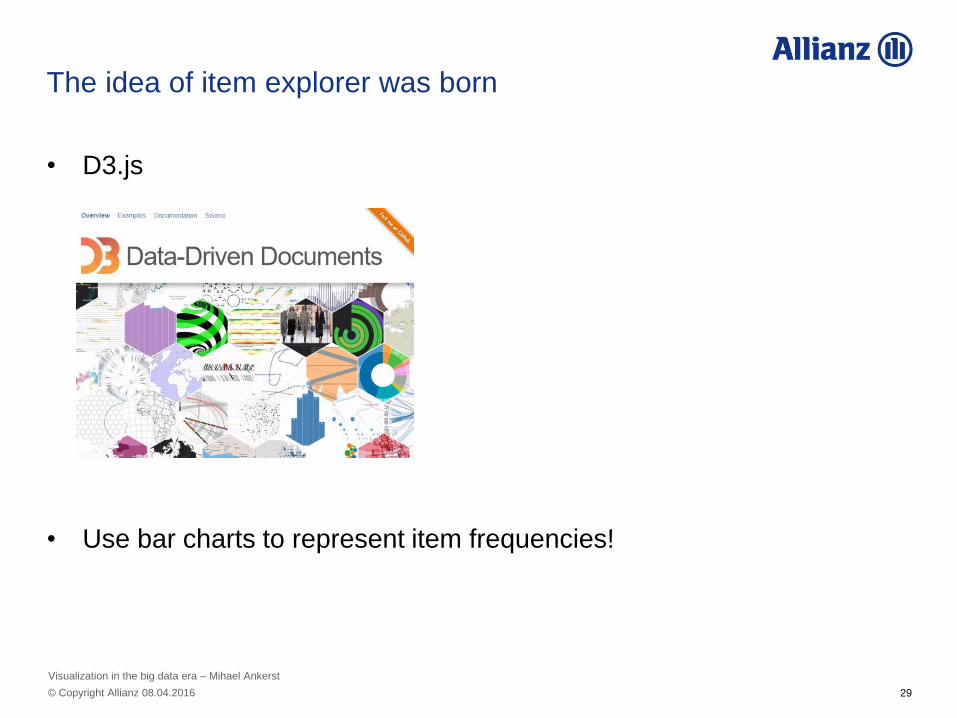
The idea of item explorer was born
• D3.js
• Use bar charts to represent item frequencies!
29 © Copyright Allianz 08.04.2016
Visualization in the big data era – Mihael Ankerst
Development of item explorer – part 1
Munich, March 8th, 2015, 5.15 p.m.
30 © Copyright Allianz 08.04.2016
Visualization in the big data era – Mihael Ankerst
😐
My daughter‘s face
Development of item explorer – part 2
20 minutes later …
Munich, March 8th, 2015, 5.35 p.m.
31 © Copyright Allianz 08.04.2016
Visualization in the big data era – Mihael Ankerst
😒
My daughter‘s face
Development of item explorer – part 3
40 minutes later …
Munich, March 8th, 2015, 5.55 p.m.
32 © Copyright Allianz 08.04.2016
Visualization in the big data era – Mihael Ankerst
😠
My daughter‘s face
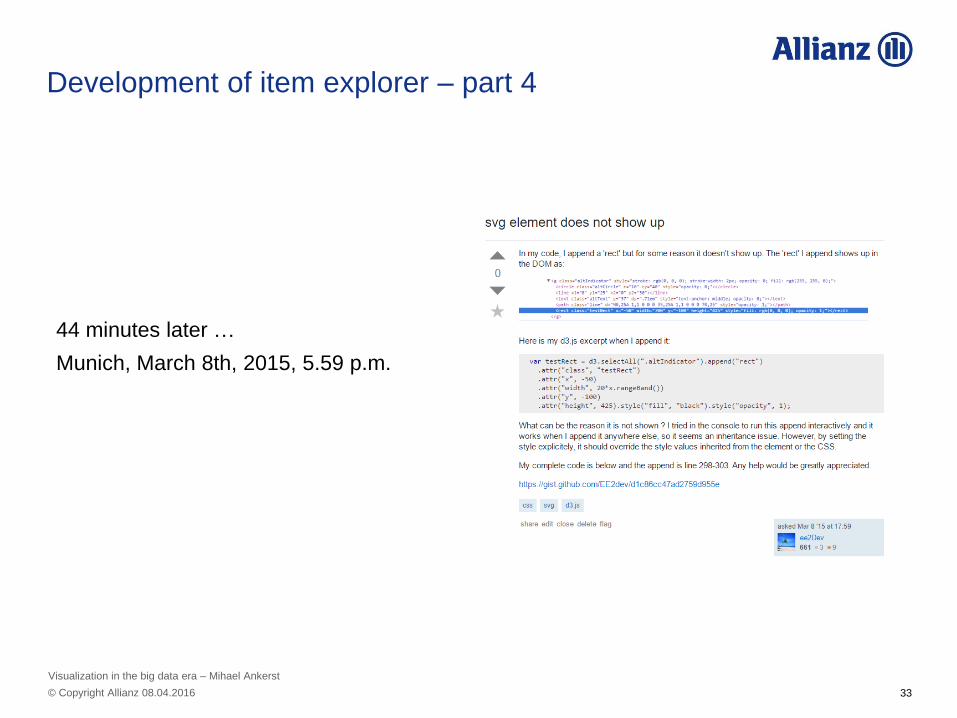
Development of item explorer – part 4
44 minutes later …
Munich, March 8th, 2015, 5.59 p.m.
33 © Copyright Allianz 08.04.2016
Visualization in the big data era – Mihael Ankerst
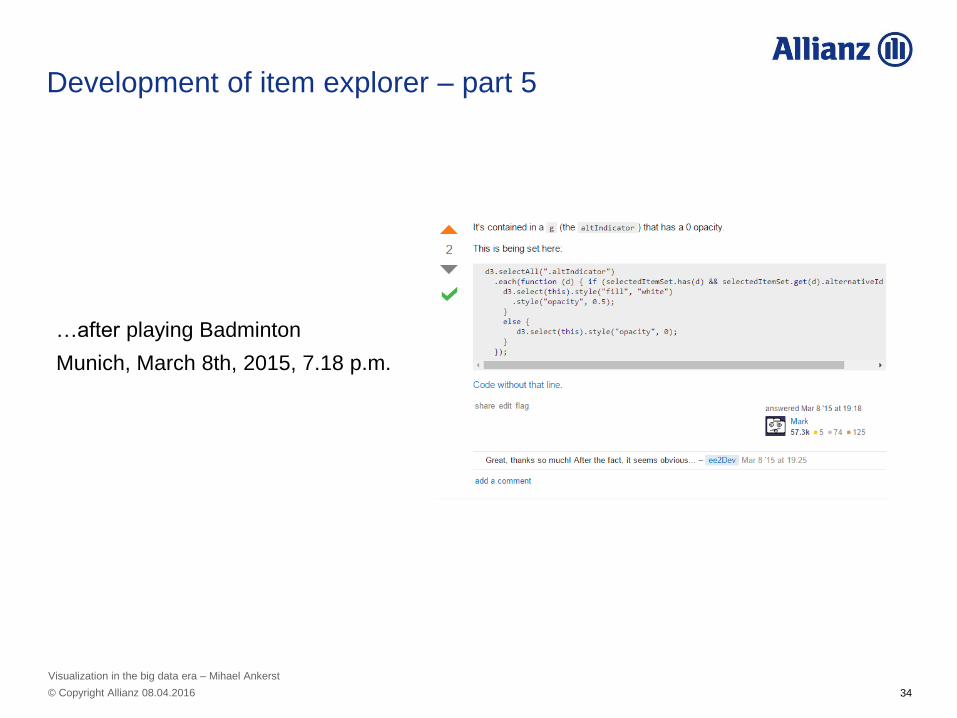
Development of item explorer – part 5
…after playing Badminton
Munich, March 8th, 2015, 7.18 p.m.
34 © Copyright Allianz 08.04.2016
Visualization in the big data era – Mihael Ankerst
35 © Copyright Allianz 08.04.2016
Visualization in the big data era – Mihael Ankerst
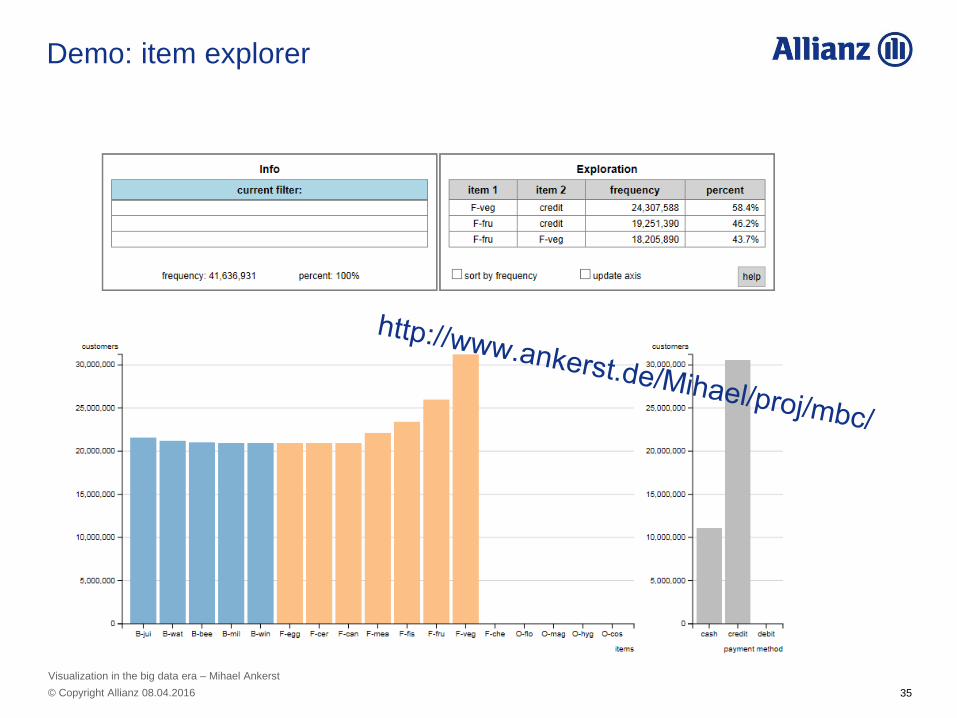
Demo: item explorer
Visualization is the data analysts‘ best friend if …
1) it is based upon an intuitive representation
2) it leverages the perceptual capabilities of the user
3) it enables the incorporation of domain knowledge
4) it facilitates the understanding of the data
and the results
36 © Copyright Allianz 08.04.2016
Visualization in the big data era – Mihael Ankerst


![PSALAM 34 [PSALAM 34] - Sheet music · Provic Mihael Arrangeur, Compositeur, Directeur, Interprete Croatie , Opuzen-Split A propos de l'artiste Mihael Provic was born in Opuzen 1975.](https://static.documents.pub/doc/80x56/60bd4d238718695af40aafbe/psalam-34-psalam-34-sheet-music-provic-mihael-arrangeur-compositeur-directeur.jpg)


