SECURITIES AND EXCHANGE COMMISSION Washington, D.C. 20549 Form 6-K REPORT OF FOREIGN PRIVATE ISSUER PURSUANT TO RULE 13A-16 OR 15D-16 UNDER THE SECURITIES EXCHANGE ACT OF 1934 For the Quarter Ended December 31, 2008 Commission File Number 1-15182 DR. REDDY’S LABORATORIES LIMITED (Translation of registrant’s name into English) 7-1-27, Ameerpet Hyderabad, Andhra Pradesh 500 016, India +91-40-23731946 (Address of principal executive office) Indicate by check mark whether the registrant files or will file annual reports under cover of Form 20-F or Form 40-F. Form 20-F Form 40-F Indicate by check mark if the registrant is submitting the Form 6-K in paper as permitted by Regulation S-T Rule 101(b)(1): Note: Regulation S-T Rule 101(b)(1) only permits the submission in paper of a Form 6-K if submitted solely to provide an attached annual report to security holders. Indicate by check mark if the registrant is submitting the Form 6-K in paper as permitted by Regulation S-T Rule 101(b)(7): Note: Regulation S-T Rule 101(b)(7) only permits the submission in paper of a Form 6-K if submitted to furnish a report or other document that the registrant foreign private issuer must furnish and make public under the laws of the jurisdiction in which the registrant is incorporated, domiciled or legally organized (the registrant’s “home country”), or under the rules of the home country exchange on which the registrant’s securities are traded, as long as the report or other document is not a press release, is not required to be and has not been distributed to the registrant’s security holders, and, if discussing a material event, has already been the subject of a Form 6-K submission or other Commission filing on EDGAR. Indicate by check mark whether by furnishing the information contained in this Form, the registrant is also thereby furnishing the information to the Commission pursuant to Rule 12g3-2(b) under the Securities Exchange Act of 1934. Yes No If “Yes” is marked, indicate below the file number assigned to registrant in connection with Rule 12g3-2(b): 82- .
Transcript
SECURITIES AND EXCHANGE COMMISSION Washington, D.C. 20549
Form 6-K
REPORT OF FOREIGN PRIVATE ISSUER PURSUANT TO RULE 13A-16 OR 15D-16 UNDER THE SECURITIES EXCHANGE ACT OF 1934
For the Quarter Ended December 31, 2008
Commission File Number 1-15182
DR. REDDY’S LABORATORIES LIMITED (Translation of registrant’s name into English)
7-1-27, Ameerpet Hyderabad, Andhra Pradesh 500 016, India
+91-40-23731946
(Address of principal executive office)
Indicate by check mark whether the registrant files or will file annual reports under cover of Form 20-F or Form 40-F.
Form 20-F � Form 40-F �
Indicate by check mark if the registrant is submitting the Form 6-K in paper as permitted by Regulation S-T Rule 101(b)(1): �
Note: Regulation S-T Rule 101(b)(1) only permits the submission in paper of a Form 6-K if submitted solely to provide an attached annual report to security holders.
Indicate by check mark if the registrant is submitting the Form 6-K in paper as permitted by Regulation S-T Rule 101(b)(7): �
Note: Regulation S-T Rule 101(b)(7) only permits the submission in paper of a Form 6-K if submitted to furnish a report or other document that the registrant foreign private issuer must furnish and make public under the laws of the jurisdiction in which the registrant is incorporated, domiciled or legally organized (the registrant’s “home country”), or under the rules of the home country exchange on which the registrant’s securities are traded, as long as the report or other document is not a press release, is not required to be and has not been distributed to the registrant’s security holders, and, if discussing a material event, has already been the subject of a Form 6-K submission or other Commission filing on EDGAR.
Indicate by check mark whether by furnishing the information contained in this Form, the registrant is also thereby furnishing the information to the Commission pursuant to Rule 12g3-2(b) under the Securities Exchange Act of 1934.
Yes � No �
If “Yes” is marked, indicate below the file number assigned to registrant in connection with Rule 12g3-2(b): 82- .
QUARTERLY REPORT Quarter Ended December 31, 2008
Currency of Presentation and Certain Defined Terms
In this Quarterly Report, references to “$” or “dollars” or “U.S.$” or “U.S. dollars” are to the legal currency of the United States and references to “Rs.” or “rupees” or “Indian rupees” are to the legal currency of India. Our financial statements are presented in Indian rupees and are prepared in accordance with International Financial Reporting Standards. Convenience translation into U.S. dollars with respect to the unaudited interim condensed consolidated financial statements is also presented. References to a particular “fiscal” year are to our fiscal year ended March 31 of such year. References to “ADS” are to our American Depositary Shares, to the “FASB” are to the Financial Accounting Standards Board, to “SFAS” are to the Statements of Financial Accounting Standards, to “SAB” are to Staff Accounting Bulletin and to the “EITF” are to the Emerging Issues Task Force. All references to “IAS” are to the International Accounting Standards, to “IASB” are to the International Accounting Standards Board, to “IFRS” are to International Financial Reporting Standards, to “SIC” are to Standing Interpretations Committee and to “IFRIC” are to the International Financial Reporting Interpretations Committee.
References to “U.S. FDA” are to the United States Food and Drug Administration, to “NDAs” are to New Drug Applications, and to “ANDAs”are to Abbreviated New Drug Applications.
References to “U.S.” or “United States” are to the United States of America, its territories and its possessions. References to “India” are to the Republic of India. All references to “we,” “us,” “our,” “DRL,” “Dr. Reddy’s” or the “Company” shall mean Dr. Reddy’s Laboratories Limited and its subsidiaries. “Dr. Reddy’s” is a registered trademark of Dr. Reddy’s Laboratories Limited in India. Other trademarks or trade names used in this Quarterly Report are trademarks registered in the name of Dr. Reddy’s Laboratories Limited or are pending before the respective trademark registries.
Except as otherwise stated in this report, all translations from Indian rupees to U.S. dollars are based on the noon buying rate in the City of New York on December 31, 2008 for cable transfers in Indian rupees as certified for customs purposes by the Federal Reserve Bank of New York, which was Rs.48.58 per U.S.$1.00. No representation is made that the Indian rupee amounts have been, could have been or could be converted into U.S. dollars at such a rate or any other rate. Any discrepancies in any table between totals and sums of the amounts listed are due to rounding.
Information contained in our website, www.drreddys.com, is not part of this Quarterly Report and no portion of such information is incorporated herein.
Forward-Looking and Cautionary Statement
IN ADDITION TO HISTORICAL INFORMATION, THIS QUARTERLY REPORT CONTAINS CERTAIN FORWARD-LOOKING STATEMENTS WITHIN THE MEANING OF SECTION 27A OF THE SECURITIES ACT OF 1933, AS AMENDED AND SECTION 21E OF THE SECURITIES EXCHANGE ACT OF 1934, AS AMENDED. THE FORWARD-LOOKING STATEMENTS CONTAINED HEREIN ARE SUBJECT TO CERTAIN RISKS AND UNCERTAINTIES THAT COULD CAUSE ACTUAL RESULTS TO DIFFER MATERIALLY FROM THOSE REFLECTED IN THE FORWARD-LOOKING STATEMENTS. FACTORS THAT MIGHT CAUSE SUCH A DIFFERENCE INCLUDE, BUT ARE NOT LIMITED TO, THOSE DISCUSSED IN THE SECTION ENTITLED “OPERATING AND FINANCIAL REVIEW” AND ELSEWHERE IN THIS REPORT. READERS ARE CAUTIONED NOT TO PLACE UNDUE RELIANCE ON THESE FORWARD-LOOKING STATEMENTS, WHICH REFLECT OUR ANALYSIS ONLY AS OF THE DATE HEREOF. IN ADDITION, READERS SHOULD CAREFULLY REVIEW THE INFORMATION IN OUR PERIODIC REPORTS AND OTHER DOCUMENTS FILED AND/OR FURNISHED WITH THE SECURITIES AND EXCHANGE COMMISSION (“SEC”) FROM TIME TO TIME.
2
TABLE OF CONTENTS
3
ITEM 1. FINANCIAL STATEMENTS 4ITEM 2. OPERATING AND FINANCIAL REVIEW 52 ITEM 3. LIQUIDITY AND CAPITAL RESOURCES 58ITEM 4. RECENT DEVELOPMENTS 60ITEM 5. TREND INFORMATION 61ITEM 6. EXHIBITS 64SIGNATURES 65EX 99.1: INDEPENDENT AUDITOR’S REPORT ON REVIEW OF UNAUDITED CONDENSED CONSOLIDATED INTERIM FINANCIAL INFORMATION
ITEM 1. FINANCIAL STATEMENTS
DR. REDDY’S LABORATORIES LIMITED AND SUBSIDIARIES UNAUDITED CONDENSED CONSOLIDATED INTERIM BALANCE SHEETS
(in millions except share and per share data)
The accompanying notes form an integral part of these unaudited condensed consolidated interim financial statements.
4
As of
Particulars Note December 31, 2008 December 31, 2008 March 31, 2008 Convenience translation into U.S.$ Assets Property, plant and equipment 9 U.S.$ 426 Rs. 20,672 Rs. 16,765Goodwill 10 382 18,573 16,997Other intangible assets 11 382 18,567 16,756 Investment in equity accounted investees 5 247 237Other investments — — 3Other non-current assets 3 169 80
Total non-current assets U.S.$ 1,199 Rs. 58,228 Rs. 50,838
Inventories 12 U.S.$ 312 Rs. 15,157 Rs. 11,133Accounts receivables, net of allowances 266 12,910 6,823Other current assets 129 6,246 3,858Other investments — 16 4,754 Cash and cash equivalents 13 78 3,784 7,421
Total current assets U.S.$ 785 Rs. 38,113 Rs. 33,989
Total assets U.S.$ 1,983 Rs. 96,341 Rs. 84,827
Equity Share capital U.S.$ 17 Rs. 842 Rs. 841Share premium 416 20,185 20,036Unrealized gain/(loss) on investments — 14 (2)Foreign currency translation reserve 49 2,388 1,567Share based payment reserve 15 744 709Hedging reserve (8) (400) (7)Equity shares held by controlled trust — (5) (5)Retained earnings 578 28,082 24,211
Total equity U.S.$ 1,067 Rs. 51,850 Rs. 47,350
Liabilities Long term loans and borrowings, excluding current portion 19 U.S.$ 231 Rs. 11,237 Rs. 12,698Provisions 3 164 123Other non-current liabilities 8 367 323Deferred tax liabilities 91 4,400 4,856
Total non-current liabilities U.S.$ 333 Rs. 16,168 Rs. 18,000
Bank overdraft U.S.$ 23 Rs. 1,101 Rs. 435Short term loans and borrowings 19 141 6,867 4,428Long term loans and borrowings, current portion 63 3,059 1,791Trade payables 138 6,716 5,427Provisions 37 1,819 627Other current liabilities 181 8,761 6,769
Total current liabilities U.S.$ 583 Rs. 28,323 Rs. 19,477
Total liabilities U.S.$ 916 Rs. 44,491 Rs. 37,477
Total equity and liabilities U.S.$ 1,983 Rs. 96,341 Rs. 84,827
DR. REDDY’S LABORATORIES LIMITED AND SUBSIDIARIES UNAUDITED CONDENSED CONSOLIDATED INTERIM INCOME STATEMENTS
(in millions, except share and per share data)
The accompanying notes form an integral part of these unaudited condensed consolidated interim financial statements.
5
Nine months ended Three months ended December 31, December 31,
Finance (income)/expense, net 15 23 1,103 (482) 699 (23)Share of profit/(loss) of equity
accounted investees, net of income tax — 10 2 8 3
Profit before income tax 114 5,542 1,610 3,062 (1,737)Income tax (expense)/benefit 8 (19) (933) 1,301 (617) 524
Profit for the period U.S.$ 95 Rs. 4,609 Rs. 2,911 Rs. 2,445 $ (1,213)
Attributable to: Equity holders of the Company 95 4,609 2,921 2,445 (1,207)Minority interest — — (10) — (6)
Profit for the period U.S.$ 95 Rs. 4,609 Rs. 2,911 Rs. 2,445 $ (1,213)
Earnings per share 16 Basic earnings per share of Rs.5/- each U.S.$ 0.56 Rs. 27.38 Rs. 17.38 Rs. 14.52 Rs. (7.17)Diluted earnings per share of Rs.5/- each U.S.$ 0.56 Rs. 27.27 Rs. 17.31 Rs. 14.49 Rs. (7.17)
DR. REDDY’S LABORATORIES LIMITED AND SUBSIDIARIES UNAUDITED CONDENSED CONSOLIDATED INTERIM STATEMENTS OF CHANGES IN EQUITY
(in millions, except share and per share data)
[Continued on next page]
6
Unrealized gain/(loss) on other Foreign currency Share based
Particulars Share capital Share premium investments translation reserve payment reserve
Shares Amount Amount Amount Amount Amount Balance as of April 1, 2008 168,172,746 Rs.841 Rs.20,036 Rs. (2) Rs.1,567 Rs. 709Issue of equity shares on exercise
of options 256,391 1 149 — — (145)Share based payment expense — — — — — 180Profit for the period — — — — — —Dividend paid — — — — — —Changes in fair value of
investments, net of tax expense of Rs.4 — — — 16 — —
Foreign exchange translation adjustments, net of tax expense of Rs.49 — — — — 821 —
Effective portion of changes in fair value of cash flow hedges, net of tax benefit of Rs.202 — — — — — —
Balance as of December 31, 2008 168,429,137 Rs.842 Rs.20,185 Rs. 14 Rs.2,388 Rs. 744
Balance as of April 1, 2007 167,912,180 Rs.840 Rs.19,909 Rs.(125) Rs. 343 Rs. 565Issue of equity shares on exercise
of options 219,962 1 112 — — (98)Share based payment expense — — — — — 182Profit for the period — — — — — —Dividend paid — — — — — — Changes in fair value of
investments, net of tax benefit of Rs.32 — — — 114 — —
Balance as of December 31, 2007 168,132,142 Rs.841 Rs.20,021 Rs. (11) Rs. 460 Rs. 649
DR. REDDY’S LABORATORIES LIMITED AND SUBSIDIARIES UNAUDITED CONDENSED CONSOLIDATED INTERIM STATEMENTS OF CHANGES IN EQUITY
(in millions, except share and per share data)
[Continued from table on page 6, first column(s) repeated]
The accompanying notes form an integral part of these unaudited condensed consolidated interim financial statements.
7
Equity shares held by a controlled Particulars Hedging reserve trust* Retained earnings Minority interest Total equity Amount Amount Amount Amount Amount
Balance as of April 1, 2008 Rs. (7) Rs. (5) Rs.24,211 — Rs.47,350 Issue of equity shares on exercise of options — — — — 5Share based payment expense — — — — 180Profit for the period — — 4,609 — 4,609Dividend paid — — (738) — (738)Changes in fair value of investments, net of tax expense of
Rs.4 — — — — 16Foreign exchange translation adjustments, net of tax
expense of Rs.49 — — — — 821Effective portion of changes in fair value of cash flow
hedges, net of tax benefit of Rs.202 (393) — — — (393)
Balance as of December 31, 2008 Rs.(400) Rs. (5) Rs.28,082 — Rs.51,850
Balance as of April 1, 2007 — Rs. (5) Rs.21,102 Rs. 10 Rs.42,639Issue of equity shares on exercise of options — — — — 15Share based payment expense — — — — 182 Profit for the period — — 2,921 — 2,921Dividend paid — — (737) — (737)Changes in fair value of investments, net of tax benefit of
Balance as of December 31, 2007 — Rs. (5) 23,286 Rs. — Rs.45,241
* Number of equity shares held by a controlled trust as of April 1, 2007, December 31, 2007, April 1, 2008 and December 31, 2008 is 82,800.
DR. REDDY’S LABORATORIES LIMITED AND SUBSIDIARIES UNAUDITED CONDENSED CONSOLIDATED INTERIM CASH FLOW STATEMENTS
(in millions, except share and per share data)
The accompanying notes form an integral part of these unaudited condensed consolidated interim financial statements.
8
Particulars For the nine months ended December 31,
2008 2008 2007
Convenience translation into U.S.$ Cash flows from/(used in) operating activities: Profit for the period U.S.$ 95 Rs. 4,609 Rs. 2,911Adjustments for:
Income tax expense/(benefit) 19 933 (1,301)Profit on sale of investments (3) (126) (40)Depreciation and amortization 59 2,846 2,373Write down of intangible assets — — 2,883Inventory write-downs 3 129 313Allowance for doubtful trade receivable 2 110 24(Profit)/loss on sale of property, plant and equipment, net — (13) — Equity in (gain)/loss of equity accounted investees — (10) (2)Unrealized exchange (gain)/loss, net (1) (34) (193)Interest expense, net 13 616 203Share based payment expense 4 180 182Negative goodwill on acquisition of business (3) (150) —
Changes in operating assets and liabilities: — — —Trade receivables (127) (6,147) (318)Inventories (66) (3,209) (3,322)Other assets 3 170 (553)Trade payables 11 553 1,222Other liabilities and provisions (1) (70) (276)
Income tax paid (22) (1,065) (639)
Net cash from/(used in) operating activities U. S.$ (14) Rs. (678) Rs. 3,467
Cash flows used in investing activities: Expenditures on property, plant and equipment (78) (3,798) (3,818)Proceeds from sale of property, plant and equipment 1 26 15Purchase of investments (177) (8,601) (3,984)Proceeds from sale of investments 278 13,488 1,020Expenditures on intangible assets (5) (246) (201)Payment of contingent consideration (2) (83) (232)Cash paid for acquisition of business (64) (3,089) —Cash paid for acquisition of equity accounted investee, net of cash acquired of Rs.386 (8) (372) — Interest received 3 156 576
Net cash used in investing activities U.S.$ (52) Rs. (2,519) Rs. (6,624)
Cash flows used in financing activities: Interest paid (17) (802) (824)Proceeds from issuance of equity shares — 5 15Proceeds from/(repayment of) short term loans and borrowings, net 40 1,961 (366)Repayment of long term loans and borrowings, net (28) (1,381) (6,266)Dividend paid (15) (738) (737)
Net cash used in financing activities U.S.$ (20) Rs. (955) Rs. (8,178)
Net decrease in cash and cash equivalents (85) (4,152) (11,335)Effect of exchange rate changes on cash and cash equivalents (3) (151) (653)Cash and cash equivalents at the beginning of the period 144 6,986 18,061
Cash and cash equivalents at the end of the period U.S.$ 55 Rs. 2,683 Rs. 6,073
DR. REDDY’S LABORATORIES LIMITED AND SUBSIDIARIES NOTES TO UNAUDITED CONDENSED CONSOLIDATED INTERIM FINANCIAL STATEMENTS
(in millions, except share and per share data)
9
1. Reporting Entity
Dr. Reddy’s Laboratories Limited (“DRL” or the “parent company”) together with its subsidiaries (collectively, the “Company”) is a leading India-based pharmaceutical company headquartered in Hyderabad, India. The Company’s principal areas of operation are in pharmaceutical services and active ingredients, global generics, and proprietary products. The Company’s principal research and development facilities are located in Andhra Pradesh, India and in the United States; its principal manufacturing facilities are located in Andhra Pradesh, India, Himachal Pradesh, India and Cuernavaca-Cuautla, Mexico; and its principal marketing facilities are located in India, Russia, the United States, the United Kingdom, Brazil and Germany. The Company’s shares trade on the Bombay Stock Exchange and the National Stock Exchange in India and, since April 11, 2001, also on the New York Stock Exchange in the United States. These unaudited condensed consolidated interim financial statements were authorized for issuance by the Company’s Board of Directors on March 4, 2009.
2. Basis of preparation of financial statements
a. Statement of compliance
These condensed consolidated interim financial statements as at and for the three and nine months ended December 31, 2008 have been prepared in accordance with IFRS and its interpretations issued by IASB. These condensed consolidated interim financial statements form part of the period covered by the first IFRS annual financial statements for the year ending March 31, 2009 and IFRS 1, “First-time adoption of International Financial Reporting Standards” has been applied. These condensed consolidated interim financial statements do not include all the information required for full annual consolidated financial statements and are prepared in accordance with IAS 34, “Interim Financial Reporting”.
An explanation of how the transition to IFRS has affected the reported financial position and financial performance of the Company is provided in Note 4. This Note includes reconciliations of equity and profit or loss for comparative periods under U.S. GAAP (sometimes referred to herein as “Previous GAAP”) to those reported for those periods under IFRS.
b. Basis of preparation
These condensed consolidated interim financial statements have been prepared on the basis of relevant IFRS that are effective or available for early adoption at the Company’s first IFRS annual reporting date, March 31, 2009. Based on these IFRS, the Board of Directors has made assumptions about the accounting policies expected to be adopted (“accounting policies”) when the first IFRS annual financial statements are prepared for the year-ending March 31, 2009.
The IFRS that will be effective or available for voluntary early adoption in the annual financial statements for the period ending March 31, 2009 are still subject to change and to the issue of additional interpretation(s) and therefore cannot be determined with certainty. Accordingly, the accounting policies for such annual period that are relevant to this interim financial information will be determined only when the first IFRS financial statements are prepared at March 31, 2009.
The preparation of the condensed consolidated interim financial statements in accordance with IAS 34 resulted in changes to the accounting policies as compared with the most recent annual financial statements prepared under Previous GAAP. The accounting policies set out below have been applied consistently to all periods presented in these condensed consolidated interim financial statements. They also have been applied in preparing an opening IFRS balance sheet at April 1, 2007 for the purposes of the transition to IFRS, as required by IFRS 1. The impact of the transition from Previous GAAP to IFRS is explained in Note 4.
c. Basis of measurement/accounting convention
These condensed consolidated interim financial statements have been prepared on the historical cost basis and on an accrual basis, except for the following:
• derivative financial instruments are measured at fair value; and
• available-for-sale financial assets are measured at fair value.
DR. REDDY’S LABORATORIES LIMITED AND SUBSIDIARIES NOTES TO UNAUDITED CONDENSED CONSOLIDATED INTERIM FINANCIAL STATEMENTS
(in millions, except share and per share data)
10
2. Basis of preparation of financial statements (continued)
d. Functional and presentation currency
The condensed consolidated interim financial statements are presented in Indian rupees which is the functional currency of DRL. Functional currency of an entity is the currency of the primary economic environment in which the entity operates.
In respect of all non-Indian subsidiaries that operate as marketing arms of the parent company in their respective countries/regions, the functional currency has been determined to be the functional currency of the parent company, i.e., the Indian rupee. Accordingly, the operations of these entities are largely restricted to import of finished goods from the parent company in India, sale of these products in the foreign country and remittance of the sale proceeds to the parent company. The cash flows realized from sale of goods are readily available for remittance to the parent company and cash is remitted to the parent company on a regular basis. The costs incurred by these entities are primarily the cost of goods imported from the parent company. The financing of these subsidiaries is done directly or indirectly by the parent company.
In respect of subsidiaries whose operations are self contained and integrated within their respective countries/regions, the functional currency has been determined to be the local currency of those countries/regions. The assets and liabilities of such subsidiaries are translated into Indian rupees at the rate of exchange prevailing as at the reporting date. Revenues and expenses are translated into Indian rupees at average exchange rates prevailing during the year. Resulting translation adjustments are included in foreign currency translation reserve.
All financial information presented in Indian rupees has been rounded to the nearest million.
e. Convenience translation
The accompanying unaudited condensed consolidated interim financial statements have been prepared in Indian rupees. Solely for the convenience of the reader, the unaudited condensed consolidated interim financial statements as of and for the nine months ended December 31, 2008 have been translated into United States dollars at the noon buying rate in New York City on December 31, 2008 for cable transfers in Indian rupees, as certified for customs purposes by the Federal Reserve Bank of New York of U.S.$1.00 = Rs.48.58. No representation is made that the Indian rupee amounts have been, could have been or could be converted into U.S. dollars at such a rate or any other rate.
f. Use of estimates and judgments
The preparation of condensed consolidated interim financial statements in conformity with IFRS requires management to make judgments, estimates and assumptions that affect the application of accounting policies and the reported amounts of assets, liabilities, income and expenses. Actual results may differ from these estimates.
Estimates and underlying assumptions are reviewed on an ongoing basis. Revisions to accounting estimates are recognized in the period in which the estimates are revised and in any future periods affected. In particular, information about significant areas of estimation uncertainty and critical judgments in applying accounting policies that have the most significant effect on the amounts recognized in the financial statements is included in the following Notes:
• Note 3(b) — Assessment of functional currency for foreign operations
• Note 3(c) and 7 — Financial instruments
• Note 3(h) — Measurement of recoverable amounts of cash-generating units
• Note 3(j) — Provisions
• Note 3(k) — Sales returns, rebates and chargeback provisions
• Note 3(m) — Determination of annual effective tax rate in interim periods and recoverability of deferred tax assets
• Note 6 — Business combinations
• Note 21 — Contingencies
DR. REDDY’S LABORATORIES LIMITED AND SUBSIDIARIES NOTES TO UNAUDITED CONDENSED CONSOLIDATED INTERIM FINANCIAL STATEMENTS
(in millions, except share and per share data)
11
3. Significant accounting policies
a. Basis of consolidation
Subsidiaries
Subsidiaries are entities controlled by the Company. Control exists when the Company has the power to govern the financial and operating policies of an entity so as to obtain benefits from its activities. In assessing control, potential voting rights that currently are exercisable are taken into account. The financial statements of subsidiaries are included in the condensed consolidated interim financial statements from the date that control commences until the date that control ceases. The accounting policies of subsidiaries have been changed when necessary to align them with the policies adopted by the Company.
Special purpose entities
The Company has established certain special purpose entities (“SPEs”) for business purposes. The Company does not have any direct or indirect shareholdings in these entities. A SPE is consolidated if, based on an evaluation of the substance of its relationship with the Company and the SPE’s risks and rewards, the Company concludes that it controls the SPE. SPEs controlled by the Company were established under terms that impose strict limitations on the decision-making powers of the SPE’s management and that result in the Company receiving the majority of the benefits related to the SPE’s operations and net assets, being exposed to risks incident to the SPE’s activities, and retaining the majority of the residual or ownership risks related to the SPE or its assets.
Associates and jointly controlled entities (equity accounted investees)
Associates are those entities in which the Company has significant influence, but not control, over the financial and operating policies. Significant influence is presumed to exist when the Company holds between 20 and 50 percent of the voting power of another entity. Joint ventures are those entities over whose activities the Company has joint control, established by contractual agreement and requiring unanimous consent for strategic financial and operating decisions. Associates and jointly controlled entities are accounted for using the equity method (equity accounted investees) and are initially recognized at cost. The condensed consolidated interim financial statements include the Company’s share of the income and expenses and equity movements of equity accounted investees, after adjustments to align the accounting policies with those of the Company, from the date that significant influence or joint control commences until the date that significant influence or joint control ceases. When the Company’s share of losses exceeds its interest in an equity accounted investee, the carrying amount of that interest (including any long term investments) is reduced to zero and the recognition of further losses is discontinued except to the extent that the Company has an obligation or has made payments on behalf of the investee.
The Company does not consolidate entities where the minority shareholders have certain significant participating rights that provide for effective involvement in significant decisions in the ordinary course of business of such entities. Investments in such entities are accounted by the equity method of accounting.
Transactions eliminated on consolidation
Intra-group balances and transactions, and any unrealized income and expenses arising from intra-group transactions, are eliminated in preparing the condensed consolidated interim financial statements. Unrealized gains arising from transactions with equity accounted investees are eliminated against the investment to the extent of the Company’s interest in the investee. Unrealized losses are eliminated in the same way as unrealized gains, but only to the extent that there is no evidence of impairment.
DR. REDDY’S LABORATORIES LIMITED AND SUBSIDIARIES NOTES TO UNAUDITED CONDENSED CONSOLIDATED INTERIM FINANCIAL STATEMENTS
(in millions, except share and per share data)
12
3. Significant accounting policies (continued)
b. Foreign currency
Foreign currency transactions
Transactions in foreign currencies are translated to the respective functional currencies of group entities at exchange rates at the dates of the transactions. Monetary assets and liabilities denominated in foreign currencies at the reporting date are retranslated to the functional currency at the exchange rate at that date. The foreign currency gain or loss on monetary items is the difference between amortized cost in the functional currency at the beginning of the period, adjusted for effective interest and payments during the period, and the amortized cost in foreign currency translated at the exchange rate at the end of the period. Non-monetary assets and liabilities denominated in foreign currencies that are measured at fair value are retranslated to the functional currency at the exchange rate at the date that the fair value was determined. Foreign currency differences arising upon retranslation are recognized in profit or loss, except for differences arising upon qualifying cash flow hedges, which are recognized directly in equity.
Foreign operations
The assets and liabilities of foreign operations, including goodwill and fair value adjustments arising upon acquisition, are translated to reporting currency at exchange rates at the reporting date. The income and expenses of foreign operations are translated to reporting currency at average rates prevailing during the year.
Foreign currency differences are recognized directly in equity. Such differences have been recognized in the foreign currency translation reserve (“FCTR”). When a foreign operation is disposed of, in part or in full, the relevant amount in the FCTR is transferred to profit or loss.
Foreign exchange gains and losses arising from a monetary item receivable from or payable to a foreign operation, the settlement of which is neither planned nor likely in the foreseeable future, are considered to form part of a net investment in a foreign operation and are recognized directly in equity in the FCTR.
c. Financial instruments
Non-derivative financial instruments
Non-derivative financial instruments is comprised of investments in equity and debt securities, trade receivables, certain other assets, cash and cash equivalents, loans and borrowings, trade payables and certain other liabilities.
Non-derivative financial instruments are recognized initially at fair value plus, for instruments not at fair value through profit or loss, any directly attributable transaction costs. Subsequent to initial recognition non-derivative financial instruments are measured as described below.
Cash and cash equivalents
Cash and cash equivalents is comprised of cash balances, current and time deposits with banks. Bank overdrafts that are repayable on demand and form an integral part of the Company’s cash management are included as a component of cash and cash equivalents for the purpose of the statement of cash flows.
Held-to-maturity investments
If the Company has the positive intent and ability to hold debt securities to maturity, then they are classified as held-to-maturity. Held-to-maturity investments are measured at amortized cost using the effective interest method, less any impairment losses.
Available-for-sale financial assets
The Company’s investments in equity securities and certain debt securities are classified as available-for-sale financial assets. Subsequent to initial recognition, they are measured at fair value and changes therein, other than impairment losses and foreign exchange gains and losses on available-for-sale monetary items are recognized directly in equity. When an investment is derecognized, the cumulative gain or loss in equity is transferred to profit or loss.
DR. REDDY’S LABORATORIES LIMITED AND SUBSIDIARIES NOTES TO UNAUDITED CONDENSED CONSOLIDATED INTERIM FINANCIAL STATEMENTS
(in millions, except share and per share data)
13
3. Significant accounting policies (continued)
c. Financial instruments (continued)
Financial assets at fair value through profit or loss
An instrument is classified at fair value through profit or loss if it is held for trading or is designated as such upon initial recognition. Financial instruments are designated at fair value through profit or loss if the Company manages such investments and makes purchase and sale decisions based on their fair value in accordance with the Company’s documented risk management or investment strategy. Upon initial recognition attributable transaction costs are recognized in profit or loss when incurred. Financial instruments at fair value through profit or loss are measured at fair value, and changes therein are recognized in profit or loss.
Other
Other non-derivative financial instruments are measured at amortized cost using the effective interest method, less any impairment losses.
Derivative financial instruments
The Company holds derivative financial instruments to hedge its foreign currency exposure. Derivatives are recognized initially at fair value; attributable transaction costs are recognized in profit or loss when incurred. Subsequent to initial recognition, derivatives are measured at fair value, and changes therein are accounted for as described below.
Cash flow hedges
Changes in the fair value of the derivative hedging instrument designated as a cash flow hedge are recognized directly in equity to the extent that the hedge is effective. To the extent that the hedge is ineffective, changes in fair value are recognized in profit or loss. If the hedging instrument no longer meets the criteria for hedge accounting, expires or is sold, terminated or exercised, then hedge accounting is discontinued prospectively. The cumulative gain or loss previously recognized in equity remains there until the forecast transaction occurs. When the hedged item is a non-financial asset, the amount recognized in equity is transferred to the carrying amount of the asset when it is recognized. In other cases the amount recognized in equity is transferred to profit or loss in the same period that the hedged item affects profit or loss.
Economic hedges
Hedge accounting is not applied to derivative instruments that economically hedge monetary assets and liabilities denominated in foreign currencies. Changes in the fair value of such derivatives are recognized in profit or loss as part of foreign currency gains and losses.
Share capital
Ordinary shares
Ordinary shares are classified as equity. Incremental costs directly attributable to the issue of ordinary shares are recognized as a deduction from equity, net of any tax effects.
d. Property, plant and equipment
Recognition and measurement
Items of property, plant and equipment, including assets acquired under a finance lease, are measured at cost less accumulated depreciation and accumulated impairment losses. Cost includes expenditures that are directly attributable to the acquisition of the asset. The cost of self-constructed assets includes the cost of materials and direct labor, any other costs directly attributable to bringing the asset to a working condition for its intended use, and the costs of dismantling and removing the items and restoring the site on which they are located. Purchased software that is integral to the functionality of the related equipment is capitalized as part of that equipment. Borrowing costs that are directly attributable to the acquisition, construction or production of a qualifying asset are capitalized as part of the cost of that asset.
When parts of an item of property, plant and equipment have different useful lives, they are accounted for as separate items (major components) of property, plant and equipment.
DR. REDDY’S LABORATORIES LIMITED AND SUBSIDIARIES NOTES TO UNAUDITED CONDENSED CONSOLIDATED INTERIM FINANCIAL STATEMENTS
(in millions, except share and per share data)
14
3. Significant accounting policies (continued)
d. Property, plant and equipment (continued)
Gains and losses upon disposal of an item of property, plant and equipment are determined by comparing the proceeds from disposal with the carrying amount of property, plant and equipment and are recognized net within “other income/expense, net” in profit or loss.
Subsequent costs
The cost of replacing part of an item of property, plant and equipment is recognized in the carrying amount of the item if it is probable that the future economic benefits embodied within the part will flow to the Company and its cost can be measured reliably. The carrying amount of the replaced part is derecognized. The costs of the day-to-day servicing of property, plant and equipment are recognized in profit or loss as incurred.
Depreciation
Depreciation is recognized in profit or loss on a straight-line basis over the estimated useful lives of each part of an item of property, plant and equipment. Leased assets are depreciated over the shorter of the lease term and their useful lives unless it is reasonably certain that the Company will obtain ownership by the end of the lease term. Land is not depreciated.
The estimated useful lives for the current and comparative periods are as follows:
Buildings — Factory and administrative buildings 25 — 50 years— Ancillary structures 3 — 15 yearsPlant and equipment 3 — 15 yearsFurniture, fixtures and office equipment 4 — 10 yearsVehicles 4 — 5 yearsComputer equipment 3 — 5 years
Depreciation methods, useful lives and residual values are reviewed at each reporting date.
e. Intangible assets
Goodwill
Goodwill (negative goodwill) arises upon the acquisition of subsidiaries, associates and joint ventures.
Acquisitions prior to April 1, 2007
As part of its transition to IFRS, the Company elected to restate only those business combinations that occurred on or after April 1, 2007. In respect of acquisitions prior to April 1, 2007, goodwill represents the amount recognized under Previous GAAP.
Acquisitions on or after April 1, 2007
For acquisitions on or after April 1, 2007, goodwill represents the excess of the cost of the acquisition over the Company’s interest in the net fair value of the identifiable assets, liabilities and contingent liabilities of the acquiree. When the excess is negative (negative goodwill), it is recognized immediately in profit or loss.
Acquisitions of minority interests
Goodwill arising upon the acquisition of a minority interest in a subsidiary represents the excess of the cost of the additional investment over the carrying amount of the net assets acquired at the date of exchange.
DR. REDDY’S LABORATORIES LIMITED AND SUBSIDIARIES NOTES TO UNAUDITED CONDENSED CONSOLIDATED INTERIM FINANCIAL STATEMENTS
(in millions, except share and per share data)
15
3. Significant accounting policies (continued)
e. Intangible assets (continued)
Subsequent measurement
Goodwill is measured at cost less accumulated impairment losses. In respect of equity accounted investees, the carrying amount of goodwill is included in the carrying amount of the investment.
Research and development
Expenditures on research activities, undertaken with the prospect of gaining new scientific or technical knowledge and understanding, are recognized in profit or loss when incurred.
Development activities involve a plan or design for the production of new or substantially improved products and processes. Development expenditures are capitalized only if development costs can be measured reliably, the product or process is technically and commercially feasible, future economic benefits are probable, and the Company intends to and has sufficient resources to complete development and to use or sell the asset. The expenditures capitalized include the cost of materials, direct labor and overhead costs that are directly attributable to preparing the asset for its intended use. Borrowing costs related to the development of qualifying assets are capitalized as a part of the cost of that asset. Other development expenditures are recognized in profit or loss as incurred.
Internal product development expenditures are capitalized only if they meet the recognition criteria as mentioned above. Where regulatory and other uncertainties are such that the criteria are not met the expenditures are recognized in the Company’s income statement. This is almost invariably the case prior to approval of the drug by the relevant regulatory authority. Where, however, the recognition criteria are met, intangible assets are capitalized and amortized on a straight-line basis over their useful economic lives from product launch. Payments to in-license products and compounds from external third parties for new research and development projects (in-process research and development), generally taking the form of up-front payments and milestones, are capitalized and amortized, generally on a straight-line basis, over their useful economic lives from product launch.
Intangible assets relating to products in development (both internally generated and externally acquired), other intangible assets not available for use and intangible assets having indefinite useful life are subject to impairment testing at each balance sheet date. All other intangible assets are tested for impairment when there are indications that the carrying value may not be recoverable. Any impairment losses are recognized immediately in the Company’s income statement. Trademarks with indefinite useful lives are tested for impairment annually.
Capitalized development expenditures are measured at cost less accumulated amortization and accumulated impairment losses.
Advances paid for research and development activities is shown as other receivable in the balance sheet until the time that actual cost is incurred for such research and development activities. Such amounts are capitalized or recognized as an expense, as the case may be, as the related goods are delivered or the related services are performed.
Other intangible assets
Other intangible assets that are acquired by the Company, which have finite useful lives, are measured at cost less accumulated amortization and accumulated impairment losses.
Subsequent expenditures
Subsequent expenditures are capitalized only when they increase the future economic benefits embodied in the specific asset to which they relate. All other expenditures, including expenditures on internally generated goodwill and brands, are recognized within “other income/expense” in profit or loss as incurred.
DR. REDDY’S LABORATORIES LIMITED AND SUBSIDIARIES NOTES TO UNAUDITED CONDENSED CONSOLIDATED INTERIM FINANCIAL STATEMENTS
(in millions, except share and per share data)
16
3. Significant accounting policies (continued)
e. Intangible assets (continued)
Amortization
Amortization is recognized in profit or loss on a straight-line basis over the estimated useful lives of intangible assets, other than for goodwill, intangible assets not available for use and intangible assets having indefinite life, from the date that they are available for use. The estimated useful lives for the current and comparative periods are as follows:
Trademarks with finite useful life 3 — 10 yearsProduct related intangibles 6 — 15 yearsBeneficial toll manufacturing contract 24 monthsNon-competition arrangements 1.5 — 10 yearsMarketing rights 3 — 16 yearsCustomer-related intangibles 2 — 11 yearsOther intangibles 5 — 15 years
f. Leases
At the inception of a lease, the lease arrangement is classified as either a finance lease or an operating lease, based on the substance of the lease arrangement.
Finance leases
A finance lease is recognized as an asset and a liability at the commencement of the lease at the lower of the fair value of the asset and the present value of the minimum lease payments. Initial direct costs, if any, are also capitalized and, subsequent to initial recognition, the asset is accounted for in accordance with the accounting policy applicable to that asset. Minimum lease payments made under finance leases are apportioned between the finance expense and the reduction of the outstanding liability. The finance expense is allocated to each period during the lease term so as to produce a constant periodic rate of interest on the remaining balance of the liability.
Operating leases
Other leases are operating leases and the leased assets are not recognized on the Company’s balance sheet. Payments made under operating leases are recognized in profit or loss on a straight-line basis over the term of the lease.
g. Inventories
Inventories consist of raw materials, stores and spares, work in progress and finished goods and are measured at the lower of cost and net realizable value. The cost of all categories of inventories, except stores and spares, is based on the first-in first-out principle. Stores and spares is comprised of packing materials, engineering spares (such as machinery spare parts) and consumables (such as lubricants, cotton waste and oils), which are used in operating machines or consumed as indirect materials in the manufacturing process, where cost is based on a weighted average method. Cost includes expenditures incurred in acquiring the inventories, production or conversion costs and other costs incurred in bringing them to their existing location and condition. In the case of finished goods and work in progress, cost includes an appropriate share of overheads based on normal operating capacity.
Net realizable value is the estimated selling price in the ordinary course of business, less the estimated costs of completion and selling expenses.
DR. REDDY’S LABORATORIES LIMITED AND SUBSIDIARIES NOTES TO UNAUDITED CONDENSED CONSOLIDATED INTERIM FINANCIAL STATEMENTS
(in millions, except share and per share data)
17
3. Significant accounting policies (continued)
h. Impairment
Financial assets
A financial asset is assessed at each reporting date to determine whether there is any objective evidence that it is impaired. A financial asset is considered to be impaired if objective evidence indicates that one or more events have had a negative effect on the estimated future cash flows of that asset.
An impairment loss in respect of a financial asset measured at amortized cost is calculated as the difference between its carrying amount and the present value of the estimated future cash flows discounted at the original effective interest rate. An impairment loss in respect of an available-for-sale financial asset is calculated by reference to its fair value.
Individually significant financial assets are tested for impairment on an individual basis. The remaining financial assets are assessed collectively in groups that share similar credit risk characteristics.
All impairment losses are recognized in profit or loss. Any cumulative loss in respect of an available-for-sale financial asset recognized previously in equity is transferred to profit or loss. An impairment loss is reversed if the reversal can be related objectively to an event occurring after the impairment loss was recognized. For financial assets measured at amortized cost and available-for-sale financial assets that are debt securities, the reversal is recognized in profit or loss. For available-for-sale financial assets that are equity securities, the reversal is recognized directly in equity.
Non-financial assets
The carrying amounts of the Company’s non-financial assets, other than inventories and deferred tax assets, are reviewed at each reporting date to determine whether there is any indication of impairment. If any such indication exists, then the asset’s recoverable amount is estimated. For goodwill and intangible assets that have indefinite lives or that are not yet available for use, the recoverable amount is estimated each year at the same time.
The recoverable amount of an asset or cash-generating unit is the greater of its value in use and its fair value less costs to sell. In assessing value in use, the estimated future cash flows are discounted to their present value using a pre-tax discount rate that reflects current market assessments of the time value of money and the risks specific to the asset. For the purpose of impairment testing, assets are grouped together into the smallest group of assets that generates cash inflows from continuing use that are largely independent of the cash inflows of other assets or groups of assets (the “cash-generating unit”). The goodwill acquired in a business combination, for the purpose of impairment testing, is allocated to cash-generating units that are expected to benefit from the synergies of the combination.
An impairment loss is recognized if the carrying amount of an asset or its cash-generating unit exceeds its estimated recoverable amount. Impairment losses are recognized in profit or loss. Impairment losses recognized in respect of cash-generating units are allocated first to reduce the carrying amount of any goodwill allocated to the units and then to reduce the carrying amount of the other assets in the unit (or group of units) on a pro rata basis.
An impairment loss in respect of goodwill is not reversed. In respect of other assets, impairment losses recognized in prior periods are assessed at each reporting date for any indications that the loss has decreased or no longer exists. An impairment loss is reversed if there has been a change in the estimates used to determine the recoverable amount. An impairment loss is reversed only to the extent that the asset’s carrying amount does not exceed the carrying amount that would have been determined, net of depreciation or amortization, if no impairment loss had been recognized.
DR. REDDY’S LABORATORIES LIMITED AND SUBSIDIARIES NOTES TO UNAUDITED CONDENSED CONSOLIDATED INTERIM FINANCIAL STATEMENTS
(in millions, except share and per share data)
18
3. Significant accounting policies (continued)
i. Employee benefits
Defined contribution plan
A defined contribution plan is a post-employment benefit plan under which an entity pays fixed contributions into a separate entity and will have no legal or constructive obligation to pay further amounts. Obligations for contributions to recognized provident funds and approved superannuation schemes which are defined contribution plans are recognized as an employee benefit expense in profit or loss when they are incurred.
Prepaid contributions are recognized as an asset to the extent that a cash refund or a reduction in future payments is available.
Defined benefit plans
A defined benefit plan is a post-employment benefit plan other than a defined contribution plan. The Company’s net obligation in respect of an approved gratuity plan which is a defined benefit plan and certain other defined benefit plans is calculated separately for each plan by estimating the amount of future benefit that employees have earned in return for their service in the current and prior periods; that benefit is discounted to determine its present value. Any unrecognized past service costs and the fair value of any plan assets are deducted. The discount rate is the yield at the reporting date on risk free government bonds that have maturity dates approximating the terms of the Company’s obligations and that are denominated in the same currency in which the benefits are expected to be paid. The calculation is performed annually by a qualified actuary using the projected unit credit method. When the calculation results in a benefit to the Company, the recognized asset is limited to the net total of any unrecognized past service costs and the present value of any future refunds from the plan or reductions in future contributions to the plan.
When the benefits of a plan are improved, the portion of the increased benefit relating to past service by employees is recognized in profit or loss on a straight-line basis over the average period until the benefits become vested. To the extent that the benefits vest immediately, the expense is recognized immediately in profit or loss.
The Company recognizes actuarial gains and losses using the corridor method. Under this method, to the extent that any cumulative unrecognized actuarial gain or loss exceeds 10% of the greater of the present value of the defined benefit obligation and the fair value of plan assets, that portion is recognized in income over the expected average remaining working lives of the employees participating in the plan. Otherwise, the actuarial gain or loss is not recognized.
Termination benefits
Termination benefits are recognized as an expense when the Company is demonstrably committed, without realistic possibility of withdrawal, to a formal detailed plan to either terminate employment before the normal retirement date, or to provide termination benefits as a result of an offer made to encourage voluntary redundancy. Termination benefits for voluntary redundancies are recognized as an expense if the Company has made an offer encouraging voluntary redundancy, it is probable that the offer will be accepted, and the number of acceptances can be estimated reliably.
Short-term benefits
Short-term employee benefit obligations are measured on an undiscounted basis and are expensed as the related service is provided.
A liability is recognized for the amount expected to be paid under short-term cash bonus or profit-sharing plans if the Company has a present legal or constructive obligation to pay this amount as a result of past service provided by the employee and the obligation can be estimated reliably.
Compensated leave of absence
Eligible employees are entitled to accumulate compensated absences up to prescribed limits in accordance with the Company’s policy and receive cash in lieu thereof. The Company measures the expected cost of accumulating
DR. REDDY’S LABORATORIES LIMITED AND SUBSIDIARIES NOTES TO UNAUDITED CONDENSED CONSOLIDATED INTERIM FINANCIAL STATEMENTS
(in millions, except share and per share data)
19
3. Significant accounting policies (continued)
i. Employee benefits (continued)
compensated absences as the additional amount that the Company entities expect to pay as a result of the unused entitlement that has accumulated at the balance sheet date. Such measurement is based on actuarial valuation as at the balance sheet date carried out by a qualified actuary.
Share-based payment transactions
The grant date fair value of options granted to employees, calculated using the Black-Scholes model, is recognized as an employee expense, with a corresponding increase in equity, over the period that the employees become unconditionally entitled to the options. The increase in equity recognized in connection with a share based payment transaction is presented as a separate component in equity. The amount recognized as an expense is adjusted to reflect the actual number of share options that vest.
j. Provisions
A provision is recognized if, as a result of a past event, the Company has a present legal or constructive obligation that can be estimated reliably, and it is probable that an outflow of economic benefits will be required to settle the obligation. If the effect of the time value of money is material, provisions are determined by discounting the expected future cash flows at a pre-tax rate that reflects current market assessments of the time value of money and the risks specific to the liability. Where discounting is used, the increase in the provision due to the passage of time is recognized as a finance cost.
Restructuring
A provision for restructuring is recognized when the Company has approved a detailed and formal restructuring plan, and the restructuring either has commenced or has been announced publicly. Future operating costs are not provided for.
Onerous contracts
A provision for onerous contracts is recognized when the expected benefits to be derived by the Company from a contract are lower than the unavoidable cost of meeting its obligations under the contract. The provision is measured at the present value of the lower of the expected cost of terminating the contract and the expected net cost of continuing with the contract. Before a provision is established, the Company recognizes any impairment loss on the assets associated with that contract.
k. Revenue
Sale of Goods
Revenue is recognized when the significant risks and rewards of ownership have been transferred to the buyer, recovery of the consideration is probable, the associated costs and possible return of goods can be estimated reliably, there is no continuing management involvement with the goods and the amount of revenue can be measured reliably. Revenue from the sale of goods includes excise duty and is measured at the fair value of the consideration received or receivable, net of returns, sales tax and applicable trade discounts and allowances.
Revenue from domestic sales of generic products is recognized upon delivery of products to stockists by clearing and forwarding agents of the Company. Revenue from domestic sales of active pharmaceutical ingredients and intermediates is recognized on delivery of products to customers, from the factories of the Company. Revenue from export sales is recognized when the significant risks and rewards of ownership of products are transferred to the customers, which is based upon the terms of the applicable contract.
Sales of generics in India are made through clearing and forwarding agents to stockists. Significant risks and rewards in respect of ownership of generic products are transferred by the Company when the goods are delivered to stockists from clearing and forwarding agents. Clearing and forwarding agents are generally compensated on a commission basis as a percentage of sales made by them.
DR. REDDY’S LABORATORIES LIMITED AND SUBSIDIARIES NOTES TO UNAUDITED CONDENSED CONSOLIDATED INTERIM FINANCIAL STATEMENTS
(in millions, except share and per share data)
20
3. Significant accounting policies (continued)
k. Revenue (continued)
Sales of active pharmaceutical ingredients and intermediates in India are made directly to the end customers generally, formulation manufacturers, from the factories of the Company. Significant risks and rewards in respect of ownership of active pharmaceuticals ingredients are transferred by the Company on delivery of the products to the customers. Sales of active pharmaceutical ingredients and intermediates outside India are made directly to the end customers, generally stockists or formulations manufacturers, from the parent company or its consolidated subsidiaries.
The Company has entered into marketing arrangements with certain marketing partners for sale of goods in certain overseas territories. Under such arrangements, the Company sells generic products to the marketing partners at a price agreed in the arrangement. Revenue is recognized on these transactions upon delivery of products to the marketing partners. An additional amount, representing profit share, is recognized as revenue, on the basis of ultimate net sale proceeds, only when realization is certain.
Provisions for chargeback, rebates, discounts and medicaid payments are estimated and provided for in the year of sales and recorded as reduction of revenue. A chargeback claim is a claim made by the wholesaler for the difference between the price at which the product is initially invoiced to the wholesaler and the net price at which it is agreed to be procured from the Company. Provision for such chargebacks are accrued and estimated based on the historical average chargeback rate actually claimed over a period of time, current contract prices with wholesalers/other customers and average inventory holding by the wholesaler. Such provisions are disclosed as a reduction of trade receivable.
During the three months ended December 31, 2008, the Company adjusted its estimate for chargeback and rebate accrual based on certain additional information regarding customer buying patterns and other market developments, which resulted in a credit of U.S.$5.1 million being recorded as revenues for the three months ended December 31, 2008.
The Company accounts for sales returns by recording an accrual based on the Company’s estimate of expected sales returns. The Company deals in various products and operates in various markets. Accordingly, the Company’s estimate of sales returns is determined primarily by its experience in these markets. In respect of established products, the Company determines an estimate of sales returns accrual primarily based on historical experience of such sales returns. Additionally, other factors that the Company considers in determining the estimate include levels of inventory in the distribution channel, estimated shelf life, product discontinuances, price changes of competitive products, and introduction of competitive new products, to the extent each of these factors impact the Company’s business and markets. The Company considers all these factors and adjusts the sales return accrual to reflect its actual experience. With respect to new products introduced by the Company, those are either extensions of an existing line of product or in a general therapeutic category where the Company has historical experience. The Company’s new product launches have historically been in therapeutic categories where established products exist and are sold either by the Company or its competitors. The Company has not yet introduced products in a new therapeutic category where the sales returns experience of such products is not known. The amount of sales returns for the Company’s newly launched products do not significantly differ from sales returns experience of current products marketed by the Company or its competitors (as the Company understands based on industry publications). Accordingly, the Company does not expect sales returns for new products to be significantly different from expected sales returns of current products. The Company evaluates sales returns of all its products at the end of each reporting period and records necessary adjustments, if any.
Services
Revenue from services rendered, which primarily relate to contract research, is recognized in profit or loss in proportion to the stage of completion of the transaction at the reporting date. The stage of completion is assessed by reference to cost incurred as a percentage of total expected cost.
License fees
Non-refundable milestone payments are recognized in the consolidated statement of operations as and when related services are rendered or agreed milestones are achieved in accordance with the terms of the license agreement, and when the Company has no future obligations or continuing involvement pursuant to such milestone payments. Non-refundable up-front license fees are deferred and recognized when the milestones are earned, in proportion to the amount that each milestone earned bears to the total milestone payments agreed in the license agreement. Where the
DR. REDDY’S LABORATORIES LIMITED AND SUBSIDIARIES NOTES TO UNAUDITED CONDENSED CONSOLIDATED INTERIM FINANCIAL STATEMENTS
(in millions, except share and per share data)
upfront license fees are a composite amount and cannot be attributed to a specific molecule, they are amortized over the development period. The milestone payments increase during the development period as the risk involved decreases. The agreed milestone payments reflect the progress of the development of the molecule and may not be spread evenly over the development period. Accordingly, the milestone payments are a fair representation of the extent of progress made in the development of these underlying molecules. In the event the development of a molecule is discontinued, the corresponding amount of deferred revenue is recognized in the consolidated statement of operations in the period in which the project is terminated.
The Company has entered into certain dossier sales, licensing arrangements and supply arrangements that include certain performance obligations. Based on an evaluation of whether or not these obligations are inconsequential or perfunctory, the Company defers the upfront payments received under these arrangements. Such deferred revenue is recognized in the consolidated statement of operations in the period in which the Company completes remaining performance obligations.
Export entitlements
Export entitlements are recognized as income when the right to receive credit as per the terms of the scheme is established in respect of the exports made and where there is no significant uncertainty regarding the ultimate collection of the relevant export proceeds.
Finance income is comprised of interest income on funds invested (including available-for-sale financial assets), dividend income, gains on the disposal of available-for-sale financial assets, changes in the fair value of financial assets at fair value through profit or loss, and gains on hedging instruments that are recognized in profit or loss. Interest income is recognized as it accrues in profit or loss, using the effective interest method. Dividend income is recognized in profit or loss on the date that the Company’s right to receive payment is established.
Finance expenses is comprised of interest expense on loans and borrowings, unwinding of the discount on provisions, changes in the fair value of financial assets at fair value through profit or loss, impairment losses recognized on financial assets, and losses on hedging instruments that are recognized in profit or loss. All borrowing costs are recognized in profit or loss using the effective interest method.
Foreign currency gains and losses are reported on a net basis.
Income tax expense is comprised of current and deferred tax. Income tax expense is recognized in profit or loss except to the extent that it relates to items recognized directly in equity, in which case it is recognized in equity.
Current tax is the expected tax payable on the taxable income for the year, using tax rates enacted or substantively enacted at the reporting date, and any adjustment to tax payable in respect of previous years.
Deferred tax is recognized using the balance sheet method, providing for temporary differences between the carrying amounts of assets and liabilities for financial reporting purposes and the amounts used for taxation purposes. Deferred tax is not recognized for the following temporary differences: the initial recognition of assets or liabilities in a transaction that is not a business combination and that affects neither accounting nor taxable profit, and differences relating to investments in subsidiaries and jointly controlled entities to the extent that it is probable that they will not reverse in the foreseeable future. In addition, deferred tax is not recognized for taxable temporary differences arising upon the initial recognition of goodwill. Deferred tax is measured at the tax rates that are expected to be applied to the temporary differences when they reverse, based on the laws that have been enacted or substantively enacted by the reporting date. Deferred tax assets and liabilities are offset if there is a legally enforceable right to offset current
21
3. Significant accounting policies (continued)
k. Revenue (continued)
l. Finance income and expenses
m. Income tax
DR. REDDY’S LABORATORIES LIMITED AND SUBSIDIARIES NOTES TO UNAUDITED CONDENSED CONSOLIDATED INTERIM FINANCIAL STATEMENTS
(in millions, except share and per share data)
tax liabilities and assets, and they relate to income taxes levied by the same tax authority on the same taxable entity, or on different tax entities, but they intend to settle current tax liabilities and assets on a net basis or their tax assets and liabilities will be realized simultaneously.
A deferred tax asset is recognized to the extent that it is probable that future taxable profits will be available against which the temporary difference can be utilized. Deferred tax assets are reviewed at each reporting date and are reduced to the extent that it is no longer probable that the related tax benefit will be realized.
Additional income taxes that arise from the distribution of dividends are recognized at the same time as the liability to pay the related dividend is recognized.
The Company presents basic and diluted earnings per share (EPS) data for its ordinary shares. Basic EPS is calculated by dividing the profit or loss attributable to ordinary shareholders of the Company by the weighted average number of ordinary shares outstanding during the period. Diluted EPS is determined by adjusting the profit or loss attributable to ordinary shareholders and the weighted average number of ordinary shares outstanding for the effects of all dilutive potential ordinary shares, which is comprised of share options granted to employees.
A number of new standards and interpretations, and amendments to standards and interpretations, are not yet effective for the year ending March 31, 2009, and have not been applied in preparing these condensed consolidated interim financial statements:
22
3. Significant accounting policies (continued)
m. Income tax (continued)
n. Earnings per share
o. New standards and interpretations not yet adopted
• Revised IAS 1, “Presentation of Financial Statements” (2007) becomes mandatory for the Company’s consolidated financial statements for the year ending March 31, 2010 and is not expected to have any material impact on the presentation of the consolidated financial statements.
• Revised IFRS 3, “Business Combinations” (2008) becomes mandatory for the Company’s consolidated financial statements for the year ending March 31, 2011 and will be applied prospectively.
• Amended IAS 27, “Consolidated and Separate Financial Statements” (2008) becomes mandatory for the Company’s consolidated financial statements for the year ending March 31, 2011 and will be applied prospectively.
• Amendment to IFRS 2, “Share-based Payment — Vesting Conditions and Cancellations” becomes mandatory for the Company’s consolidated financial statements for the year ending March 31, 2010 with retrospective application. The Company is currently in the process of evaluating the potential impact of the revised standard on its consolidated financial statements.
• Amendments to IAS 32, “Financial Instruments: Presentation” and IAS 1, “Presentation of Financial Statements — Puttable Financial Instruments and Obligations Arising on Liquidation” becomes mandatory for the Company’s consolidated financial statements for the year ending March 31, 2010 and retrospective application is permitted. The adoption of this standard is not expected to have any material impact on the Company’s consolidated financial statements.
• Revised IAS 23, “Borrowing Costs” becomes mandatory for the Company’s consolidated financial statements for the year ending March 31, 2010. As the Company currently follows a policy of capitalizing borrowing costs, this new standard will have no impact on the Company’s consolidated financial statements.
DR. REDDY’S LABORATORIES LIMITED AND SUBSIDIARIES NOTES TO UNAUDITED CONDENSED CONSOLIDATED INTERIM FINANCIAL STATEMENTS
(in millions, except share and per share data)
As stated in Note 2(a), these condensed consolidated interim financial statements form part of the period covered by the first IFRS annual consolidated financial statements prepared in accordance with IFRS. In preparing these financial statements, the Company has availed itself of certain exemptions and exceptions in accordance with IFRS 1.
Following are the exemptions which the Company has opted to apply/not to apply:
23
3. Significant accounting policies (continued)
o. New standards and interpretations not yet adopted (continued)
• Amendment to IAS 39, “Financial Instruments — Recognition and Measurement” becomes mandatory for the Company’s consolidated financial statements for the year ending March 31, 2010. The Company is currently in the process of evaluating the potential impact of the revised standard on its consolidated financial statements.
• IFRIC 13, “Customer Loyalty Programmes” becomes mandatory for the Company’s consolidated financial statements for the year ending March 31, 2010 and is not expected to have any impact on the Company’s consolidated financial statements.
• IFRIC 14, “IAS 19 — The Limit on a Defined Benefit Asset, Minimum Funding Requirements and their Interaction”, becomes mandatory for the Company’s consolidated financial statements for the year ending March 31, 2010 and is not expected to have any material impact on its consolidated financial statements.
p. Standards early adopted
• IFRS 8, “Operating Segments” which introduces the “management approach” to segment reporting. IFRS 8 is mandatory for the Company’s consolidated financial statements for the year ending March 31, 2010. IFRS 8 requires presentation and disclosure of segment information based on the internal reports regularly reviewed by the Company’s Chief Operating Decision Maker in order to assess each segment’s performance and to allocate resources to them. The Company has early adopted IFRS 8 and presented segment information in respect of its operating segments in its unaudited condensed consolidated interim financial statements following management approach based on the internal reports regularly reviewed by the Company’s Chief Operating Decision Maker.
4. Explanation of transition to IFRS
a. Exemptions from retrospective application
i. Business combinations exemption: The Company has applied the exemption as provided in IFRS 1 on non-application of IFRS 3, “Business Combinations” to business combinations consummated prior to April 1, 2007 (the “Transition Date”), pursuant to which goodwill arising from business combination has been stated at the carrying amount prior to the date of transition under Previous GAAP. The Company has also applied the exemption for past business combinations to acquisitions of investments in associates consummated prior to the Transition Date.
ii. Fair value as deemed cost exemption: The Company has not elected to measure any item of property, plant and equipment at its fair value at the Transition Date; property, plant and equipment have been measured at cost in accordance with IFRS.
iii. Employee benefits exemption: The Company has elected to apply the exemption as provided in IFRS 1 and recognized cumulative actuarial gains and losses as of the Transition Date as an adjustment to the opening retained earnings. The Company will apply the corridor approach in subsequent periods.
iv. Cumulative translation differences exemption: The Company had accumulated the translation differences in a separate component of equity under Previous GAAP. Upon transition to IFRS, the treatment of recording translation differences in equity did not undergo any change and consequently the optional exemption of setting
DR. REDDY’S LABORATORIES LIMITED AND SUBSIDIARIES NOTES TO UNAUDITED CONDENSED CONSOLIDATED INTERIM FINANCIAL STATEMENTS
(in millions, except share and per share data)
24
4. Explanation of transition to IFRS (continued)
a. Exemptions from retrospective application (continued)
cumulative differences as zero and reclassifying the amount recognized in accordance with Previous GAAP as retained earnings as at the Transition Date was not required to be applied.
v. Compound financial instruments: The Company did not have any compound financial instrument as of the Transition Date. Consequently, upon adoption of IFRS the optional exemption allowed of non-segregation of the liability component if such component was no longer outstanding on the Transition Date is not applicable to the Company.
vi. Assets and liabilities of subsidiaries, associates and joint ventures exemption: All entities of the Company are transitioning to IFRS on the same date. Consequently this exemption is not applicable to the Company.
vii. Share-based payment transaction exemption: Under Previous GAAP, the Company had applied the fair value recognition and measurement principles similar to those prescribed under IFRS 2 for all options granted before the Transition Date. Consequently, upon transition to IFRS, the optional exemption is not applicable to the Company.
viii. Fair value measurement of financial assets or liabilities at initial recognition: The Company has not applied the amendment offered by the revision of IAS 39, “Financial Instruments: Recognition and Measurement”, upon the initial recognition of the financial instruments measured at fair value through income statement where there is no active market.
ix. Designation of financial assets and financial liabilities exemption: The Company did not have any financial assets or liabilities as of the Transition Date which were required to be designated and which met the required criteria given in IFRS 1 as a financial asset or financial liability at fair value through profit or loss.
x. Changes in decommissioning liabilities included in the cost of property, plant and equipment exemption: The Company does not have any material decommissioning liabilities in the cost of property, plant and equipment. Consequently, this exception is not applicable to the Company.
xi. Leases exemption: The Company has no arrangements containing a lease as defined under IFRIC 4, “Determining whether an arrangement contains a lease”, as of the Transition Date. Consequently, this exemption is not applicable to the Company.
xii. Financial asset or an intangible asset accounted for in accordance with IFRIC 12, Service Concession Arrangements exemption: The Company has no arrangements which would be classified as a service concession arrangement under IFRIC 12, “Service Concession Arrangements”. Consequently, this exemption is not applicable to the Company.
xiii. Insurance contracts: The Company does not issue any insurance contracts. Consequently, this exemption is not applicable to the Company.
b. Exceptions from full retrospective application
i. Derecognition of financial assets and liabilities exception: Financial assets and liabilities derecognized before January 1, 2004 are not re-recognized under IFRS. No arrangements were identified that had to be assessed under this exception.
ii. Hedge accounting exception: The Company has not identified any hedging relationships existing as of the Transition Date. Consequently, this exception of not reflecting in its opening IFRS statement of financial position a hedging relationship of a type that does not qualify for hedge accounting under IAS 39 is not applicable to the Company.
iii. Estimates exception: Upon an assessment of the estimates made under Previous GAAP, the Company has concluded that there was no necessity to revise such estimates under IFRS except as a part of transition where
DR. REDDY’S LABORATORIES LIMITED AND SUBSIDIARIES NOTES TO UNAUDITED CONDENSED CONSOLIDATED INTERIM FINANCIAL STATEMENTS
(in millions, except share and per share data)
The accounting policies as stated above have been applied in preparing the condensed consolidated interim financial statements for the three and nine months ended December 31, 2008, the comparative information for the three and nine months ended December 31, 2007, the consolidated financial statements for the year ended March 31, 2008 and the preparation of an opening IFRS balance sheet at April 1, 2007. In preparing its opening IFRS balance sheet, comparative information for the three and nine months ended December 31, 2007 and financial statements for the year ended March 31, 2008, the Company has adjusted amounts reported previously in financial statements prepared in accordance with Previous GAAP.
An explanation of how the transition from Previous GAAP to IFRS has affected the Company’s financial position, financial performance and cash flows is set out in the following tables and the Notes that accompany the tables.
25
4. Explanation of transition to IFRS (continued)
b. Exceptions from full retrospective application (continued)
estimates were required by IFRS and not required by Previous GAAP or where estimates made under Previous GAAP were to be revised to comply with IFRS, but such estimates reflected the conditions as at the Transition Date.
iv. Assets classified as held for sale and discontinued operations: The Company has not classified any asset as held for sale and hence this exception is not applicable.
c. Reconciliation
i. Reconciliation of equity
As at Notes April 1, 2007 December 31, 2007 March 31, 2008
Total equity under Previous GAAP Rs. 41,578 Rs. 44,927 Rs. 47,067Impairment impact on intangibles A 621 99 99Amortization reversal on intangibles impaired A — 12 26Employee benefits B (24) (65) 16Fringe benefit tax on employee stock options D — (59) (53)Tax adjustments E 454 310 170 Foreign exchange rate impact on above adjustments — 17 25
Equity under IFRS before reclassification of minority interest 42,629 45,241 47,350Minority interest F 10 — —
Total equity under IFRS Rs. 42,639 Rs. 45,241 Rs. 47,350
ii. Reconciliation of profit for the period
For three months For nine months ended ended For the year ended Notes December 31, 2007 December 31, 2007 March 31, 2008
Profit under Previous GAAP Rs. (847) Rs. 3,650 Rs. 4,678Impairment impact on intangibles A (522) (522) (522)Amortization reversed on intangibles impaired A 4 12 26Employee benefits B 4 (33) (19)Cash flow hedge related adjustments C — — (25)Fringe benefit tax on employee stock options D 10 (59) (53)Tax adjustments E 144 (144) (257)Minority interest F (6) (10) (10)Foreign exchange rate impact on above adjustments — 17 18
Profit under IFRS Rs. (1,213) Rs. 2,911 Rs. 3,836
DR. REDDY’S LABORATORIES LIMITED AND SUBSIDIARIES NOTES TO UNAUDITED CONDENSED CONSOLIDATED INTERIM FINANCIAL STATEMENTS
(in millions, except share and per share data)
Under Previous GAAP, impairment testing for an amortizable asset is a two step process. First, it is tested for impairment by comparing the undiscounted future cash flow projections with the carrying value of the asset. If upon comparison, the carrying value exceeds the undiscounted cash flows then, under the second step, an impairment charge is recognized for the difference between carrying amount of the asset and the fair value thereof computed using a discounted cash flow approach. Under IFRS, there is only a one step process, wherein impairment is tested and recognized if upon comparison, the carrying value of the asset exceeds the discounted cash flows. The differential approach resulted in additional impairment being recorded.
Furthermore, under Previous GAAP, a non-amortizable asset was tested for impairment at the asset level, whereas under IFRS the impairment testing was done at a higher cash generating unit level, as it did not generate identifiable cash inflows independent from other assets. Impairment testing at such higher cash generating unit level under IFRS did not indicate any impairment and accordingly, there was a reversal of impairment charge with respect to such non-amortizable asset.
The aforesaid differences have resulted in an increase in equity under IFRS by Rs.621, Rs.99 and Rs.99 as of April 1, 2007, December 31, 2007 and March 31, 2008, respectively, and an additional impairment and a decrease in profit under IFRS by Rs.522 for the three and nine months ended December 31, 2007 and for the year ended March 31, 2008.
Furthermore, due to additional impairment as explained above, the amortization recorded has been reversed. The impact of reversal of amortization resulted in an increase in equity under IFRS by Rs.12 and Rs.24 as of December 31, 2007 and March 31, 2008, respectively and an increase in profit by Rs.4 and Rs.12 for the three and nine months ended December 31, 2007, respectively and Rs.26 for the year ended March 31, 2008.
Under Previous GAAP, in determining the liability in respect of employment benefits, the Company used discounting rates which were based on high-quality fixed-income investments prevalent at the reporting date. Under IFRS, the Company is required to use high quality corporate bond rates or, in the absence of a deep market for such bonds, the government bond rate is required to be used. The Company has used the government bond rates for actuarially valuing its defined benefit obligations, which resulted in an increase in the liability and consequently, the net period benefit cost in each of the reporting periods.
Furthermore, until April 1, 2007, the Company used the corridor approach to record actuarial gains and losses under Previous GAAP. Upon adoption of IFRS, the Company elected to recognize all cumulative actuarial gains and losses in respect of defined benefit plans at April 1, 2007 (the date of transition) as an adjustment to opening retained earnings and has set the corridor to “zero”. Also, under Previous GAAP, the Company had recorded actuarial gains and losses as part of equity, which is not required under IFRS, thereby resulting in a reduced liability in the books with a corresponding positive impact on equity.
The aforesaid differences have resulted in a decrease in equity under IFRS by Rs.26, Rs.65 and an increase in equity under IFRS by Rs.16 as at April 1, 2007, December 31, 2007 and March 31, 2008, respectively. Consequently, it also resulted in an increase of profit under IFRS by Rs.4 for the three months ended December 31, 2007, and a decrease of profit under IFRS by Rs.33 and Rs.19 for the nine months ended December 31, 2007 and the year ended March 31, 2008, respectively.
Under Previous GAAP, for certain hedge relationships where the hedging instrument is an option, a terminal value approach to the assessment of effectiveness and measurement of ineffectiveness was adopted as permitted by
26
4. Explanation of transition to IFRS (continued)
c. Reconciliation (continued)
iii. Notes to reconciliation
A. Impairment
B. Employee benefits
C. Hedge accounting
DR. REDDY’S LABORATORIES LIMITED AND SUBSIDIARIES NOTES TO UNAUDITED CONDENSED CONSOLIDATED INTERIM FINANCIAL STATEMENTS
(in millions, except share and per share data)
Derivatives Implementation Group (“DIG”) Issue G20. Under IFRS, in the absence of any specific guidance that permits entities to adopt a terminal value approach for such relationships, hedge effectiveness is measured on the basis of intrinsic value and time value changes are excluded from these qualifying hedge relationships. Accordingly, for certain hedging relationships, which were accounted as a cash flow hedge under Previous GAAP, the requirement of hedge accounting for the risk previously designated as the hedged risk are no longer met. Accordingly, under IFRS the fair value changes on certain options contracts are recognized in the income statement as compared to being recognized in equity under Previous GAAP.
The aforesaid differences have resulted in a decrease of profit under IFRS by Rs.25 for the year ended March 31, 2008.
Indian tax regulations require the Company to pay a Fringe Benefit Tax upon the exercise of employee stock options. Under Previous GAAP, Fringe Benefit Tax is accrued upon exercise of stock options. Under IFRS, such Fringe Benefit Tax, if not recovered from employees, is accrued over the vesting period of the stock options. In the event the Company decides to recover the related Fringe Benefit Tax from the employees exercising such options, a reimbursement asset is recognized in the same period which offsets the accrual for Fringe Benefit Tax.
The aforesaid differences have resulted in a decrease in equity under IFRS by Rs.59 and Rs.53 as of December 31, 2007 and March 31, 2008, respectively and a increase of profit under IFRS by Rs.10 for the three months ended December 31, 2007 and decrease of profit under IFRS by Rs.59 and Rs.53 for the nine months ended December 31, 2007 and the year ended March 31, 2008, respectively.
Intra-group transactions are eliminated upon consolidation. Under Previous GAAP, income taxes paid by the seller on intra-group profits in respect of assets that remain within the consolidated group, including the tax effect of any reversing temporary differences in the seller’s tax jurisdiction, are deferred. The amount is recognized in other assets or liabilities in the balance sheet until such time as the asset leaves the consolidated group, at which point the amount is reclassified to income tax expense. Under IFRS, any related deferred tax effects are measured based upon the tax rate of the purchaser. However, the tax effects are not eliminated unless the transacting entities are subject to the same tax rate.
Furthermore, the income tax expense recognized in each interim period under Previous GAAP is based on the best estimate of the weighted average effective income tax rate expected for the annual reporting period applied to the pre-tax income of the interim period. Under Previous GAAP, a consolidated Annual Effective Tax Rate is arrived at based upon projected tax expense and profit before taxes for each of the tax jurisdictions and then such consolidated Annual Effective Tax Rate is applied to consolidated profits for the quarter. Under IFRS, if different income tax rates apply to different tax jurisdictions, income tax expense is computed by applying the projected Annual Effective Tax Rate for each of the jurisdictions on the pre-tax income of the interim period for each of such jurisdictions respectively.
The above differences in IFRS as compared to Previous GAAP, along with the tax impact of the adjustments as discussed above, have resulted in an increase in equity by Rs.454, Rs.310 and Rs.170 as of April 1, 2007, December 31, 2007 and March 31, 2008, respectively, an increase in profit by Rs.144 for the three months ended December 31, 2008, and a decrease in profit by Rs.146 and Rs.257 for the nine months ended December 31, 2007 and the year ended March 31, 2008, respectively.
Under IFRS, minority interest is reported as a separate item within equity. Previous GAAP requires minority interest to be presented separately from equity. Under IFRS, the minority’s share of net income is presented as an allocation
27
4. Explanation of transition to IFRS (continued)
c. Reconciliation (continued)
D. Fringe benefit tax on employee share based payments
E. Tax adjustments
F. Change in presentation of minority interest
DR. REDDY’S LABORATORIES LIMITED AND SUBSIDIARIES NOTES TO UNAUDITED CONDENSED CONSOLIDATED INTERIM FINANCIAL STATEMENTS
(in millions, except share and per share data)
of net income, whereas, under Previous GAAP, the minority’s share of net income is considered in determining net income.
The aforesaid differences have resulted in an increase of equity under IFRS by Rs.10 as of April 1, 2007 and a decrease of profit under IFRS by Rs.6, Rs.10 and Rs.10 for the three months ended December 31, 2007, the nine months ended December 31, 2007 and the year ended March 31, 2008, respectively.
Unlike Previous GAAP, under IFRS while bank overdrafts are disclosed as part of borrowings in the balance sheet, the same are reduced from cash and cash equivalents in preparation of the cash flows if they are repayable on demand and form an integral part of the Company’s cash management. There were bank overdrafts of Rs.526 as at April 1, 2007, Rs.194 as at December 31, 2007 and Rs.435 as at March 31, 2008 that were repayable on demand and which formed an integral part of the Company’s cash management and were not considered as a reduction in cash and cash equivalents. Accordingly, the movement in such balances was classified as financing cash flows under Previous GAAP. These have now been reclassified under cash and cash equivalents under IFRS for the preparation of cash flow statements.
In addition, restricted cash of Rs.606 as at April 1, 2007, Rs.23 as at December 31, 2007 and Rs.23 as at March 31, 2008 was not considered as cash and cash equivalents for the preparation of cash flow statements. Accordingly, movement in such balances was classified as investing cash flows under Previous GAAP. These have now been reclassified as cash and cash equivalents under IFRS.
Furthermore, interest paid of Rs.824 and interest received of Rs.576 for the nine months ended December 31, 2007 was classified as operating cash flows under Previous GAAP and has been reclassified as financing and investing cash flows, respectively, under IFRS. There were no other material differences between the cash flow statement presented under IFRS and the cash flow statement presented under Previous GAAP.
The Chief Operating Decision Maker (“CODM”) evaluates the Company’s performance and allocates resources based on an analysis of various performance indicators by operating segments. The operating segments reviewed by the CODM are as follows:
Pharmaceutical Services and Active Ingredients. This segment includes active pharmaceutical ingredients and intermediaries, also known as active pharmaceutical products or bulk drugs, which are the principal ingredients for finished pharmaceutical products. Active pharmaceutical ingredients and intermediaries become finished pharmaceutical products when the dosages are fixed in a form ready for human consumption such as a tablet, capsule or liquid using additional inactive ingredients. This segment also includes contract research services and the manufacture and sale of active pharmaceutical ingredients and steroids in accordance with the specific customer requirements. Thus, this segment was formed by aggregating our former Active pharmaceutical ingredients and intermediates segment and Custom pharmaceutical services segment.
Global Generics. This segment consists of finished pharmaceutical products ready for consumption by the patient, marketed under a brand name (branded formulations) or as generic finished dosages with therapeutic equivalence to branded formulations (generics). The Company is transitioning to a new organization structure for this segment. While the resource allocation is done by the CODM at the global generics level, certain additional information
28
4. Explanation of transition to IFRS (continued)
c. Reconciliation (continued)
iv. Explanation of material adjustments to the cash flow statement
5. Segment reporting
� Pharmaceutical Services and Active Ingredients (“PSAI”);
� Global Generics; and
� Proprietary Products.
DR. REDDY’S LABORATORIES LIMITED AND SUBSIDIARIES NOTES TO UNAUDITED CONDENSED CONSOLIDATED INTERIM FINANCIAL STATEMENTS
(in millions, except share and per share data)
(revenue and gross profit) with respect to the Company’s formulations and generics business continues to be reviewed by the CODM. Accordingly, such further detailed information has been included in this segment’s disclosure.
Proprietary Products. This segment involves the discovery of new chemical entities for subsequent commercialization and out-licensing. It also involves the Company’s specialty pharmaceuticals business which is positioning to launch sales and marketing operations for in-licensed and co-developed dermatology products.
The CODM reviews gross profit as the performance indicator for all three of the above segments. The Company does not review the total assets and liabilities for each segment. The property, plant and equipment used in the Company’s business, and the related depreciation and amortization expenses, are not fully identifiable with or allocable to individual reportable segments, as certain assets are used interchangeably between segments. The other assets are not specifically allocable to the segments. Consequently, management believes that it is not practicable to provide segment disclosures relating to total assets and liabilities since allocation among the various segments is not possible.
29
5. Segment reporting (continued)
DR. REDDY’S LABORATORIES LIMITED AND SUBSIDIARIES NOTES TO UNAUDITED CONDENSED CONSOLIDATED INTERIM FINANCIAL STATEMENTS
(in millions, except share and per share data)
Note 1: Segment revenue for the nine months ended December 31, 2008 does not include inter-segment revenues from PSAI to Global Generics which is accounted for at a cost of Rs.1,841 (as compared to Rs.2,159 for the nine months ended December 31, 2007) and inter-segment revenues from Global Generics to PSAI which is accounted for at cost of Rs.4 (as compared to Rs.35 for the nine months ended December 31, 2007).
Note 2: Segment revenue for the nine months ended December 31, 2008 does not include inter-segment revenues from Formulations to PSAI which is accounted for at a cost of Rs.4 (as compared to Rs.35 for the nine months ended December 31, 2007).
30
5. Segment reporting (continued) Information about segments: For the nine months ended December 31, Segments PSAI Global Generics** Proprietary Products Others Total 2008 2007 2008 2007 2008 2007 2008 2007 2008 2007
DR. REDDY’S LABORATORIES LIMITED AND SUBSIDIARIES NOTES TO UNAUDITED CONDENSED CONSOLIDATED INTERIM FINANCIAL STATEMENTS
(in millions, except share and per share data)
Note 3: Segment revenue for the three months ended December 31, 2008 does not include inter-segment revenues from PSAI to Global Generics which is accounted for at a cost of Rs.591 (as compared to Rs.963 for the three months ended December 31, 2007) and inter-segment revenues from Global Generics to PSAI which is accounted for at a cost of Rs.0 (as compared to Rs.13 for the three months ended December 31, 2007).
Note 4: Segment revenue for the three months ended December 31, 2008 does not include inter-segment revenues from Formulations to PSAI which is accounted for at a cost of Rs.0 (as compared to Rs.13 for the three months ended December 31, 2007).
31
5. Segment reporting (continued) Information about segment For the three months ended December 31, Segments PSAI Global Generics** Proprietary Products Others Total 2008 2007 2008 2007 2008 2007 2008 2007 2008 2007
DR. REDDY’S LABORATORIES LIMITED AND SUBSIDIARIES NOTES TO UNAUDITED CONDENSED CONSOLIDATED INTERIM FINANCIAL STATEMENTS
(in millions, except share and per share data)
32
6. Business combinations and other acquisitions
a. Acquisition of a unit of The Dow Chemical Company
On April 28, 2008, the Company, through its wholly owned subsidiary Dr. Reddy’s Laboratories (EU) Limited (“DRL EU”), acquired a unit of The Dow Chemical Company associated with its United Kingdom sites in Mirfield and Cambridge for a total cash consideration of Rs.1,302 (U.S.$32). The acquisition includes customer contracts, associated products, process technology, intellectual property, trademarks and the Dowpharma Small Molecules facilities located in Mirfield and Cambridge, United Kingdom. The Company also took over the existing work force as a part of the acquisition. The acquisition complements technology and experience synergies to the existing custom pharmaceutical business and gives access to a research and development team.
The Company has accounted for the acquisition under the purchase method in accordance with IFRS No. 3, “Business Combinations”. Accordingly, the financial results of the aforesaid acquired business for the period from April 29, 2008 through December 31, 2008 have been included in the unaudited condensed consolidated interim financial statements of the Company.
The following table summarizes the estimated fair values of the assets acquired and liabilities assumed at the date of acquisition: Recognized values on Particulars acquisition
Property, plant and equipment Rs. 741Intangible assets 801Inventories 231Non current assets 45Non current liabilities (116)Deferred tax liabilities, net (250)
Net identifiable assets and liabilities Rs. 1,452Negative goodwill on acquisition recognized in profit and loss account (150)
Consideration paid in cash* Rs 1,302
* Total consideration paid includes direct attributable costs of Rs.13.
As the acquisition involved a combination of a purchase of a unit of an existing entity and a purchase of certain identifiable assets, the carrying value of assets and liabilities before acquisition could not be determined in accordance with IFRS.
The estimated useful lives of intangibles acquired are as follows: Customer related intangibles 4-11 yearsProduct related intangibles 6-13 years
The negative goodwill on acquisition is attributable mainly to lower amounts paid towards inventories and intangible assets in the acquired business. The acquired business contributed revenues of Rs.223 and profit of Rs.40 for the three months ended December 31, 2008 and revenue of Rs.679 and, including negative goodwill, a profit of Rs.138 for the period from April 29, 2008 to December 31, 2008.
DR. REDDY’S LABORATORIES LIMITED AND SUBSIDIARIES NOTES TO UNAUDITED CONDENSED CONSOLIDATED INTERIM FINANCIAL STATEMENTS
(in millions, except share and per share data)
33
6. Business combinations and other acquisitions (continued)
b. Acquisition of BASF Corporation’s manufacturing facility in Shreveport, Louisiana, U.S.A. and related pharmaceutical contract manufacturing business.
On April 30, 2008, the Company acquired BASF Corporation’s pharmaceutical contract manufacturing business and its manufacturing facility in Shreveport, Louisiana, U.S.A. for a total consideration of Rs.1,639 (U.S.$40). The business involves contract manufacturing of generic prescription and OTC products for branded and generic companies in the United States. This acquired business includes customer contracts, related ANDAs and NDAs, and trademarks, as well as the Shreveport manufacturing facility. The Company also took over the existing work force as a part of the acquisition.
The Company has accounted for the acquisition under the purchase method in accordance with IFRS No. 3, “Business Combinations”. Accordingly, the financial results of the aforesaid acquired business for the period from May 1, 2008 through December 31, 2008 have been included in the unaudited condensed consolidated interim financial statements of the Company.
The following table summarizes the estimated fair values of the assets acquired and liabilities assumed at the date of acquisition. Recognized values on Particulars acquisition
Property, plant and equipment Rs. 756Intangible assets 482Inventories 248
Net identifiable assets and liabilities Rs. 1,486Goodwill on acquisition 153
Consideration paid, satisfied in cash* Rs. 1,639
* Total consideration paid includes direct attributable costs of Rs.31.
As the acquisition involved purchase of a unit of an existing entity with certain identifiable assets and liabilities, the carrying value of assets and liabilities before acquisition could not be determined in accordance with IFRS.
The estimated useful lives of intangibles acquired are as follows: Customer related intangibles Product related intangibles
4-9 years9-10 years
Goodwill amounts to Rs.153 and is attributable mainly to the employee workforce acquired and the estimated values to be derived from the synergies for the Company due to cost savings. The acquired business contributed revenues of Rs.409 and net loss of Rs.103 for the three months ended December 31, 2008 and revenue of Rs.1,150 and net loss of Rs.196 for the period from May 1, 2008 to December 31, 2008.
c. Acquisition of Jet Generici SRL
On April 30, 2008, the Company acquired Jet Generici Srl, a company engaged in the sale of generic finished dosages in Italy for a total cash consideration of Rs.148 (Euro 2.34 million). The transaction was accounted as an acquisition of business under the purchase method in accordance with IFRS 3. The transaction resulted in the Company gaining an entry in the Italian market and resulted in goodwill of Rs.162.
DR. REDDY’S LABORATORIES LIMITED AND SUBSIDIARIES NOTES TO UNAUDITED CONDENSED CONSOLIDATED INTERIM FINANCIAL STATEMENTS
(in millions, except share and per share data)
34
6. Business combination and other acquisitions (continued)
d. Pro-forma information
If the above acquisitions had taken effect at the beginning of the reporting period (i.e., April 1, 2007), on a pro-forma basis the revenue, profit before tax and profit after tax of the Company for the applicable periods on a pro-forma basis would have been as below: Nine months ended December 31, 2008 2007 Revenue Rs.49,735 Rs.38,860Profit before tax 5,474 1,852Profit after tax 4,571 3,091
e. Acquisition of entire equity holding of Perlecan Pharma Private Limited
In September 2005, the Company announced the formation of an integrated drug development company, Perlecan Pharma Private Limited (“Perlecan Pharma”), as a joint venture with Citigroup Venture Capital International Growth Partnership Mauritius Limited (“Citigroup Venture”) and ICICI Venture Funds Management Company (“ICICI Venture”). Perlecan Pharma is engaged in the clinical development and out-licensing of New Chemical Entity (“NCE”) assets. Under the terms of the joint venture agreement, Citigroup Venture and ICICI Venture each committed to contribute Rs.1,004 (U.S.$23) and the Company committed to contribute Rs.340 (U.S.$8) towards equity in Perlecan Pharma. The arrangement to form Perlecan Pharma was effective from March 27, 2006 (before the date of transition to IFRS), at which time certain terms of the joint venture agreement were amended.
As of March 31, 2006, the Company owned approximately 14.28% of the equity of Perlecan Pharma. In addition, Perlecan Pharma issued warrants to the Company to purchase 45 million equity shares of Perlecan Pharma, at an exercise price of Rs.1.00 per equity share, the exercise of which was contingent upon the success of certain research and development milestones achieved by Perlecan Pharma. Upon full exercise of the warrants, the Company would own approximately 62.5% of the equity of Perlecan Pharma. Furthermore, three out of seven directors on the Board of Directors of Perlecan Pharma were designated by the Company. As per the terms of the joint venture agreement, the Company had the first right to conduct product development and clinical trials on behalf of Perlecan Pharma on an arms length basis subject to the final decision by the board of directors of Perlecan Pharma. Considering these factors the Company has accounted for its investment in Perlecan Pharma in accordance with IAS 28, “Investments in Associates”.
As of March 31, 2006, the Company and the other two investors had invested Rs.101 (U.S.$2) and Rs. 605 (U.S.$14), respectively in Perlecan Pharma. The Company was also committed to invest an additional amount of Rs.239 (U.S.$5) as its proportionate equity contribution in the future. As per the terms of the amended agreement, the Company would be reimbursed by Perlecan Pharma for research and development costs of Rs.231 that were incurred by the Company prior to the effective date of the joint venture arrangement. The reimbursement for research and development costs incurred by the Company prior to the effective date of the joint venture arrangement was reduced from the carrying value of the equity investment in Perlecan Pharma as of March 31, 2006. Therefore, the equity investment was carried at Rs.0 and the remaining balance of the Company’s commitment to make additional equity investments in Perlecan Pharma was Rs.170, recognized as ‘other liability’ as of March 31, 2006.
During the year ended March 31, 2007, the Company and the other two investors invested additional amounts of Rs.69 and Rs.413, respectively, in Perlecan Pharma. As a result, as of March 31, 2007, the Company’s ownership of Perlecan Pharma increased to approximately 14.31%. As of March 31, 2008, the carrying value of Company’s investment in Perlecan Pharma was Rs.0, the other liability balance was Rs.180 and the Company was committed to make additional equity investments of Rs.170. The Company continued to reflect its equity in losses of Perlecan Pharma taking into account its future funding commitments.
On July 30, 2008, the Company acquired the entire equity holding of Citigroup Venture and ICICI Venture in Perlecan Pharma for a total consideration of Rs.758. Consequently, Perlecan Pharma has become a consolidated subsidiary of the Company. The Company has evaluated the acquisition in accordance with IFRS 3 on Business Combinations and believes that the acquired set of assets does not qualify to be a business and
DR. REDDY’S LABORATORIES LIMITED AND SUBSIDIARIES NOTES TO UNAUDITED CONDENSED CONSOLIDATED INTERIM FINANCIAL STATEMENTS
(in millions, except share and per share data)
35
6. Business combination and other acquisitions (continued)
e. Acquisition of entire equity holding of Perlecan Pharma Private Limited (continued)
therefore has accounted for this as an asset acquisition.
Accordingly, the purchase price has been allocated to the following assets: Recognized values on Particulars acquisition
Current assets, net Rs. 408 Intangible assets 82Deferred tax asset 268
Total consideration paid Rs. 758
As a result of the acquisition, other liability of Rs.180, representing the deferred credit at the time of the initial joint venture arrangement, was recognized in the income statement as a credit to research and development expenses in the nine months ended December 31, 2008.
7. Financial instruments
Hedging of fluctuations in foreign currency
The Company is exposed to exchange rate risk which arises from its foreign exchange revenues, primarily in U.S. Dollars, British Pounds and Euros and foreign currency debt in U.S. Dollars and Euros.
The Company uses forward exchange contracts and option contracts (derivatives) to mitigate its risk of changes in foreign currency exchange rates. Most of the forward exchange contracts/option contracts have maturities of less than one year after the balance sheet date. Where necessary, the forward exchange contracts are rolled over at maturity.
Forecasted transactions
The Company classifies its option contracts hedging forecasted transactions as cash flow hedges and measures them at fair value. The fair value of option contracts used as hedges of forecasted transactions at December 31, 2008 was a liability of Rs.797 (as compared to a liability of Rs.10 at March 31, 2008), that were recognized as derivatives measured at fair value.
Recognized assets and liabilities
Changes in the fair value of forward exchange contracts that economically hedge monetary assets and liabilities in foreign currencies and for which no hedge accounting is applied are recognized in profit or loss. Both the changes in fair value of the forward contracts and the foreign exchange gains and losses relating to the monetary items are recognized as part of “net financing costs”. The fair value of forward exchange contracts and option contracts used as economic hedges of monetary assets and liabilities in foreign currencies recognized in fair value derivatives was an asset of Rs.194 at December 31, 2008 (as compared to a liability of Rs.86 at March 31, 2008).
Fair values
The carrying amount and fair value of financial instruments at December 31, 2008 is a net liability of Rs.17,453 (as compared to a net liability of Rs.10,648 at March 31, 2008).
8. Income taxes
Current tax
Current tax expense for the interim periods is calculated based on the estimated average annual income tax applied on
DR. REDDY’S LABORATORIES LIMITED AND SUBSIDIARIES NOTES TO UNAUDITED CONDENSED CONSOLIDATED INTERIM FINANCIAL STATEMENTS
(in millions, except share and per share data)
36
8. Income taxes (continued)
the pre tax income of the interim period. Current tax for current and prior periods is classified as current liability to the extent that it is unpaid. Amounts paid in excess of amounts owed are classified as a current asset.
Deferred tax
The amount of deferred tax provided is based on the expected movements of realization or settlement of the carrying amount of assets and liabilities, using the effective tax rate of the interim periods presented.
The primary components of the Company’s recognized deferred tax asset includes temporary differences related to expenses deferred for the tax purposes, operating and capital losses carried forward, provisions, impairment loss on receivables, impairment loss on investment and minimum alternate tax carry forward. The primary components of the entity’s deferred tax liabilities include temporary differences related to property, plant, equipment and intangible assets.
Deferred tax expenses or benefits arise from the origination and reversal of temporary differences, the effect of change in tax rates and the benefit of tax losses recognized.
Current tax and deferred tax recognized in the Company’s income statement is as follows: Nine months ended Three months ended December 31, December 31, 2008 2007 2008 2007
Income tax expense/(benefit). Rs. 933 Rs.(1,301) Rs. 617 Rs. (524)
Total deferred tax recognized directly in the equity was a benefit of Rs.149 for the nine months ended December 31, 2008 (as compared to an benefit of Rs.32 for the nine months ended December 31, 2007).
Reconciliation of effective tax rate
The reported current and deferred tax expense for the nine months ended December 31, 2008 was calculated based on an estimated average annual income tax rate of 16.84% (as compared to an estimated average annual net income tax rate of negative 80.81% for the nine months ended December 31, 2007). The difference between the estimated average annual effective income tax rate and the enacted tax rate is accounted for by a number of factors, including the effects of changes in tax laws and rates, the effects of differences between Indian and foreign tax rates, expenses not deductible for tax purposes and income exempted from income taxes. During the nine months ended December 31, 2007, pursuant to changes in German tax laws, the enacted tax rated decreased by approximately 10%. This resulted in a reduction in the net deferred tax liability balance of betapharm by Rs.1,459, which was recorded as a deferred tax benefit in the Company’s income statement during the nine months ended December 31, 2007.
9. Property, plant and equipment
Acquisitions and disposals
During the nine months ended December 31, 2008, the Company acquired assets at an aggregate cost of Rs.5,638 (as compared to assets with a cost of Rs.6,231 for the year ended March 31, 2008) including assets acquired through business combinations of Rs.1,496 (no assets were acquired through business combinations for the year ended March 31, 2008). Assets with a net book value of Rs.13 were disposed of during the nine months ended December 31, 2008 (as compared to assets with a net book value of Rs.63 for the year ended March 31, 2008:), resulting in a gain on disposal of Rs.13 (as compared to a
DR. REDDY’S LABORATORIES LIMITED AND SUBSIDIARIES NOTES TO UNAUDITED CONDENSED CONSOLIDATED INTERIM FINANCIAL STATEMENTS
(in millions, except share and per share data)
37
9. Property, plant and equipment (continued)
loss on disposal of Rs.8 for the year ended March 31, 2008). Depreciation expenses for the three months and nine months ended December 31, 2008 was Rs.576 and Rs.1,658, respectively (as compared to Rs.443 and Rs.1,246 for three and nine months ended December 31, 2007, respectively).
Capital Commitments
As of March 31, 2008 and December 31, 2008, the Company was committed to spend approximately Rs.1,552 and Rs.1,301, respectively, under agreements to purchase property, plant and equipment. This amount is net of capital advances paid in respect of such purchases.
10. Goodwill
Goodwill arising upon acquisitions is not amortized but tested for impairment annually or more frequently if there are certain internal or external indicators.
The following table presents the changes in goodwill during the nine months ended December 31, 2008 and the year ended March 31, 2008: Nine months ended Year ended December 31, 2008 March 31, 2008
Opening balance (1) Rs. 17,179 Rs. 15,948Goodwill arising on purchase business combination 316 —Impairment of goodwill (2) — (90)Effect of translation adjustments 1,259 1,320
Closing balance (1) Rs. 18,754 Rs. 17,178
(1) Includes goodwill arising upon investment in affiliate of Rs.181.
(2) The impairment of goodwill of Rs.90 relates to the Company’s proprietary products segment.
Also see Note 22.
11. Other intangible assets
Acquisitions and Write-down of intangibles
During the nine months ended December 31, 2008, the Company acquired other intangible assets at an aggregate cost of Rs.1,637 (as compared to assets with a cost of Rs.211 for the year ended March 31, 2008), including assets acquired through business combinations of Rs.1,312 (no assets were acquired through business combinations for the year ended March 31, 2008). Amortization expenses for the three months and nine months ended December 31, 2008 was Rs.339 and Rs.1,188, respectively (as compared to Rs.375 and Rs.1,127 for the three months and nine months ended December 31, 2007, respectively).
During the nine months ended December 31, 2007, the Company tested the carrying value of betapharm related intangibles for impairment. This testing was triggered by certain adverse market conditions, such as decreases in market prices and an increasing trend in certain new types of rebates being negotiated with State Healthcare Insurance Fund (“SHI”) companies and certain supply constraints. As a result of this review, the Company recorded a write-down of intangible assets of Rs.2,883 and adjusted the net carrying value of certain product related intangibles as of December 31, 2007.
Furthermore, during the year ended March 31, 2008, the Company also tested the carrying value of Litaphar related intangibles for impairment. This testing was triggered by certain adverse market conditions, such as decreases in
DR. REDDY’S LABORATORIES LIMITED AND SUBSIDIARIES NOTES TO UNAUDITED CONDENSED CONSOLIDATED INTERIM FINANCIAL STATEMENTS
(in millions, except share and per share data)
38
11. Other intangible assets (continued)
sales and increases in costs of procurement. The fair values of these intangibles were determined based on discounted cash flow approach. As a result of this review, the Company recorded a write-down of intangible assets of Rs.127 and adjusted the carrying value of product related intangibles as of March 31, 2008.
Also see Note 22.
12. Inventories
Inventories consist of the following: As of December 31, 2008 March 31, 2008
Raw materials Rs. 4,676 Rs. 3,226Packing material, stores and spares 982 773Work-in-process 2,945 2,346Finished goods 6,554 4,788
Rs. 15,157 Rs. 11,133
During the three months and nine months ended December 31, 2008 and 2007, the Company recorded an inventory write-down of Rs.56, Rs.129, Rs.150 and Rs.313, respectively, resulting from a decline in the net realizable value of certain finished goods and write downs of certain raw materials. These amounts are included in the cost of revenues.
13. Cash and cash equivalents
Cash and cash equivalents consist of the following: As of December 31, 2008 March 31, 2008
Cash balances Rs. 162 Rs. 163Balances with banks 3,622 7,258
Cash and cash equivalents on the balance sheet 3,784 7,421Bank overdrafts used for cash management purposes (1,101) (435)
Cash and cash equivalents in the cash flow statement Rs. 2,683 Rs. 6,986
14. Other (income)/expense, net
Other (income)/expense, net consists of the following: Nine months ended Three months ended December 31, December 31, 2008 2007 2008 2007
(Profit)/loss on sale of property, plant and equipment, net Rs. (13) — — (1)Sale of spent chemical (174) (134) (45) (60)Negative goodwill on acquisitions of business (150) — — —Miscellaneous income (199) (160) (75) (55)Provision for expected claim from innovator (see Note 21) 969 224Other expenses 6 41 6 15
Rs. 439 Rs.(253) Rs.110 Rs.(101)
DR. REDDY’S LABORATORIES LIMITED AND SUBSIDIARIES NOTES TO UNAUDITED CONDENSED CONSOLIDATED INTERIM FINANCIAL STATEMENTS
(in millions, except share and per share data)
39
15. Finance income, net
Finance (income)/expense, net consists of the following: Nine months ended Three months ended December 31, December 31, 2008 2007 2008 2007
Interest income Rs. (196) Rs.(625) Rs. (77) Rs.(146)Foreign exchange (gain)/loss, net 613 (645) 493 (87)Profit on sale of investments, net (126) (40) (9) (24)Interest expense 812 828 292 234
Rs.1,103 Rs.(482) Rs.699 Rs. (23)
16. Earnings per share
Basic earnings per share
The calculation of basic earnings per share for the nine months ended December 31, 2008 was based on the profit attributable to equity shareholders of Rs.4,609 (as compared to Rs.2,921 for the nine months ended December 31, 2007) and a weighted average number of equity shares outstanding during the nine months ended December 31, 2008 and nine months ended December 31, 2007 calculated as follows: Nine months ended December 31, 2008 2007
Issued equity shares as of April 1 168,172,746 167,912,180Effect of shares issued on excise of stock options 146,898 138,510 Weighted average number of equity shares at December 31 168,319,644 168,050,690
The calculation of basic earnings per share for the three months ended December 31, 2008 was based on the profit attributable to equity shareholders of Rs.2,445 (as compared to a loss attributable to equity shareholders of Rs.1,207 for the three months ended December 31, 2007) and a weighted average number of equity shares outstanding during the three months ended December 31, 2008 and three months ended December 31, 2007 calculated as follows: Three months ended December 31, 2008 2007
Issued equity shares as of October 1 168,400,728 168,097,442Effect of shares issued on exercise of stock options 8,122 33,191Weighted average number of equity shares at December 31 168,408,850 168,130,633
DR. REDDY’S LABORATORIES LIMITED AND SUBSIDIARIES NOTES TO UNAUDITED CONDENSED CONSOLIDATED INTERIM FINANCIAL STATEMENTS
(in millions, except share and per share data)
40
16. Earnings per share (continued)
Diluted earnings per share
The calculations of diluted earnings per share for the nine months ended December 31, 2008 was based on the profit attributable for equity shareholders of Rs.4,609 (as compared to Rs.2,921 for the nine months ended December 31, 2007) and a weighted average number of equity shares outstanding during nine months ended December 31, 2008 and nine months ended December 31, 2007 calculated as follows: Nine months ended December 31, 2008 2007
Weighted average number of equity shares as of December 31 (Basic) 168,319,644 168,050,690Effect of stock options outstanding 683,177 635,294Weighted average number of equity shares as of December 31 (Diluted) 169,002,821 168,685,984
The calculations of diluted earnings per share for the three months ended December 31, 2008 was based on the profit attributable for equity shareholders of Rs.2,445 (as compared to a loss attributable to equity shareholders of Rs.1,207 for the three months ended December 31, 2007) and weighted average number of equity shares outstanding during three months ended December 31, 2008 and three months ended December 31, 2007 calculated as follows: Three months ended December 31, 2008 2007
Weighted average number of equity shares as of December 31 (Basic) 168,408,850 168,130,633Effect of stock options outstanding 372,947 556,554Weighted average number of equity shares as of December 31 (Diluted) 168,781,797 168,687,187
17. Employee stock incentive plans
Dr. Reddy’s Employees Stock Option Plan 2002 (the “DRL 2002 Plan”):
The Company instituted the DRL 2002 Plan for all eligible employees pursuant to the special resolution approved by the shareholders in the Annual General Meeting held on September 24, 2001. The DRL 2002 Plan covers all employees of DRL and its subsidiaries and directors (excluding promoter directors) of DRL and its subsidiaries (collectively, “eligible employees”). The compensation committee of the Board of DRL (the “Compensation Committee”) administers the DRL 2002 Plan and grants stock options to eligible employees. The Compensation Committee determines which eligible employees will receive options, the number of options to be granted, the exercise price, the vesting period and the exercise period. The vesting period is determined for all options issued on the date of grant. The options issued under the DRL 2002 Plan vest in periods ranging between one and four years, and generally have a maximum contractual term of five years.
The DRL 2002 Plan was amended on July 28, 2004 at the annual general meeting of shareholders to provide for stock option grants in two categories:
Category A: 1,721,700 stock options out of the total of 2,295,478 options reserved for grant having an exercise price equal to the fair market value of the underlying equity shares on the date of grant; and
Category B: 573,778 stock options out of the total of 2,295,478 options reserved for grant having an exercise price equal to the par value of the underlying equity shares (i.e., Rs.5 per option).
The DRL 2002 Plan was further amended on July 27, 2005 at the annual general meeting of shareholders to provide for stock option grants in two categories:
Category A: 300,000 stock options out of the total of 2,295,478 options reserved for grant having an exercise price equal to the fair market value of the underlying equity shares on the date of grant; and
DR. REDDY’S LABORATORIES LIMITED AND SUBSIDIARIES NOTES TO UNAUDITED CONDENSED CONSOLIDATED INTERIM FINANCIAL STATEMENTS
(in millions, except share and per share data)
41
17. Employee stock incentive plans (continued)
Category B: 1,995,478 stock options out of the total of 2,295,478 options reserved for grant having an exercise price equal to the par value of the underlying equity shares (i.e., Rs.5 per option).
Under the DRL 2002 Plan, the exercise price of the fair market value options granted under Category A above is determined based on the average closing price for 30 days prior to the grant in the stock exchange where there is highest trading volume during that period. Notwithstanding the foregoing, the Compensation Committee may, after obtaining the approval of the shareholders in the annual general meeting, grant options with a per share exercise price other than fair market value and par value of the equity shares.
After the stock split effected in the form of stock dividend issued by the Company in August 2006, the DRL 2002 Plan provides for stock options granted in the above two categories as follows: Number of Number of Options granted Options granted Under category Under category Total Particulars A B Options reserved under original Plan 300,000 1,995,478 2,295,478Options exercised prior to stock dividend date (A) 94,061 147,793 241,854Balance of shares that can be allotted exercise of options (B) 205,939 1,847,685 2,053,624Options arising from stock dividend (C) 205,939 1,847,685 2,053,624Options reserved after stock dividend (A+B+C) 505,939 3,843,163 4,349,102
In April 2007, certain employees surrendered their category B par value options under the DRL 2002 Plan in exchange for category B par value options under the DRL 2007 Plan (discussed below). The incremental cost due to such modifications was insignificant.
The Compensation Committee at its meeting held in October 2007, proposed that the Company should absorb the full liability of the Fringe Benefit Tax upon exercise of all stock options granted on or prior to the date of its resolution. In respect of new grants to be made by the Company subsequent to the date of such resolution, the Fringe Benefit Tax will be recovered from employees upon the exercise of their stock options. The above amendment was approved by the shareholders at the Annual General Meeting held on July 22, 2008.
Dr. Reddy’s Employees ADR Stock Option Plan 2007 (the “DRL 2007 Plan”):
The Company instituted the DRL 2007 Plan for all eligible employees in pursuance of the special resolution approved by the shareholders in the Annual General Meeting held on July 27, 2005. The DRL 2007 Plan became effective upon its approval by the Board of Directors on January 22, 2007. The DRL 2007 Plan covers all employees of DRL and its subsidiaries and directors (excluding promoter directors) of DRL and its subsidiaries (collectively, “eligible employees”). The Compensation Committee administers the DRL 2007 Plan and grants stock options to eligible employees. The Compensation Committee determines which eligible employees will receive options, the number of options to be granted, the exercise price, the vesting period and the exercise period. The vesting period is determined for all options issued on the date of grant. The options issued under DRL 2007 plan vest in periods ranging between one and four years, and generally have a maximum contractual term of five years.
The DRL 2007 Plan provides for option grants in two categories:
Category A: 382,695 stock options out of the total of 1,530,779 stock options reserved for grant having an exercise price equal to the fair market value of the underlying equity shares on the date of grant; and
Category B: 1,148,084 stock options out of the total of 1,530,779 stock options reserved for grant having an exercise price equal to the par value of the underlying equity shares (i.e. Rs.5 per option).
DR. REDDY’S LABORATORIES LIMITED AND SUBSIDIARIES NOTES TO UNAUDITED CONDENSED CONSOLIDATED INTERIM FINANCIAL STATEMENTS
(in millions, except share and per share data)
The terms and conditions of the grants made during the nine months ended December 31, 2008 under the above plans are as follows:
42
17. Employee stock incentive plans (continued)
The Compensation Committee at its meeting held in October 2007, proposed that the Company should absorb the full liability of the Fringe Benefit Tax upon exercise of all stock options granted on or prior to the date of its resolution. In respect of new grants to be made by the Company subsequent to the date of its resolution, the Fringe Benefit Tax will be recovered from employees upon the exercise of their stock options. The above amendment was approved by the shareholders at the Annual General Meeting held on July 22, 2008.
Aurigene Discovery Technologies Ltd. Employee Stock Option Plan 2003 (the “Aurigene ESOP Plan”):
Aurigene Discovery Technologies Limited (“Aurigene”), a consolidated subsidiary, adopted the Aurigene ESOP Plan) to provide for issuance of stock options to employees of Aurigene and its subsidiary, Aurigene Discovery Technologies Inc., who have completed one full year of service with Aurigene and its subsidiary. Aurigene has reserved 4,550,000 of its ordinary shares for issuance under this plan. Under the Aurigene ESOP Plan, stock options may be granted at an exercise price as determined by Aurigene’s compensation committee. The options issued under Aurigene ESOP Plan vest in periods ranging from one to three years, including certain options which vest immediately on grant, and generally have a maximum contractual term of three years.
During the year ended March 31, 2008, the Aurigene ESOP Plan was amended to increase the total number of options reserved for issuance to 7,500,000 and to provide for Aurigene’s recovery of the Fringe Benefit Tax from employees upon the exercise of their stock options.
Aurigene Discovery Technologies Ltd. Management Group Stock Grant Plan (the “Aurigene Management Plan”):
In the year ended March 31, 2004, Aurigene adopted the Aurigene Management Plan to provide for issuance of stock options to management employees of Aurigene and its subsidiary Aurigene Discovery Technologies Inc. Aurigene has reserved 2,950,000 of its ordinary shares for issuance under this plan. Under the Aurigene Management Plan, stock options may be granted at an exercise price as determined by Aurigene’s compensation committee. As of March 31, 2008, there were no stock options outstanding under the Aurigene Management Plan. The plan was closed by a resolution of the shareholders in January 2008.
Stock options granted during the three months and nine months ended December 31, 2008:
The terms and conditions of the grants made during the three months ended December 31, 2008 under the above plans are as follows: Number of Exercise Vesting Contractual instruments price period life
DRL 2002 Plan: — Category A 20,000 Rs.448.00 2 to 4 years 5 years — Category B — — — — DRL 2007 Plan: — Category A — — — —— Category B — — — — Aurigene ESOP Plan — — — —
DR. REDDY’S LABORATORIES LIMITED AND SUBSIDIARIES NOTES TO UNAUDITED CONDENSED CONSOLIDATED INTERIM FINANCIAL STATEMENTS
(in millions, except share and per share data)
43
17. Employee stock incentive plans (continued) Number of Exercise Vesting Contractual instruments price period life
DRL 2002 Plan): — Category A 20,000 Rs.448.00 2 to 4 years 5 years— Category B 350,820 Rs. 5.00 1 to 4 years 5 years DRL 2007 Plan: — Category A — — — —— Category B 74,400 Rs. 5.00 1 to 4 years 5 years Aurigene ESOP Plan — — — —
Stock options granted during the three months and nine months ended December 31, 2007:
No options were granted during three months ended December 31, 2007.
The terms and conditions of the grants made during the nine months ended December 31, 2007 under the above plans are as follows: Number of Exercise Vesting Contractual instruments price period life
DRL 2002 Plan: — Category A — — — —— Category B 386,060 Rs. 5.00 1 to 4 years 5 years DRL 2007 Plan: — Category A — — — —— Category B 206,818 Rs.5.00 1 to 4 years 5 years Aurigene ESOP Plan — — — —
The Black-Scholes model inputs used in computing the fair value of the grants made during the nine months ended December 31, 2008 and December 31, 2007 are as follows: Nine months ended Nine months ended December 31, 2008 December 31, 2007
Volatility 28.79% — 41.87% 28.40% — 32.70%Exercise price Rs.5.00 — Rs.448.00 Rs.5.00Expected term 1 to 6.5 years 1 to 4 yearsDiscount rate — Bond equivalent yield rate 6.84% — 7.94% 7.80% — 8.20%Dividend yield rate 0.59% — 0.80 % 0.75%
The fair values of services received in return for share options granted to employees are measured by reference to the fair value of share options granted. The estimate of the fair value of the services received is measured based on the Black- Scholes model.
For the nine months ended December 31, 2008 and 2007 an amount of Rs.180 and Rs.182, respectively, and for the three months ended December 31, 2008 and 2007, an amount of Rs.66 and Rs.74, respectively has been recorded as total employee share based expense under all employee stock incentive plans. As of December 31, 2008, there is approximately Rs.275 of total unrecognized compensation cost related to unvested stock options. This cost is expected to be recognized over a weighted-average period of 2.91 years.
DR. REDDY’S LABORATORIES LIMITED AND SUBSIDIARIES NOTES TO UNAUDITED CONDENSED CONSOLIDATED INTERIM FINANCIAL STATEMENTS
(in millions, except share and per share data)
44
18. Employee benefit plans
Gratuity benefits
In accordance with applicable Indian laws, the Company provides gratuity, a defined benefit retirement plan (the “Gratuity Plan”) covering certain categories of employees. The Gratuity Plan provides a lump sum payment to vested employees at retirement or termination of employment. The amount of payment is based on the respective employee’s last drawn salary and the years of employment with the Company. Effective September 1, 1999, the Company established the Dr. Reddy’s Laboratories Gratuity Fund (the “Gratuity Fund”). Liabilities in respect of the Gratuity Plan are determined by an actuarial valuation, based upon which the Company makes contributions to the Gratuity Fund. Trustees administer the contributions made to the Gratuity Fund. Amounts contributed to the Gratuity Fund are invested in specific securities as mandated by law and generally consist of federal and state government bonds and debt instruments of government-owned corporations.
The components of net periodic benefit cost for the nine months and three months ended December 31, 2008 and 2007 are as follows: Nine months ended Three months ended December 31, December 31, 2008 2007 2008 2007
Service cost 32 26 11 9Interest cost 20 17 7 5Expected return on plan assets (16) (13) (6) (4)
Net amount recognized Rs. 36 Rs. 30 Rs.12 Rs.10
Details of the total employee benefits assets outstanding are provided below: As at December 31, 2008 March 31, 2008 Present value of unfunded obligations Rs. 3 Rs. 3Present value of funded obligations 386 319Fair value of plan assets (322) (289)
Present value of net obligations 67 33Unrecognized actuarial gains and losses (21) (23)
Total employee benefits assets outstanding Rs. 46 Rs. 10
Pension plan
All employees of Industrias Quimicas Falcon de Mexico S.A. de C.V. (“Falcon”) are entitled to a pension plan in the form of a Defined Benefit plan. The pension plan provides a payment to vested employees at retirement or termination of employment. This payment is based on the employee’s integrated salary and is paid in the form of a monthly pension over a period of 20 years computed based upon a predefined formula. Liabilities in respect of the pension plan are determined by an actuarial valuation, based upon which the Company makes contributions to the pension plan fund. This fund is administered by a third party who is provided guidance by a technical committee formed by senior employees of Falcon.
The components of net periodic benefit cost for the nine months and three months ended December 31, 2008 and 2007 are as follows:
DR. REDDY’S LABORATORIES LIMITED AND SUBSIDIARIES NOTES TO UNAUDITED CONDENSED CONSOLIDATED INTERIM FINANCIAL STATEMENTS
(in millions, except share and per share data)
45
18. Employee benefit plans (continued) Nine months ended Three months ended December 31, December 31, 2008 2007 2008 2007
Service cost 11 10 4 3 Interest cost 15 14 4 5Expected return on plan assets (13) (15) (4) (5)Recognized net actuarial (gain)/loss 3 — 1 —
Net amount recognized Rs. 16 Rs. 9 Rs. 5 Rs. 3
Details of the total employee benefits assets outstanding are provided below: As at December 31, 2008 March 31, 2008
Present value of unfunded obligations Rs. 47 Rs. 50Present value of funded obligations 203 203Fair value of plan assets (202) (213)
Present value of net obligations 48 40Unrecognized actuarial gains and losses (53) (61)
Total employee benefits assets outstanding Rs. (5) Rs. (21)
19. Borrowings
Short term loans and borrowings
The Company had lines of credit of Rs.17,550 and Rs.17,659 as of December 31, 2008 and March 31, 2008, respectively, from its bankers for working capital requirements. These lines of credit are renewable annually. The Company has the right to draw upon these lines of credit based on its requirements.
An interest rate profile of borrowings from banks is given below: As at December 31, 2008 March 31, 2008
DR. REDDY’S LABORATORIES LIMITED AND SUBSIDIARIES NOTES TO UNAUDITED CONDENSED CONSOLIDATED INTERIM FINANCIAL STATEMENTS
(in millions, except share and per share data)
46
19. Borrowings (continued)
Long term loans and borrowings
Long term loans and borrowings consists of the following: As at December 31, 2008 March 31, 2008
Rupee term loan Rs. 10 Rs. 13Foreign currency loan 13,978 14,184Obligation under capital lease 308 292
14,296 14,489 Less: Current portion Rupee term loan 7 6Foreign currency loan 3,035 1,773Obligation under capital lease 17 12
3,059 1,791
Non-current portion Rupee term loan 3 7Foreign currency loan 10,943 12,411Obligation under capital lease 291 280
Rs.11,237 Rs.12,698
During the nine months ended December 31, 2008, the Company repaid Rs.1,375 of foreign currency loans (consisting of Euro 20.52 million and U.S.$1.143 million), Rs.3 of rupee term loans and Rs.3 of obligations under capital leases. During the year ended March 31, 2008, the Company repaid Rs.7,733 of foreign currency loans (consisting of Euro 139.49 million and U.S.$0.51 million) and Rs.6 of rupee term loans and assumed net obligations of Rs.21 under capital leases.
An interest rate profile of long-term debt is given below: As of December 31, 2008 March 31, 2008
The fair value of the foreign currency loans and the capital lease obligations approximate their carrying value as of December 31, 2008 and March 31, 2008, respectively.
20. Related parties
The Company has entered into transactions with the following related parties:
• Diana Hotels Limited for availing hotel services;
• A.R. Life Sciences Private Limited for availing processing services of raw materials and intermediates;
• Dr. Reddy’s Holdings Private Limited for the purchase and sale of active pharmaceutical ingredients;
• Dr. Reddy’s Foundation for Human and Social Development towards contributions for social development;
• Institute of Life Science towards contributions for social development;
• K.K Enterprises for availing packaging services for formulation products; and
• SR Enterprises for transportation services.
DR. REDDY’S LABORATORIES LIMITED AND SUBSIDIARIES NOTES TO UNAUDITED CONDENSED CONSOLIDATED INTERIM FINANCIAL STATEMENTS
(in millions, except share and per share data)
The Company has the following amounts due from related parties:
47
20. Related parties (continued)
These are enterprises over which principal shareholders or key managerial personnel have control or significant influence (“significant interest entities”).
The Company has also entered into transactions with its former associate Perlecan Pharma (now a subsidiary) and its joint venture Kunshan Rotam Reddy Pharmaceuticals Co. Limited (“KRRP”). These transactions are in the nature of reimbursement of research and development expenses incurred by the Company on behalf of Perlecan Pharma, revenue from research services performed by the Company for Perlecan Pharma and purchase of active pharmaceutical ingredients by the Company from KRRP.
The Company has also entered into cancellable operating lease transactions with directors and their relatives.
The following is a summary of significant related party transactions: Nine months ended Three months ended December 31, December 31, 2008 2007 2008 2007Purchases from significant interest entities 190 185 43 52Sales to significant interest entities 93 72 27 12 Contribution to a significant interest entity towards social
development 72 56 4 38Revenue from associates — 36 — 10Reimbursement of research and development expenses from
associates — 46 — 16Lease rental paid under cancellable operating leases to key
managerial personnel and their relatives 18 16 7 7 Hotel expenses paid 8 9 3 2Advances taken from significant interest entities 60 — — —
The following table describes the components of managerial remuneration: Nine months ended Three months ended December 31, December 31, Particulars 2008 2007 2008 2007 Salaries Rs. 9 Rs. 9 Rs. 3 Rs. 3 Commission* 129 98 38 12 Other Perquisites 1 1 — —
Total Rs. 139 Rs. 108 Rs. 41 Rs. 15
* Accrued based on profit as of the applicable date in accordance with the terms of employment.
As at December 31, 2008 March 31, 2008Significant interest entities Rs.33 Rs.26Associates — 27 Directors and relatives 4 4
DR. REDDY’S LABORATORIES LIMITED AND SUBSIDIARIES NOTES TO UNAUDITED CONDENSED CONSOLIDATED INTERIM FINANCIAL STATEMENTS
(in millions, except share and per share data)
48
20. Related parties (continued)
The Company has the following amounts due to related parties: As at December 31, 2008 March 31, 2008Significant interest entities Rs.41 Rs.17
The above table as at March 31, 2008 does not include an amount of Rs.680 paid as advance towards purchase of land from a significant interest entity, which has been disclosed under capital work-in-progress.
21. Contingencies
Guarantees
The Company’s equity accounted investee, KRRP, secured a credit facility of Rs.27 million from Agricultural Bank of China (“Agricultural Bank”). During the year ended March 31, 2008, the Company had issued a corporate guarantee of Rs.27 million in favor of Agricultural Bank to enhance the credit standing of KRRP. The guarantee is required to be renewed every year and the Company’s liability may arise in the event of non-payment by KRRP of the amount withdrawn under its credit facility.
Litigations, etc.
The Company is involved in disputes, lawsuits, claims, governmental and/or regulatory inspections, inquiries, investigations and proceedings, including patent and commercial matters that arise from time to time in the ordinary course of business. The more significant matters are discussed below.
Most of the claims involve complex issues. Often, these issues are subject to uncertainties and therefore the probability of a loss, if any, being sustained and an estimate of the amount of any loss are difficult to ascertain. Consequently, for a majority of these claims, it is not possible to make a reasonable estimate of the expected financial effect, if any, that will result from ultimate resolution of the proceedings. In these cases, the Company discloses information with respect to the nature and facts of the case.
With respect to each of the legal proceedings described below, other than those which have been disposed of, we are unable to make estimates of the possible loss or range of possible losses at this stage, other than those where we have provided for the liability. We also do not believe that disclosure of the amount sought by plaintiffs, if that is known, would be meaningful with respect to those legal proceedings. This is due to a number of factors including: the stage of the proceedings (in many cases trial dates have not been set) and the overall length and extent of pre-trial discovery; the entitlement of the parties to an action to appeal a decision; clarity as to theories of liability; damages and governing law; uncertainties in timing of litigation; and the possible need for further legal proceedings to establish the appropriate amount of damages, if any. However, although there can be no assurance regarding the outcome of any of the legal proceedings or investigations referred to in this Note 21 to the unaudited condensed consolidated interim financial statements, the Company does not expect them to have a materially adverse effect on its financial position. However, if one or more of such proceedings were to result in judgments against the Company, such judgments could be material to its results of operations in a given period.
Norfloxacin case
The Company manufactures and distributes Norfloxacin, a formulations product. Under the Drugs Prices Control Order (the “DPCO”), the Government of India has the authority to designate a pharmaceutical product as a “specified product” and fix the maximum selling price for such product. In 1995, the Government of India notified Norfloxacin as a “specified product” and fixed the maximum selling price. In 1996, the Company filed a statutory Form III before the Government of India for the upward revision of the price and a legal suit in the Andhra Pradesh High Court (the “High
DR. REDDY’S LABORATORIES LIMITED AND SUBSIDIARIES NOTES TO UNAUDITED CONDENSED CONSOLIDATED INTERIM FINANCIAL STATEMENTS
(in millions, except share and per share data)
49
21. Contingencies (continued)
Court”) challenging the validity of the notification on the grounds that the applicable rules of the DPCO were not complied with while fixing the ceiling price. The High Court had previously granted an interim order in favor of the Company; however it subsequently dismissed the case in April 2004. The Company filed a review petition in the High Court in April 2004 which was also dismissed by the High Court in October 2004. Subsequently, the Company appealed to the Supreme Court of India by filing a Special Leave Petition, which is currently pending.
During the year ended March 31, 2006, the Company received a notice from the Government of India demanding the recovery of the price charged by the Company for sales of Norfloxacin in excess of the maximum selling price fixed by the Government of India, amounting to Rs.284,984, including interest thereon. The Company filed a writ petition in the High Court challenging this demand order. The High Court admitted the writ petition and granted an interim order, directing the Company to deposit 50% of the principal amount claimed by the Government of India, which amounted to Rs.77,149. The Company deposited this amount with the Government of India in November 2005 and is awaiting the outcome of its appeal with the Supreme Court. In February 2008, the High Court directed the Company to deposit an additional amount of Rs.30,000, which was deposited by the Company in March 2008.
The Company has fully provided for the potential liability related to the principal amount demanded by the Government of India and believes that the liability due to interest and penalty is remote. In the event the Company is unsuccessful in its litigation in the Supreme Court, it will be required to remit the sale proceeds in excess of the maximum selling price to the Government of India including penalties or interest, if any, which amounts are not readily ascertainable.
Excise demand in relation to a subcontracting arrangement
During the fiscal year ended March 31, 2003, the Central Excise Authorities of India (the “Authorities”) issued a demand notice to a vendor of the Company regarding the assessable value of products supplied by this vendor to the Company. The Company has been named as a co-defendant in this demand notice. The Authorities demanded payment of Rs.175,718 from the vendor, including penalties of Rs.90,359. Through the same notice, the Authorities issued a penalty claim of Rs.70,000 against the Company. During the year ended March 31, 2005, the Authorities issued an additional notice to this vendor demanding Rs.225,999 from the vendor, including penalty of Rs.51,152. Through the same notice, the Authorities issued a penalty claim of Rs.6,500 to the Company. Furthermore, during the year ended March 31, 2006, the Authorities issued an additional notice to this vendor demanding Rs.33,549. The Company has filed appeals against these notices. In August and September 2006, the Company attended the hearings conducted by the Customs, Excise and Service Tax Appellate Tribunal (the “CESTAT”) on this matter. In October 2006, the CESTAT passed an order in favor of the Company setting aside all of the above demand notices. In July 2007, the Authorities appealed against CESTAT’s order in the Supreme Court.
Patent related matters
In April 2006, the Company launched its fexofenadine hydrochloride 30 mg, 60 mg and 180 mg tablet products, which are generic versions of Sanofi-Aventis’ (“Aventis”) Allegra® tablets. The Company is presently defending patent infringement actions brought by Aventis in the United States District Court for the District of New Jersey. There are three formulation patents, three use patents, and two active pharmaceutical ingredients (“API”) patents which are at issue in the litigation. The Company has obtained summary judgment in respect of each of the formulation patents. Teva Pharmaceuticals Industries Limited (“Teva”) and Barr Pharmaceuticals, Inc. (“Barr”) have been defending a similar action in the same court. In September 2005, pursuant to an agreement with Barr, Teva launched its fexofenadine hydrochloride 30 mg, 60 mg and 180 mg tablet products, which are AB-rated (bioequivalent) to Aventis’ Allegra® tablets. Aventis has brought patent infringement actions against Teva and its API supplier in the United States District Court for the District of New Jersey. There are three formulation patents, three use patents, and two API patents at issue in the litigation. Teva has obtained summary judgment in respect of each of the formulation patents. On January 27, 2006, the District Court denied Aventis’ motion for a preliminary injunction against Teva and its API supplier on the three use patents, finding those patents likely to be invalid, and one of the API patents, finding that patent likely to be not infringed. The issues presented during Teva’s hearing are likely to be substantially similar to those which will be presented with respect to Company’s tablet products. Subsequent to the preliminary injunction hearing, Aventis sued Teva and Barr for infringement of a new patent claiming polymorphic forms of fexofenadine. The Company utilizes an internally developed
DR. REDDY’S LABORATORIES LIMITED AND SUBSIDIARIES NOTES TO UNAUDITED CONDENSED CONSOLIDATED INTERIM FINANCIAL STATEMENTS
(in millions, except share and per share data)
50
21. Contingencies (continued)
polymorph and has not been sued for infringement of the new patent. On November 18, 2008, Teva and Barr announced settlement of their litigation with Aventis. Litigation between the Company and Aventis continues. No trial has been scheduled at this time. If Aventis is ultimately successful in its allegation of patent infringement, the Company could be required to pay damages related to fexofenadine hydrochloride tablet sales made by the Company, and could also be prohibited from selling these products in the future.
In February 2006, Merck & Co. (“Merck”) initiated proceedings against betapharm before the German Civil Court of Mannheim alleging infringement of the basic patent for Fosamax (Merck’s brand name for alendronate sodium). Betapharm and some other companies are selling generic versions of this product in Germany. Merck’s patent, which expired in April 2008, was nullified in June 2006 by the German Federal Patent Court. However, Merck filed an appeal against this decision at the German Federal Supreme Court. The German Civil Court of Mannheim decided to stay the proceedings against betapharm until the German Federal Supreme Court has decided upon the validity of the patent. In March 2007, the European Patent Office granted Merck another patent for Fosamax, which is relevant to the composition of betapharm’s alendronate sodium product. Betapharm filed protective writs to prevent a preliminary injunction without a hearing. Betapharm has also filed an opposition against this new patent at the European Patent Office, which has scheduled a hearing on the matter in March 2009. In August 2007, Merck initiated patent infringement proceedings against betapharm before a German civil court. The German court decided to stay these proceedings until the European Patent Office has rendered a decision on the validity of the patent. As of December 31, 2008, no injunction had been granted to Merck. There are other jurisdictions within Europe where the innovator’s patent has already been revoked. Based on a legal evaluation, the Company continues selling its generic version of Fosamax. If Merck is ultimately successful in its allegations of patent infringement, the Company could be required to pay damages related to the above product sales made by the Company, and could also be prohibited from selling these products in the future.
The Company is aware of litigation with respect to one of its suppliers for oxycodon, which is sold by the Company and other generics companies in Germany. In April 2007, a German trial court rejected an application for an interim order by the innovator company against the Company’s supplier. The innovator has filed an infringement suit of formulation patents against the Company’s supplier in the German Civil Court of Mannheim as well as Switzerland (where the product is manufactured). The Company’s supplier and all licensees have filed a nullity petition at the German Federal Patent Court, and have also filed a “Declaration of Intervention Against” at the European Patent Office. The German court in Mannheim decided that the Company’s supplier’s product is non-infringing, but the innovator appealed the decision. The appeal is pending. As of December 31, 2008, based on a legal evaluation, the Company continues to sell this product and believes that the patent infringement case does not affect its ability to sell the product.
In October 2008, the United Kingdom Royal Court of Justice upheld the validity of Eli Lilly’s U.K. patent covering Zyprexa®, its brand name for olanzapine. The Company is appealing the decision. In view of this, the Company will not be able to launch its generic olanzapine product in the United Kingdom unless it is successful in its appeal or until the expiration of the basic patent. Due to the Company’s loss of the case, it is required to compensate Eli Lilly for a portion of its litigation costs. In November 2008, the Royal Court of Justice ordered that the legal costs payable to Eli Lilly by the Company, after taking into account certain discounts and reductions, would be between 0.77 million and 0.91 million pounds sterling. In November 2008, the Company paid 0.75 million pounds sterling as an interim payment. The Company has successfully obtained leave to appeal against this decision. The legal costs recoverable by Lilly have been provided for in the unaudited condensed consolidated interim financial statements.
During fiscal 2008, Eli Lilly’s German patent covering olanzapine was invalidated by the German Patent Court. Eli Lilly, the innovator, appealed this decision before the German Federal Court of Justice. Betapharm and certain other competitors have launched olanzapine products in Germany pending the decision from the German Federal Court of Justice. Eli Lilly filed an application for an interim order against betapharm claiming patent infringement at the court in Düsseldorf, Germany, but in August 2008 the court decided not to grant the interim order due to lack of urgency. In December 2008, the Federal Court of Justice overruled the German Patent Court and decided to maintain the olanzapine patent in favor of Eli Lilly, the innovator. The Company has subsequently stopped marketing this product in the German market. Eli Lilly, as part of the litigation, is expected to claim damages. Pending finalization of the discussions between the Company and Eli Lilly, the Company in accordance with IAS 10, “Events After the Reporting Date”, has recorded an amount of Rs.514.9 million, Rs.229.6 million and Rs.224.4 million for the three month periods ended June 30, 2008,
DR. REDDY’S LABORATORIES LIMITED AND SUBSIDIARIES NOTES TO UNAUDITED CONDENSED CONSOLIDATED INTERIM FINANCIAL STATEMENTS
(in millions, except share and per share data)
51
21. Contingencies (continued)
September 30, 2008 and December 31, 2008, respectively, representing its estimate of the probable loss arising from the innovator’s expected damage claims.
Environmental matter
The Indian Council for Environmental Legal Action filed a writ in 1989 under Article 32 of the Constitution of India against the Union of India and others in the Supreme Court of India for the safety of people living in the Patancheru and Bollarum areas of Medak district of Andhra Pradesh. The Company has been named in the list of polluting industries. In 1996, the Andhra Pradesh District Judge proposed that the polluting industries compensate farmers in the Patancheru, Bollarum and Jeedimetla areas for discharging effluents which damaged the farmers’ agricultural land. The compensation was fixed at Rs.1.30 per acre for dry land and Rs.1.70 per acre for wet land. Accordingly, the Company has paid a total compensation of Rs.2. The matter is pending in the courts and the possibility of additional liability is remote. The Company would not be able to recover the compensation paid, even if the decision of the court is in favor of the Company.
Regulatory matters
In April 2008, the Company received a Civil Investigative Demand (“CID”) from the United States Federal Trade Commission (“FTC”). A CID is a request for information in the course of a civil investigation and does not constitute the commencement of legal proceedings. The Company has been informed that the focus of this civil antitrust investigation relates to the settlement arrangement entered into between the Company and UCB Pharma Inc. (“UCB”) resolving patent litigation concerning levetiracetam. The Company believes that the terms of its settlement arrangement with UCB are consistent with all applicable antitrust laws. The Company is cooperating fully with the FTC regarding this investigation. The request in April 2008 from the FTC sought information to supplement the voluntary production the Company had completed on February 1, 2008. The Company completed its response to the CID on June 23, 2008. Since the production of this information, the FTC has not requested any further information from the Company nor expressed concerns regarding the Company’s agreement with UCB. The FTC did later request additional information from other parties involved in this investigation. The Company understands that those productions have been completed and that the FTC has indicated that it has no further information requests. The FTC has indicated, however, that it is not formally closing its investigation at this time. While the Company does not expect further requests for information or other action by the FTC with regard to the Company’s agreement with UCB, since the investigation remains open, the FTC maintains the ability to renew its requests at a later date.
22. German operations
In November 2008, the Company’s German subsidiary betapharm participated in a competitive bidding (or “tender”) process for 64 pharmaceutical products announced by Allgemeinen Ortskrankenkassen (“AOK”), a large public health insurance company in Germany. In this tender, betapharm has been offered 8 products translating to 33 contracts. The results of this tender, which were announced in December 2008, have been put on hold, as these are being litigated by the drug manufacturers and are subject to process reviews. There exists significant uncertainty in respect of the Company’s German operations, since the ultimate outcome of this tender has the potential to result in a loss of the Company’s market share in Germany. Management believes that the ultimate outcome of this matter is not under the direct control of the Company and, therefore, at present the Company cannot reasonably determine consequent impairment and adjustments, if any, that may be necessary to be made to the carrying value of the Company’s intangible assets and goodwill pertaining to the Company’s German operations (which was Rs. 33,230 million as at December 31, 2008).
ITEM 2. OPERATING AND FINANCIAL REVIEW
Three months ended December 31, 2008 compared to the three months ended December 31, 2007
The following discussion and analysis should be read in conjunction with the consolidated financial statements, the related cash flow statements and notes and the Operating and Financial Review and Prospects included in our Annual Report on Form 20-F for the fiscal year ended March 31, 2008 on file with the SEC (our “Form 20-F”) and the unaudited condensed consolidated interim financial statements contained in this Report on Form 6-K, the related cash flow statement and notes (collectively, the “Financial Statements”).
During this year we have decided to adopt IFRS and its interpretations issued by the IASB as the accounting principles for filings with the SEC. An explanation of how the transition to IFRS has affected the reported financial position and financial performance of the Company is provided in Note 4 of the Financial Statements. This Note includes reconciliations of equity, profit or loss and cash flows for comparative periods under Previous GAAP to those reported for those periods under IFRS.
This discussion contains forward-looking statements that involve risks and uncertainties. When used in this discussion, the words “anticipate”, “believe”, “estimate”, “intend”, “will” and “expect” and other similar expressions as they relate to us or our business are intended to identify such forward-looking statements. We undertake no obligation to publicly update or revise the forward-looking statements, whether as a result of new information, future events, or otherwise. Actual results, performances or achievements could differ materially from those expressed or implied in such forward-looking statements. Factors that could cause or contribute to such differences include those described under the heading “Risk Factors” in our Form 20-F. Readers are cautioned not to place reliance on these forward-looking statements that speak only as of their dates.
The Chief Operating Decision Maker (“CODM”) evaluates our performance and allocates resources based on an analysis of various performance indicators by operating segments. The operating segments reviewed by the CODM with effect from April 1, 2008 are as follows:
Pharmaceutical Services and Active Ingredients. This segment includes active pharmaceutical ingredients and intermediaries, also known as active pharmaceutical products or bulk drugs, which are the principal ingredients for finished pharmaceutical products. Active pharmaceutical ingredients and intermediaries become finished pharmaceutical products when the dosages is fixed in a form ready for human consumption such as a tablet, capsule or liquid using additional inactive ingredients. This segment also includes contract research services and manufacture and sale of active pharmaceutical ingredients and steroids in accordance with the specific customer requirements.
Global Generics. This segment consists of finished pharmaceutical products ready for consumption by the patient, marketed under a brand name or as generic finished dosages with therapeutic equivalence to branded formulations.
Proprietary Products. This segment involves the discovery of new chemical entities for subsequent commercialization and out-licensing. It also involves our specialty pharmaceuticals business, which is positioning to launch its sales and marketing operations for in-licensed and co-developed dermatology products.
Accordingly, disclosures relating to the previous period have been reclassified/regrouped to conform to the current period presentation. The explanations below have been suitably modified in line with such changes.
52
• Pharmaceutical Services and Active Ingredients (“PSAI”);
• Global Generics; and
• Proprietary Products.
The following table sets forth, for the periods indicated, our consolidated revenues and gross profits by segment:
The following table sets forth, for the periods indicated, financial data as percentages of total revenues and the increase (or decrease) by item as a percentage of the amount over the comparable period in the previous year.
Statement on Changes in Profit Figures Subsequent to Earnings Releases
On July 21, 2008, we issued an earnings release for the three month period ended June 30, 2008 which discussed our unaudited condensed consolidated financial results as determined pursuant to Previous GAAP. Subsequently, we elected to present our financial statements pursuant to IFRS and, on October 23, 2008, we issued earnings releases for the three month periods ending June 30, 2008 and September 30, 2008, which discussed financial results under IFRS. Subsequently, in December 2008, we noted an adverse judgment with respect to our olanzapine litigation in Germany. On January 20, 2009, we issued an earnings release for three month period ended December 31, 2008 which discussed our unaudited condensed consolidated financial results as determined pursuant to IFRS and which reported a net profit of Rs.1,924 million for the three month period ended December 31, 2008.
As a result of the adverse judgment with respect to our olanzapine litigation in Germany, and in accordance with IAS 10, “Events After the Reporting Period,” we have recorded a probable loss (net of related tax benefits) of Rs.365 million and Rs.159 million arising out of this dispute in our unaudited condensed consolidated interim financial statements for the three months ended June 30, 2008 and September 30, 2008, respectively, as an adjusting subsequent event. We included the entire loss arising out of this litigation as part of our earnings release for the three months ended December 31, 2008. The loss has
53
(Rs. in millions) (Rs. in millions) Three months ended December 31, 2008 Three months ended December 31, 2007 Gross Revenues profit % Revenues Gross % to to % to Gross profit % to Revenues total Gross profit revenues Revenues total profit revenues
Pharmaceutical Services and Active Ingredients Rs. 4,458 24% Rs. 1,200 27% Rs. 4,215 34% 1,271 30%
Percentage of Sales Three months ended December 31, Percentage 2008 2007 Increase/(Decrease)
Revenues 100.0 100.0 49Gross profit 56 49 70 Selling, general and administrative expenses 29 33 31Research and development expenses 6 7 15Write-down of intangible assets — 24 Not ComparableOther (income)/expense, net 1 (1) Not ComparableResults from operating activities 20 (14) Not ComparableFinance (income)/expense, net 4 — Not ComparableProfit before income taxes 17 (14) Not ComparableIncome tax (expense)/benefit, net 3 4 Not ComparableProfit for the period 13 (10) Not Comparable
now been allocated among the three month periods ended June 30, September 30, and December 31, 2008, respectively, based on underlying sales of the product in the respective periods.
As a result of the allocation of the probable loss reported for the three month period ended December 31, 2008 among the three month periods ended June 30, September 30, and December 31, 2008, the profitability and related figures in the above referenced earnings releases will vary from the figures contained in our unaudited condensed consolidated interim financial statements included in Form 6-K for such periods. Accordingly, the cumulative profitability and related figures reported for the nine months ended December 31, 2008 will be consistent with the earnings releases.
Revenues
54
• Our overall revenues increased by 49% to Rs.18,401 million in the three months ended December 31, 2008, from Rs.12,319 million in the three months ended December 31, 2007. Excluding revenues from a unit of Dow Chemical Company associated with its United Kingdom sites in Mirfield and Cambridge (hereinafter referred to as the “Dow Pharma Unit”), BASF’s Manufacturing facility in Shreveport, Louisiana, U.S.A. and related pharmaceutical contract manufacturing (hereinafter referred to as the “Shreveport facility”) and Jet Generici SRL (hereinafter referred to as “Jet Generici”), each of which was acquired in April 2008, revenues grew by 44% to Rs.17,747 during the three months ended December 31, 2008. During the three months ended December 31, 2008, we launched sumatriptan (an authorized generic version of Imitrex®) in the United States, which contributed Rs.3,582 million to our revenues for such three month period. Excluding the revenues from sumatriptan sales and revenues from the Dow Pharma Unit, the Shreveport facility and Jet Generici, our revenues increased by 15% to Rs.14,165 million during the three months ended December 31, 2008.
• Revenues from our Pharmaceutical Services and Active Ingredients segment increased by 6% to Rs.4,458 million during the three months ended December 31, 2008, from Rs.4,215 million during the three months ended December 31, 2007. Excluding revenues from the Dow Pharma Unit acquired in April 2008 of Rs.223 million, revenues from this segment increased by Rs.19 million compared to the three months ended December 31, 2007. The increase primarily resulted from growth in revenues from our “rest of the world” markets (i.e., all markets other than North America, Europe, Russia and other countries of the former Soviet Union and India) by 54% and from Europe by 17%, but the increase was partially offset by a decrease in our revenues from North America by 32% compared to the three months ended December 31, 2007.
• Revenues from our Global Generics segment increased by 71% to Rs.13,683 million during the three months ended December 31, 2008, from Rs.7,987 million for the three months ended December 31, 2007. The increase primarily resulted from an increase in revenues from North America (United States and Canada), Russia and our “rest of the world” markets.
• Excluding revenues of Rs.409 million from the Shreveport facility and Rs.22 million from Jet Generici, each of which was acquired in April 2008, revenues from our Global Generics segment increased by 66% to Rs.13,252 million during the three months ended December 31, 2008. During the three months ended December 31, 2008, we launched sumatriptan (an authorized generic version of Imitrex®) in the United States, which contributed Rs.3,582 million to our revenues for such three month period. Excluding the revenues from sumatriptan sales and revenues from Shreveport facility and Jet Generici, our Global Generics revenues grew by 21% to Rs.9,670 million during the three months ended December 31, 2008.
• For the three months ended December 31, 2008, we received 41% of our total revenues from North America (the United States and Canada), 23% of our revenues from Europe, 14% of our revenues from India, 11% of our revenues from Russia and other countries of the former Soviet Union and 11% of our revenues from other countries.
• For the three months ended December 31, 2008, the average Indian rupee/U.S.$ exchange rate depreciated by approximately 24% as compared to the average exchange rate for the three months ended December 31, 2007. This depreciation had a positive impact on our sales because of the increase in rupee realization from sales in U.S. Dollars. However, this positive impact was partially offset due to mark to market losses upon maturity of foreign currency derivative contracts, which were acquired to mitigate the risks of foreign currency volatility. The foregoing Indian rupee/U.S.$ exchange rate depreciation resulted in a net decrease in our revenues by Rs.550 million during the three months ended December 31, 2008. Excluding the impact of foreign currency derivatives, our total revenues grew by 54%
Segment analysis
Pharmaceutical Services and Active Ingredients (“PSAI”)
For the three months ended December 31, 2008, this segment contributed 24% of our total revenues, as compared to 34% for the three months ended December 31, 2007. Revenues in this segment increased by 6% to Rs.4,458 million for the three months ended December 31, 2008, as compared to Rs.4,215 million for the three months ended December 31, 2007. Excluding revenues from the Dow Pharma Unit acquired in April 2008, revenues from this segment increased to Rs.4,235 million for the three months ended December 31, 2008 from Rs.4,215 million for the three months ended December 31, 2007.
For the three months ended December 31, 2008, revenues from India accounted for 10% of our revenues from this segment, as compared to 13% for the three months ended December 31, 2007. Revenues from India decreased by 19% to Rs.466 million for the three months ended December 31, 2008, as compared to Rs.566 million for the three months ended December 31, 2007. This decrease was primarily due to decreases in revenues from sales of naproxen sodium, ranitidine, ramipril and amlodipine besylate, which decreases were partially offset by increases in revenues from sales of losartan potassium and by new revenues from our launch of levetiracetam.
Revenues from outside India constituted 90% of our total revenues for the three months ended December 31, 2008, as compared to 87% for the three months ended December 31, 2007. Revenues from outside India increased by 9% to Rs.3,992 million for the three months ended December 31, 2008 from Rs.3,649 million for the three months ended December 31, 2007.
Revenues from North America (the United States and Canada) decreased by 32% to Rs.857 million for the three months ended December 31, 2008 from Rs.1,253 million for the three months ended December 31, 2007. The decrease was primarily due to decreases in revenues from sales of ibuprofen, escitalopram oxalate, naproxen, and the decrease was partially offset by an increase in revenues from sales of montelukast and by new revenues from our launch of ropinirole Hcl.
Revenues from Europe increased by 17% to Rs.1,741 million for the three months ended December 31, 2008 from Rs.1,490 million for the three months ended December 31, 2007. The increase was mainly due to an increase in revenues from sales of gemcitabine and montelukast, and was partially offset by a decrease in revenues from sales of olanzapine and ramipril.
Revenues from our “Rest of the world” markets (i.e., all markets other than North America, Europe, Russia and other countries of the former Soviet Union and India) increased by 54% to Rs.1,393 million for the three months ended December 31, 2008 from Rs.906 million for the three months ended December 31, 2007. This increase was primarily due to increases in sales in South Korea, Turkey, Mexico, and Indonesia, which was partially offset by decreases in sales in Japan.
Under IFRS, we follow hedge accounting principles, which require the gain/loss on derivative contracts designated as hedges to be recognized in the same fiscal period as the underlying transaction is recorded. In accordance with these principles, we have recorded losses of Rs.248 million for the three months ended December 31, 2008. Excluding the impact of hedging, this segment’s revenue increased by 12% to Rs.4,706 for the three months ended December 31, 2008 from Rs.4,215 million for the three months ended December 31, 2007.
Global Generics
For the three months ended December 31, 2008, this segment contributed 75% of our total revenues, as compared to 65% for the three months ended December 31, 2007. Revenues increased by 71% to Rs.13,683 million for the three months ended December 31, 2008 from Rs.7,987 million for the three months ended December 31, 2007. Excluding revenues from the Shreveport facility and Jet Generici, each of which was acquired in April 2008, revenues from this segment increased by 66% to Rs.13,252 for the three months ended December 31, 2008 from Rs.7,987 million for the three months ended December 31, 2007.
Revenues from India constituted 14% of this segment’s total revenues for the three months ended December 31, 2008, as compared to 25% for the three months ended December 31, 2007. Revenues from India decreased by 1% to Rs.1,968 million
55
to Rs.18,951 for the three months ended December 31, 2008 from Rs.12,319 million for the three months ended December 31, 2007.
for the three months ended December 31, 2008 from Rs.1,992 million for the three months ended December 31, 2007. The decrease in revenues was due to a decrease in sales volumes of key brands Nise, our brand of nimesulide, and Stamlo, our brand of amlodipine. The decrease was partially offset by an increase in sales of Razo, our brand of rabeprazole, and Omez, our brand of omeprazole. New products launched in India during the three months ended December 31, 2008 generated revenues of Rs.75 million for such period.
Revenues from outside India constituted 86% of this segment’s total revenues for the three months ended December 31, 2008, as compared to 75% for the three months ended December 31, 2007. Revenues from outside India increased by 95% to Rs.11,715 million for the three months ended December 31, 2008 from Rs.5,995 million for the three months ended December 31, 2007.
Revenues from North America (the United States and Canada) in this segment increased by 295% to Rs.6,651 million for the three months ended December 31, 2008 from Rs.1,684 million for the three months ended December 31, 2007. This increase was primarily due to increases in revenues from the launch of sumatriptan, our authorized generic version of Imitrex® in the three months ended December 31, 2008, which generated revenues of Rs.3,582 million for such period. Excluding the revenues from sumatriptan sales, our revenues from North America grew by 82 % to Rs.3,069 million for the three months ended December 31, 2008. The increase was mainly due to increases in sales of fexofenadine, simvastatin, omeprazole, pravastatin, and citalopram. These increases were partially offset by decreases in sales of finasteride AG.
Revenues from Europe in this segment decreased by 2% to Rs.2,505 million for the three months ended December 31, 2008, as compared to Rs.2,558 million for the three months ended December 31, 2007. Revenues of betapharm decreased from Rs.2,047 million for the three months ended December 31, 2007 to Rs.1,999 million for the three months ended December 31, 2008. This decrease was primarily due to decreases in revenues from sales of Alendronate beta, our brand of alendronate, oxycodon, and oxycodon Hcl beta. This reduction was partially offset by an increase in sales of Simvabeta, our brand of simvastatin, and Tramadol, our brand of tramabeta. Revenues from sales of products in the United Kingdom decreased by 4% to Rs.360 million for the three months ended December 31, 2008 from Rs.376 million for the three months ended December 31, 2007, primarily due to decreases in sales of amlodipine and omeprazole, which decreases were partially offset by increases in sales of bisacodyl and fluoxetine.
Revenues from Russia in this segment increased by 44% to Rs.1,572 million for the three months ended December 31, 2008 from Rs.1,094 million for the three months ended December 31, 2007. This increase was due to higher sales volumes as well as higher prices of our key brands Nise, our brand of nimesulide, Omez, our brand of omeprazole, and Ketorol, our brand of ketorolac.
Revenues from other countries of the former Soviet Union in this segment increased by 6% to Rs.434 million for the three months ended December 31, 2008, as compared to Rs.409 million for the three months ended December 31, 2007. This increase was primarily due to an increase in revenues from Kazakhstan, Belarus and Uzbekistan, and was partially offset by a decrease in revenues from Ukraine.
Revenue from other markets in this segment grew by 121% to Rs.553 million for the three months ended December 31, 2008, as compared to Rs.250 million for the three months ended December 31, 2007, due to increases in revenues from Venezuela, Myanmar, Jamaica, United Arab Emirates and Sri Lanka.
Under IFRS, we follow hedge accounting principles, which require the gain/loss on derivative contracts designated as hedges to be recognized in the same fiscal period as the underlying transaction is recorded. In accordance with these principles, we have recorded losses amounting to Rs.302 millions for the three months ended December 31, 2008. Excluding the impact of hedging, this segment’s revenue increased by 75% to Rs.13,985 for the three months ended December 31, 2008 from Rs.7,987 million for the three months ended December 31, 2007.
Gross Margin
Total gross margin as a percentage of total revenues was 56% for the three months ended December 31, 2008, as compared to 49% for the three months ended December 31, 2007. Total gross margin increased to Rs.10,272 million for the three months ended December 31, 2008 from Rs.6,034 million for the three months ended December 31, 2007.
56
Pharmaceutical Services and Active Ingredients
Gross margin of this segment decreased to 27% of this segment’s revenues for the three months ended December 31, 2008, as compared to 30% of this segment’s revenues for the three months ended December 31, 2007. The decrease in gross margin was mainly due to hedging losses (i.e., losses on foreign currency derivatives) of Rs.248 million. Excluding the impact of hedging losses, the gross margin of this segment increased to 31% of this segment’s revenues for the three months ended December 31, 2008, as compared to 30% of this segment’s revenues for the three months ended December 31, 2007.
Global Generics
Gross margin of this segment increased to 65% of this segment’s revenues for the three months ended December 31, 2008, as compared to 59% of this segment’s revenues for the three months ended December 31, 2007. The increase was primarily due to our launch of sumatriptan, our authorized generic version of Imitrex®. Excluding the impact of sumatriptan sales, the gross margin of this segment decreased to 58% for the three months ended December 31, 2008, as compared to 59% for the three months ended December 31, 2007. The decrease in gross margin was mainly due to hedging losses (i.e., losses on foreign currency derivatives) of Rs.302 million. Excluding the impact of hedging losses and the sumatriptan launch, the gross margin of this segment remained at 59% of this segment’s revenues for the three months ended December 31, 2008, as compared to 59% of this segment’s revenues for the three months ended December 31, 2007.
Selling, general and administrative expenses
Selling, general and administrative expenses as a percentage of total revenues were 29% for the three months ended December 31, 2008, as compared to 33% for the three months ended December 31, 2007. Selling, general and administrative expenses increased by 31% to Rs.5,382 million for the three months ended December 31, 2008 from Rs.4,121 million for the three months ended December 31, 2007. The increase was in part attributable to an increase in employee cost due to increases in head count and annual raises, and an increase in legal and professional expenses due to product related regulatory activities undertaken during the three months ended December 31, 2008. The increase was also partly attributable to an increase in marketing expenses due to increased advertisement activities for key products in Romania, new product launches in our Proprietary Products segment, and an increase in front line managing expenses and incentives.
Furthermore, amortization expenses decreased by 10% to Rs.339 million for the three months ended December 31, 2008 from Rs.375 million for the three months ended December 31, 2007. The reduction was primarily due to write downs of certain intangible assets of betapharm for the quarter ended December 31, 2007, and was partially offset by an increase in amortization expenses of Rs.44.9 million for the three months ended December 31, 2008 due to our acquisition of the Dow Pharma Unit, the Shreveport facility and Jet Generici.
Research and development expenses
Research and development costs increased by 15% to Rs.1,027 million for the three months ended December 31, 2008 from Rs.894 million for the three months ended December 31, 2007. As a percentage of revenues, research and development expenditures accounted for 6% of our total revenue in the three months ended December 31, 2008, as compared to 7% for the three months ended December 31, 2007. This increase was primarily attributable to an increase in laboratory expenses and bio-study costs due to higher research and development activity undertaken during the three months ended December 31, 2008.
Other (income)/expense, net
Other expense was Rs.110 million for the three months ended December 31, 2008, as compared to income of Rs.101 million for the three months ended December 31, 2007. This was primarily due to the recording of a provision of Rs.224 million towards probable losses on account of recent developments in the Eli Lilly damage claim relating to its olanzapine patent in Germany.
Results from operating activities
As a result of the foregoing, our results from operating activities increased to Rs.3,753 million for the three months ended December 31, 2008, as compared to a loss of Rs.1,763 million for the three months ended December 31, 2007. This increase
57
was primarily attributable to the write-down of intangible assets of betapharm taken for the three months ended December 31, 2007. For the three months ended December 31, 2007, we tested the carrying value of betapharm’s intangible assets for impairment. Such testing was triggered by certain adverse market conditions, such as a decrease in market prices and an increasing trend in certain new type of rebates being negotiated with State Healthcare Insurance (“SHI”) fund companies, which market conditions were further affected by supply constraints. As a result of this review, we recorded a write-down of intangible assets of Rs.2,883 million and adjusted the net carrying value of certain product related intangibles as of December 31, 2007.
Finance income/(expense), net
For the three months ended December 31, 2008, our net finance expense was Rs.699 million, as compared to net finance income of Rs.23 million for the three months ended December 31, 2007.
For the three months ended December 31, 2008, our finance income, excluding foreign exchange gain/loss, decreased by 49% to Rs.86 million from Rs.170 million for the three months ended December 31, 2007. The decrease was attributable to a decrease in our interest income from fixed deposits resulting from a decrease in our fixed deposits base as well as a decrease in gains on sales of investments. For the three months ended December 31, 2008, our interest expense increased by 26% to Rs.292 million, from Rs.231 million for the three months ended December 31, 2007 primarily due to an increase in our packing credit loans in foreign currencies and an increase in interest rates on our long term loans and borrowings.
Foreign exchange loss was Rs.493 million for the three months ended December 31, 2008 as compared to a foreign exchange gain of Rs.87 for the three months ended December 31, 2007. This was primarily due to depreciation of the Indian rupee/U.S. dollar exchange rate by Rs.9.3, from Rs.39.4 for the three months ended December 31, 2007 to Rs.48.6 for the three months ended December 31, 2008. Such depreciation resulted in losses on short U.S.$/INR derivative contracts and translation losses on outstanding packing credit loans in foreign currencies.
Profit before income taxes
As a result of the foregoing, profit before income taxes increased to Rs.3,062 million for the three months ended December 31, 2008, as compared to loss of Rs.1,737 million for the three months ended December 31, 2007.
Income tax expense
Income tax expense was Rs.617 million for the three months ended December 31, 2008, as compared to an income tax benefit of Rs.524 million for the three months ended December 31, 2007. For the three months ended December 31, 2007, a deferred tax benefit of Rs.905 million was recorded as a result of an impairment charge of betapharm intangibles of Rs.2,883 million. Furthermore, the increase in the tax expense for the three months ended December 31, 2008 was largely due to an increase in profits which was partially offset by tax benefits arising out of losses in our German operations. Such losses were primarily attributable to our recording of a provision towards probable losses as a result of recent developments in the Eli Lilly damage claim relating to its olanzapine patent in Germany.
Profit for the period
As a result of the foregoing, our net income increased to Rs.2,445 million for the three months ended December 31, 2008, as compared to net loss of Rs.1,213 million for the three months ended December 31, 2007.
ITEM 3. LIQUIDITY AND CAPITAL RESOURCES
We have primarily financed our operations through cash flows generated from operations and short term loans and borrowings for working capital. Our principal liquidity and capital needs are for making investments, the purchase of property, plant and equipment, regular business operations and drug discovery.
As part of our growth strategy, we continue to review opportunities to acquire companies, complementary technologies or product rights. To the extent that any such acquisitions involve cash payments, rather than the issuance of shares, we may need to borrow from banks or raise additional funds from the debt or equity markets.
58
Cash flow used in Operating Activities
The net cash used in operating activities was Rs.678 million for the nine months ended December 31, 2008, as compared to net cash provided by operating activities of Rs.3,467 million for the nine months ended December 31, 2007. Although there was an increase in our profits for the nine months ended December 31, 2008, the net cash provided by operating activities decreased significantly for such period primarily due to:
Cash flow used in Investing Activities
Our investing activities resulted in a net cash outflow of Rs.2,519 million for the nine months ended December 31, 2008, as compared to a net cash outflow of Rs.6,624 million for the nine months ended December 31, 2007. This decrease in cash outflow from investing activities was primarily due to higher cash inflows from the sales of short term investments, which were liquidated to fund the acquisitions of the Dow Pharma Unit, the Shreveport facility, Jet Generici and the balance of the outstanding shares of Perlecan Pharma during the six months ended September 30, 2008 and to fund short term working capital requirements.
Cash flow used in Financing Activities
Our financing activities resulted in a net cash outflow of Rs.955 million for the nine months ended December 31, 2008, as compared to a net cash outflow of Rs.8,178 million for the nine months ended December 31, 2007. The decrease in net cash outflow from financing activities was primarily due to lower repayment of long term debt. For the three month period ended June 30, 2007, we repaid a significant portion of our long term debt that we had borrowed to fund our acquisition of betapharm. Furthermore, we also borrowed short term funds during the nine months ended December 31, 2008 to meet our short term working capital requirements.
The following table provides a list of our principal debts outstanding as of December 31, 2008:
59
Nine months ended December 31, 2008 2008 2007 (Rs. in millions, U.S.$ in thousands) Net cash from/(used in): Operating activities U.S.$(14) Rs. (678) Rs. 3,467Investing activities (52) (2,519) (6,624)Financing activities (20) (955) (8,178)Net increase/(decrease) in cash and cash equivalents U.S.$(85) Rs.(4,152) Rs.(11,335)
• An increase in cash outflow attributable to higher working capital levels. This increase in working capital levels was primarily due to increased inventory levels as needed to meet the anticipated future requirements, as well as an increase in receivables resulting from increases in sales and operations. In November 2008, we launched sumatriptan, the authorized generic version of Imitrex®, in the United States, which contributed Rs. 3,582 million to our revenues. This also resulted in an increase in our receivables, as these debts were not due as of December 31, 2008.
• An increase in cash outflow attributable to an increase in our advance payments of estimated income taxes within various jurisdictions based on our profitability projections for the year ended March 31, 2009. This increase in our advance payments was primarily due to higher profits generated from our launch of sumatriptan.
Debt Principal Amount Interest Rate (Rs.in millions, U.S.$/EURO in thousands ) Short-term borrowings from banks Rs.7,968 U.S.$109,000 Rupee borrowings — 9%
ITEM 4. RECENT DEVELOPMENTS
In July 2008, we purchased the entire equity holdings of Citigroup Venture Capital International Mauritius Limited (“Citigroup Venture”) and ICICI Venture Funds Management Company Limited (“ICICI Venture”) in Perlecan Pharma Private Limited (“Perlecan Pharma”) for Rs.757,802. Consequently, Perlecan Pharma has become our wholly-owned subsidiary. Perlecan Pharma was formed in September 2005 as a joint venture among us, Citigroup Venture and ICICI Venture. We, as a part of this joint venture, had out-licensed four NCE assets to Perlecan Pharma. Perlecan Pharma had been engaged in the clinical development and out-licensing of these four NCE assets.
In July 2008, we entered into a global distribution agreement for Ibuprofen API with Albemarle Corporation (NYSE: ALB), a U.S.-based specialty chemicals company. Under the agreement, Albemarle will supply Ibuprofen API from its Orangeburg Plant in South Carolina, U.S. to us for distribution to our global client base.
In September 2008, we launched “Combihale™”, a combination of a steroid and a long acting bronchodilator, in India. It is used in the treatment of asthma and is available in two combinations, Combihale™ FF (Formoterol + Fluticasone) and Combihale™ FB (Formoterol + Budesonide). Combihale™ would be available along with “Redihaler™”, a dry powder inhalation device designed in-house, which will initially be given free of cost with Combihale™.
In September 2008, we formally launched our U.S. Specialty Business through Promius Pharma, LLC, a wholly-owned subsidiary located in Bridgewater, New Jersey. The launch marks a milestone in building a sustainable and profitable branded business in the United States. Promius Pharma, which will initially focus on the branded dermatology market, is based on a platform of strategic licensing initiatives and internal product development activities undertaken over the last several years. Promius Pharma’s current portfolio contains innovative topical products for the treatment of psoriasis, atopic dermatitis and seborrheic dermatitis. In October 2008, Promius Pharma launched its first product, EPICERAM® skin barrier emulsion. EpiCeram® Skin Barrier Emulsion is a novel prescription therapy for the treatment of atopic dermatitis, a skin disease.
In September 2008, we entered into a licensing and distribution agreement with Cosmederm Technologies, a U.S. based specialty pharmaceutical company focused on dermatology and aesthetic medicine. Under this agreement, we have exclusive rights to distribute Cosmederm Technologies’ unique skin care products throughout India. The partnership is for two product lines: REFINITY peel kits (glycolic acid 70%) and COSMEDERM peel kits (glycolic acid 50%). Through this partnership, we are entering the aesthetic dermatology segment in India and consolidating our position in cosmeceuticals.
In November 2008, we launched the authorized generic version of GlaxoSmithKline’s Imitrex® (sumatriptan succinate) tablets 25mg, 50mg, and 100mg in the United States. We are the first company to launch an authorized generic version of Imitrex® tablets in the U.S. market. GlaxoSmithKline Imitrex® tablets, which are indicated for the acute treatment of migraine attacks in adults, had U.S. sales of $1.29 billion for the 12 month period ending December, 2007 according to IMS Health, a company which provides information on the pharmaceutical industry, in its Moving Annual Total (“MAT”) report for the year ended December 2007.
In November 2008, our German subsidiary betapharm participated in a competitive bidding (or “tender”) process for 64 pharmaceutical products announced by Allgemeinen Ortskrankenkassen (“AOK”), a large public health insurance company in Germany. In this tender, betapharm has been offered 8 products translating to 33 contracts. The results of this tender, which were announced in December 2008, have been put on hold, as these are being litigated by the drug manufacturers and are subject to process reviews.
In December 2008, the Federal Court of Justice in Germany overruled a German Patent Court decision and upheld the validity of Eli Lilly’s patent covering olanzapine. Betapharm, our German subsidiary, and certain other competitors had earlier launched olanzapine products in Germany pending the outcome of such appellate court decision. We subsequently stopped marketing this product in the German market. Eli Lilly, as part of the litigation, is expected to claim damages.
In December 2008, we announced the settlement with Schering-Plough Corporation and Sepracor Inc. of patent challenge litigation for desloratidine, the generic version of Clarinex®. The settlement agreements allow us to manufacture and market
60
Debt Principal Amount Interest Rate (Rs.in millions, U.S.$/EURO in thousands )
Foreign currency borrowings — LIBOR+ 110 bps
Long term loans and borrowings Rs.14,296 U.S.$ 11,469 LIBOR + 70 bps EURO194,687 EURIBOR + 70 bps
desloratidine in various strengths, with six months marketing exclusivity/co-exclusivity, starting in 2012. The agreements resolve all pending patent infringement actions filed by Schering-Plough Corporation and Sepracor Inc. against us in the U.S. District Court for the District of New Jersey.
In March 2009, the United States Federal Trade Commission advised us that it was formally closing its investigation of our settlement arrangement with UCB Pharma Inc. pertaining to levetiracetam.
ITEM 5. TREND INFORMATION
Global Generics
The United States of America, Germany, India and Russia are the four key strategic markets for our Global Generics business, contributing roughly 87% of the revenues of this segment for the nine months ending December 31, 2008. In all of these markets, we continue to grow our revenues consistently year after year as a result of our product franchise and customer and distributor relationships built over the years.
In the United States, our revenues for the nine months ending December 31, 2008 represented an increase of 128%, as compared to our revenues for the nine months ended December 31, 2007, led by growth of our existing and new products, the successful launch of sumatriptan (our authorized generic version of Imitrex®), as well as the revenues from the acquisition of the Shreveport facility. We are also looking at new channels of growth in the coming years through our over-the-counter business and government business to further increase the scale of our generics business in the United States. The acquisition of the Shreveport facility in the United States was a strategic move in building manufacturing and packaging capability in the United States.
In December 2008, we announced the settlement with Schering-Plough Corporation and Sepracor Inc. of patent challenge litigation for desloratidine, the generic version of Clarinex®. The settlement agreements allow us to manufacture and market desloratidine in various strengths, with six months marketing exclusivity/co-exclusivity, starting in 2012. The agreements resolve all pending patent infringement actions filed by Schering-Plough Corporation and Sepracor Inc. against us in the U.S. District Court for the District of New Jersey. This settlement is in line with our approach of exploring all opportunities to best monetize our Paragraph IV pipeline to create visibility and certainty of launches.
Continuing with our stated strategy, we intend to expand our portfolio over the next few years by adding solid dosage forms, as well as alternate dosage forms, and by complementing our internal product development effort through business alliances. We intend to broaden not only our customer base but also our products by focusing more on difficult-to-make and low competition products.
In November 2008, we launched the authorized generic version of GlaxoSmithKline’s Imitrex® (sumatriptan succinate) tablets 25mg, 50mg, and 100mg in the United States. This launch was a result of the settlement of patent litigation in October 2006 with GlaxoSmithKline relating to sumatriptan succinate tablets. We are the first company to launch an authorized generic version of Imitrex® tablets in the United States market. Imitrex® tablets had U.S. sales of U.S.$1.29 billion for the 12 month period ending December, 2007 according to IMS Health in its MAT report for the 12 month period ending December, 2007.
As of December 31, 2008, we had filed a total of 133 ANDAs with the U.S. FDA. We had 69 ANDAs pending approval with the U.S. FDA as of December 31, 2008, which included 13 tentative approvals.
In Germany, the pharmaceutical industry continues to go through health care reforms which have put pressure on prices. As of April 1, 2007, the Statutory Health Insurance — Competition Strengthening Act (also known as the “GKV-WSG Act”) took effect in Germany with the purpose of strengthening competition in public health insurance to regulate the German health care system. The law has significantly increased the power of the insurance companies and statutory health insurance (“SHI”) funds by allowing them to enter into direct rebate contracts with suppliers of pharmaceuticals. It further incentivizes doctors to prescribe generic drugs covered by such rebate contracts. The pharmacist is also required, when dispensing drugs, to give a preference to such drugs as are covered by rebate contracts. Thus, successfully concluding rebate contracts with insurance companies is a factor critical to succeeding in the competition for market share in the generic prescription drug market. betapharm has signed for rebate contracts with a large number of SHI funds covering a major part of the insured population in the aggregate.
In January 2008, new reference prices became effective under the GKV-WSG Act. Subsequently, new co-payment release prices were announced and which were effective June 1, 2008.
61
During fiscal 2009, we significantly reduced our dependence upon products from our single largest supplier in Germany by shifting the sourcing to our own internal supply network in Europe and India. During fiscal 2009, we successfully completed the transfer of the manufacturing processes for a large part of our active pharmaceutical ingredient requirements to our manufacturing facility in India. The benefits of this transfer include reduced product manufacturing costs and supply assurance. We have begun to realize the benefits from the easing of supply pressures, and the market share of betapharm in Germany has recovered to 2.6% in December 2008, as compared to a low of 1.74% in April 2007, according to Insight Health, a company which provides information on the German pharmaceutical industry, in its NVI market report for December 2008.
In August 2008, Allgemeinen Ortskrankenkassen (“AOK”), a large German health insurance company, announced a competitive bidding (or “tender”) process for pharmaceutical companies for 64 products for 2009 and 2010. In this tender, betapharm has been offered 8 products translating to 33 contracts. The results of this tender, which were announced in December 2008, have been put on hold, as these are being litigated by the drug manufacturers and are subject to process reviews. We believe that ongoing health care reforms and changing market dynamics, in terms of a move to a commoditized environment, will continue to cause pressure on price realization of our product portfolio in Germany. We are monitoring the developments closely to take suitable actions to ensure that we remain competitive.
In India, Operations Research Group International Medical Statistics (“ORG IMS”) in its December 2008 MAT report has noted that the Indian pharmaceutical market continues to be highly fragmented and dominated by Indian companies. The industry recorded retail sales of approximately U.S.$7 billion (Rs.341 billion), representing a growth in value of 9.8% over the previous year on a MAT basis. According to such ORG IMS report, the Indian pharmaceutical market is projected to grow at 12-14% per annum between 2008 and 2020, achieving a terminal market value of U.S.$30 billion. The major growth influencers will be population dynamics, high disease prevalence, increased health care access, changing health care models and greater capacity to spend.
According to ORG IMS in its December MAT 2008 report, the market share of the No. 1 ranked Indian retail sales pharmaceutical company was approximately 5%. In this competitive scenario, we are the 13th ranked Indian pharmaceutical company, with a market share of 2.2%. However our growth for the nine months ending December 31, 2008 was below the industry growth rate, largely due to a change in our supply chain model to a replenishment based model.
In Russia, we continue to match the industry growth rate in the retail segment. According to Pharmexpert, a market research firm, in its April-November 2008 report, we grew by 25%, as compared to a market growth rate of 27% in Russia for such period. We are the fastest growing international branded generic company by sales volumes in Russia, and we grew by 16% as compared to the industry decrease of 1% for such period. In the Pharmexpert MAT report for the quarter ending December 31, 2008, we are ranked No. 15 in sales in Russia, with a market share of 1.4% for the quarter ending December 31, 2008. We also consolidated our new hospitals and over the counter product businesses, which account for slightly more than 25% of our Russian revenues and which are supplementing the growth led by our prescription business.
We continue to experience high growth from the countries in the former Soviet Union, Venezuela, Jamaica and Sri Lanka through existing products and new product launches.
Pharmaceutical Services and Active Ingredients
In this segment, we are focused on acquiring new customers and increasing our level of engagement with existing customers in global key markets by marketing additional products from our product portfolio. We are also focused on identifying unique product opportunities in key markets and protecting them through patenting strategies.
In this segment, we also market process development and manufacturing services to customers primarily consisting of innovator pharmaceutical and biotechnology companies with an objective to become their preferred partner of choice. The focus is to leverage our skills in process development, analytical development, formulation development and Current Good Manufacturing Practice (“cGMP”) manufacturing to serve the customer’s needs.
As of December 31, 2008, we had a pipeline of 335 drug master filings (“DMFs”), of which 138 were in the United States. With patent expirations in several markets in the next few years, we intend to promote growth in fiscal 2010 and beyond by leveraging our strong intellectual property expertise and DMF pipeline. The success of our products in our key markets is contingent upon the extent of competition in the generics market, and we anticipate that such competition will continue to be significant.
62
For this segment, our revenues for the nine months ending December 31, 2008 grew by approximately 13% and the growth was mainly led by the active pharmaceutical ingredients division as well as the acquisition of the Dow Pharma Unit. However, the business catering to the innovator pharmaceutical and biotechnology companies did not register any growth due to the slowdown of orders from biotechnology customers and the current global macro-economic factors.
Proprietary Products
Our investments in research and development of new chemical entities (“NCEs”) have been consistently focused towards developing promising therapeutics. Strategically, we continue to seek licensing and development arrangements with third parties to further develop our pipeline products. As part of our research program, we also pursue collaborations with leading institutions and laboratories all over the world.
Currently, we have a pipeline of 2 NCEs in clinical development and 1 in pre-clinical development. These compounds are being developed in partnership with Nordic Bioscience, ClinTec International and Argenta Discovery. As we make progress in advancing our pipeline through various stages of clinical development we are also building capabilities in drug development. We believe this will help to enhance the value of our NCE assets. We expect to further complement our internal research and development efforts by pursuing strategic partnerships and alliances in our key focus areas.
Building a specialty branded business in the United States was one of the important aspects of our innovation strategy. The specialty business has launched its own sales and marketing operations for in-licensed products in the dermatology therapeutic area in the United States while continuing to work on development of new in-house products. This is the result of our continued efforts over the last few years to establish this business through a combination of in-licensing initiatives as well as internal pipeline development programs. Consequently, through our subsidiary Promius Pharma, we launched “Epiceram”, our first dermatology prescription product in the United States, in October 2008. In January 2009, Promius Pharma launched our second dermatology prescription product “Scytera”. While initially we do not anticipate this to be a very significant business in terms of financial parameters, it is an important step in our journey of building a business based on proprietary products.
63
ITEM 6. EXHIBITS
64
Exhibit Number Description of Exhibits 99.1 Independent Auditors’ Report on Review of Unaudited Condensed Consolidated Interim Financial Information
SIGNATURES
Pursuant to the requirements of the Securities Exchange Act of 1934, the registrant has duly caused this report to be signed on its behalf by the undersigned, thereunto duly authorized.
65
DR. REDDY’S LABORATORIES LIMITED
(Registrant)
Date: March 12, 2009 By: /s/ V.S. Suresh Name: V.S. Suresh Title: Company Secretary
Exhibit 99.1
Independent Auditors’ Report on Review of Unaudited Condensed Consolidated Interim Financial Information
The Board of Directors and Stockholders Dr. Reddy’s Laboratories Limited 7 – 1 – 27 Ameerpet Hyderabad — 500 016
Introduction
We have reviewed the accompanying unaudited condensed consolidated interim balance sheet of Dr. Reddy’s Laboratories Limited (“the Parent Company”) and its subsidiaries (collectively, “the Company”) as at December 31, 2008, and the related unaudited condensed consolidated interim income statement for the three month and nine month period then ended, and unaudited condensed consolidated interim statement of changes in equity and unaudited condensed consolidated interim cash flow statement for the nine month period then ended, and a summary of significant accounting policies and other explanatory notes (“the unaudited condensed consolidated interim financial information”). Management is responsible for the preparation and presentation of this unaudited condensed consolidated interim financial information in accordance with International Accounting Standard 34 (“IAS 34”), “Interim Financial Reporting”. Our responsibility is to express a conclusion on this unaudited condensed consolidated interim financial information based on our review.
Scope of Review
We conducted our review in accordance with the International Standard on Review Engagements 2410, “Review of Interim Financial Information Performed by the Independent Auditor of the Entity”. A review of interim financial information consists of making inquiries, primarily of persons responsible for financial and accounting matters, and applying analytical and other review procedures. A review is substantially less in scope than an audit conducted in accordance with International Standards on Auditing and consequently does not enable us to obtain assurance that we would become aware of all significant matters that might be identified in an audit. Accordingly, we do not express an audit opinion.
Conclusion
Based on our review, nothing has come to our attention that causes us to believe that the accompanying unaudited condensed consolidated interim financial information as at December 31, 2008 is not prepared, in all material respects, in accordance with IAS 34, “Interim Financial Reporting”.
Emphasis of matter
We draw attention to Note 22 to the unaudited condensed consolidated interim financial information regarding significant uncertainties in the market conditions relating to the Company’s German operations. These uncertainties primarily relate to the final outcome of a sales tender which, as more fully explained in the aforesaid note, has the potential of loss of market share in Germany. Management believes that since the ultimate outcome of this matter is not under its control, the consequent impairment charge, if any, on certain intangibles and goodwill (having aggregate carrying amount of Rs.33,230 million as at December 31, 2008) cannot be reasonably determined at present.


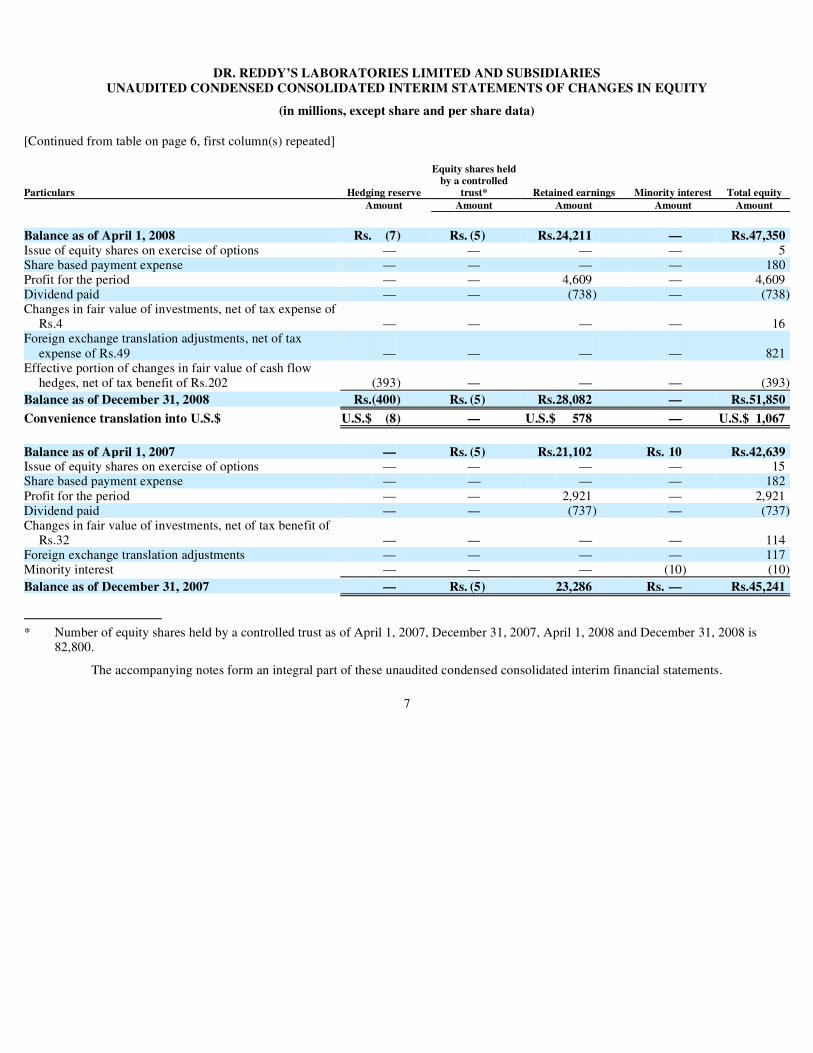

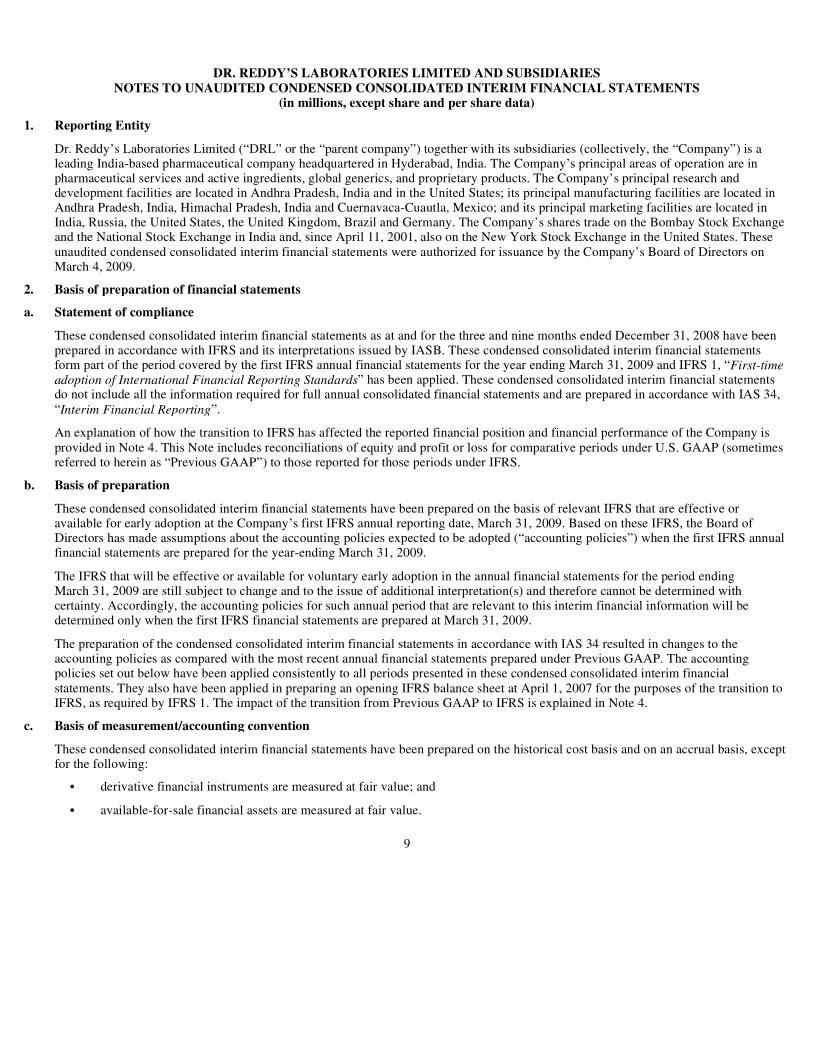


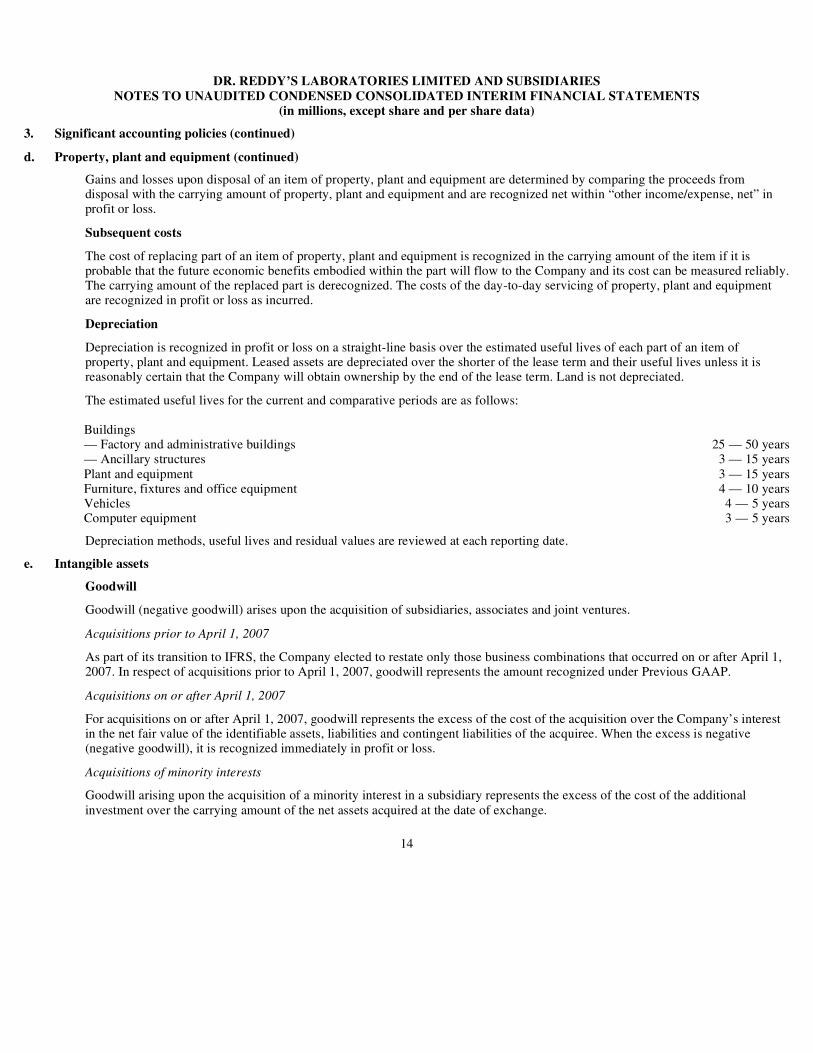


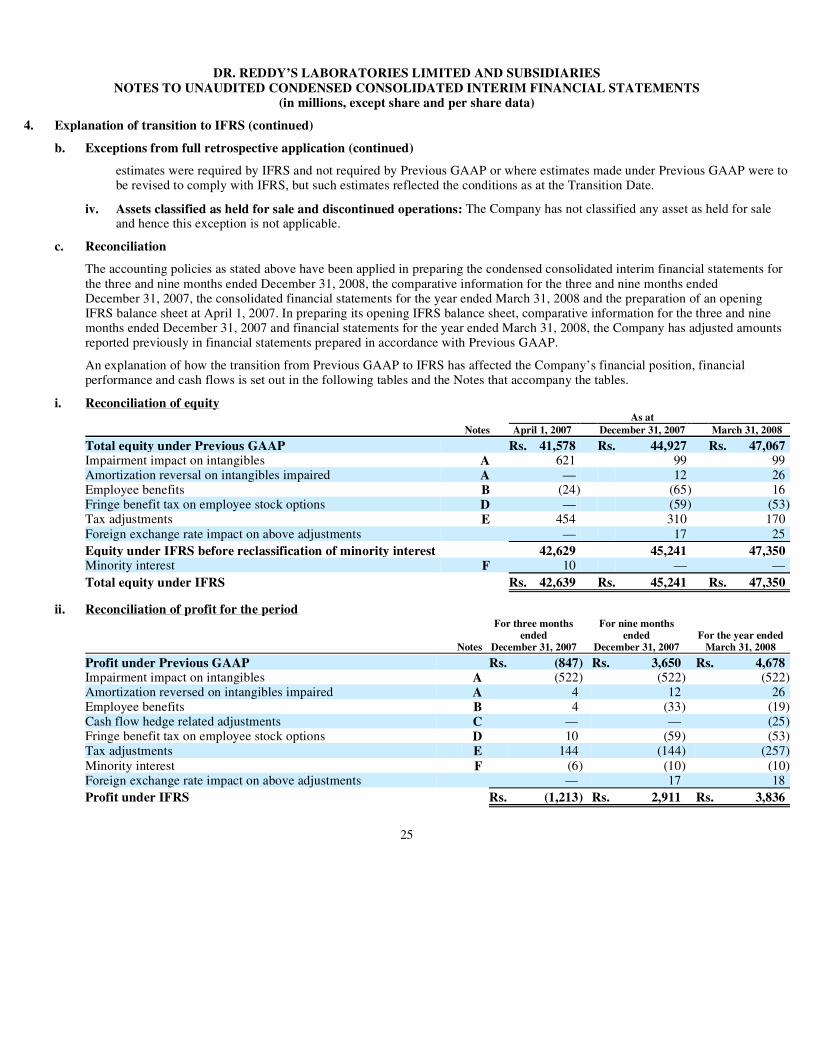
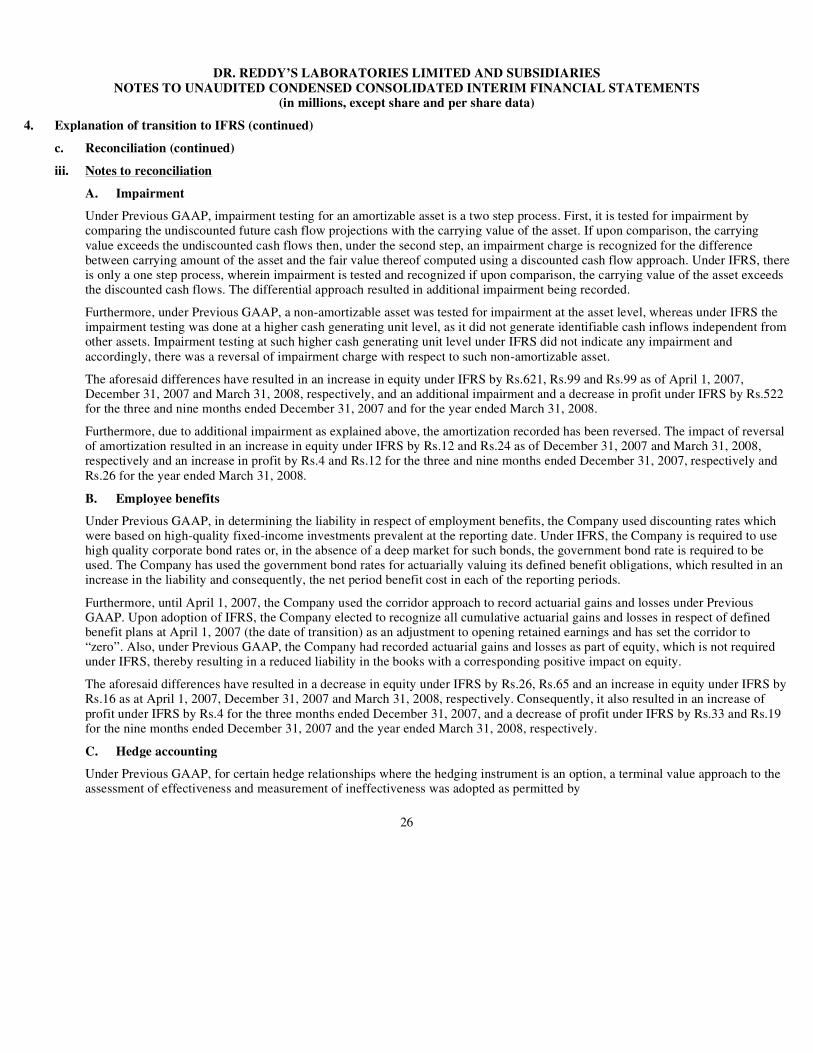


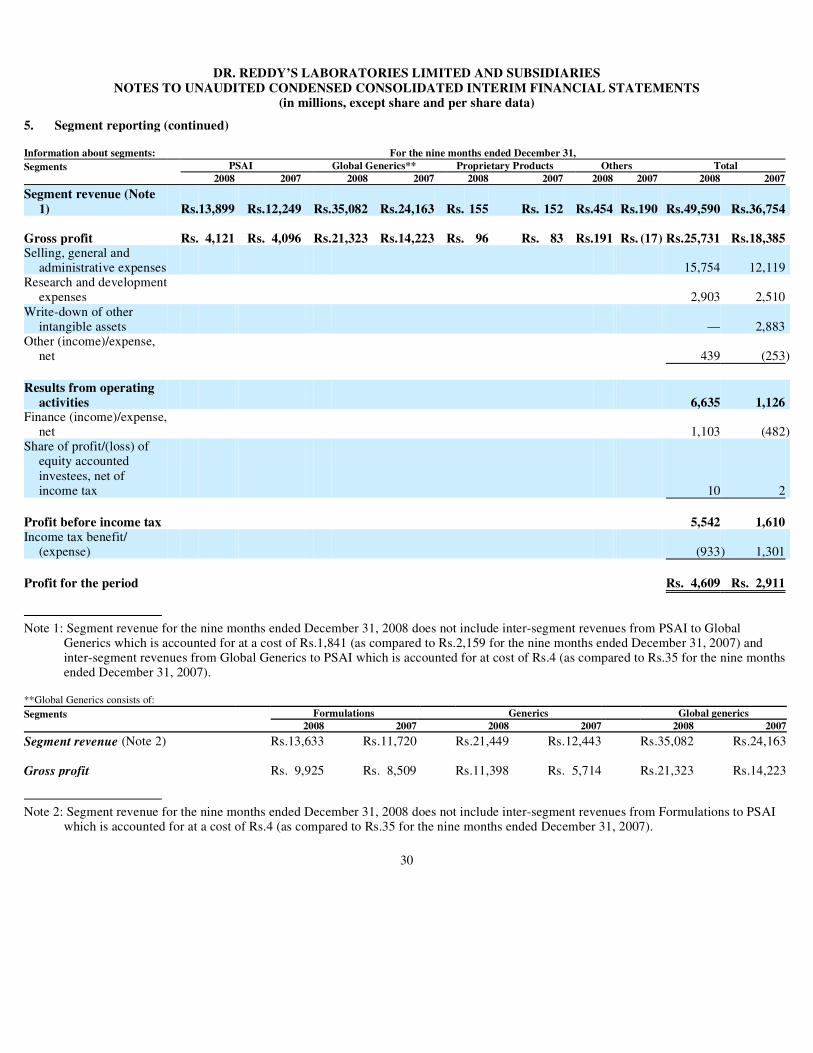

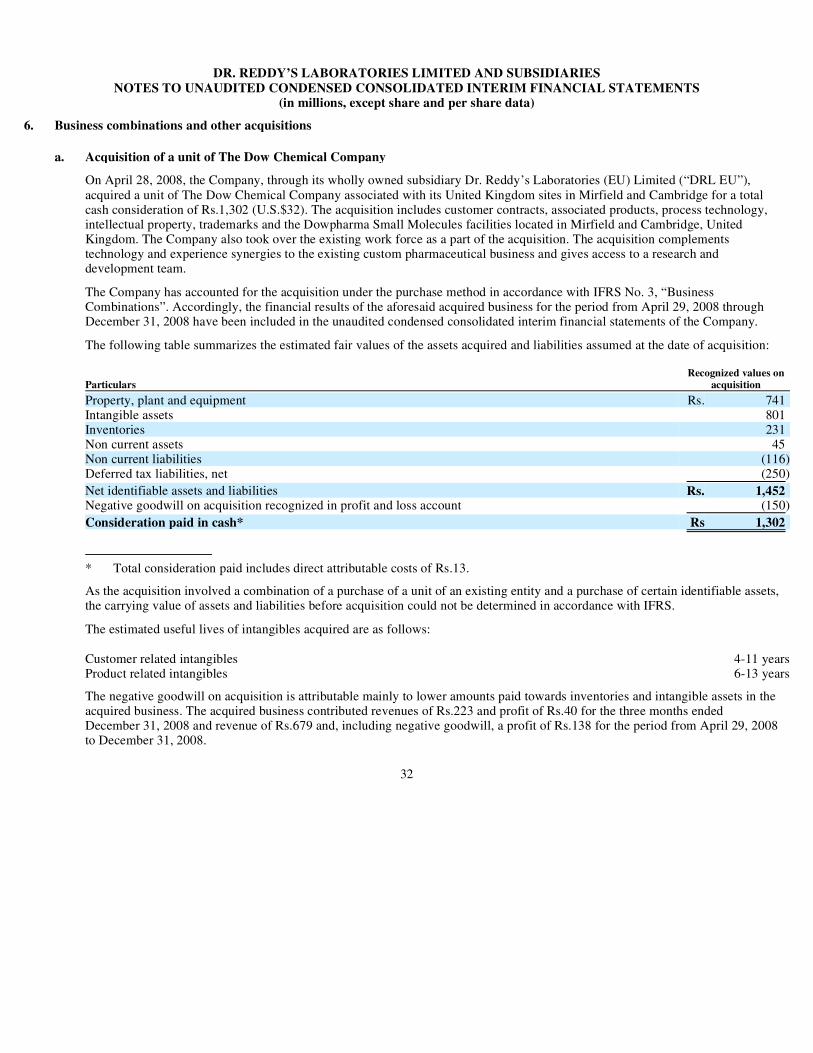
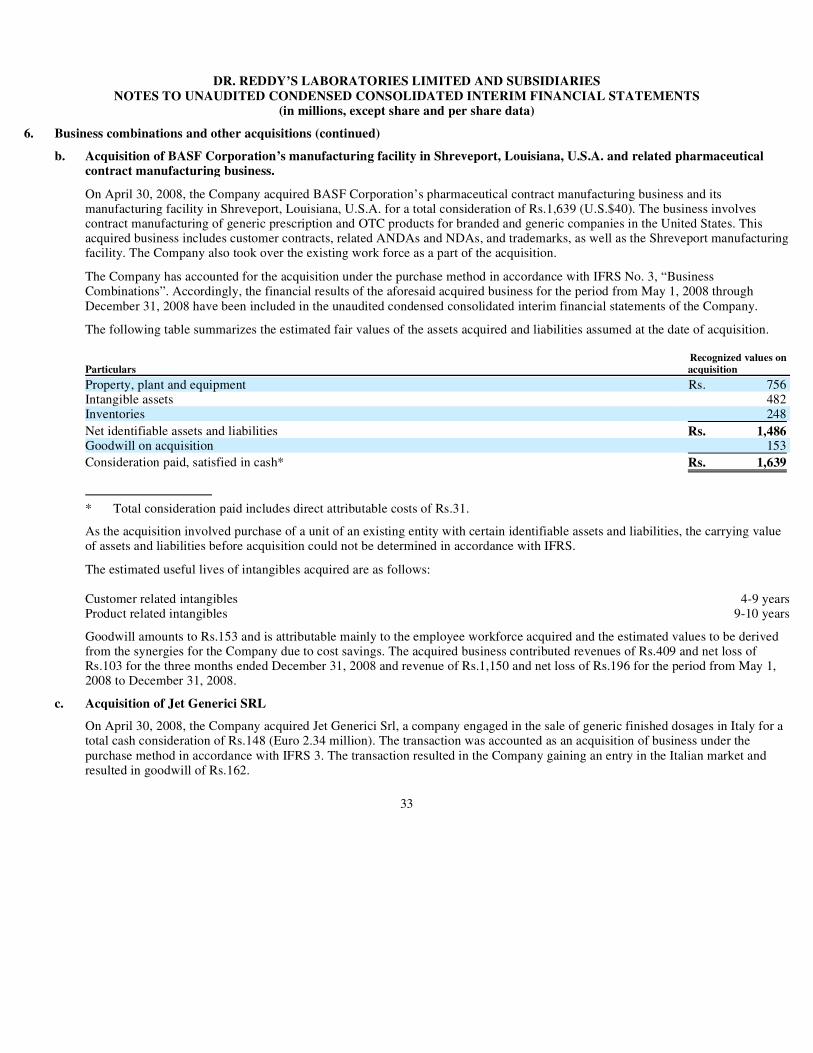
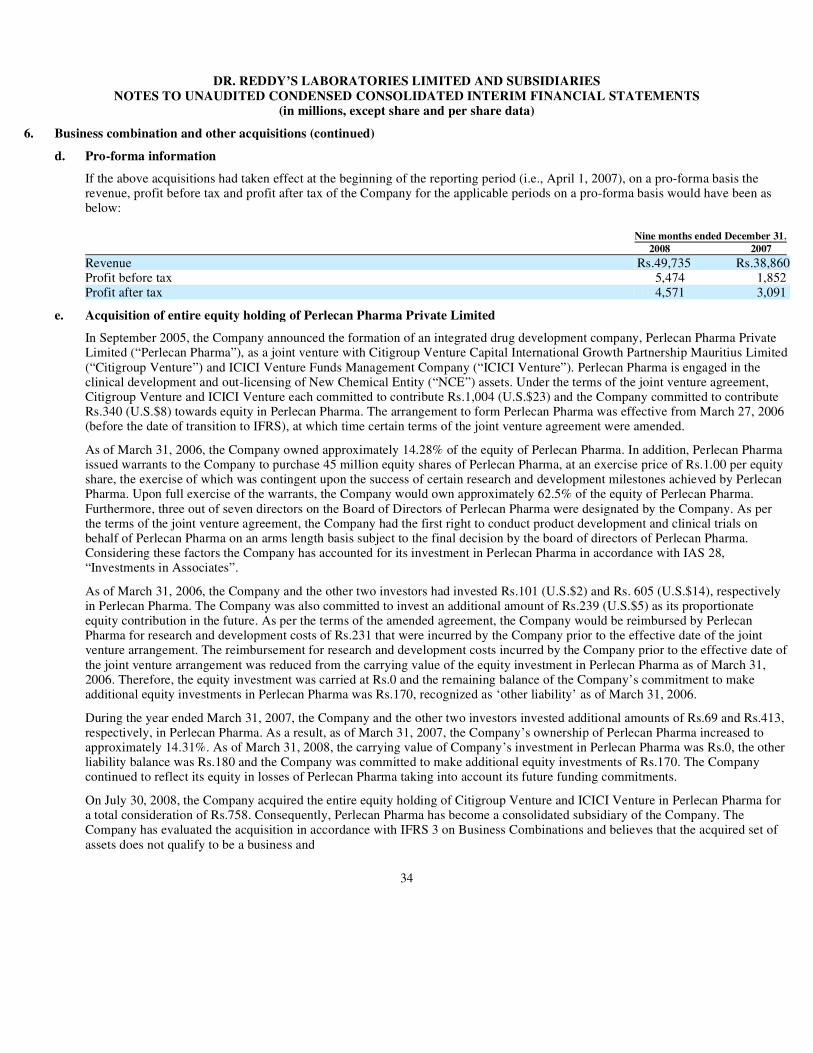


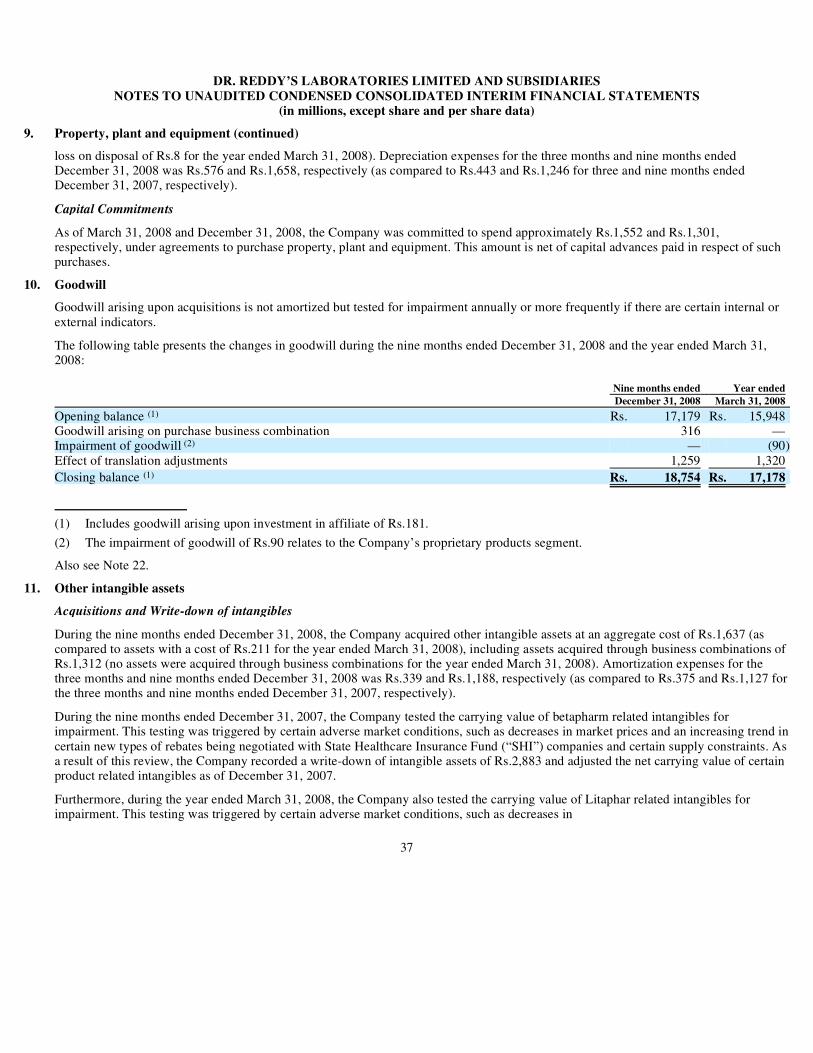

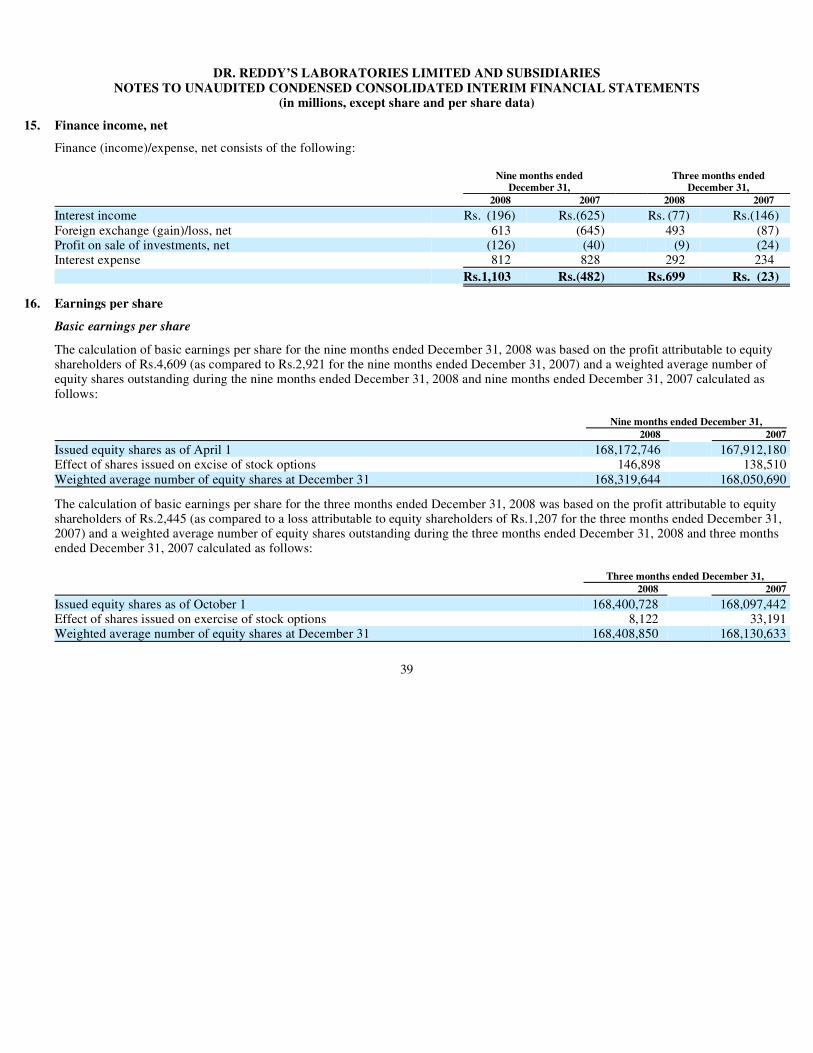
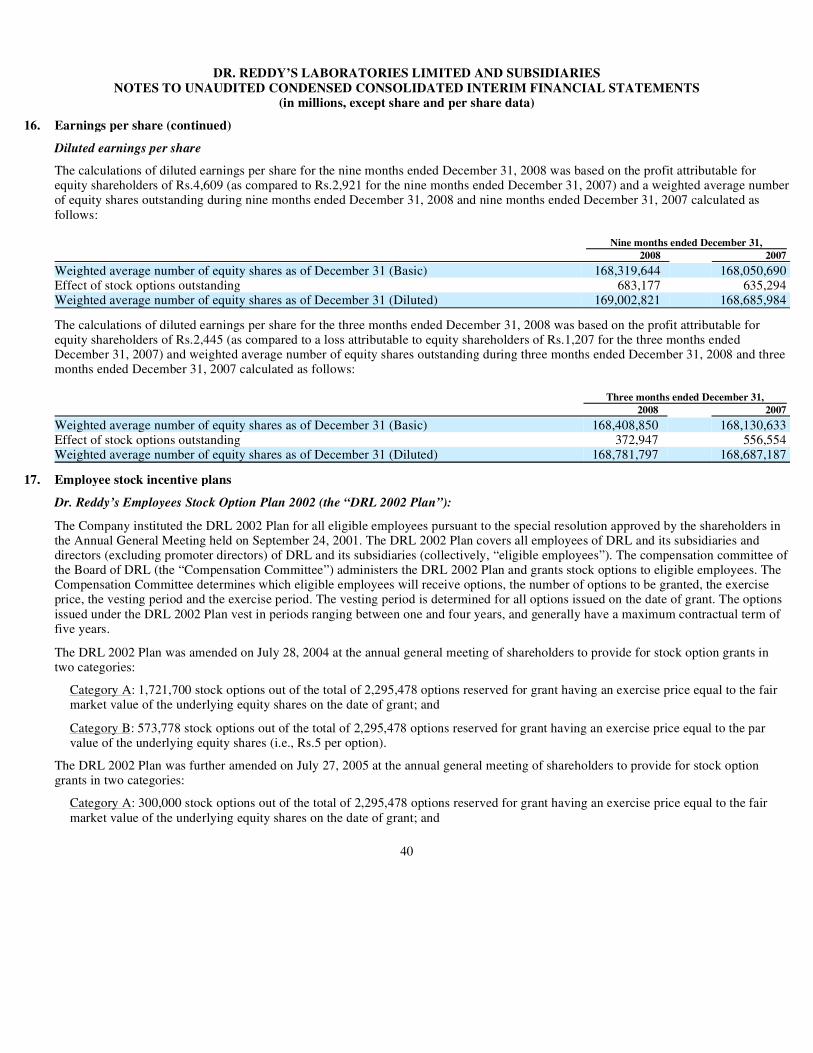


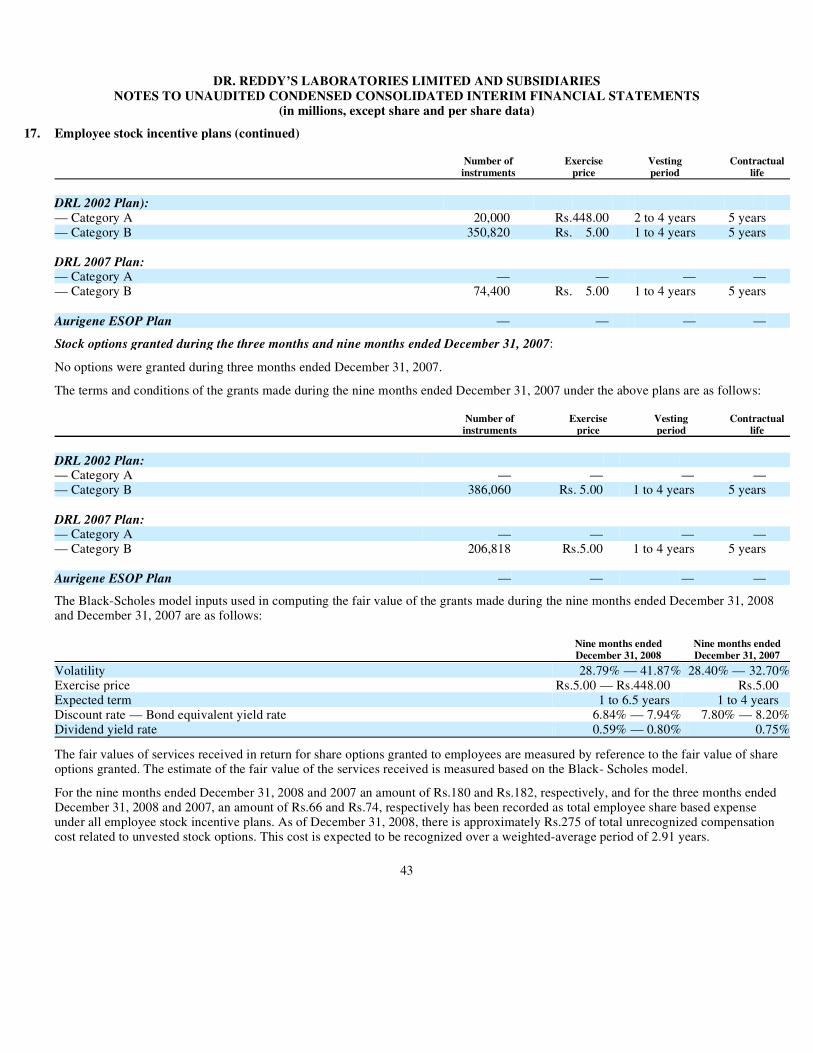
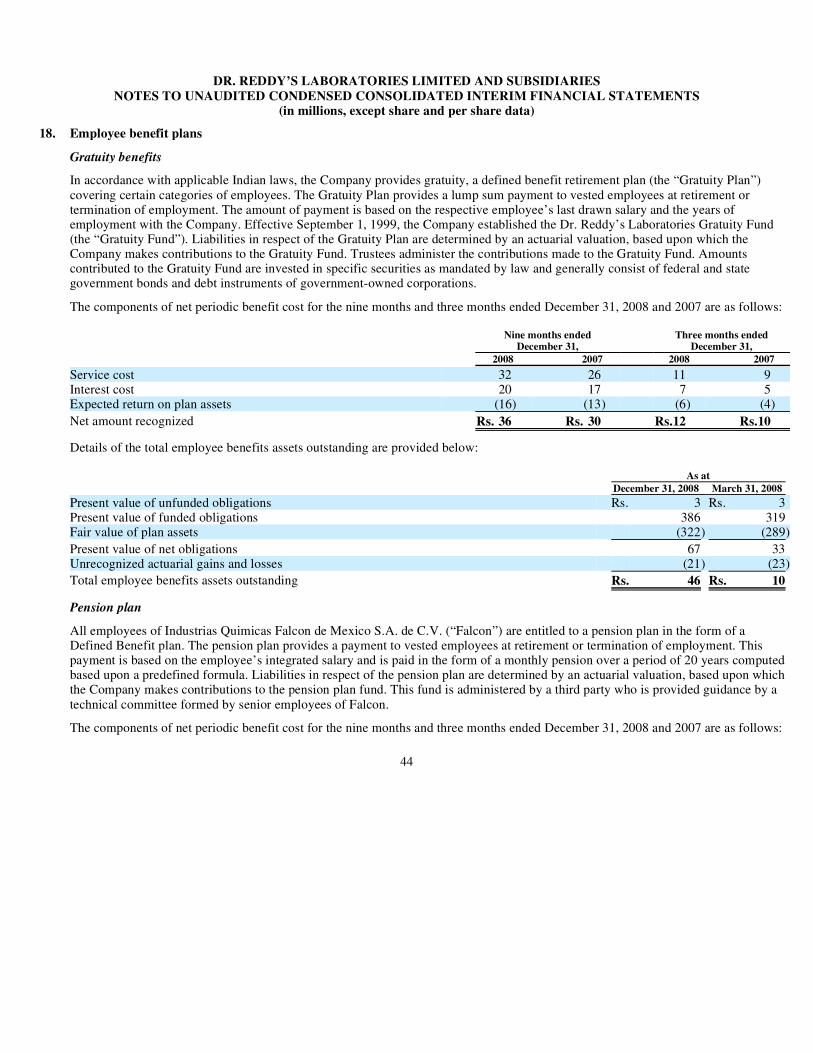
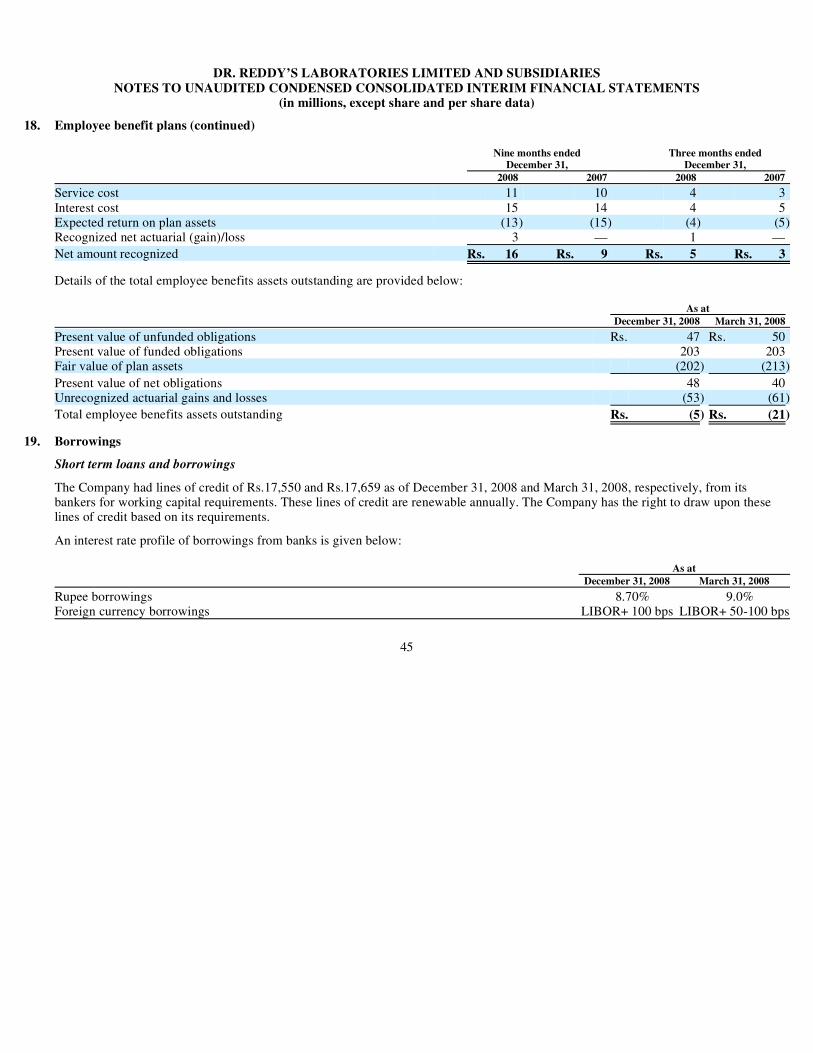


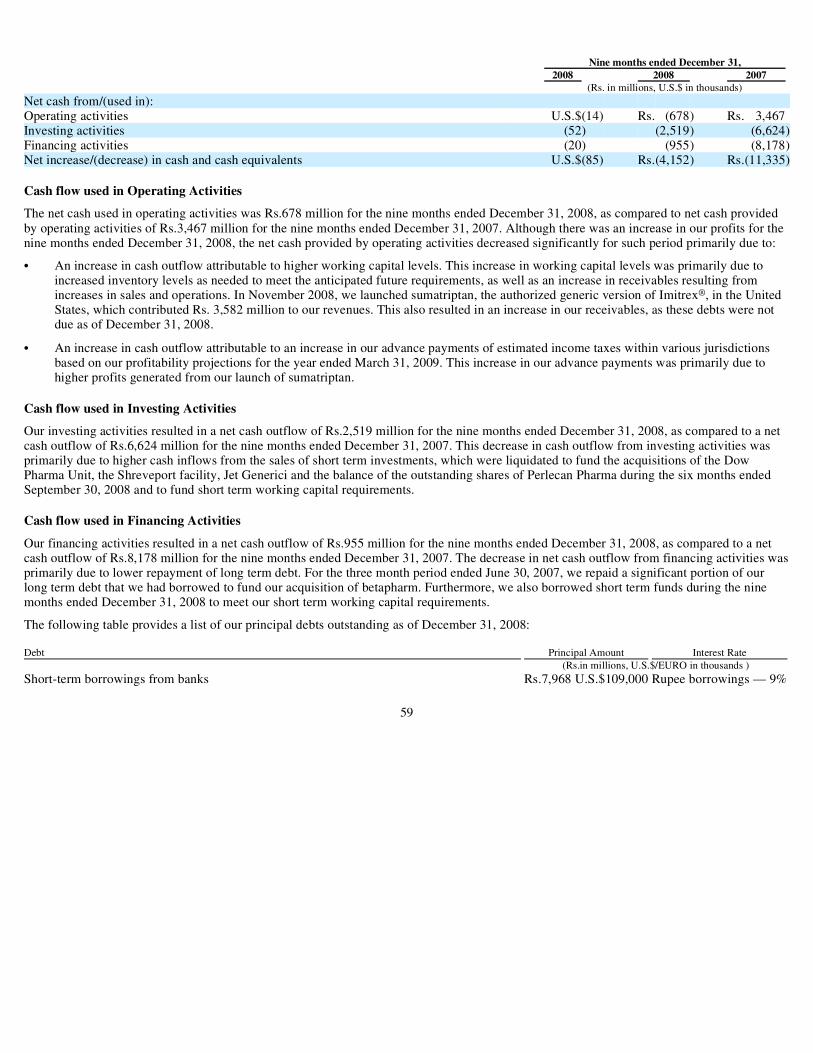
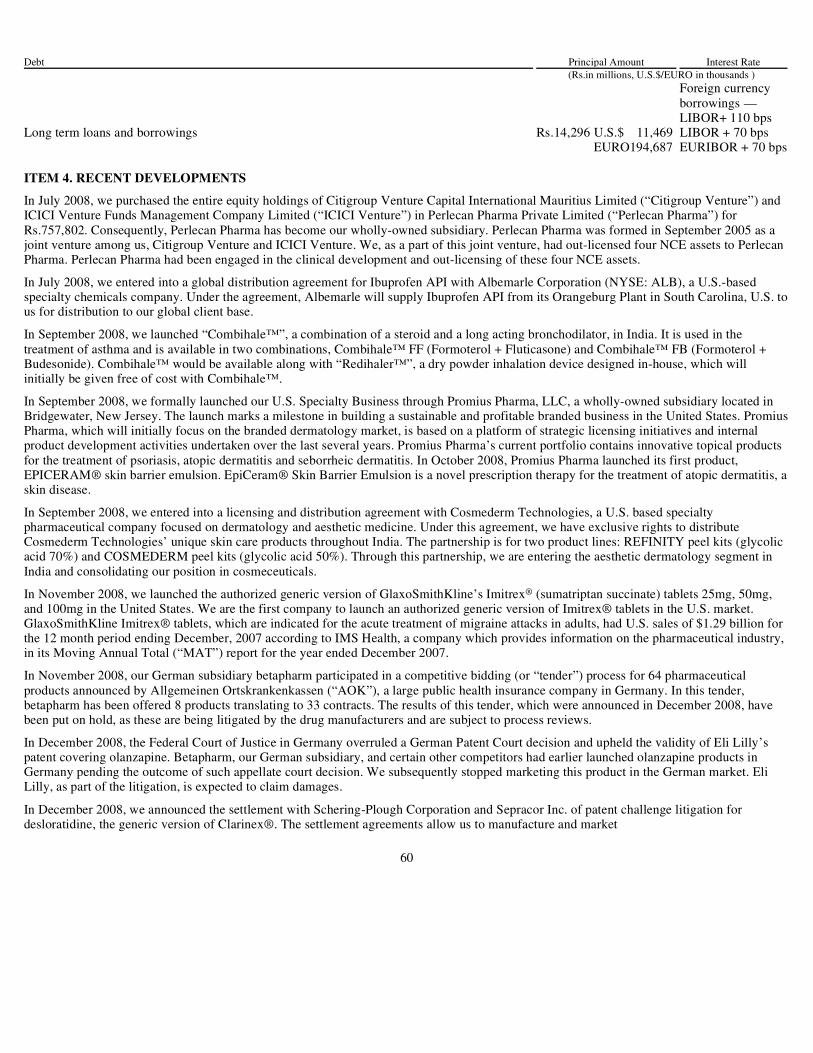


![[Deutsche Bank] Depositary Receipts Handbook](https://static.documents.pub/doc/80x56/577d2f891a28ab4e1eb1fe3f/deutsche-bank-depositary-receipts-handbook.jpg)


