42
Dr. Roy K. Dokka Department of Civil and Environmental Engineering Louisiana State University Baton Rouge, LA 1 Deformation Monitoring ormation Monitoring
| Date post: | 15-Dec-2015 |
| Category: |
Documents |
| Upload: | sydnee-clay |
| View: | 214 times |
| Download: | 0 times |
Dr. Roy K. DokkaDepartment of Civil and Environmental EngineeringLouisiana State UniversityBaton Rouge, LA
1
Deformation MonitoringDeformation Monitoring

What is Deformation and why do we need to monitor it?
de⋅for⋅ma⋅tion
–noun 1. the act of deforming; distortion; disfigurement. 2. the result of deforming; change of form, esp. for
the worse. 3. an altered form. 4. Geology, Mechanics. a change in the shape or
dimensions of a body, due to stress; strain.
It is change, and not all change is good!

Hazards Associated with Natural SystemsFaults and seismicityVolcanismSubsidence and resulting coastal and
flooding.
Management of the Built EnvironmentBridgesDamsHighwaysFlood protection systems and flood maps
Geodetic networksIntegrity validation and monitoring.
Flavors of Deformation Monitoring
But how do we measure change?
First, a preamble.
“How we measure the world defines how well we can understand it”
Quotes to Remember
“If you can’t measure it properly, you will never understand it”
An example . . .

Both methods can measure time.
But why then do we use a stopwatch to clock the race?

In fact, the stopwatch is 8,640,000 times more precise than the calendar.
1 day = 24hours x 3600 sec./hr x 100 hundredths of a second/sec.
1 day = 24 x 3600 x 100 = 8.64 x 10⁶
The measurement resolution we needto determine the winner
Take Away: Your measuring tool needs to match the process causing the movement
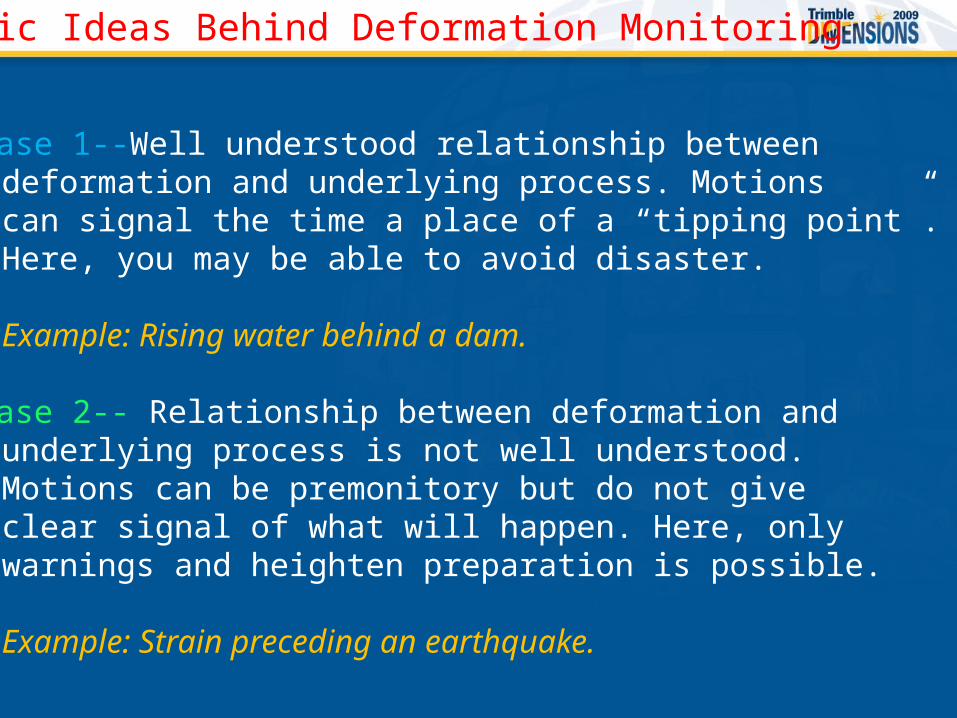
Basic Ideas Behind Deformation Monitoring
• Case 1--Well understood relationship between deformation and underlying process. Motions can signal the time a place of a “tipping point”. Here, you may be able to avoid disaster.
Example: Rising water behind a dam.
• Case 2-- Relationship between deformation and underlying process is not well understood. Motions can be premonitory but do not give clear signal of what will happen. Here, only warnings and heighten preparation is possible.
Example: Strain preceding an earthquake.
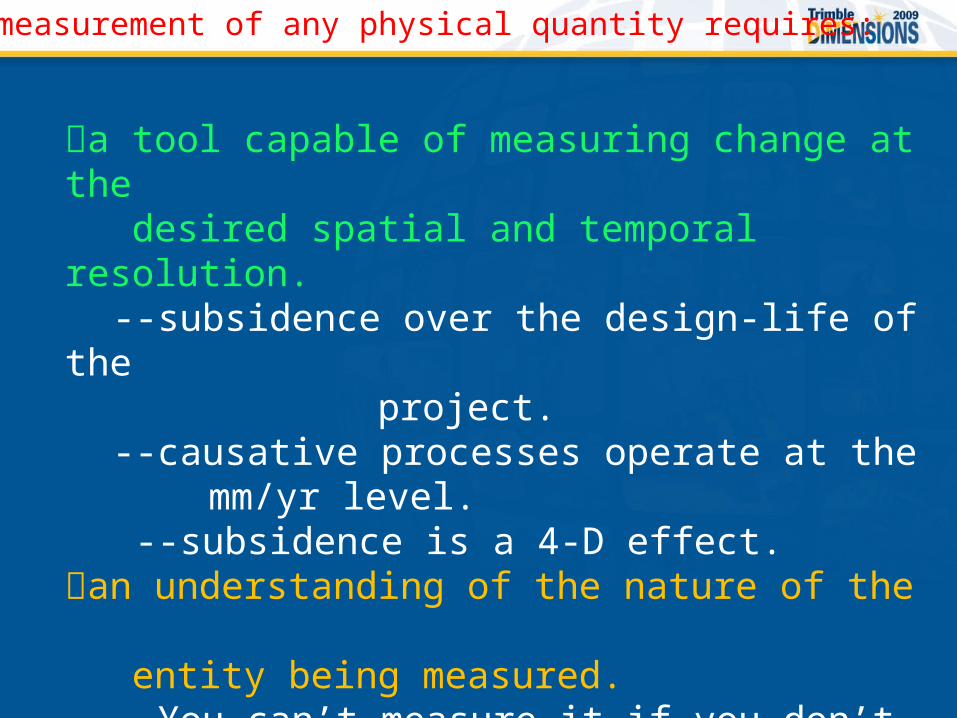
The measurement of any physical quantity requires:
a tool capable of measuring change at the desired spatial and temporal resolution.
--subsidence over the design-life of the project.
--causative processes operate at the mm/yr level.
--subsidence is a 4-D effect.an understanding of the nature of the entity being measured.
--You can’t measure it if you don’t under- stand it. You need sufficient domain
knowledge so you can develop an effective sampling strategy.

Example: The Deformation and its Effects of Subsidence
in South Louisiana
• Subsidence: the sinking of the land with respect to a datum.
• 1900 sq. mi. of the Louisiana coast hasdisappeared since 1930.
• This affects everything, communities, levees,wetlands, pipelines, navigation on river, . .
• And the Geodetic Reference network!• This affects areas outside Louisiana in terms
oil and gas, river commerce, disasters.
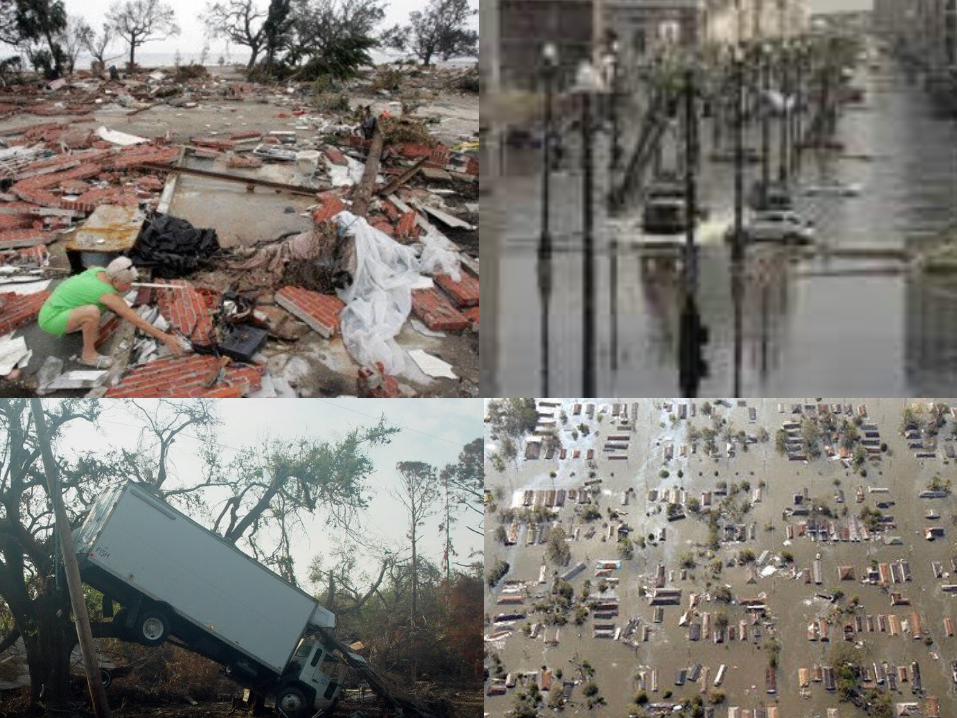
Hurricanes Katrinaand Rita
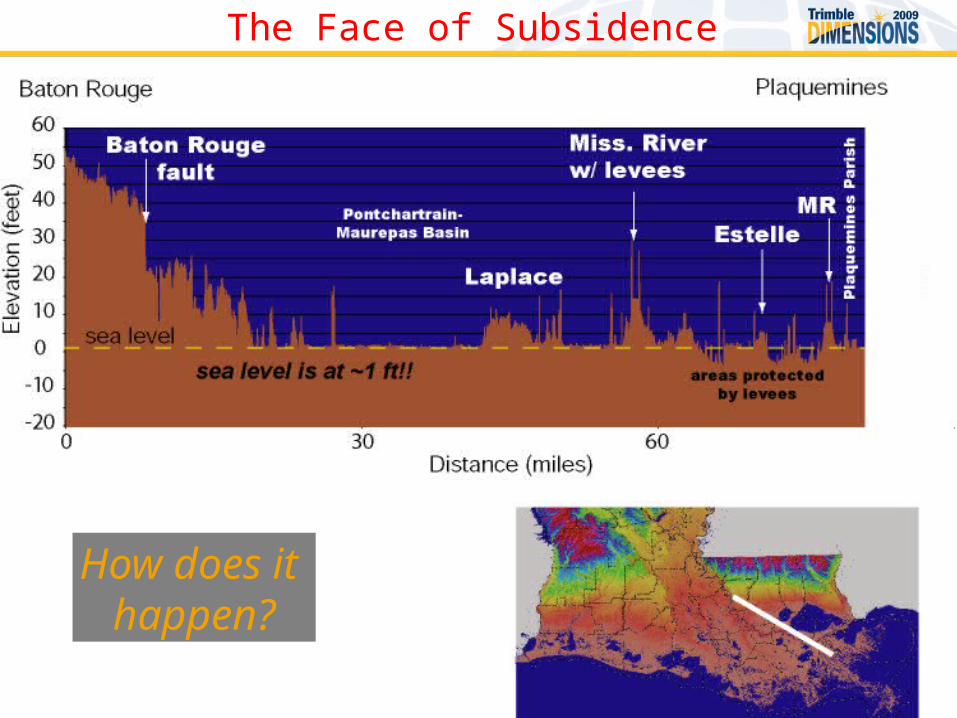
The Face of Subsidence
How does it happen?

13
Dying Coast 2008
River (+dams) levees block sediment and freshwater from reaching coast.Natural subsidence unrelenting.Stupid stuff people do.
Inundation 2075
Loss of south Louisiana wetlands
Island communities
Disrupted Mississippi River
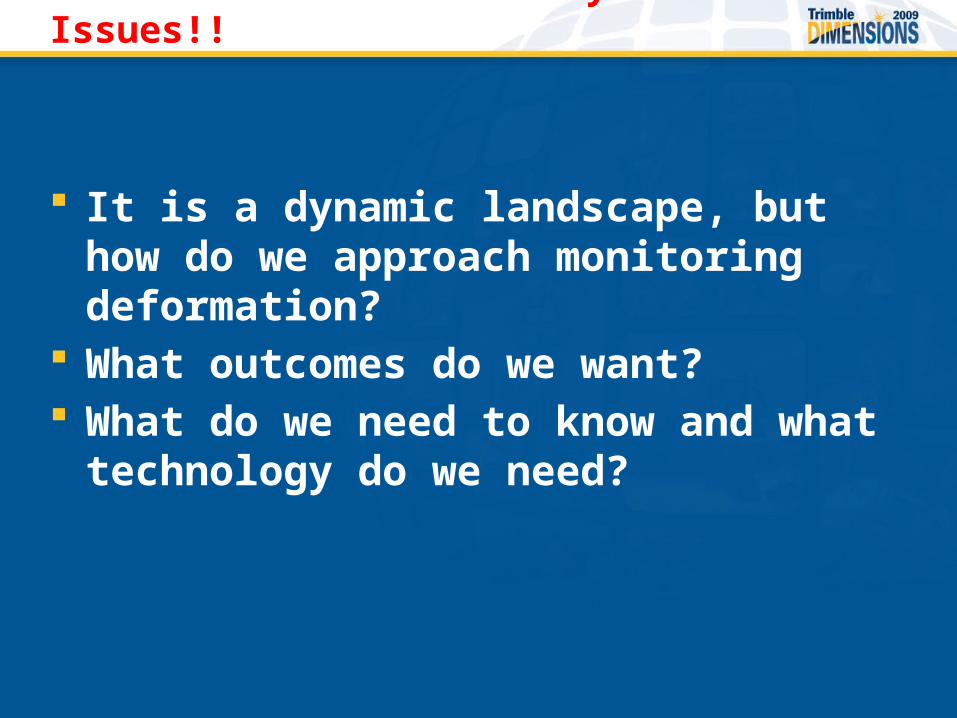
Coastal Louisiana Clearly Has Issues!!
It is a dynamic landscape, but how do we approach monitoring deformation?
What outcomes do we want? What do we need to know and what
technology do we need?
Why Monitor Subsidence?
• Everybody needs access to a 3-D datum. We need to understand how subsidence is changing that accessibility and figure out ways to overcome it. • Engineers, scientists, and planners need measurements that will help provide sufficient scientific insight into present and future subsidence to meet needs, i.e., hurricane protection, restoration, asset monitoring, etc.
• Domain knowledgeThe operative processes establish the requirements of measurement. • Measurement Method(s)
Define precision, accuracy, time-averaging, thereby establishing what processes
can be measured.• Monumentation
Determines how much of the total subsidence
signal you can measure; e.g., benchmarks and CORS do not “see” shallow processes.• Sampling Strategy
Determines what processes can be isolated and measured.
Subsidence Monitoring Basics

Let’s review the basic geological reality about modern landscape change in south Louisiana
The modern Mississippi River delta has evolved over last ~8,000 yrs.
Landscape is due to the interplay between subsidence, accretion, and global sea level rise. Flooding builds land by sediment deposition and stimulates wetlands biologic processes. Deltas cannot grow much above sea level.
The delta is composed of lobes that formed as the river shifted position with time. As a lobe was abandoned, accretion ceased yet the lobe continued to subside. Over time, the lobe is slowly inundated by the Gulf.
A load of ~120m of delta sediments and ocean have been added to the Earth’s crust since 18K years ago and would be expected to cause down-warping and gravitational instability.
Because such a landscape is not favorable for human habitation, levees were built by order of Congress to prevent flooding and to maintain Miss. River navigation. It has also had the unintended consequence of halting accretion. Subsidence, however, continues.
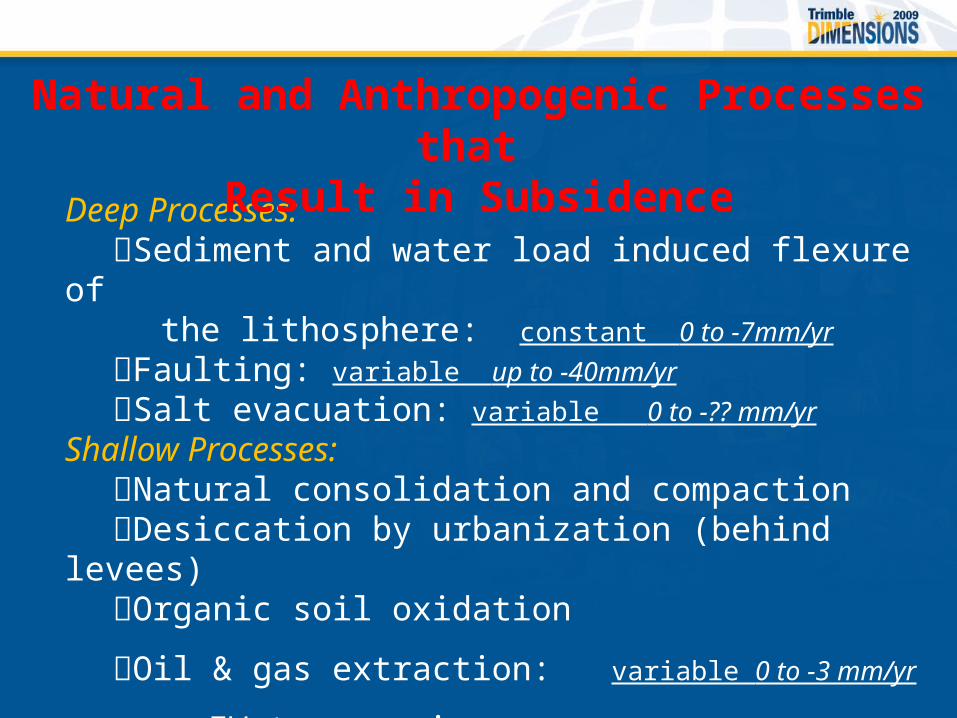
Deep Processes:Sediment and water load induced flexure of
the lithosphere: constant 0 to -7mm/yr
Faulting: variable up to -40mm/yr
Salt evacuation: variable 0 to -?? mm/yr
Shallow Processes: Natural consolidation and compaction Desiccation by urbanization (behind levees)
Organic soil oxidation
Oil & gas extraction: variable 0 to -3 mm/yr
Water pumping: variable up to -65mm/yr
Natural and Anthropogenic Processes that Result in Subsidence
© 2003 Louisiana State University
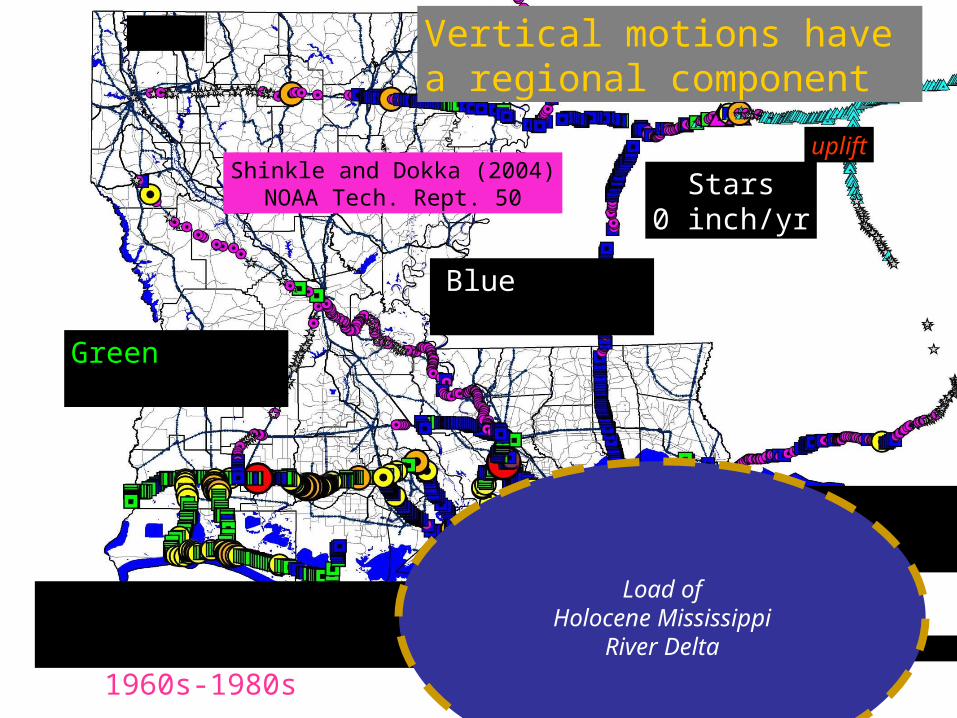
Green square-1/2 inch/yr
Stars0 inch/yr
uplift
stable
Coastal parishesavg. = ~-1/2 inch/yr
Yellow circle-3/4 inch/yr
Blue square-1/3 inch/yr
Load ofHolocene Mississippi
River Delta
Vertical motions have a regional component
Shinkle and Dokka (2004)NOAA Tech. Rept. 50
1960s-1980s

Loading explains some of the observations, but not all. Something else is going on.
Predicted present-day vertical motions in mm/yr from delta & ocean loads
GULFNet station at Cocodrie, LA
sinking 6.3 mm/yr
Ivins et al (2006)
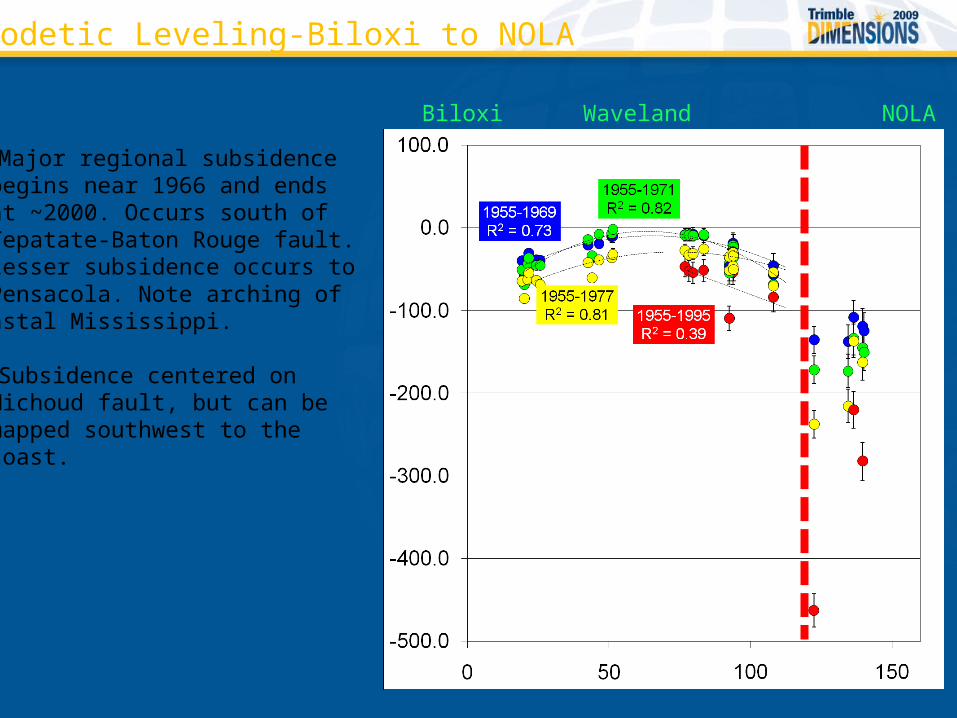
Geodetic Leveling-Biloxi to NOLA
Biloxi NOLA
• Major regional subsidence begins near 1966 and ends at ~2000. Occurs south of Tepatate-Baton Rouge fault. Lesser subsidence occurs to Pensacola. Note arching of coastal Mississippi.
• Subsidence centered on Michoud fault, but can be mapped southwest to the coast.
Waveland
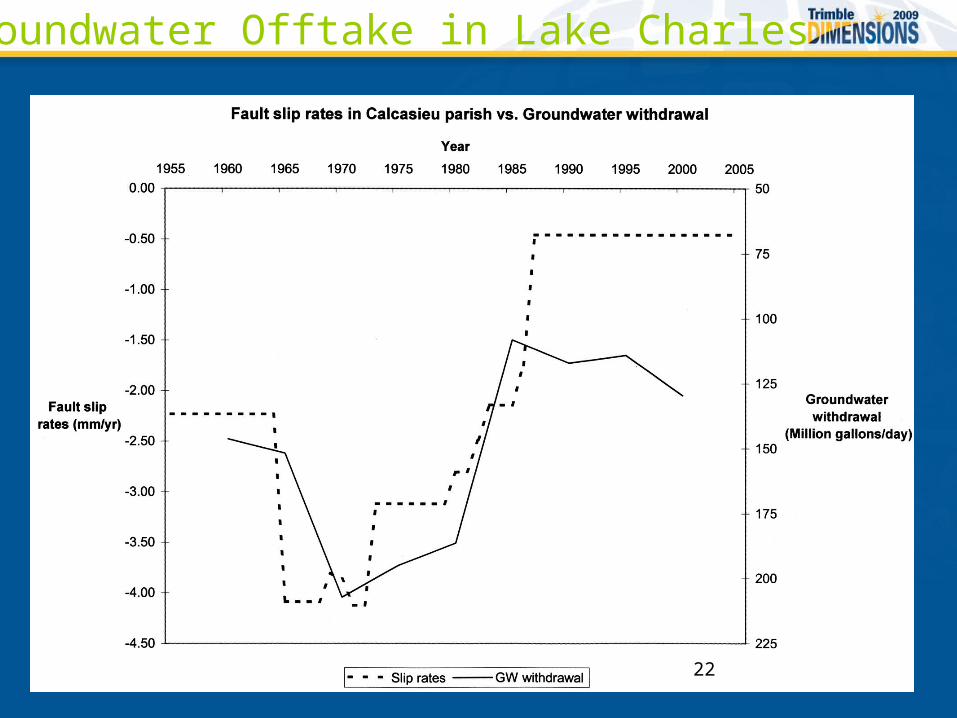
Groundwater Offtake in Lake Charles
22
Displacement
0
50
100
150
200
250
300
1980 1985 1990 1995 2000 2005 2010
Displacement
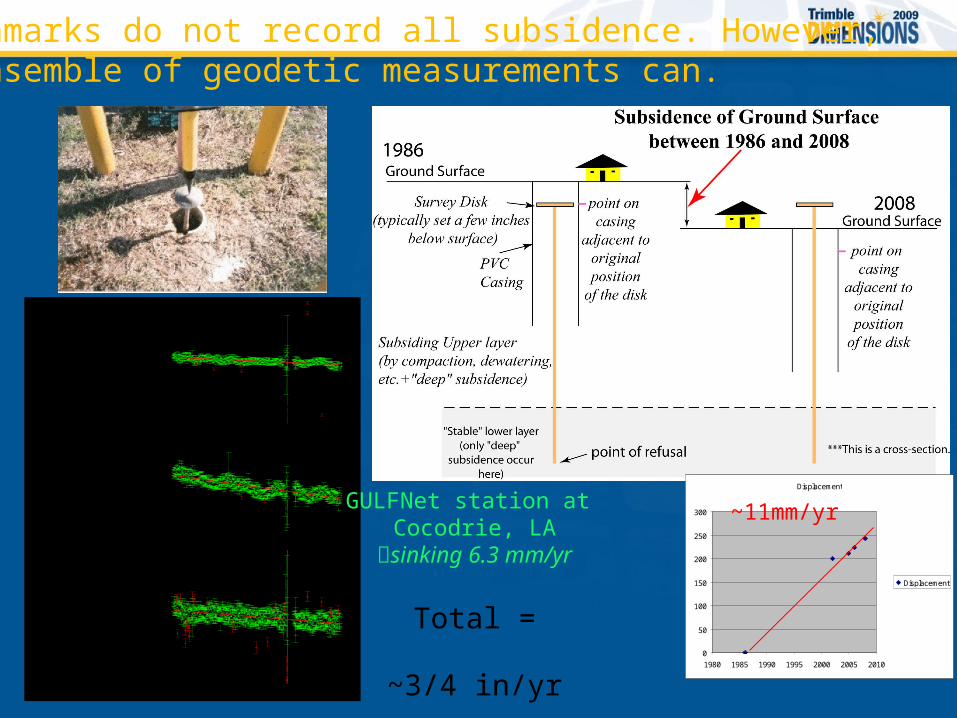
Benchmarks do not record all subsidence. However, an ensemble of geodetic measurements can.
~11mm/yrGULFNet station at Cocodrie, LA
sinking 6.3 mm/yr
Total =
~3/4 in/yr
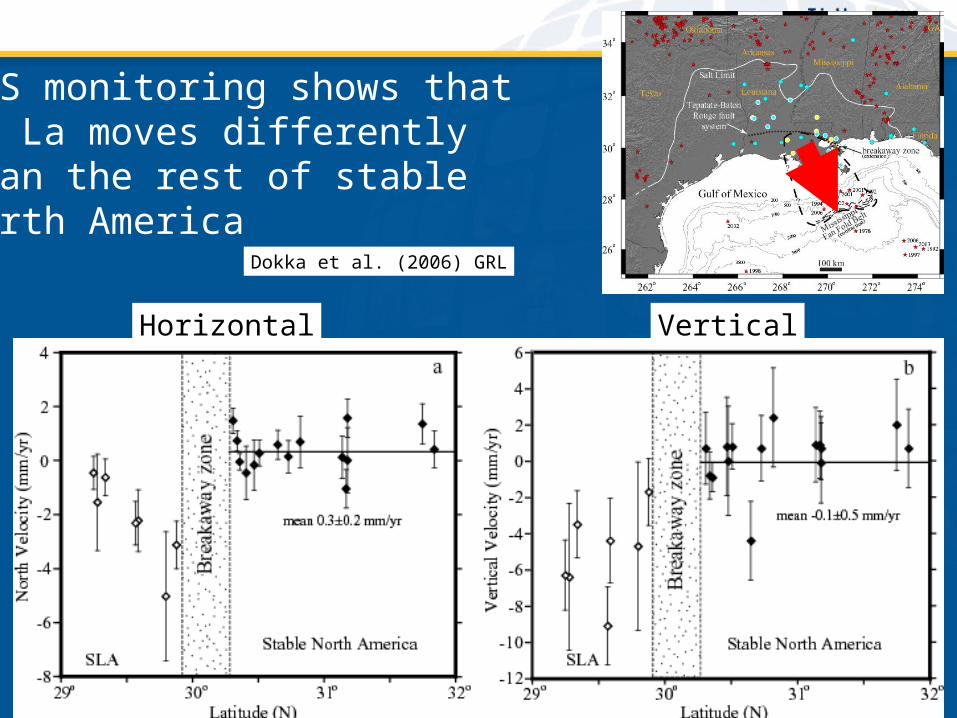
GPS monitoring shows that SE La moves differently than the rest of stableNorth America
Dokka et al. (2006) GRL
Horizontal Vertical
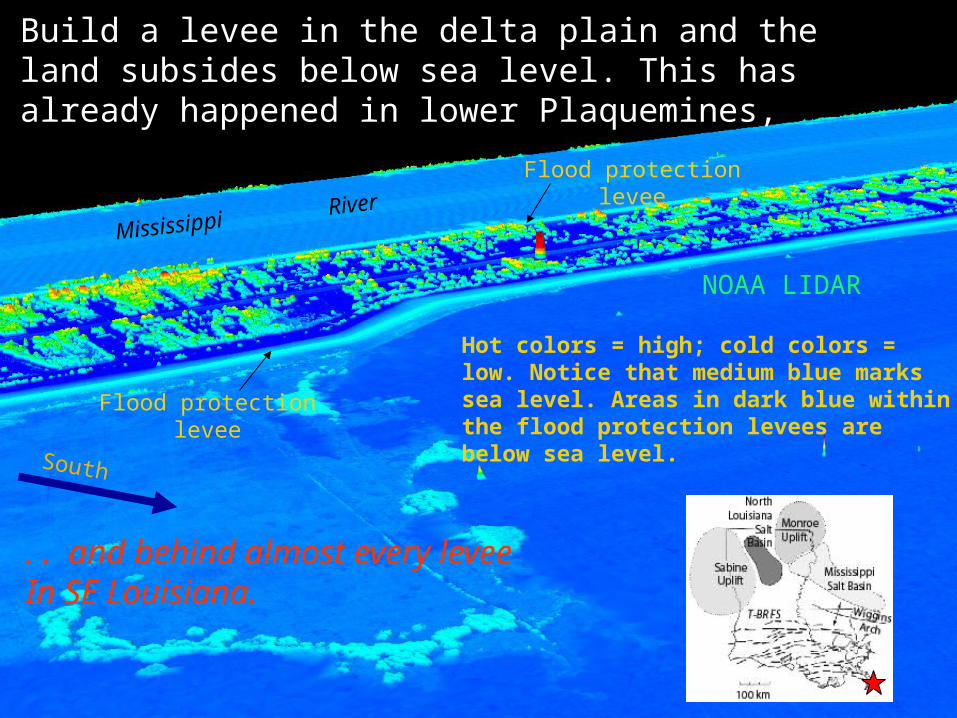
Hot colors = high; cold colors = low. Notice that medium blue marks sea level. Areas in dark blue within the flood protection levees are below sea level.
Flood protection levee
Flood protection levee
Build a levee in the delta plain and the land subsides below sea level. This has already happened in lower Plaquemines,
Mississippi River
South
NOAA LIDAR
. . and behind almost every leveeIn SE Louisiana.
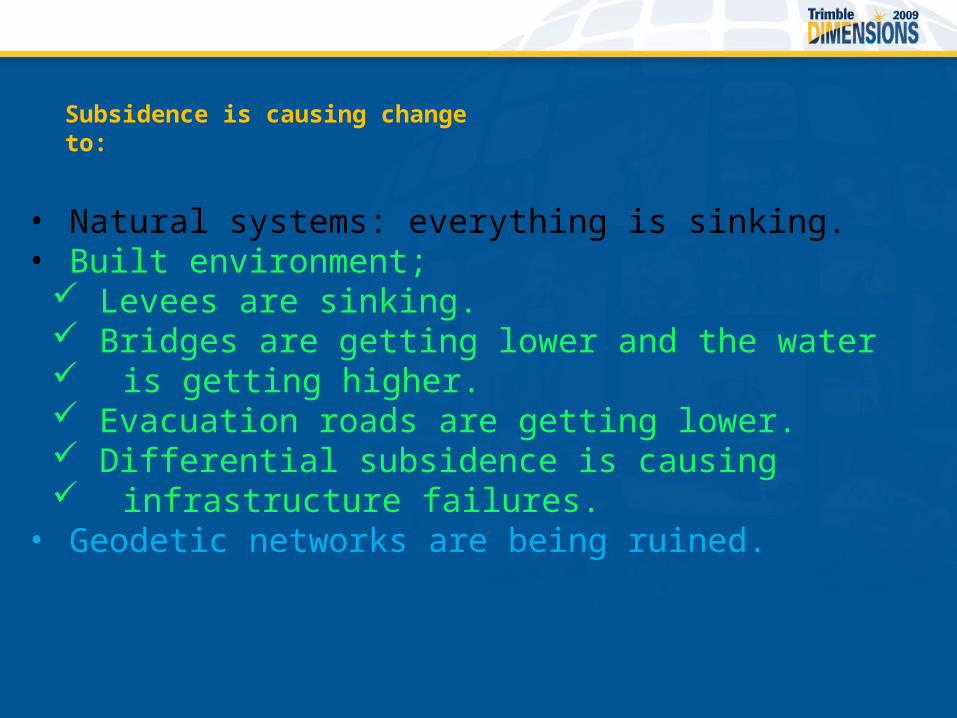
Subsidence is causing change to:
• Natural systems: everything is sinking.• Built environment;
Levees are sinking. Bridges are getting lower and the water is getting higher. Evacuation roads are getting lower. Differential subsidence is causing infrastructure failures.
• Geodetic networks are being ruined.
y = 0.0195x + 159.62
R2 = 0.0041
y = -0.00000379x2 + 0.29014540x - 4124.49366974
-500.00
0.00
500.00
1000.00
1500.00
2000.00
2500.00
3000.00
1-Jan-1959
31-Dec-1968
1-Jan-1979
31-Dec-1988
1-Jan-1999
31-Dec-2008
Year
Ve
rtic
al D
isp
lac
em
en
t (m
m)
01Jan1959-31Dec1966
01Jan1967-20Aug2008
Linear (01Jan1959-31Dec1966)
Poly. (01Jan1967-20Aug2008)
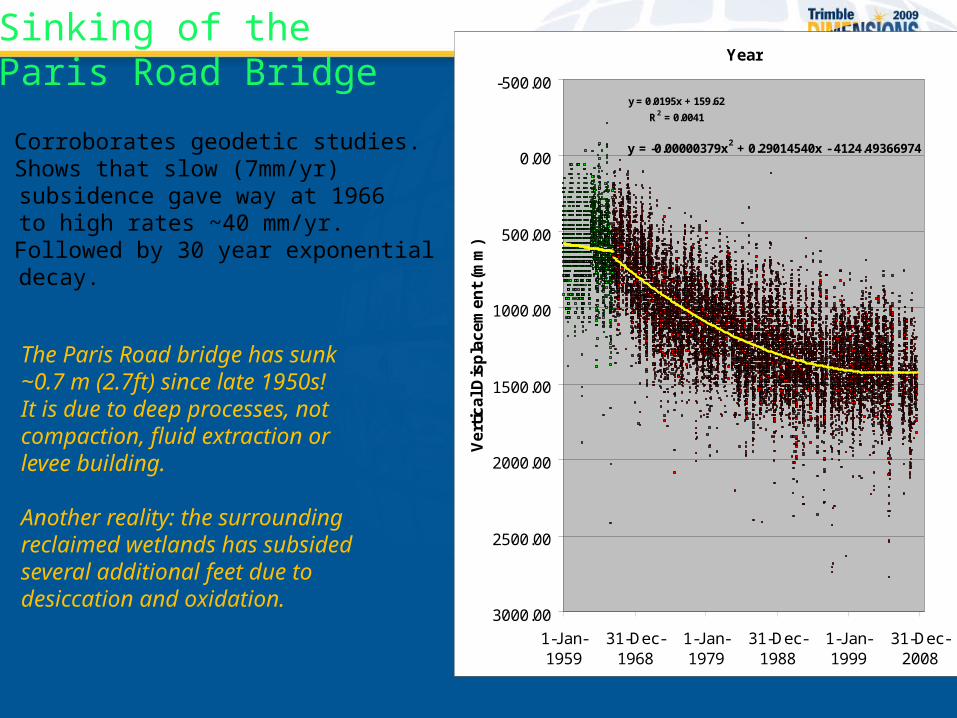
• Corroborates geodetic studies.• Shows that slow (7mm/yr) subsidence gave way at 1966 to high rates ~40 mm/yr. • Followed by 30 year exponential decay.
Sinking of the Paris Road Bridge
The Paris Road bridge has sunk ~0.7 m (2.7ft) since late 1950s! It is due to deep processes, not compaction, fluid extraction or levee building.
Another reality: the surrounding reclaimed wetlands has subsided several additional feet due todesiccation and oxidation.
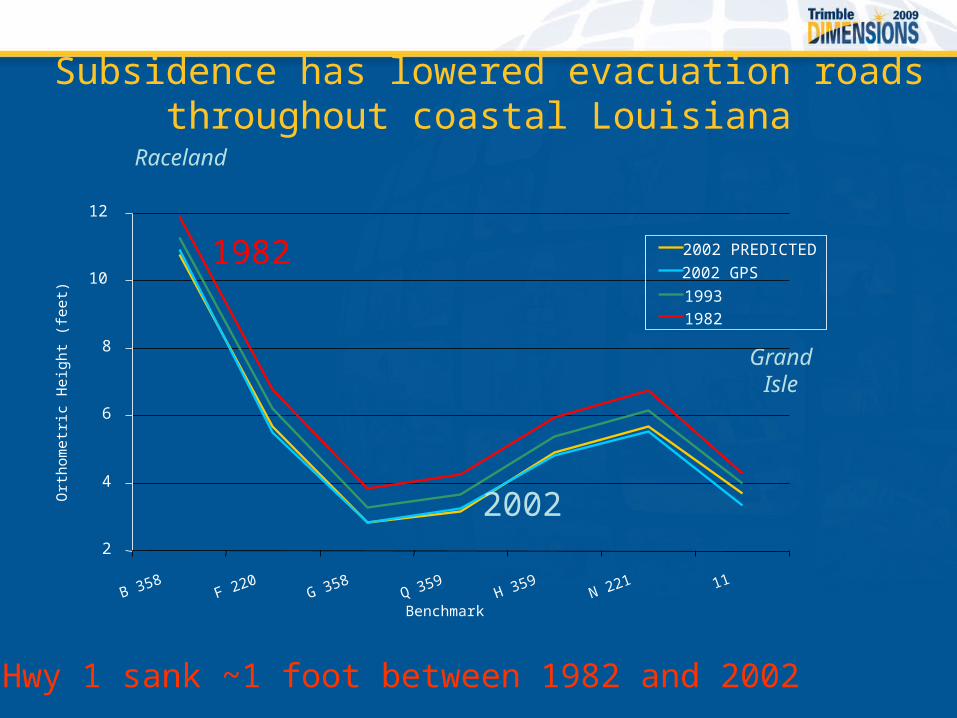
GrandIsle
Raceland
La Hwy 1 sank ~1 foot between 1982 and 2002
Subsidence has lowered evacuation roadsthroughout coastal Louisiana
2
4
6
8
10
12
B 358F 220
G 358Q 359
H 359N 221 11
Benchmark
Ort
hom
etri
c H
eigh
t (fe
et)
2002 PREDICTED
2002 GPS
1993
1982
1982
2002
NOAA told the U.S. Congress that Louisiana in 2001 that the system used to measure elevations was,
Subsidence has ruined the Geodetic Networks along the Gulf Coast
Subsidence has ruined the Geodetic Networks along the Gulf Coast
“inaccurate and obsolete and unable tosupport public safety.”
Monitoring Subsidence—Reference Perspective
• Build a network based on NGS CORS. They will maintain coordinates for you• Densify with additional reference
stations.• Establish and maintain coordinates with TIM. Keep in step with NGS through MAD (Mutually Assured Discussion).• Strengthen network integrity by establishing Gulf Coast-wide super-network consisting of other Trimble networks.
Monitoring Subsidence—User Perspective
The issue you want resolved will determine your measurement needs.
There are two issues to be resolved in coastal Louisiana:
• Designing, building and maintaining the Hurricane Protection System (HPS) to protect coastal communities against relative sea level rise and storms.
• Planning for the future and monitoring coastal restoration.
The HPS issue is straightforward.
• Design of the HPS is based on desired outcomes and modified by reality.
Politics shape the desired outcomes.Technical issues reveal the reality. Storm surge
and wave analysis are major tools for design. • Design requires accurate vertical control for:
Accurate topo/bathy for modeling.Construction requires access to vertical control.Annual measurement of HPS to prove viability.
• Status: Vertical control is provided by LSU GULFNet CORS
and GULFNet RTN. GULFNet RTN is used by USACE to measure the
HPS each year.

Horiz. Error =1 cm,Vert. = 2 cm,
EVERYWHERE!When NGS Grav-Dcompleted, users
can get 2 cmorthometric heights
LSUGULFNet
RTN
Based on National CORS, the most reliable component of the National Spatial Reference System in Louisiana.
Implemented in all of Louisiana.

RTN Real-Time NetworkBased on Trimble VRS technology
“Positioning anywhere,any time”
Cellular device toconnect user toInternet and LSUGULFNet RTN
Kinematic mode:+ 0.3 ft (1 sec.)
Relative vertical:+ 2 cm (3 min.)
Native output in “CORS 2002” but can easilybe put in 2004.65 context through calibration.
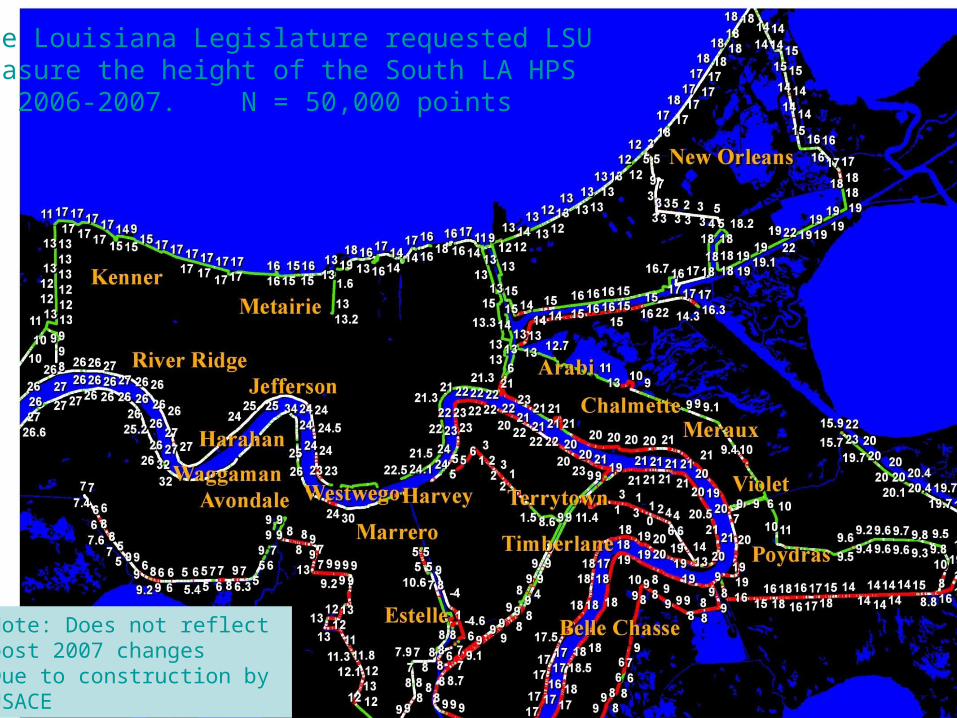
The Louisiana Legislature requested LSUmeasure the height of the South LA HPSin 2006-2007. N = 50,000 points
Note: Does not reflect post 2007 changes Due to construction by USACE
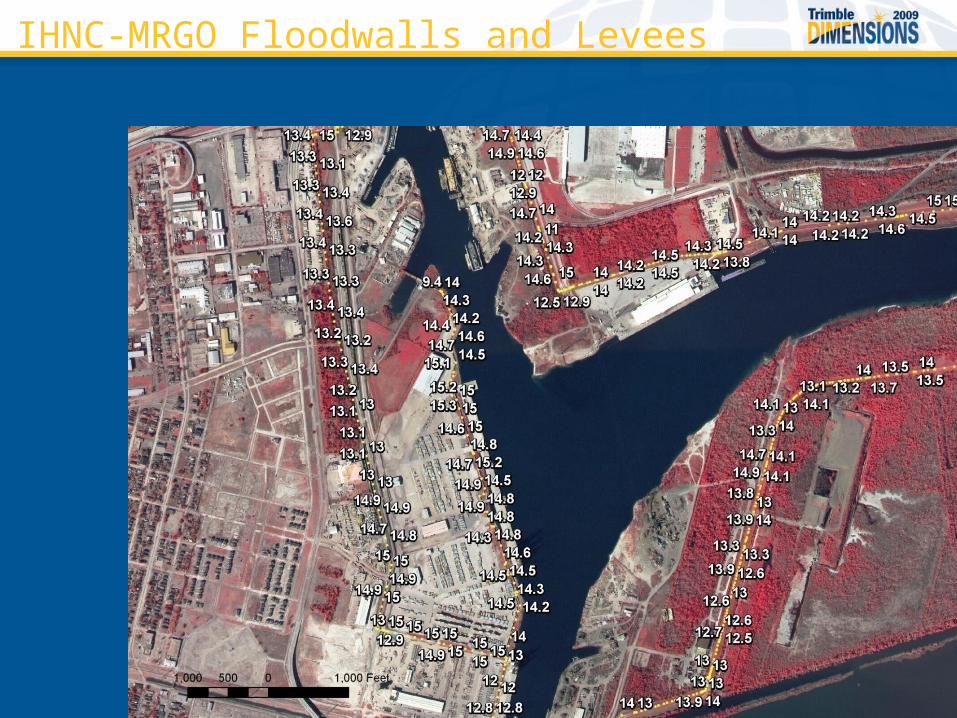
IHNC-MRGO Floodwalls and Levees

Building levees speeds upcompaction, but may be the only way to provideprotection
Cloverly Plantation~8 ft of subsidence
in 75 years
Golden Meadow
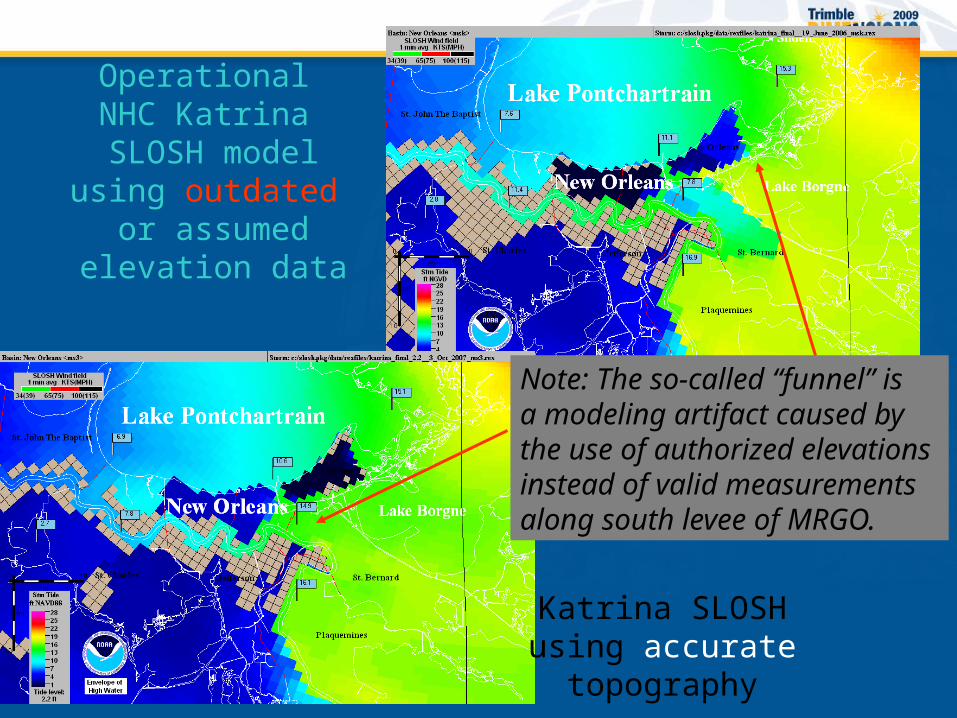
Operational NHC Katrina SLOSH modelusing outdated
or assumedelevation data
Katrina SLOSHusing accurate
topography
Note: The so-called “funnel” isa modeling artifact caused by the use of authorized elevations instead of valid measurementsalong south levee of MRGO.
Planning and Coastal Restoration will be greatly impacted by subsidence
The Big Question: Will Louisiana be viable for habitation after the combined relative sea level rise effects of subsidence and eustacy?
System to Support Planning (next 100 years):– Where and how much is the coast likely to subside?
Processes operate at mm/yr level.– How much will sea level rise? Occurs at mm/yr level.– How fast can the wetlands accrete?
System to Support Monitoring and Management– Need: mm/yr resolution. – Need: Everywhere and 4-D capability.– Need: Process identification.
How do you Maintain a Geodetic Network in a Area of Deformation?-- Issues to Remember
The datums in which we are usually interested are national or continent-scale in dimension. Deformation zones are regional to sub-regional.
Thus, you need to be able to connect your network to a POB(s) whose:
motion is independently known and,
coordinates are known. VTDP and HTDP are models, not observation.
Validation by monitoring is preferred. Monitoring of network integrity is essential: Trimble
Integrity Monitor, frequent network adjustments.
Take Aways Very few places are stable. Deformation is
everywhere in some form or another. Represents a hazard to public safety, infrastructure, and geodetic networks.
Deformation can be natural or anthropogenic. Monitoring is thus essential.
Monitoring requires knowledge about the cause(s), an appropriate strategy, and the right measurement/monitoring tools.

Questions?


