30
08/27/2014 DR. TING LU WILL REMOVAL OF CSO’S AND SSO’S BE ENOUGH TO IMPROVE YOUR WATER QUALITY? ENVIRONMENTAL SCIENTIST WATER TECHNOLOGY GROUP
| Date post: | 25-Apr-2018 |
| Category: |
Documents |
| Upload: | nguyendieu |
| View: | 215 times |
| Download: | 1 times |

08/27/2014
DR. TING LU
WILL REMOVAL OF CSO’S AND SSO’S BE ENOUGH TO IMPROVE YOUR WATER QUALITY?
ENVIRONMENTAL SCIENTISTWATER TECHNOLOGY GROUP
• The overarching goal of any wet weather program is to meet Water Quality targets and Clean Water Act Standard.
• Most multi‐million $$$ consent decrees are based on CSO/SSO frequency and volume reduction and are indirectlylinked to Water Quality Improvements.
WET WEATHER IMPROVEMENT PROGRAM
2
August 27, 2014

Evenduringdryweather,E.colihasexceededthewaterqualitystandard
E. COLI COUNTS AT DUCK CREEK WATERSHED IN CINCINNATI
3
August 27, 2014

BesidesCSOs,manysourcescontributetowaterpollutioninthewatershed
WATERSHED POLLUTION SOURCES
CSO
SSO Private systemsStormwater
Urban runoffAgriculture
4
August 27, 2014

• Removing CSO/SSO will not completely solve water quality pollutions…
Alternatively:
• We need an Integrated Approach for Water Quality Monitoring and Planning that is water quality focused and human health risk based
Anintegratedapproachforwaterqualitymonitoringandplanningisneededtoachievesustainability
AN WATER QUALITY FOCUSED AND HUMAN HEALTH RISKED BASED INTEGRATED APPROACH
5
August 27, 2014

Theintegratedwatershedapproachhelpstobridgethegapbetweenregulationandengineering.
INTEGRATED WATERSHED MANAGEMENTAugust 27, 2014
6
Water Quality Improvement
Clean Water Act
WQ Standard TMDL NPDES
Integrated watershed approach• Identify pollution sources• Quantify pollution loadings• Prioritize engineering projects• Measure project performance

AN INTEGRATED WATERSHED FRAMEWORK BASED ON MICROBIAL SOURCE TRACKING
August 27, 2014
7

PILOT STUDY
DEVELOPMENT OF AN INTEGRATED PLAN FOR WATER QUALITY MONITORING AND MONITORING
8

A SYSTEMATIC INTEGRATED APPROACH WITH AN INNOVATIVE MOLECULAR METHODS THAT TARGETS DNA AND RNA
Identify pollution sources
Quantify pollution contributions
Develop mitigation plans
Measure mitigation performance
9
August 27, 2014

Anurbanwatershedisselectedtoidentifyandquantifywaterpollutionproblems.
DUCK CREEK: URBAN WATERSHED WITH VARIOUS POLLUTION SOURCES
10
August 27, 2014
Land use Distribution (%)
Residential 45
Open space 29
Commercial and industrial
13
Other urban spaces 13

Site Stream(River mile)
Presumed primary fecal contamination source Surroundings
1 Duck Creek (2.0) Sewage, urban runoff Industrial
2 Duck Creek (2.4) Sewage, urban runoff Industrial
3 Duck Creek (3.38) CSO Residential
4 Little Duck Creek (0.49) Urban runoff Residential, vegetation
5 Little Duck Creek (1.7) Urban runoff, septic tanks Residential, vegetation
6 Little Duck Creek (2.2) Urban runoff, septic tanks Residential, vegetation
7 Duck Creek (4.5) CSO Pet care facility, vegetation
8 Deerfield Creek (0.2) CSO School, grasslands
9 Deerfield Creek (1.5) CSO, urban runoff Interstate, car showroom
10 Upper Duck Creek (0.5) Urban runoff Concrete channels
Sampling locations
11
August 27, 2014

PICTURES OF SELECTED SAMPLING SITES
12
August 27, 2014

IntegratingmicrobialsourcetrackingwithGISmaptouncoverthecauses.
LINKING THE SOURCES WITH THE CAUSES
Pollution origin Pollution detection and causes/reasons
Human Yes, CSO, SSO, and septic tanksBovine No, no cattle in the watershedCanine Yes, pet facility nearby or parksAvian Yes, wild waterfowl
13
August 27, 2014

QuantitativePCRcanquantifyfecalpollution
QUANTIFY POLLUTION CONTRIBUTORS
14
August 27, 2014
PROJECT FINDINGS
• Human fecal pollution is the dominant pollution source in the watershed• Identify and address key CSO/SSO areas for water quality improvement
• Besides sewer overflows, septic tanks failure contributes significantly to this problem• Work with other agencies to more effectively address pollution problems
• Fecal pollution loadings were reduced where green vegetation is present• This tool can be used for green infrastructure effectiveness measurement
15
August 27, 2014

• Develop tailored mitigation plan to effectively remove water quality pollutions
• i.e. Duck Creek Watershed in Cincinnati: identify a reliable onsite wastewater treatment system that produces better effluent quality
Tailoredmitigationplanwasdevelopedbasedonmicrobialsourcetracking
DEVELOPING MITIGATION PLANS
16
August 27, 2014

• Incorporates physical, chemical and biological parameters
• Establish and define a water quality baseline
• Continuous monitoring to measure the effectiveness of engineering projects
Annualin‐streammonitoringhelpstomeasureprojecteffectiveness.
IN‐STREAM MONITORING
17
August 27, 2014

Scientific and risk based approach
18

• 1st integrated fecal source tracking strategy• 1st optimized study applied to large CSO/SSO community for urban watershed
A UNIQUE AND INNOVATIVE APPROACHRECOGNIZED BY THE INDUSTRY
August 27, 2014
19

Total coliform
Fecal coliform
E. coli
Bacteroides
Universal
Human
Bovine
Canine
Avian
Pathogens
E. coli O157: H7
Norovirus
Streptococcus
Culture-basedmethods
Molecular-based methods
Asetofbiomarkersspecifictosourcesareusedinawatershed
INTEGRATED BIOMARKER DEVELOPMENTAugust 27, 2014
20
Source identification
Human health risk measurement

Bacteroides: obligate anaerobesHigh accuracy ‐ no false positive, no false negativeHigh sensitivity ‐ abundant in fecal samplesSource specific‐ host specificGood spatial‐temporal resolutionQuick turnaround time
Microbialsourcetrackingwasconductedtoidentifythepollutionsources
MICROBIAL SOURCE TRACKING WITH MOLECULAR TOOLS
August 27, 2014
21

Samplescanbestoredat‐20°Candanalysisperformedseveralmonthslater.
MOLECULAR APPROACHAugust 27, 2014
22
Water samples collected in sterile nalgene bottles and kept on ice until delivery to lab
Sample filtration using 0.45 µm membrane to retain bacteria and frozen at ‐20°C
DNA extraction using MO BIO Laboratories PowerWaterTM DNA isolation kit
DNA amplification through qPCR with primers specific for universal, human, bovine and canine 16S rRNA Bacteroidales
Visualization of amplified DNA product using gel electrophoresis and sequencing

MOLECULAR ASSAY LABAugust 27, 2014
23

Thismethodishighlysensitiveandspecifictoidentifypollutionsourceorigin
POLLUTION ORIGIN IDENTIFICATION: SOURCE TRACKING
August 27, 2014
24

• Link the water quality with the human health risk through pathogen identification• Pathogenic E. coli O157:H7
• Waterborne and foodborne pathogen, outbreak in many states• Not detected over the two‐year study period in Cincinnati
• Norovirus and Streptococcus: • Prevalent vectors of water borne disease• Detected in the water bodies
HUMAN HEALTH RISK BASED PROGRAM August 27, 2014
25
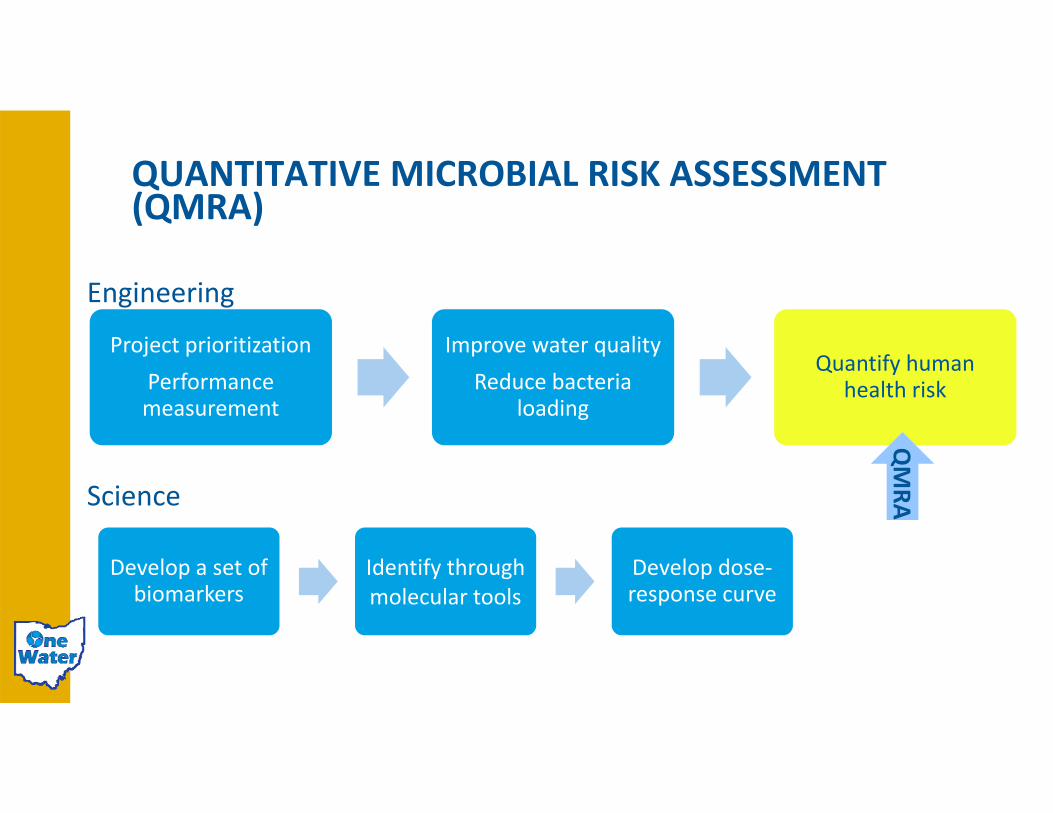
QUANTITATIVE MICROBIAL RISK ASSESSMENT (QMRA)
Project prioritizationPerformance measurement
Improve water qualityReduce bacteria
loading
Quantify human health risk
Develop a set of biomarkers
Identify through molecular tools
Develop dose‐response curve
QMRA
Engineering
Science

CONCLUSION
27

An integrated approach with innovative molecular tools and risked based approach helps:
• Identify the pollution sources
• Decision support on prioritizing CIP projects to remove CSOs and SSOs
• Evaluate projects effectiveness to communicate with regulatory agencies and other stakeholders
IN A NUTSHELL
28
August 27, 2014

ACKNOWLEDGEMENT
MSDGC: Biju George, MaryLynn Lodor
Black & Veatch: James Fitzpatrick, James Schlaman, Mel Meng
August 27, 2014

www.bv.com
Dr. Ting Lu | Environmental Scientist 513 609‐7459| [email protected]
www.onewaterohio.org


