58
Draft BioBanking Assessment Methodology (version 2)
Draft BioBanking Assessment Methodology (version 2)
© Copyright State of NSW and the Department of Environment, Climate Change and Water NSW
The Department of Environment, Climate Change and Water NSW and the State of NSW are pleased to allow this material to be reproduced in whole or in part, provided the meaning is unchanged and its source, publisher and authorship are acknowledged.
Published by: Department of Environment, Climate Change and Water NSW 59–61 Goulburn Street, Sydney PO Box A290, Sydney South 1232 Report pollution and environmental incidents Environment Line: 131 555 (NSW only) or [email protected]
See also www.environment.nsw.gov.au
Phone: (02) 9995 5000 (switchboard) Phone: 131 555 (environment information and publications requests) Phone: 1300 361 967 (national parks, climate change and energy efficiency information and publications requests) Fax: (02) 9995 5999 TTY: (02) 9211 4723 Email: [email protected] Website: www.environment.nsw.gov.au
ISBN 978 1 74232 943 7 DECCW 2010/800 October 2010
Contents
1. Introduction ........................................................................................ 1
2. Improve or maintain biodiversity values ......................................... 3
2.1 Development that improves or maintains biodiversity values............................................... 3
2.2 Definition of red flag areas.................................................................................................... 3
2.3 Determining that impact of development on red flag areas can be regarded as improving or maintaining biodiversity values .............................................................................................. 4
2.4 Assessment of indirect impacts on biodiversity values ......................................................... 6
2.5 Application of the methodology to Part 3A projects ............................................................. 8
2.6 Management actions that improve biodiversity values ......................................................... 8
2.7 Creation of credits in respect of lands with existing conservation obligations ..................... 9
3. Assessment and measurement of biodiversity values ................ 11
3.1 Assessment and measurement of general biodiversity values............................................. 11
3.2 Vegetation type and condition............................................................................................. 11
3.3 Use of certified local data.................................................................................................... 12
3.4 Updates of the databases ..................................................................................................... 13
3.5 Assessment of Site Value .................................................................................................... 13
3.6 Assessment of Landscape Value ......................................................................................... 17
4. Assessment and measurement of threatened species ................ 24
4.1 Threatened Species Profile Database .................................................................................. 24
4.2 Identifying the threatened species that require assessment ................................................. 25
4.3 Assessment of threatened species for ecosystem credits ..................................................... 26
4.4 Assessment of threatened species for species credits .......................................................... 26
4.5 The use of expert reports instead of undertaking survey..................................................... 29
4.6 Identified populations.......................................................................................................... 29
4.7 Assumed presence of fauna species..................................................................................... 30
4.8 Inclusion of additional species for species credits............................................................... 30
5. Calculating ecosystem credits and species credits ..................... 31
5.1 Calculating ecosystem credits ............................................................................................. 31
5.2 Calculating ecosystem credits for threatened species.......................................................... 32
5.3 Final calculation of ecosystem credits at a development site .............................................. 32
5.4 Final calculation of ecosystem credits at a biobank site...................................................... 34
5.5 Number of species credits required at a development site .................................................. 34
5.6 Number of species credits created at a biobank site ............................................................ 35
5.7 Calculation of credits for environmental contributions ....................................................... 36
6. Credit profiles and offset rules for using credits.......................... 38
6.1 Credit profile for ecosystem credits..................................................................................... 38
6.2 Credit profile for species credits.......................................................................................... 39
6.3 Offset rules for using credits ............................................................................................... 40
7. Additional matters............................................................................ 41
7.1 Deferred retirement arrangements ....................................................................................... 41
7.2 Additionality in credit allocations ....................................................................................... 42
7.3 Application of the assessment methodology ....................................................................... 44
Glossary ................................................................................................ 45
Appendix 1: Guidelines for the use of benchmark data from local reference sites or published sources................................................. 50
Appendix 2: Survey design – stratification and survey effort ........ 51
Appendix 3: Guidelines for varying the increase in Site Value with additional management actions.......................................................... 53
Draft BioBanking Assessment Methodology (version 2)
1
1. Introduction The BioBanking Scheme is established under Part 7A of the Threatened Species Conservation Act 1995 (TSC Act).
A key element of the BioBanking Scheme is the establishment of the BioBanking Assessment Methodology (the methodology) under section 127B of the TSC Act. The methodology is made by order of the Minister for Climate Change and the Environment and published in the NSW Government Gazette.
The methodology assesses all biodiversity values as defined by the TSC Act, including the composition, structure and function of ecosystems. For the purposes of the TSC Act, biodiversity values include (but are not limited to) threatened species, threatened populations and threatened ecological communities, and their habitats. This definition does not include fish species or marine vegetation within the meaning of Part 7A of the Fisheries Management Act 1994, unless the fish species or marine vegetation have been the subject of an order under section 5A of the TSC Act.
The methodology complies with the requirements of the TSC Act and clauses 4 and 5 of the Threatened Species Conservation (Biodiversity Banking) Regulation 2008 (the Regulation).
The methodology assesses the biodiversity values currently at development sites and biobank sites, and describes the process for measuring the loss of biodiversity values that results from removing native vegetation, threatened species habitat and threatened species on a development site, and the gain in biodiversity values from management actions on a biobank site.
In section 2, the methodology establishes the circumstances in which development is to be regarded as improving or maintaining biodiversity values, including where the impact of that development is offset against the impact of management actions for which biodiversity credits are created. The methodology also establishes the circumstances in which impacts on biodiversity values cannot be offset by the retirement of biodiversity credits. Section 2 also identifies the management actions for which biodiversity credits may be created.
In section 3, the methodology establishes two classes of biodiversity credits that may be created in respect of management actions at a biobank site. The two classes of biodiversity credits are:
1 Ecosystem credits – these are created or required for all impacts on biodiversity values (including threatened species that can be reliably predicted by habitat surrogates), except the threatened species or populations that require species credits.
2 Species credits – these are created or required for impacts on threatened species that cannot be reliably predicted to use an area of land based on habitat surrogates. Threatened species that require species credits are identified in the Threatened Species Profile Database.
In section 3, the methodology sets out how to assess and measure biodiversity values on a development site and a biobank site. It also describes how to measure the loss of biodiversity values at a development site and the gain in biodiversity values at a biobank site.
In section 4, the methodology sets out how to assess and measure biodiversity values for threatened species on a development site and a biobank site. This section determines the species that require further assessment, and whether they will require ecosystem credits or species credits. This includes threatened species that are listed under the Environmental Protection and Biodiversity Conservation Act 1999 (EPBC Act).
Section 5 of the methodology establishes the rules for calculating the number and type of ecosystem credits and species credits that are required in relation to loss of biodiversity values at a development site, or created in relation to improving biodiversity values at a biobank site.
Draft BioBanking Assessment Methodology (version 2)
2
Section 6 contains the rules (the offset rules) for the use of credits to offset the impacts of development on threatened species at a development site by management actions at a biobank site.
Section 7 contains information on additional matters as required under the TSC Act.
The glossary provides an explanation of the terms used in the methodology.
The methodology has been prepared by the Department of Environment, Climate Change and Water NSW (DECCW), drawing on:
Briggs, J. (2005). Threatened Species Assessment Tool. Version 1-7. An Assessment Tool for Use in the NSW Property Vegetation Plan Developer Operational Manual. NSW Department of Environment and Conservation, Environmental Protection and Regulation Division, Queanbeyan.
Gibbons, P., Ayers, D., Seddon, J., Doyle, S. and Briggs, S. (2005). BioMetric Operational Manual. Version 1.8: A Terrestrial Biodiversity Assessment Tool for the NSW Property Vegetation Plan Developer. NSW Department of Environment and Conservation, CSIRO Sustainable Ecosystems, Canberra.
Gibbons, P., Briggs, S.V., Ayers, D., Seddon, J., Doyle, S., Cosier, P., McElhinny, C., Pelly, V. and Roberts, K. (2008). An operational method to rapidly assess impacts of land clearing on terrestrial biodiversity. Ecological Indicators, in press.
Draft BioBanking Assessment Methodology (version 2)
3
2. Improve or maintain biodiversity values
2.1 Development that improves or maintains biodiversity values Under the TSC Act, a biobanking statement can only be issued for a proposed development where the Director General of DECCW makes a determination in accordance with the methodology that the development will improve or maintain biodiversity values. The methodology establishes the circumstances where the development is to be regarded as improving or maintaining biodiversity values. This includes circumstances where the impacts of clearing on biodiversity values at the development site are offset against the beneficial impacts of management actions which create biodiversity credits at the biobank site.
A development is to be regarded as improving or maintaining biodiversity values if:
1a The development does not directly impact on biodiversity values in a red flag area on the development site.
or
1b The development does directly impact on biodiversity values in a red flag area on the development site but the Director General makes a determination that the development may be regarded as improving or maintaining biodiversity values according to section 2.3.
and
2 The direct impacts of the development on biodiversity values on the development site are offset by the retirement of biodiversity credits determined in accordance with the offset rules in the methodology.
and
3 The Director General determines that any indirect impacts of the development on on-site and off-site biodiversity values that cannot be mitigated through on-site measures are offset by the retirement of biodiversity credits determined in accordance with the offset rules in the methodology.
If a development impacts on all or part of a red flag area on the development site but the Director General makes a determination that the development may be regarded as improving or maintaining biodiversity values according to section 2.3, the Director General must publish the reasons for that determination on the register of biobanking statements.
2.2 Definition of red flag areas A red flag area is an area of land that has high biodiversity conservation values. An area of land is regarded as having high biodiversity conservation values if it contains one of more of the following:
a vegetation type that has greater than 70% cleared as listed in the Vegetation Types Database (that is, has less than 30% of its estimated distribution remaining in the catchment management authority (CMA) area before the year 1750) and the vegetation is not in low condition as defined below
a critically endangered or endangered ecological community listed under the TSC Act or EPBC Act, and the vegetation is not in low condition as defined below
Draft BioBanking Assessment Methodology (version 2)
4
one or more threatened species identified in the Threatened Species Profile Database that cannot withstand further loss in the CMA area because of one or more of the following:
the species is naturally very rare, is critically endangered, has few populations or a restricted distribution
the species or its habitat needs are poorly known
the species is an identified population, as defined in section 4.6 of this methodology and listed in the Identified Population Database (when published).
Vegetation in low condition means:
1 woody native vegetation with native over-storey percent foliage cover less than 25% of the lower value of the over-storey percent foliage cover benchmark for that vegetation type, and:
less than 50% of ground cover vegetation is indigenous species, or
greater than 90% of ground cover vegetation is cleared.
2 native grassland, wetland or herbfield where:
less than 50% of ground cover vegetation is indigenous species, or
more than 90% of ground cover vegetation is cleared.
If native vegetation is not in low condition, it is in moderate to good condition.
The percentages for the ground cover calculations must be made in a season when the proportion of native ground cover vegetation compared to non-native ground cover vegetation in the area is likely to be at its maximum.
Note: Clearing the habitat of threatened species, populations or communities for the purposes of reducing its condition prior to assessment under the methodology may be a breach of environmental legislation, including sections 118A and 118D of the National Parks and Wildlife Act 1974 (NP&W Act), Native Vegetation Act 2003 (NV Act) and Environmental Planning and Assessment Act 1979 (EP&A Act).
2.3 Determining that impact of development on red flag areas can be regarded as improving or maintaining biodiversity values Where a proposed development, or any part of it, is on land that is, or forms part of, a red flag area, the Director General may make a determination that it is possible for the development to be regarded as improving or maintaining biodiversity values. The Director General can only make that determination if satisfied that the following criteria are met.
1 Options to avoid impacts on red flag area(s) on the development site must be considered
The Director General must be satisfied that all reasonable measures have been considered to:
(a) avoid adverse impacts on the red flag area. This includes consideration of different configurations of the development footprint to avoid or minimise impacts on red flag areas, and
(b) improve or retain the viability of any red flag areas with low viability through ongoing management. This includes consideration of mechanisms to provide secure long term management of the area (whether by private or public means).
Note: This includes options for designating small patches (being red flag areas) as urban bushland parks within an urban precinct, or by conservation through other planning (zoning and other) controls.
Draft BioBanking Assessment Methodology (version 2)
5
2 Highly cleared vegetation types
Where a red flag area on the development site comprises a highly cleared vegetation type with an area greater than four hectares, the Director General cannot determine that the development will improve or maintain biodiversity values.
A highly cleared vegetation type is a vegetation type whose distribution in the CMA area is 10% or less than its estimated distribution in the CMA area before 1750 (that is, 90% or more cleared in the CMA area as defined by the Vegetation Types Database), and the vegetation is not in low condition as defined in section 2.2 of the methodology.
3 Contribution to regional biodiversity values must be low
The contribution of the native vegetation and threatened species habitat to be cleared in a red flag area to regional biodiversity values is low. Specifically, the following factors must be considered:
Relative abundance: whether the vegetation type or critically endangered or endangered ecological community at the development site is relatively abundant in the region (e.g. relative abundance in the region may vary from one or more thousands hectares in coastal regions, up to tens of thousands of hectares or greater for some inland regions).
Percent remaining is high: whether the percent remaining of the vegetation type or critically endangered or endangered ecological community at the development site is relatively high in the region (relatively high means relatively high in the region compared with the percent cleared of the vegetation type for the catchment management authority area where the red flag area is located)
Percent native vegetation (by area) remaining is high: whether the percent remaining of native vegetation cover in the region is relatively high (relatively high means relatively high in the region compared with the percent native vegetation cover for the catchment management authority area where the red flag area is located).
Whether the vegetation type or critically endangered or endangered ecological community or native vegetation is generally in moderate to good condition in the region.
Relative abundance of individual threatened species or threatened species habitat on the site: whether habitat and/or numbers of threatened species in the region would allow the species to bear temporary loss at the development site while gains are being achieved at biobank site(s) within the same region.
Region is defined as the CMA subregion in which the red flag area is located and the adjoining CMA subregions.
4 Viability must be low or not viable
The viability of biodiversity values on the red flag area must be low or not viable. Viability is defined as the ability of biodiversity values at a site to persist for many generations or long time periods. The ecological viability of a site and its biodiversity values depend on its condition, the area of the patch and its isolation, its current or proposed tenure, the surrounding land use, and whether mechanisms are available to manage low viability sites such that their viability is improved over time.
In making an assessment that the biodiversity values in the red flag area are low or not viable, the Director General must be satisfied that options under criterion 1(b) have been considered and one or more of the following factors apply:
(a) The current or known future land uses surrounding the vegetation to be cleared (other than the land use proposed in the biobanking statement application) reduce its viability or make it unviable. Relatively small areas of native vegetation (e.g. patches of a few hectares or less) surrounded or largely surrounded by intense land uses, such as urban
Draft BioBanking Assessment Methodology (version 2)
6
development, can be unviable or have low viability because of disturbances from urbanisation, including edge effects.
(b) The size and connectedness (with other native vegetation) of the vegetation to be cleared is insufficient to maintain its viability. Relatively small areas of isolated native vegetation (e.g. patches of a few hectares or less that are more than several hundred metres from another patch of native vegetation) can be unviable or have low viability.
(c) The condition of native vegetation to be cleared is substantially degraded resulting in loss of or reduced viability. Native vegetation in degraded condition can be unviable or have low viability. Degraded condition means substantially outside benchmark in the majority of vegetation condition variables as listed in the methodology, but does not meet the definition of low condition in section 2.2. Vegetation that is substantially outside benchmark due to a recent disturbance such as a fire, flood or prolonged drought is not considered degraded.
5 Credits to offset the full impacts of the development must be retired
If the development impacts on a red flag area and the Director General determines that it is possible for the development to be regarded as improving or maintaining biodiversity values in accordance with the criteria above, credits to offset the impacts of the development, including on red flag areas, must be retired in accordance with section 2.1 of the methodology.
6 Other matters that may be considered
An application to the Director General to determine whether the impacts on a red flag area can improve or maintain biodiversity values may also include information regarding:
(a) Regional plans: whether the proposed development on the red flag area is in accordance with an approved regional plan. For the purpose of these assessment protocols, an approved regional plan can be a regional strategy, regional conservation plan, environmental planning instrument or another regional plan that has been approved by the relevant Minister.
The application to the Director General should clearly define how the development on the red flag area is consistent with the plan and how the approved regional plan provides support for the determination that strict avoidance of the red flag area is, in the particular case, unreasonable and unnecessary.
(b) Environmental contributions: whether an extra environmental contribution has been made or extra credits are proposed to be retired, in addition to the retirement of the required number of biodiversity credits in accordance with criterion 2 (section 2.1) of the improve or maintain test to offset the impacts of the development on the red flag area (or the overall development). This may include an environmental contribution where relevant.
The impact assessment that accompanies an application for a biobanking statement must address the above six criteria.
2.4 Assessment of indirect impacts on biodiversity values The impact assessment that accompanies a biobanking statement application must identify and assess any relevant negative indirect impacts that the development is likely to have on biodiversity values off-site. The area that is assessed for indirect impacts should extend as far as is necessary off-site to assess any likely adverse impacts on biodiversity values from the development.
Indirect impacts on biodiversity values could include, for example:
changes in water quality or quantity that affect downstream biodiversity values
Draft BioBanking Assessment Methodology (version 2)
7
increased light or noise that may affect threatened species habitat
roads or other linear developments that may restrict movement of threatened species or populations in areas surrounding the development.
The process to assess indirect impacts on biodiversity values is outlined in the two steps below.
Step 1: Minimise negative impacts
The impact assessment must demonstrate that all cost-effective measures to minimise negative impacts of the development on biodiversity values are being or will be carried out. Examples include:
implementing sediment and erosion controls at the development site
use of noise and light barriers
use of structures that allow movement of threatened species or populations.
The applicant for a biobanking statement is required to demonstrate that all cost-effective on-site measures to minimise any negative impacts of the development on biodiversity values are being or will be carried out (section 127ZL(4)(d) of the TSC Act). This includes both on-site and off-site (indirect) impacts.
Before issuing a biobanking statement, the Director General must be satisfied that the applicant has demonstrated that all cost-effective on-site measures to minimise any negative impacts of the development on on-site or off-site (indirect) biodiversity values are being or will be carried out.
These measures may be included as conditions on a biobanking statement issued in respect of the development.
Step 2: Determine biodiversity credits to offset any remaining impact
In some circumstances, using cost effective on-site measures will not be sufficient to avoid indirect impacts on biodiversity values. If a negative indirect impact cannot be fully mitigated, then the applicant must identify any threatened species or population, or critically endangered or endangered ecological community that will continue to be impacted by the development. The negative impact on these species, populations or communities is then assessed for biodiversity credits using an expert report in accordance with the following:
If the affected threatened species or population are species to which species credits apply, the expert report must indicate the remaining indirect impact (taking into account mitigation measures) and the area of habitat or number of individuals affected. The expert report must include an estimate of the number and class of additional credits required to offset the impact using Equation 12.
If the threatened species affected are species to which ecosystem credits apply, the expert report must include an estimate of the number and class of additional ecosystem credits required to offset the impact using Equation 9.
The expert report can also determine that the remaining indirect impact is not capable of being assessed under sections 3, 4 or 5 of the methodology. Where the remaining indirect impact cannot be mitigated or offset, the development cannot improve or maintain biodiversity values, and therefore a biobanking statement cannot be issued.
The Director General will consider the expert report and make a determination in relation to whether the indirect impacts can be offset by the retirement of credits and, if so, the number and class of credits to be retired in accordance with the offset rules in the methodology.
The Director General may develop information that provides guidance regarding the assessment of indirect impacts.
Draft BioBanking Assessment Methodology (version 2)
8
2.5 Application of the methodology to Part 3A projects Where an applicant for a Part 3A project approval under the EP&A Act has not obtained a biobanking statement, the methodology can still be applied to assess the impacts of the project on biodiversity values. For example, the methodology may be used in the environmental assessment for the project. The application of the methodology to Part 3A projects would involve:
at the preliminary assessment stage, considering options to avoid impacts on native vegetation and other areas likely to contain threatened species habitat
for the environmental assessment, using the methodology, Operational Manual and Credit Calculator to assess the project, and
providing the results of the assessment to the Department of Planning, along with the statement of commitments. The statement of commitments should indicate cost-effective measures to minimise negative impacts and the proposed mechanism by which offsets are proposed to be provided (through retirement of biodiversity credits, reservation of land, or other mechanisms).
2.6 Management actions that improve biodiversity values Improvement in biodiversity values through management actions at a biobank site is the basis for the creation of biodiversity credits. The following classes of credits can be created for management actions that are, or are proposed to be, carried out at a biobank site:
1 ecosystem credits
2 species credits.
2.6.1 Management actions for creating ecosystem credits
Standard management actions
Ecosystem credits are created in respect of the management actions listed below:
management of grazing for conservation
weed control
management of fire for conservation
management of human disturbance
retention of regrowth and remnant native vegetation
replanting or supplementary planting where natural regeneration will not be sufficient
retention of dead timber
erosion control
retention of rocks.
Biobanking agreements require all of the above management actions to be carried out.
Additional management actions which may be required for creating ecosystem credits
Additional management actions may be required at a biobank site to improve populations or habitats of particular threatened species that require ecosystem credits. These management actions are additional to the management actions required to create ecosystem credits.
Examples of additional actions that may be required for relevant species as identified in the Threatened Species Profile Database are:
Draft BioBanking Assessment Methodology (version 2)
9
control of feral and/or overabundant native herbivores
vertebrate pest management – pigs
vertebrate pest management – foxes and/or miscellaneous species
nutrient control
control of exotic fish species
maintenance or reintroduction of natural flow regimes (where possible).
These additional management actions will be identified in the biobanking agreement where the relevant threatened species are likely to use the biobank site. The additional management actions will only be required where they are identified by the Threatened Species Profile Database for the species.
The biobanking agreement for a site will set out the area of land to which a management action applies, the details of the management action required and the time frames for carrying out the management actions.
2.6.2 Management actions for creating species credits
Species credits may be created in respect of specific management actions to improve populations or habitats of particular threatened species.
These management actions for creating species credits will be identified in the biobanking agreement where threatened species that produce species credits are likely to use land at the biobank site. The management actions for creating species credits will only be required where they are identified by the Threatened Species Profile Database as being relevant for the species.
A biobanking agreement will set out the area of land to which an additional management action applies, the details of the management action required and the time frames for carrying out the management action.
For species credits, examples of the additional actions that are required by the methodology and identified for relevant species in the Threatened Species Profile Database are:
control of feral and/or overabundant native herbivores
vertebrate pest management – pigs
vertebrate pest management – foxes and/or miscellaneous species
nutrient control
control of exotic fish species
maintenance or reintroduction of natural flow regimes (where possible).
2.7 Creation of credits in respect of lands with existing conservation obligations Ecosystem and species credits may be created in respect of management actions carried out or proposed to be carried out on a biobank site only if the management actions are additional to any biodiversity conservation measures or actions that are already being carried out on the land or are required to be carried out under:
a restriction on use or public positive covenant under Part 4A of the Crown Lands Act 1989
a conservation agreement entered into under the NP&W Act
a trust agreement entered into under the Nature Conservation Trust Act 2001 (NCT Act)
Draft BioBanking Assessment Methodology (version 2)
10
any agreement entered into with a public authority under which the owner of the land receives funding for biodiversity conservation purposes (other than a biobanking agreement), or
in the case of publicly owned land, any Act.
This rule does not apply to:
a restriction on use or public positive covenant under Part 4A of the Crown Lands Act 1989 that is imposed in connection with an application to purchase land that is duly made by a leaseholder in respect of that land before 1 January 2009
a conservation agreement entered into under the NP&W Act as a result of a proposal made by the landholder to the Minister administering that Act before 1 January 2009, or
a trust agreement entered into under the NCT Act as a result of a proposal made by the landholder to the Nature Conservation Trust before 1 January 2009.
Section 7.2 of the methodology provides the method for reducing the number of credits created under a biobanking agreement to take account of the existing conservation obligation.
Draft BioBanking Assessment Methodology (version 2)
11
3. Assessment and measurement of biodiversity values Biodiversity values are assessed and measured according to the type of biodiversity credits that may be created. There are two classes of biodiversity credits that may be created: ecosystem credits or species credits.
1 Ecosystem credits are created or required for all impacts on biodiversity values (including threatened species that can be reliably predicted by habitat surrogates), except the threatened species or populations that require species credits.
2 Species credits are created or required for impacts on threatened species that cannot be reliably predicted to use an area of land based on habitat surrogates. Threatened species that require species credits are identified in the Threatened Species Profile Database.
3.1 Assessment and measurement of general biodiversity values Section 3 sets out how to assess and measure biodiversity values, other than certain threatened species or populations, to determine the number of ecosystem credits that can be created at a biobank site or required at a development site. These are referred to as general biodiversity values.
The assessment and measurement of threatened species that require ecosystem credits and species credits is described in section 4.
3.2 Vegetation type and condition Vegetation types are used as surrogates for general biodiversity values. A vegetation type is classified within a vegetation class, which in turn is classified within a vegetation formation. There are approximately 1600 vegetation types, 99 vegetation classes, and 12 vegetation formations in NSW.
The information on each vegetation type is contained within the Vegetation Types Database. This database is held by DECCW and is publicly available. The Vegetation Types Database contains:
a description of each vegetation type, its class and formation
the CMA area within which the vegetation type occurs
the percent cleared value of the vegetation type within each CMA area in which it occurs.
Any threatened ecological communities associated with a vegetation type are identified in the Threatened Species Profile Database.
Some of the vegetation types contained in the Vegetation Types Database are derived or secondary vegetation communities (that is, the vegetation types have been modified substantially since 1750). Derived vegetation types must only be selected where the original vegetation type cannot be determined. Where the original vegetation type cannot be determined, the derived vegetation must be assessed against the most likely original vegetation type(s), or a benchmark for the class of the vegetation type(s).
The Vegetation Benchmarks Database identifies the range of quantitative measures that represent the benchmark condition for the vegetation type. This database is held by DECCW and is publicly available.
Benchmarks are quantitative measures that describe the range of variability in condition in vegetation with relatively little evidence of alteration, disturbance or modification by humans
Draft BioBanking Assessment Methodology (version 2)
12
since European settlement (post 1750). Benchmarks are described for specified attributes by vegetation community. Vegetation with relatively little evidence of modification generally has minimal timber harvesting (few stumps, coppicing, cut logs), minimal firewood collection, minimal exotic weed cover, minimal grazing and trampling by introduced or overabundant native herbivores, minimal soil disturbance, minimal canopy dieback, no evidence of recent fire or flood, is not subject to high frequency burning, and shows evidence of recruitment of native species.
Vegetation that is substantially outside benchmark due to a recent disturbance, such as fire, flood or prolonged drought, is not considered degraded. Vegetation that has been recently disturbed, or is regenerating after an event such as fire or flood, must be assessed on an equivalent site that is not disturbed in these ways. The equivalent, undisturbed site must be approved by the Director General prior to issuing a biobanking statement. Sites that are deliberately degraded prior to an assessment may be subject to investigation by DECCW.
Benchmark data that more accurately reflects the local environmental conditions for a vegetation type may be collected from local reference sites, or obtained from relevant published sources using the procedures set out in Appendix 1.
3.2.1 Delineating vegetation zones
Prior to assessment of impact, the development site or biobank site must be divided into vegetation zones, using a satellite or orthorectified aerial image of the site. Vegetation zones are delineated by vegetation type and broad condition for the purpose of assessing the average site condition of the vegetation and to survey for threatened species. Vegetation that is in low condition must always form a separate zone to vegetation that is not in low condition, including within the same vegetation type.
Areas of non-contiguous vegetation in the 1000 ha assessment circle, which are affected the same way by management or development on biodiversity values, may be combined into a single vegetation zone, where they are the same vegetation type and broad condition at a development or biobank site. Areas of the same vegetation type but with different condition above low condition may be delineated as separate zones in order to stratify the site for field survey.
A separate zone must be created where a site extends across the boundary of a 1000 ha assessment circle. Where a development or biobank site is across one or more CMA subregions, the CMA subregion in which most of the proposal occurs must be used. A separate zone may also be created where there is a variation in the effect of management or development on biodiversity values (e.g. such as for an asset protection zone).
Where the extent of native vegetation at a development or biobank site has changed since the satellite or ortho-rectified aerial image was made, and the clearing was legally approved or permitted, vegetation zones are amended or deleted to reflect the current situation, based on current field survey. Prior to issuing a biobanking statement or before the Minister enters a biobanking agreement, the Director General must approve that the amended areas of vegetation mapped by the current field survey are correct, rather than the areas of native vegetation shown on an aerial image.
3.3 Use of certified local data The Director General may certify that more appropriate local data can be used instead of the data in the Vegetation Types Database, Vegetation Benchmarks Database and the Threatened Species Profile Database. Local data may be used if the Director General is of the opinion that it more accurately reflects local environmental conditions. In certifying this data, the Director General must provide reasons for this opinion and publish these reasons on the DECCW website.
Draft BioBanking Assessment Methodology (version 2)
13
The certified local data can then be used in applying the methodology in accordance with any procedures outlined in the Operational Manual.
3.4 Updates of the databases The databases used in the methodology are periodically updated in response to increased knowledge about biodiversity values and relevant biodiversity data. Changes to the databases may require issuing an updated version of the Credit Calculator.
DECCW will notify persons accredited to use the assessment methodology and Credit Calculator that an updated version of the Credit Calculator is available. Applications for a biobanking statement and a biobanking agreement must be made using the most recent version of the Credit Calculator available.
Changes to the databases and the reasons for the changes must be published on the DECCW website prior to incorporation of the data into the Credit Calculator.
3.5 Assessment of Site Value Site Value is the quantitative measure of the condition of native vegetation assessed for each vegetation zone. The site value assessment is also used to determine the condition of certain habitat attributes used by threatened species on the site.
3.5.1 Plot and transect surveys
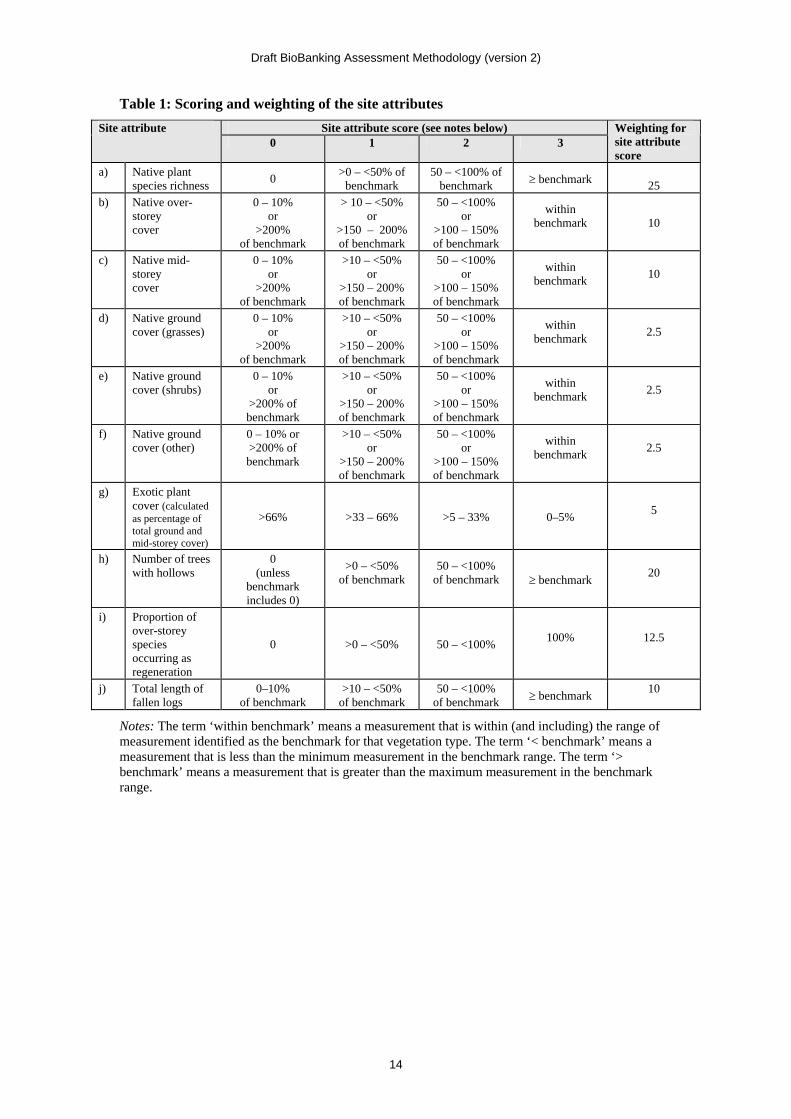
Plot and transect surveys of the development and biobank sites are used to provide quantitative measures of 10 site attributes in each vegetation zone. The 10 site attributes, listed in Table 1, are assessed to calculate the number of ecosystem credits that can be created at a biobank site or are required at a development site.
Line transects must be used to assess the site attributes that are measured by percent foliage cover. Other site attributes are assessed by plots. The plot and transect surveys are conducted in the vegetation zone to sample vegetation condition across the zone. Regeneration is assessed for the entire zone.
The number of plots and transects required for each vegetation zone on a development or biobank site are determined in accordance with Appendix 2. Plot and transect surveys required for each vegetation zone must be conducted in accordance with the procedures provided in the Operational Manual.
3.5.2 Calculating the current Site Value score
The current Site Value score is determined from the plot/transect surveys in each vegetation zone. Ten site (condition) attributes are assessed against benchmark values to determine vegetation condition and the Site Value score.
The benchmark range is the range of numeric values identified in the Vegetation Benchmarks Database for each site attribute for vegetation types or classes, or collected from local reference sites or obtained from published sources.
The benchmark range is the quantitative measure of the range of variability in site attributes under local conditions for the vegetation type where there is relatively little evidence of modification by humans since 1750. Benchmark ranges should reflect the range of variability of the vegetation type with little modification since European settlement.
The current site attribute score is either 0, 1, 2 or 3 as shown in Table 1. As shown in Equation 1, the site attribute scores are weighted and summed, then converted to a current Site Value score out of 100. The same equation is used to determine the current Site Value score at both the development and biobank sites.
Draft BioBanking Assessment Methodology (version 2)
14
Table 1: Scoring and weighting of the site attributes
Site attribute score (see notes below) Site attribute 0 1 2 3
Weighting for site attribute score
a) Native plant species richness
0 >0 – <50% of
benchmark 50 – <100% of
benchmark benchmark
25
b) Native over-storey cover
0 – 10% or
>200% of benchmark
> 10 – <50% or
>150 – 200% of benchmark
50 – <100% or
>100 – 150% of benchmark
within benchmark
10
c) Native mid-storey cover
0 – 10% or
>200% of benchmark
>10 – <50% or
>150 – 200% of benchmark
50 – <100% or
>100 – 150% of benchmark
within benchmark
10
d) Native ground cover (grasses)
0 – 10% or
>200% of benchmark
>10 – <50% or
>150 – 200% of benchmark
50 – <100% or
>100 – 150% of benchmark
within benchmark
2.5
e) Native ground cover (shrubs)
0 – 10% or
>200% of benchmark
>10 – <50% or
>150 – 200% of benchmark
50 – <100% or
>100 – 150% of benchmark
within benchmark
2.5
f) Native ground cover (other)
0 – 10% or >200% of benchmark
>10 – <50% or
>150 – 200% of benchmark
50 – <100% or
>100 – 150% of benchmark
within benchmark
2.5
g) Exotic plant cover (calculated as percentage of total ground and mid-storey cover)
>66%
>33 – 66%
>5 – 33%
0–5%
5
h) Number of trees with hollows
0 (unless
benchmark includes 0)
>0 – <50% of benchmark
50 – <100% of benchmark
benchmark
20
i) Proportion of over-storey species occurring as regeneration
0 >0 – <50% 50 – <100% 100%
12.5
j) Total length of fallen logs
0–10% of benchmark
>10 – <50% of benchmark
50 – <100% of benchmark benchmark
10
Notes: The term ‘within benchmark’ means a measurement that is within (and including) the range of measurement identified as the benchmark for that vegetation type. The term ‘< benchmark’ means a measurement that is less than the minimum measurement in the benchmark range. The term ‘> benchmark’ means a measurement that is greater than the maximum measurement in the benchmark range.
Draft BioBanking Assessment Methodology (version 2)
15
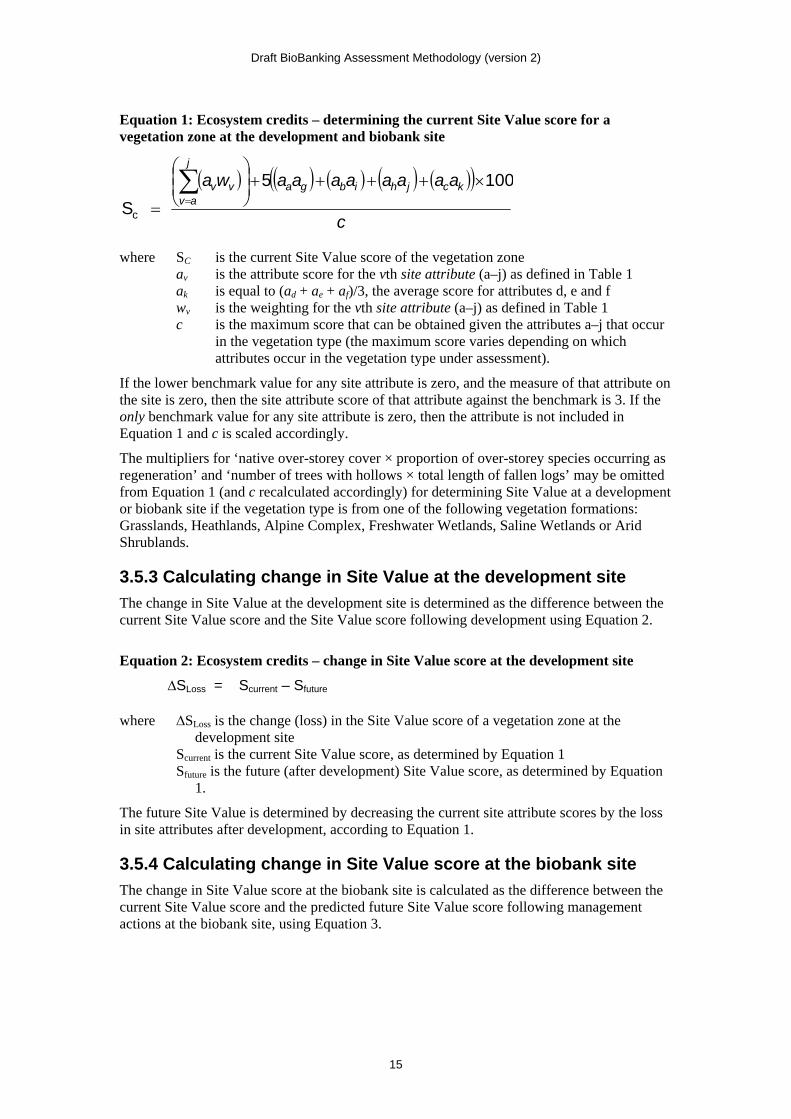
Equation 1: Ecosystem credits – determining the current Site Value score for a vegetation zone at the development and biobank site
c
aaaaaaaawa kcjhibga
j
avvv 1005
Sc
where SC is the current Site Value score of the vegetation zone av is the attribute score for the vth site attribute (a–j) as defined in Table 1 ak is equal to (ad + ae + af)/3, the average score for attributes d, e and f wv is the weighting for the vth site attribute (a–j) as defined in Table 1 c is the maximum score that can be obtained given the attributes a–j that occur
in the vegetation type (the maximum score varies depending on which attributes occur in the vegetation type under assessment).
If the lower benchmark value for any site attribute is zero, and the measure of that attribute on the site is zero, then the site attribute score of that attribute against the benchmark is 3. If the only benchmark value for any site attribute is zero, then the attribute is not included in Equation 1 and c is scaled accordingly.
The multipliers for ‘native over-storey cover × proportion of over-storey species occurring as regeneration’ and ‘number of trees with hollows × total length of fallen logs’ may be omitted from Equation 1 (and c recalculated accordingly) for determining Site Value at a development or biobank site if the vegetation type is from one of the following vegetation formations: Grasslands, Heathlands, Alpine Complex, Freshwater Wetlands, Saline Wetlands or Arid Shrublands.
3.5.3 Calculating change in Site Value at the development site
The change in Site Value at the development site is determined as the difference between the current Site Value score and the Site Value score following development using Equation 2.
Equation 2: Ecosystem credits – change in Site Value score at the development site
∆SLoss = Scurrent – Sfuture where ∆SLoss is the change (loss) in the Site Value score of a vegetation zone at the
development site Scurrent is the current Site Value score, as determined by Equation 1 Sfuture is the future (after development) Site Value score, as determined by Equation
1.
The future Site Value is determined by decreasing the current site attribute scores by the loss in site attributes after development, according to Equation 1.
3.5.4 Calculating change in Site Value score at the biobank site
The change in Site Value score at the biobank site is calculated as the difference between the current Site Value score and the predicted future Site Value score following management actions at the biobank site, using Equation 3.
Draft BioBanking Assessment Methodology (version 2)
16
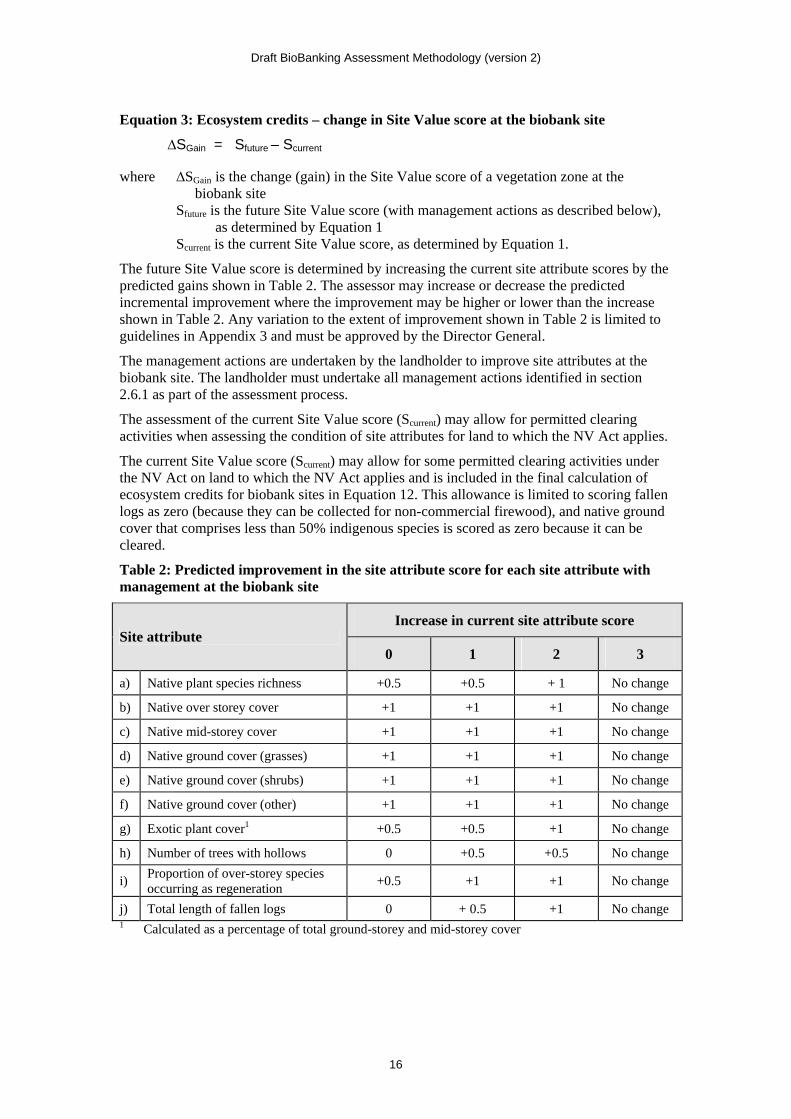
Equation 3: Ecosystem credits – change in Site Value score at the biobank site
∆SGain = Sfuture – Scurrent where ∆SGain is the change (gain) in the Site Value score of a vegetation zone at the
biobank site Sfuture is the future Site Value score (with management actions as described below),
as determined by Equation 1 Scurrent is the current Site Value score, as determined by Equation 1.
The future Site Value score is determined by increasing the current site attribute scores by the predicted gains shown in Table 2. The assessor may increase or decrease the predicted incremental improvement where the improvement may be higher or lower than the increase shown in Table 2. Any variation to the extent of improvement shown in Table 2 is limited to guidelines in Appendix 3 and must be approved by the Director General.
The management actions are undertaken by the landholder to improve site attributes at the biobank site. The landholder must undertake all management actions identified in section 2.6.1 as part of the assessment process.
The assessment of the current Site Value score (Scurrent) may allow for permitted clearing activities when assessing the condition of site attributes for land to which the NV Act applies.
The current Site Value score (Scurrent) may allow for some permitted clearing activities under the NV Act on land to which the NV Act applies and is included in the final calculation of ecosystem credits for biobank sites in Equation 12. This allowance is limited to scoring fallen logs as zero (because they can be collected for non-commercial firewood), and native ground cover that comprises less than 50% indigenous species is scored as zero because it can be cleared.
Table 2: Predicted improvement in the site attribute score for each site attribute with management at the biobank site
Increase in current site attribute score Site attribute
0 1 2 3
a) Native plant species richness +0.5 +0.5 + 1 No change
b) Native over storey cover +1 +1 +1 No change
c) Native mid-storey cover +1 +1 +1 No change
d) Native ground cover (grasses) +1 +1 +1 No change
e) Native ground cover (shrubs) +1 +1 +1 No change
f) Native ground cover (other) +1 +1 +1 No change
g) Exotic plant cover1 +0.5 +0.5 +1 No change
h) Number of trees with hollows 0 +0.5 +0.5 No change
i) Proportion of over-storey species occurring as regeneration
+0.5 +1 +1 No change
j) Total length of fallen logs 0 + 0.5 +1 No change 1 Calculated as a percentage of total ground-storey and mid-storey cover
Draft BioBanking Assessment Methodology (version 2)
17
3.6 Assessment of Landscape Value Landscape Value assesses the change in native vegetation cover and connectivity as a result of development on a development site or management actions on a biobank site, as well as the size of the adjacent remnant areas, based on the following attributes:
Percent native vegetation cover in the landscape assesses the change in the overall percentage of native vegetation cover within 100 ha and 1000 ha assessment circles in which the development and biobank sites are located. Current and future native vegetation cover (extent and condition) in the circles are visually estimated in increments of 10% as shown in Table 6 and Table 7.
Connectivity value assesses the impact of development on the development site and management actions on the biobank site on connectivity of the site with surrounding vegetation using the criteria for determining the connectivity value score.
Adjacent remnant area is the area of moderate to good condition native vegetation of which the biobank site or development site is a part, which is less than 100 m from the next area of moderate to good native vegetation. An adjacent remnant area may extend onto adjoining land. The score for adjacent remnant area is determined according to the Mitchell landscape in which most of the proposal occurs.
A development or biobank site may require one or more assessment circles.
A development or biobank site may require more than one 1000 ha assessment circle. A new 1000 ha assessment circle must be used whenever the development or biobank site:
1 exceeds a single 1000 ha assessment circle, or
2 the configuration of the development or biobank site does not fit into a single 1000 ha assessment circle.
If all the native vegetation to be impacted on the development site or improved by management actions on the biobank site is within a single assessment circle, then the circle is centred on the areas to be impacted. If the area of native vegetation to be impacted on the development site or improved on the biobank site is greater than 1000 ha, or the sites or zones do not fit within a 1000 ha assessment circle, then more than one assessment circle is required. Assessment circles can overlap, however the associated values and scores for vegetation zones, connectivity score and 100 ha assessment circle within each 1000 ha assessment circle are assigned to only one 1000 ha assessment circle. The assessment circles are arranged to ensure that the minimum number are used.
3.6.1 Determining the Landscape Value score
The Landscape Value score is calculated using Equation 4 below.
Equation 4: Ecosystem credits – determine Landscape Value score
The landscape attributes are combined to provide a Landscape Value score out of 50. Percent native vegetation cover in the 100 ha assessment circle is scored out of 10, and percent native vegetation cover in the 1000 ha assessment circle is scored out of 16. Connectivity value and adjacent remnant area are each scored out of 12.
Draft BioBanking Assessment Methodology (version 2)
18
LV = (a + b + c + d) where LV is the Landscape Value score of the development site or biobank sites a is the connectivity value score (section 3.6.2) b is percent native vegetation cover in the 100 ha assessment circle score (see
Table 6) c is percent native vegetation cover in the 1000 ha assessment circle score (see
Table 7) d is adjacent remnant area value (see Table 8).
3.6.2 Determining the connectivity value score
Connectivity value is determined according to the three step process set out below.
The same process is used to determine the loss in connectivity at a development site as for the gain in connectivity at a biobank site. The three step process is applied to each primary connecting linkage to determine its connectivity value. Where there is more than one primary link, the link with the highest connectivity value is used to calculate the number of credits.
Step 1: Determine the number of linkage width classes that are crossed – lost or gained
The site is linked to adjoining vegetation where the site:
is in moderate to good condition, and
has a patch size >1 ha, and
is separated by a distance of < 100 m (or <30 m for grassy ecosystems), or
is not separated by a dual carriageway or wider highway.
The linkage width classes are:
0 – 5 m: >5 m – 30 m; >30 m – 100 m; >100 m – 500 m: >500 m.
The number of linkage width classes that are crossed by reducing or improving connectivity in the primary connecting linkage to the site are scored as:
0 = no change or change is within the class, i.e. does not cross a threshold between the classes
1 = crosses one linkage width threshold, i.e. changes from one linkage width class to the next one across one threshold
2 = crosses two linkage width thresholds, i.e. changes from one class to another class across two thresholds
3 = crosses three linkage width thresholds, i.e. changes from one class to another class across three thresholds
4 = crosses four linkage width thresholds, i.e. changes from one class to another class across four thresholds.
Step 2: Determine the linkage condition class
The condition of the vegetation that forms the connecting linkage, including vegetation on and off the development and biobank sites, is assessed for its average condition class across the entire link. The linkage condition classes for woody vegetation types are determined by assessing over-storey cover and mid-storey cover or ground cover according to Table 3. Mid-storey or ground cover is used according to which strata is the most appropriate for assessing connectivity for the vegetation types that form the link. Linkage condition classes for non-woody vegetation types are determined according to Table 4.
At the development site, the linkage condition class is determined by assessing average condition of the vegetation across the entire link before and after development. The number of
Draft BioBanking Assessment Methodology (version 2)
19
linkage condition class thresholds that are crossed as a result of the loss of vegetation is used in step 3.
At the biobank site the linkage condition class is measured by assessing average condition of the vegetation across the entire link before and after the biobank proposal. The number of condition class thresholds that are crossed as a result of improving vegetation at the biobank site is used in step 3.
The number of linkage condition class thresholds that are crossed as a result of the proposal are scored as:
0 = no change or change is within the same linkage condition class
1 = crosses one linkage condition threshold, i.e. changes from one connectivity condition class to the next one across one threshold
2 = crosses two linkage condition thresholds, i.e. changes from one class to another class across two thresholds
3 = crosses three linkage condition thresholds, i.e. changes from one class to another class across three thresholds
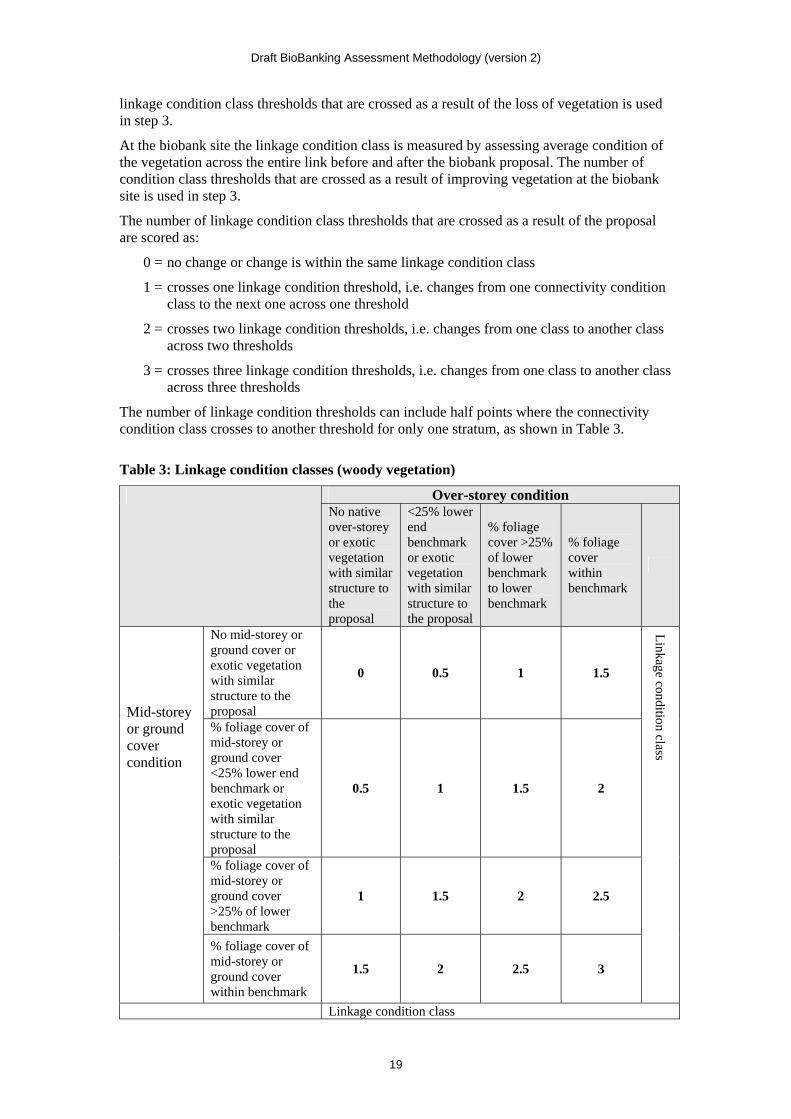
The number of linkage condition thresholds can include half points where the connectivity condition class crosses to another threshold for only one stratum, as shown in Table 3.
Table 3: Linkage condition classes (woody vegetation)
Over-storey condition No native over-storey or exotic vegetation with similar structure to the proposal
<25% lower end benchmark or exotic vegetation with similar structure to the proposal
% foliage cover >25% of lower benchmark to lower benchmark
% foliage cover within benchmark
No mid-storey or ground cover or exotic vegetation with similar structure to the proposal
0 0.5 1 1.5
% foliage cover of mid-storey or ground cover <25% lower end benchmark or exotic vegetation with similar structure to the proposal
0.5 1 1.5 2
% foliage cover of mid-storey or ground cover >25% of lower benchmark
1 1.5 2 2.5
Mid-storey or ground cover condition
% foliage cover of mid-storey or ground cover within benchmark
1.5 2 2.5 3
Linkage condition class
Linkage condition class
Draft BioBanking Assessment Methodology (version 2)
20
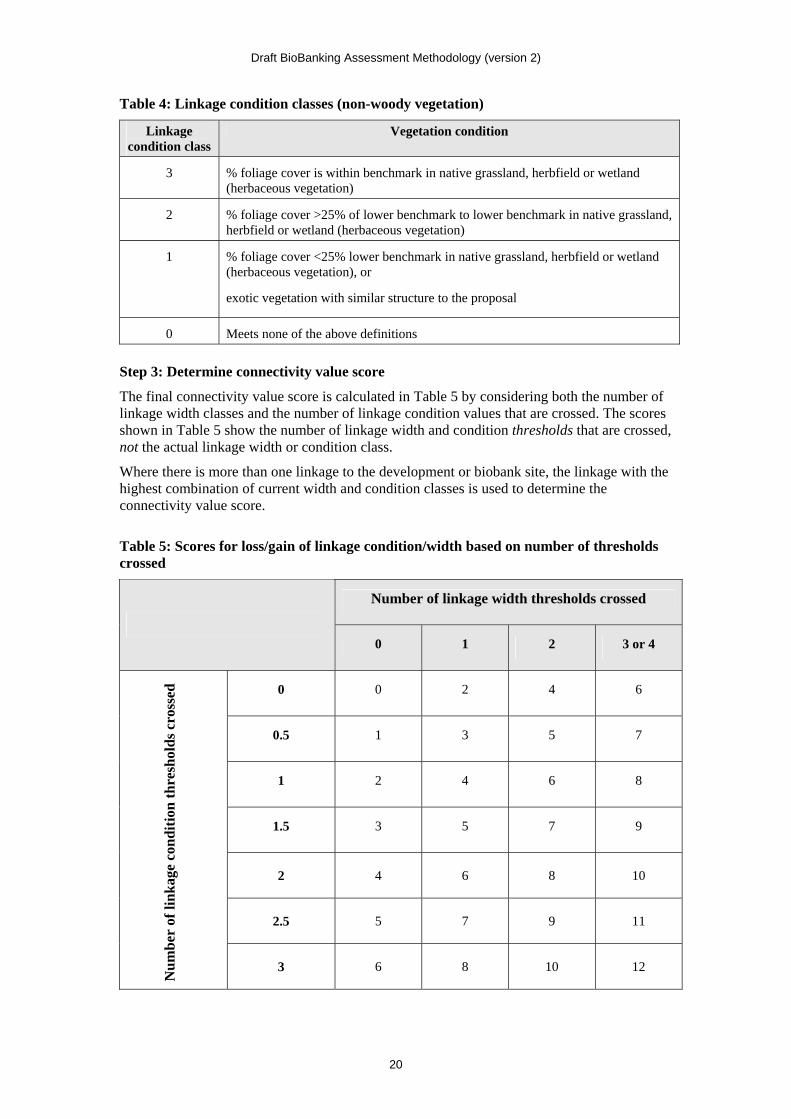
Table 4: Linkage condition classes (non-woody vegetation)
Linkage condition class
Vegetation condition
3 % foliage cover is within benchmark in native grassland, herbfield or wetland (herbaceous vegetation)
2 % foliage cover >25% of lower benchmark to lower benchmark in native grassland, herbfield or wetland (herbaceous vegetation)
1 % foliage cover <25% lower benchmark in native grassland, herbfield or wetland (herbaceous vegetation), or
exotic vegetation with similar structure to the proposal
0 Meets none of the above definitions
Step 3: Determine connectivity value score
The final connectivity value score is calculated in Table 5 by considering both the number of linkage width classes and the number of linkage condition values that are crossed. The scores shown in Table 5 show the number of linkage width and condition thresholds that are crossed, not the actual linkage width or condition class.
Where there is more than one linkage to the development or biobank site, the linkage with the highest combination of current width and condition classes is used to determine the connectivity value score.
Table 5: Scores for loss/gain of linkage condition/width based on number of thresholds crossed
Number of linkage width thresholds crossed
0 1 2 3 or 4
0 0 2 4 6
0.5 1 3 5 7
1 2 4 6 8
1.5 3 5 7 9
2 4 6 8 10
2.5 5 7 9 11
Nu
mb
er o
f li
nk
age
con
dit
ion
th
resh
old
s cr
osse
d
3 6 8 10 12
Draft BioBanking Assessment Methodology (version 2)
21
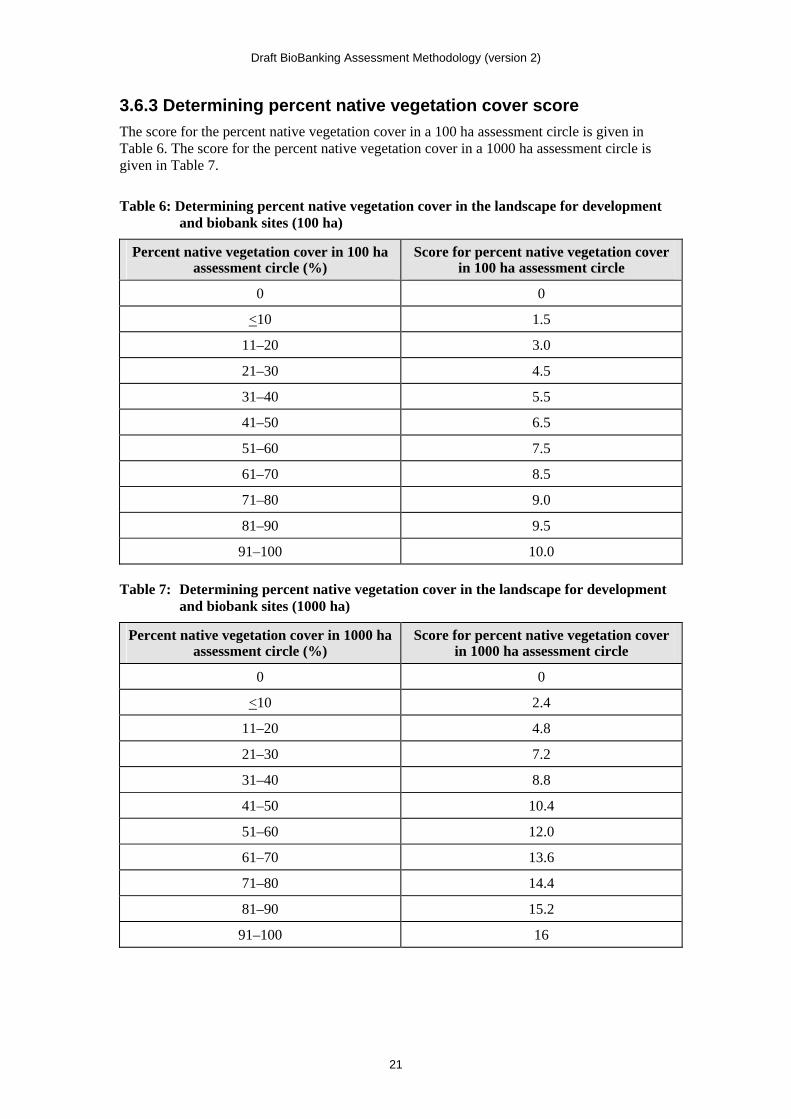
3.6.3 Determining percent native vegetation cover score
The score for the percent native vegetation cover in a 100 ha assessment circle is given in Table 6. The score for the percent native vegetation cover in a 1000 ha assessment circle is given in Table 7.
Table 6: Determining percent native vegetation cover in the landscape for development and biobank sites (100 ha)
Percent native vegetation cover in 100 ha assessment circle (%)
Score for percent native vegetation cover in 100 ha assessment circle
0 0
<10 1.5
11–20 3.0
21–30 4.5
31–40 5.5
41–50 6.5
51–60 7.5
61–70 8.5
71–80 9.0
81–90 9.5
91–100 10.0
Table 7: Determining percent native vegetation cover in the landscape for development and biobank sites (1000 ha)
Percent native vegetation cover in 1000 ha assessment circle (%)
Score for percent native vegetation cover in 1000 ha assessment circle
0 0
<10 2.4
11–20 4.8
21–30 7.2
31–40 8.8
41–50 10.4
51–60 12.0
61–70 13.6
71–80 14.4
81–90 15.2
91–100 16
Draft BioBanking Assessment Methodology (version 2)
22
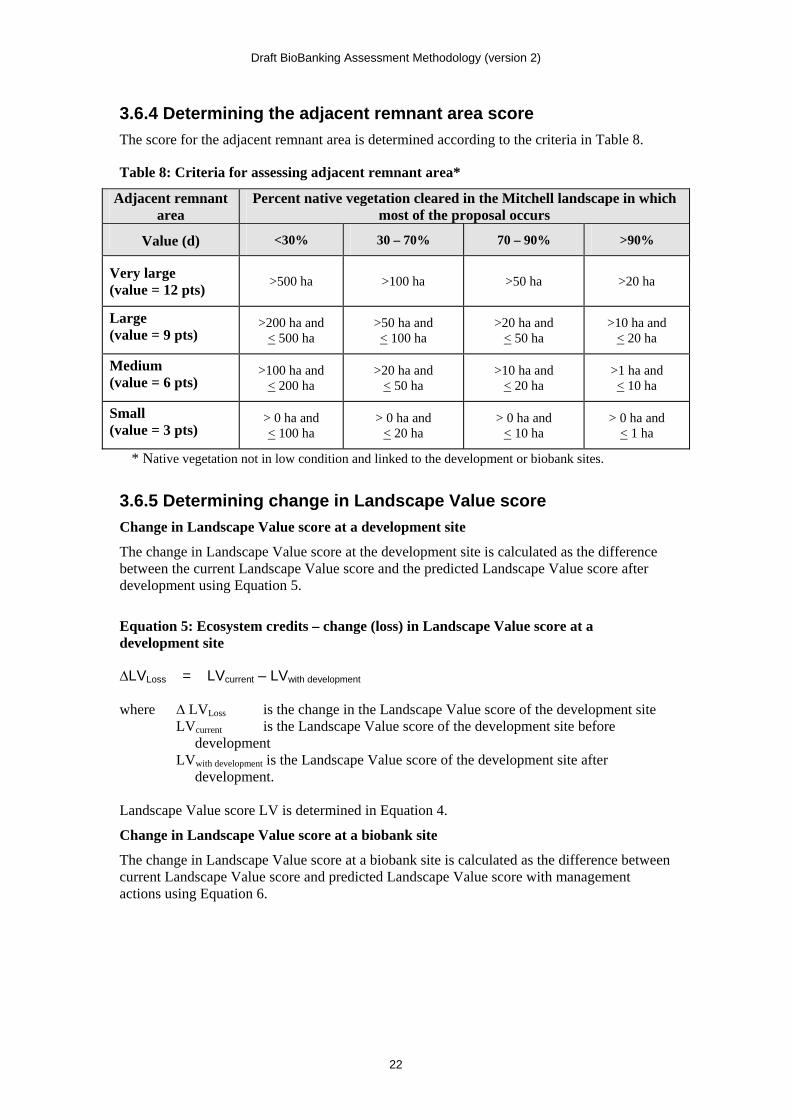
3.6.4 Determining the adjacent remnant area score
The score for the adjacent remnant area is determined according to the criteria in Table 8.
Table 8: Criteria for assessing adjacent remnant area*
Adjacent remnant area
Percent native vegetation cleared in the Mitchell landscape in which most of the proposal occurs
Value (d) <30% 30 – 70% 70 – 90% >90%
Very large (value = 12 pts)
>500 ha >100 ha >50 ha >20 ha
Large (value = 9 pts)
>200 ha and < 500 ha
>50 ha and < 100 ha
>20 ha and < 50 ha
>10 ha and < 20 ha
Medium (value = 6 pts)
>100 ha and < 200 ha
>20 ha and < 50 ha
>10 ha and < 20 ha
>1 ha and < 10 ha
Small (value = 3 pts)
> 0 ha and < 100 ha
> 0 ha and < 20 ha
> 0 ha and < 10 ha
> 0 ha and < 1 ha
* Native vegetation not in low condition and linked to the development or biobank sites.
3.6.5 Determining change in Landscape Value score
Change in Landscape Value score at a development site
The change in Landscape Value score at the development site is calculated as the difference between the current Landscape Value score and the predicted Landscape Value score after development using Equation 5.
Equation 5: Ecosystem credits – change (loss) in Landscape Value score at a development site
∆LVLoss = LVcurrent – LVwith development where ∆ LVLoss is the change in the Landscape Value score of the development site LVcurrent is the Landscape Value score of the development site before
development LVwith development is the Landscape Value score of the development site after
development. Landscape Value score LV is determined in Equation 4.
Change in Landscape Value score at a biobank site
The change in Landscape Value score at a biobank site is calculated as the difference between current Landscape Value score and predicted Landscape Value score with management actions using Equation 6.
Draft BioBanking Assessment Methodology (version 2)
23
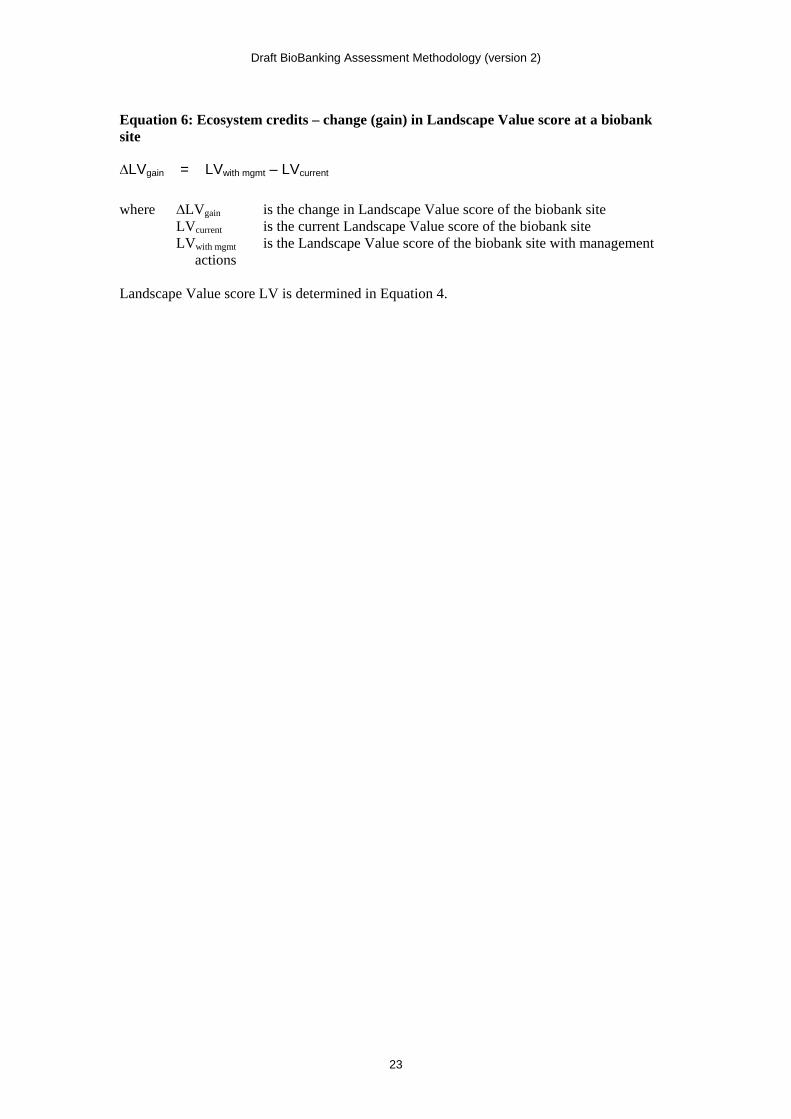
Equation 6: Ecosystem credits – change (gain) in Landscape Value score at a biobank site
∆LVgain = LVwith mgmt – LVcurrent
where ∆LVgain is the change in Landscape Value score of the biobank site LVcurrent is the current Landscape Value score of the biobank site LVwith mgmt is the Landscape Value score of the biobank site with management
actions Landscape Value score LV is determined in Equation 4.
Draft BioBanking Assessment Methodology (version 2)
24
4. Assessment and measurement of threatened species This section outlines the process for assessing impacts on threatened species for which ecosystem credits are created or required, and the assessment process for impacts on threatened species for which species credits are created or required.
4.1 Threatened Species Profile Database Threatened species are assessed in the methodology using data in the Threatened Species Profile Database. This database is held by DECCW, is publicly available and is routinely amended to include new listings of critically endangered, endangered and vulnerable threatened species under the TSC Act and the EPBC Act, and to revise the data as required.
The components of the Threatened Species Profile Database that are used for all threatened species are:
description of each threatened species, its habitat, ecology and threats
CMA subregions within which the distribution of each species is associated (the distribution of a species is not associated with a CMA subregion if the species is identified by the database as being vagrant in that subregion)
vegetation types with which each species is associated
minimum surrounding vegetation cover class with which the species is associated (used as an initial filter to identify species for assessment)
minimum adjacent remnant area or patch size, including low condition (hectares), with which the species is associated (used as an initial filter to identify species for assessment)
the minimum vegetation condition with which the species is associated (being low condition vegetation or moderate to good condition vegetation) (used as an initial filter to identify species for assessment)
the management actions relevant for each species
the ability of a species to respond to improvement in Site Value or other habitat improvement at a biobank site due to the management actions (the TG value)
the class of credit (ecosystem or species) required for the species.
The additional components of the Threatened Species Profile Database that are used in the methodology for threatened species to which ecosystem credits apply are:
the site attributes with which the habitat for the species is associated.
The additional components of the Threatened Species Profile Database that are used in the methodology for threatened species to which species credits apply are:
any geographic characteristics associated with the occurrence of the species
any specific habitat features associated with the occurrence of the species
threatened species which cannot withstand further loss
the unit of measurement of impact to be applied for the species (either the number of individuals or area of habitat)
the months of the year that the species is identifiable through survey.
In exceptional cases, the database may apply two different sets of habitat characteristics for a species. In these instances, the methodology is capable of applying different assessment
Draft BioBanking Assessment Methodology (version 2)
25
approaches to different components of the habitat for the same species. For example, the database may identify that the breeding habitat for a cave roosting bat is a red flag area. However, the foraging habitat for the same species is not a red flag area and can be offset with ecosystem credits.
The Director General may certify that more appropriate local data can be used instead of data in the Threatened Species Profile Database if the local data more accurately reflects local environmental conditions. The Director General must provide reasons for this opinion and publish these reasons on the DECCW website.
4.2 Identifying the threatened species that require assessment The threatened species to be assessed at a site are identified through the primary filtering of all threatened species using five criteria. A threatened species is identified as requiring further assessment in the methodology if all five of the following criteria in the Threatened Species Profile Database are met:
1. The distribution of the species includes the CMA subregion in which the development or biobank site is located.
2. The species is associated with any one or more of the vegetation types occurring within the development or biobank site.
3. The surrounding vegetation cover class within the 1000 ha assessment circle is equal to or greater than the minimum class specified as being required for that species. The minimum surrounding vegetation cover class required for a species is <10%, 11–30%, 31–70% or >70% cover.
4. The condition of any vegetation within the development or biobank site is equal to or greater than the minimum condition required for that species. The minimum condition required for a species is either low condition or moderate to good condition vegetation.
5. The minimum adjacent remnant area or patch size including low condition (for species that can use low condition vegetation) at the development or biobank site is equal to or greater than the minimum specified for that species. The minimum adjacent remnant area or patch size including low condition required for a species is <5 ha, >5–25 ha, >25–100 ha or >100 ha.
The filters are applied to each vegetation zone at both the development and biobank sites. Threatened species that meet the above five criteria require further assessment and these species are then sorted into species that require either ecosystem credits or species credits.
Where the adjacent remnant area or patch size including low condition class varies for the vegetation zone, the class which is adjacent to the largest area of the vegetation zone must be chosen.
Species that are identified in the Threatened Species Profile Database as being predictable by habitat surrogates are assessed according to the methodology for ecosystem credits.
Species that are identified in the Threatened Species Profile Database as not being predictable by habitat surrogates are assessed according to the methodology for species credits.
4.2.1 Attributing a vegetation zone site for a credit profile
Each vegetation zone has attributes that are used to create the credit profile at a development site or biobank site. Vegetation zones are attributed as follows:
Draft BioBanking Assessment Methodology (version 2)
26
1. CMA subregion in which the zone is located
2. vegetation type
3. vegetation formation.
4.3 Assessment of threatened species for ecosystem credits Threatened species that require ecosystem credits are assessed in conjunction with general biodiversity values, based on the vegetation type present on the site. The likely impacts on these species from development at the development site and from management actions undertaken at the biobank site are measured by the predicted change in site attributes that result from these actions and by the area of land that is impacted.
Because species requiring ecosystem credits have a high likelihood of occurrence based on the attributes assigned to a vegetation zone, a threatened species survey is not required.
4.4 Assessment of threatened species for species credits Threatened species for which species credits are created or required are identified in the Threatened Species Profile Database. Species credits apply to threatened species that cannot be reliably predicted to occur in a vegetation type. Species credits can also apply to species that require protection of particular habitat elements, such as breeding habitat for a cave roosting bat.
Species that require species credits are assessed within a species polygon. A species polygon is a contiguous area of land comprising habitat for a threatened species (being a species to which species credits apply). A species polygon may be for a whole vegetation zone, or for a subsection of a vegetation zone, or for one or more vegetation zones, depending on the site configuration of specific habitat attributes used by the species that are identified in the Threatened Species Profile Database.
The filtering process to identify the species that require species credits is according to the three steps below.
Step 1: Secondary filtering of threatened species
Threatened species require assessment within a vegetation zone at a development or biobank site if they meet the secondary filtering criteria:
1 whether the development or biobank site contains any specified geographic attributes that are associated with the species that requires species credits in the Threatened Species Profile Database (for some species or populations the database identifies additional information that describes in more detail the geographical location of a species or populations within the CMA subregion)
2 whether the development or biobank site contains habitat features associated with the species, as identified in the Threatened Species Profile Database.
A species that does not meet the secondary filtering criteria (if one or both geographic or habitat characteristics associated with the species are not present on the site) is regarded as not present at the site and does not require further assessment.
A species that is determined as likely to occur at a development or biobank site because of the secondary filtering (the relevant geographic and habitat requirements are present) is further assessed in step 3.
Draft BioBanking Assessment Methodology (version 2)
27
Step 2: Assessing for any identified population
An assessment of any identified population is required when:
the initial filtering of threatened species indicates that the species is likely to occur in the CMA subregion and vegetation type(s) present at the development or biobank site.
If an identified population is listed in the Identified Population Database for the CMA subregion, further assessment in accordance with step 3 is required to determine if any part of the biobank or development site is within any area identified as containing an identified population.
If an identified population is not listed in the Identified Population Database, or if the development or biobank site is not within an identified population for a species, then the species is assessed against the secondary filters in accordance with step 1 for species credits.
Step 3: Undertaking a threatened species survey
A threatened species survey is a targeted survey for a species that is undertaken in accordance with any threatened species survey guidelines provided in the Operational Manual or by DECCW. The purpose of the survey is to determine if the species is present at the development or biobank site and if so, either:
the area of habitat likely to be impacted by development or management actions (for fauna species),
or
the number of individuals likely to be impacted by development or management actions (for flora species).
The survey must be undertaken during the time of the year that is suitable for identifying the species, as identified in the Threatened Species Profile Database or by DECCW.
At a development site, a threatened species survey is to be undertaken for a threatened species if the secondary filtering of species undertaken in step 1 indicates that the species is likely to occur. However, a threatened species survey is not required if:
the entire development site is within any identified population for the species, being a species for which the unit of measurement of impact is the area of habitat (no surveying is required in this instance), or
an expert report prepared in accordance with section 4.5 has been obtained identifying that the species is unlikely to be present, or
an expert report prepared in accordance with section 4.5 has been obtained identifying that the species is likely to be present and the number of credits required has been calculated based on the estimated number of individuals or area impacted, or
the species, being a species for which the unit of measurement of impact is area of habitat, is assumed to be present and the area of habitat impacted is determined in accordance with section 4.7.
The calculation of the number of credits required is based on the area of habitat or number or individuals likely to be impacted by the development. Similarly, the number of credits that can be created on a biobank site is based on the area of habitat or individuals on the biobank site.
Survey for threatened species is not required on a biobank site unless species credits are proposed to be created.
Draft BioBanking Assessment Methodology (version 2)
28
The number of species credits created at the biobank site is calculated based on the area of habitat or number of individuals likely to be improved by management actions, as determined by:
a threatened species survey that has been undertaken for a threatened species (being a species to which species credits apply) for which the initial and secondary filtering of species has confirmed the presence of the species at the site, or
the area of habitat within an identified population for a species for which the unit of measurement of impact is the area of habitat (no survey is required), or
an expert report prepared in accordance with section 4.5 identifying that the species is likely to be present and the number of credits required has been calculated based on the estimated number of individuals or area of habitat impacted at the biobank site.
4.4.1 Mapping and attributing a species polygon
A species polygon is used to identify any area of land where development impacts on the species at the development site and where specified management actions are required at a biobank site, to calculate the number of credits at the development site and the biobank site.
The boundary of the species polygon is the boundary of the area of land subject to the impact of development or management actions, which surrounds the location(s) of the species and contains the geographic characteristics and/or specific habitat features associated with that species on the development and biobank sites.
At the development site, a species polygon must be mapped if a threatened species is determined to be present by either:
assuming that the species is present (in accordance with section 4.7)
an assessment of any identified population
a threatened species survey
an expert report in accordance with section 4.5.
At a biobank site, a species polygon must be mapped if a threatened species is determined to be present by either:
an assessment of any identified population
an expert report in accordance with section 4.5
a threatened species survey.
A species polygon is attributed with a unit of measurement for the impacts resulting from the development or the management actions. The unit of measurement is either the number of individuals of the species within the species polygon, or the area of habitat for the species (being the area of the species polygon). The Threatened Species Profile Database identifies which unit of measurement of impact is applicable to a species. The unit of measurement for threatened flora species is the number of individuals. The unit of measurement for fauna species is the area of habitat impacted. The assessment process differs depending on which unit of measurement applies.
A species polygon is mapped using a satellite (SPOT5) or ortho-rectified aerial image.
Draft BioBanking Assessment Methodology (version 2)
29
4.5 The use of expert reports instead of undertaking survey An expert report may be obtained instead of undertaking a threatened species survey at a development site. Note that this is a different type of expert report from that referred to in section 2.4.
An expert report instead of survey can only be used for species to which species credits apply and not for any species to which ecosystem credits apply.
The purpose of an expert report instead of survey is to determine that:
the species is unlikely to be present at the development site – in this case no further assessment of the species is required. An expert report cannot determine that a species is unlikely to be present if the land is within an identified population for that species unless approved by the Director General.
the species is likely to be present at the development site – in this case the expert report must provide an estimate of the number of individuals or area of habitat to be impacted by the development (according to the unit of measurement identified for the species in the Threatened Species Profile Database). The area of the species polygon is to be determined in accordance with section 4.4.1. If an estimate of the number of individuals is required, then the estimate is based on the density of individuals in nearby populations. The number of species credits required for the species at the development site is calculated based on this estimate.
the species is likely to be present at the biobank site – in this case the expert report must provide an estimate of the number of individuals or area of habitat on the biobank site (according to the unit of measurement identified for the species in the Threatened Species Profile Database). The area of the species polygon is to be determined in accordance with section 4.4.1. If an estimate of the number of individuals is required, then the estimate is based on the density of individuals in nearby populations. The number of species credits that can be created for the species at the biobank site is calculated based on this estimate.
An expert report prepared for the purposes of this section must be prepared in accordance with any guidance provided in the Operational Manual. The Director General may decide not to accept an expert report instead of survey if it is not prepared in accordance with the guidance provided in the Operational Manual.
4.6 Identified populations The Director General may develop an Identified Population Database which identifies population(s) of threatened species which are known to be present in an area of land. Any population that is identified is referred to as an identified population.
An identified population is relevant for requiring or creating species credits and for identifying red flag areas. Only species that require species credits can be listed as identified populations.
If an identified population is listed for the CMA subregion, further assessment is required in accordance with section 4.4 to determine if any part of the biobank or development site is within any area identified as containing an identified population.
If an area of land contains an identified population, the land will only be considered a red flag area if it is a species that cannot withstand further loss as identified in the Threatened Species Profile Database.
The mapped location or criteria for any threatened species listed in the Identified Population Database will be publicly available on the DECCW website.
Draft BioBanking Assessment Methodology (version 2)
30
4.7 Assumed presence of fauna species Where the development site contains any of the specified geographic attributes and habitat features associated with a fauna species (under the secondary filtering criterion of step 1 in section 4.4), the species may be assumed to be present, instead of undertaking a threatened species survey or obtaining an expert report, as indicated in section 4.4.
Where a species is assumed to be present, the location and area of the species polygon is determined in accordance with section 4.4. The calculation of the number of species credits required at the development site is based on this area of habitat (being the area of the species polygon).
4.8 Inclusion of additional species for species credits Where a threatened species that requires species credits was not predicted to occur through the filtering process but is found on a development site or a biobank site, that species must be included in the calculation of biodiversity credits for the site.
Where an additional species has been included in the calculation of biodiversity credits for the site and it is not predicted to occur within the CMA area, the TG value used in the calculation of biodiversity credits in Equation 13 is to be taken from the CMA area with the lowest TG value for that species.
This does not apply for species that require ecosystem credits, as a site survey is not required for these species.
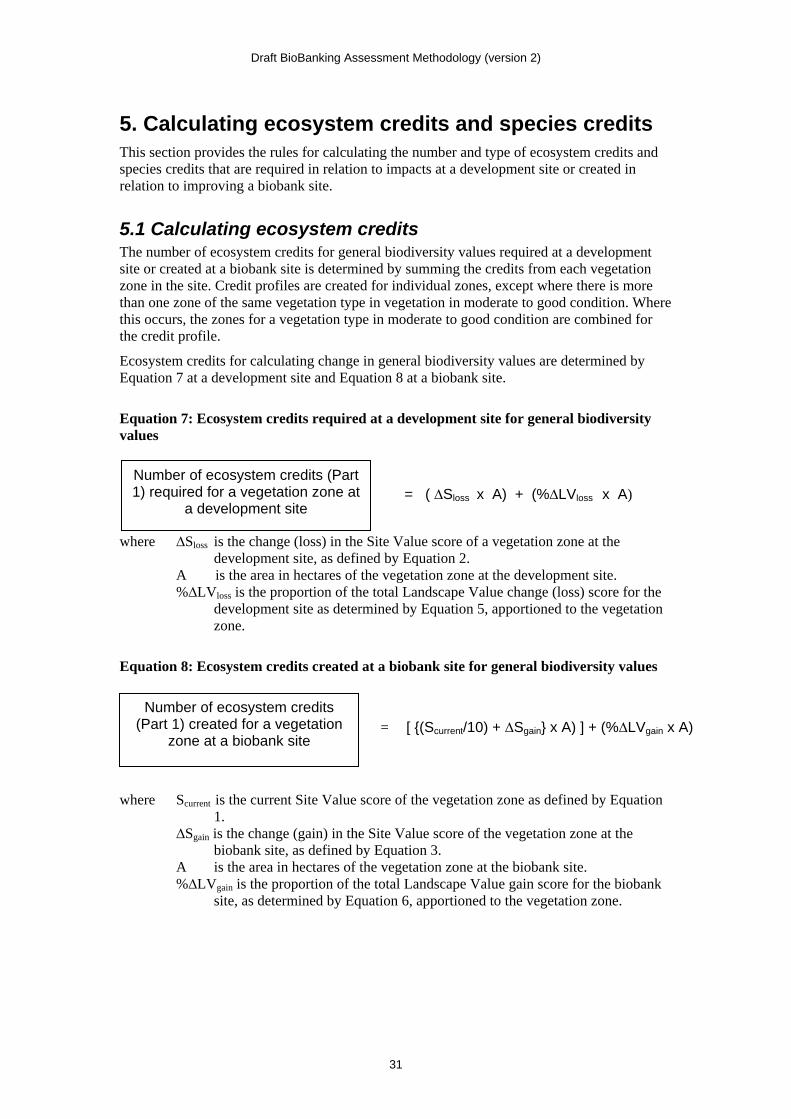
Draft BioBanking Assessment Methodology (version 2)
31
5. Calculating ecosystem credits and species credits This section provides the rules for calculating the number and type of ecosystem credits and species credits that are required in relation to impacts at a development site or created in relation to improving a biobank site.
5.1 Calculating ecosystem credits The number of ecosystem credits for general biodiversity values required at a development site or created at a biobank site is determined by summing the credits from each vegetation zone in the site. Credit profiles are created for individual zones, except where there is more than one zone of the same vegetation type in vegetation in moderate to good condition. Where this occurs, the zones for a vegetation type in moderate to good condition are combined for the credit profile.
Ecosystem credits for calculating change in general biodiversity values are determined by Equation 7 at a development site and Equation 8 at a biobank site.
Equation 7: Ecosystem credits required at a development site for general biodiversity values
where ∆Sloss is the change (loss) in the Site Value score of a vegetation zone at the
development site, as defined by Equation 2. A is the area in hectares of the vegetation zone at the development site. %∆LVloss is the proportion of the total Landscape Value change (loss) score for the
development site as determined by Equation 5, apportioned to the vegetation zone.
Equation 8: Ecosystem credits created at a biobank site for general biodiversity values
where Scurrent is the current Site Value score of the vegetation zone as defined by Equation
1. ∆Sgain is the change (gain) in the Site Value score of the vegetation zone at the
biobank site, as defined by Equation 3. A is the area in hectares of the vegetation zone at the biobank site. %∆LVgain is the proportion of the total Landscape Value gain score for the biobank
site, as determined by Equation 6, apportioned to the vegetation zone.
Number of ecosystem credits (Part 1) required for a vegetation zone at
a development site = ( ∆Sloss x A) + (%∆LVloss x A)
Number of ecosystem credits (Part 1) created for a vegetation
zone at a biobank site
= [ {(Scurrent/10) + ∆Sgain} x A) ] + (%∆LVgain x A)
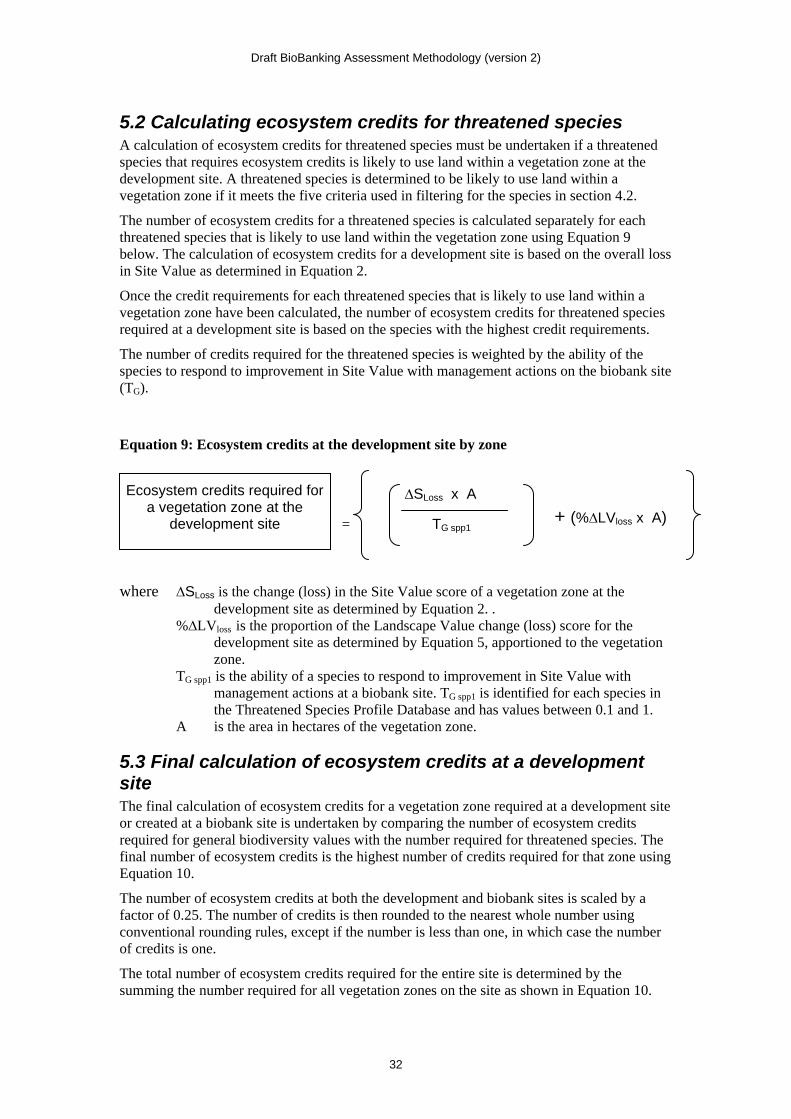
Draft BioBanking Assessment Methodology (version 2)
32
5.2 Calculating ecosystem credits for threatened species A calculation of ecosystem credits for threatened species must be undertaken if a threatened species that requires ecosystem credits is likely to use land within a vegetation zone at the development site. A threatened species is determined to be likely to use land within a vegetation zone if it meets the five criteria used in filtering for the species in section 4.2.
The number of ecosystem credits for a threatened species is calculated separately for each threatened species that is likely to use land within the vegetation zone using Equation 9 below. The calculation of ecosystem credits for a development site is based on the overall loss in Site Value as determined in Equation 2.
Once the credit requirements for each threatened species that is likely to use land within a vegetation zone have been calculated, the number of ecosystem credits for threatened species required at a development site is based on the species with the highest credit requirements.
The number of credits required for the threatened species is weighted by the ability of the species to respond to improvement in Site Value with management actions on the biobank site (TG).
Equation 9: Ecosystem credits at the development site by zone
+ (%∆LVloss x A) where ∆SLoss is the change (loss) in the Site Value score of a vegetation zone at the
development site as determined by Equation 2. . %∆LVloss is the proportion of the Landscape Value change (loss) score for the
development site as determined by Equation 5, apportioned to the vegetation zone.
TG spp1 is the ability of a species to respond to improvement in Site Value with management actions at a biobank site. TG spp1 is identified for each species in the Threatened Species Profile Database and has values between 0.1 and 1.
A is the area in hectares of the vegetation zone.
5.3 Final calculation of ecosystem credits at a development site The final calculation of ecosystem credits for a vegetation zone required at a development site or created at a biobank site is undertaken by comparing the number of ecosystem credits required for general biodiversity values with the number required for threatened species. The final number of ecosystem credits is the highest number of credits required for that zone using Equation 10.
The number of ecosystem credits at both the development and biobank sites is scaled by a factor of 0.25. The number of credits is then rounded to the nearest whole number using conventional rounding rules, except if the number is less than one, in which case the number of credits is one.
The total number of ecosystem credits required for the entire site is determined by the summing the number required for all vegetation zones on the site as shown in Equation 10.
Ecosystem credits required for a vegetation zone at the
development site
∆SLoss x A
= TG spp1
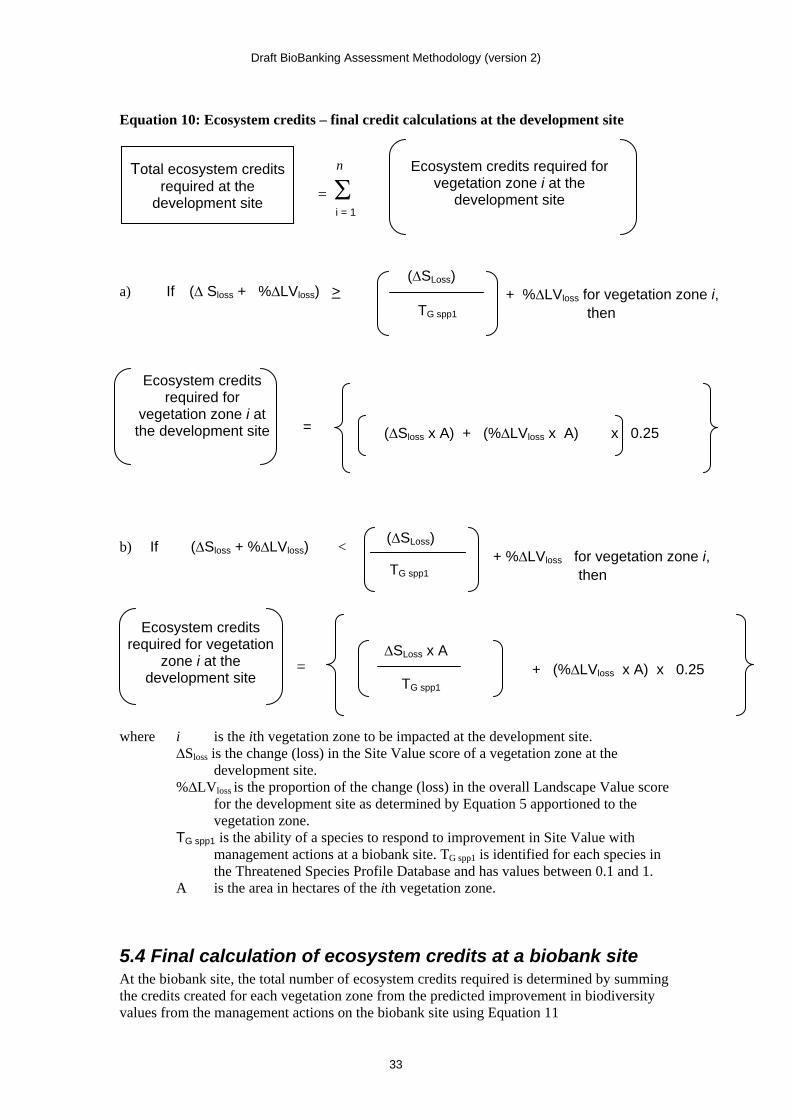
Draft BioBanking Assessment Methodology (version 2)
33
Equation 10: Ecosystem credits – final credit calculations at the development site
a) If (∆ Sloss + %∆LVloss) > b) If (∆Sloss + %∆LVloss) < where i is the ith vegetation zone to be impacted at the development site. ∆Sloss is the change (loss) in the Site Value score of a vegetation zone at the
development site. %∆LVloss is the proportion of the change (loss) in the overall Landscape Value score
for the development site as determined by Equation 5 apportioned to the vegetation zone.
TG spp1 is the ability of a species to respond to improvement in Site Value with management actions at a biobank site. TG spp1 is identified for each species in the Threatened Species Profile Database and has values between 0.1 and 1.
A is the area in hectares of the ith vegetation zone.
5.4 Final calculation of ecosystem credits at a biobank site At the biobank site, the total number of ecosystem credits required is determined by summing the credits created for each vegetation zone from the predicted improvement in biodiversity values from the management actions on the biobank site using Equation 11
Total ecosystem credits required at the
development site
n
= i = 1
Ecosystem credits required for vegetation
zone i at the development site
=
(∆SLoss)
+ %∆LVloss for vegetation zone i, then TG spp1
Ecosystem credits required for
vegetation zone i at the development site
Ecosystem credits required for
vegetation zone i at the development site =
(∆Sloss x A) + (%∆LVloss x A) x 0.25
(∆SLoss) + %∆LVloss for vegetation zone i, then TG spp1
∆SLoss x A
TG spp1 + (%∆LVloss x A) x 0.25
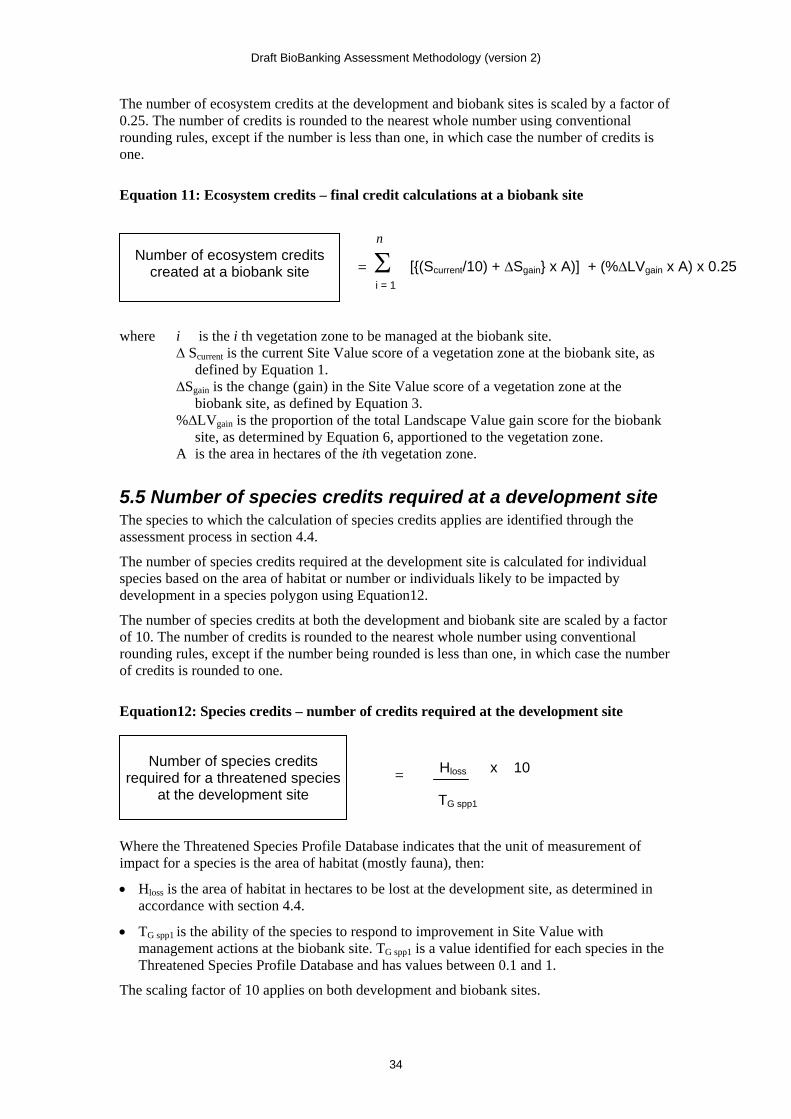
Draft BioBanking Assessment Methodology (version 2)
34
The number of ecosystem credits at the development and biobank sites is scaled by a factor of 0.25. The number of credits is rounded to the nearest whole number using conventional rounding rules, except if the number is less than one, in which case the number of credits is one.
Equation 11: Ecosystem credits – final credit calculations at a biobank site
where i is the i th vegetation zone to be managed at the biobank site. ∆ Scurrent is the current Site Value score of a vegetation zone at the biobank site, as
defined by Equation 1. ∆Sgain is the change (gain) in the Site Value score of a vegetation zone at the
biobank site, as defined by Equation 3. %∆LVgain is the proportion of the total Landscape Value gain score for the biobank
site, as determined by Equation 6, apportioned to the vegetation zone. A is the area in hectares of the ith vegetation zone.
5.5 Number of species credits required at a development site The species to which the calculation of species credits applies are identified through the assessment process in section 4.4.
The number of species credits required at the development site is calculated for individual species based on the area of habitat or number or individuals likely to be impacted by development in a species polygon using Equation12.
The number of species credits at both the development and biobank site are scaled by a factor of 10. The number of credits is rounded to the nearest whole number using conventional rounding rules, except if the number being rounded is less than one, in which case the number of credits is rounded to one.
Equation12: Species credits – number of credits required at the development site
Where the Threatened Species Profile Database indicates that the unit of measurement of impact for a species is the area of habitat (mostly fauna), then:
Hloss is the area of habitat in hectares to be lost at the development site, as determined in accordance with section 4.4.
TG spp1 is the ability of the species to respond to improvement in Site Value with management actions at the biobank site. TG spp1 is a value identified for each species in the Threatened Species Profile Database and has values between 0.1 and 1.
The scaling factor of 10 applies on both development and biobank sites.
n
= i = 1
Number of ecosystem credits created at a biobank site
[{(Scurrent/10) + ∆Sgain} x A)] + (%∆LVgain x A) x 0.25
Hloss x 10
TG spp1
Number of species credits
required for a threatened species at the development site
=
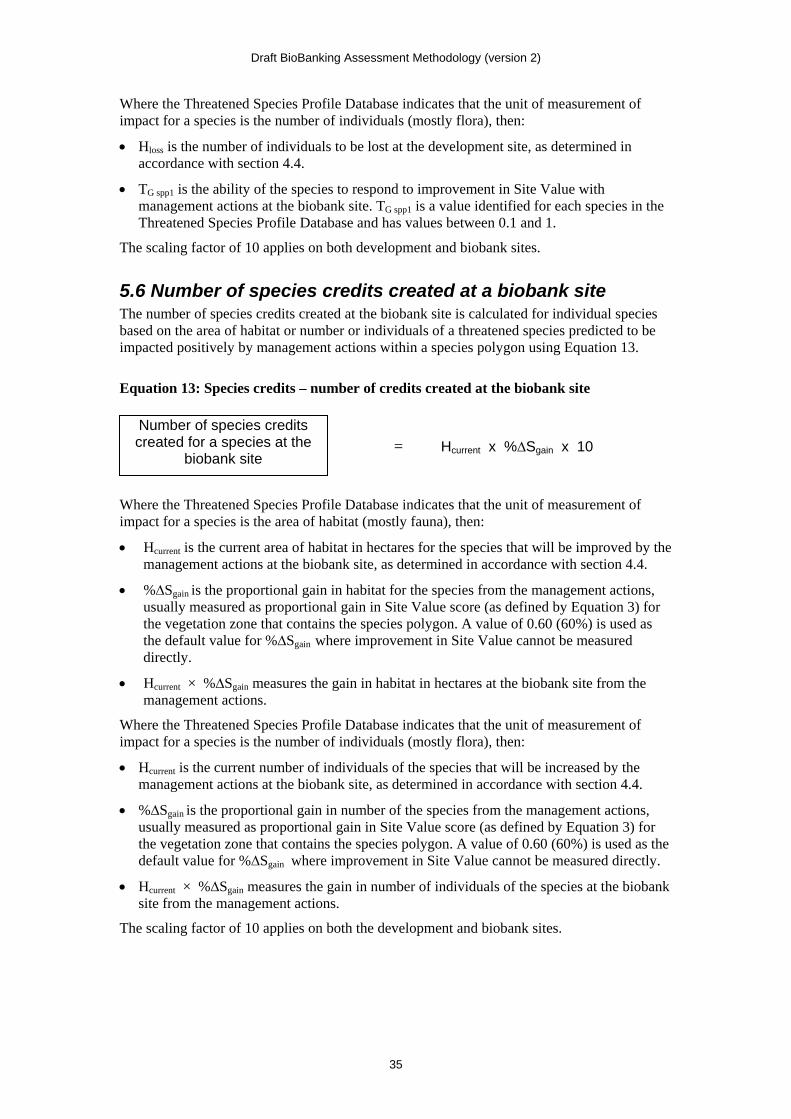
Draft BioBanking Assessment Methodology (version 2)
35
Where the Threatened Species Profile Database indicates that the unit of measurement of impact for a species is the number of individuals (mostly flora), then:
Hloss is the number of individuals to be lost at the development site, as determined in accordance with section 4.4.
TG spp1 is the ability of the species to respond to improvement in Site Value with management actions at the biobank site. TG spp1 is a value identified for each species in the Threatened Species Profile Database and has values between 0.1 and 1.
The scaling factor of 10 applies on both development and biobank sites.
5.6 Number of species credits created at a biobank site The number of species credits created at the biobank site is calculated for individual species based on the area of habitat or number or individuals of a threatened species predicted to be impacted positively by management actions within a species polygon using Equation 13.
Equation 13: Species credits – number of credits created at the biobank site
Where the Threatened Species Profile Database indicates that the unit of measurement of impact for a species is the area of habitat (mostly fauna), then:
Hcurrent is the current area of habitat in hectares for the species that will be improved by the management actions at the biobank site, as determined in accordance with section 4.4.
%∆Sgain is the proportional gain in habitat for the species from the management actions, usually measured as proportional gain in Site Value score (as defined by Equation 3) for the vegetation zone that contains the species polygon. A value of 0.60 (60%) is used as the default value for %∆Sgain where improvement in Site Value cannot be measured directly.
Hcurrent × %∆Sgain measures the gain in habitat in hectares at the biobank site from the management actions.
Where the Threatened Species Profile Database indicates that the unit of measurement of impact for a species is the number of individuals (mostly flora), then:
Hcurrent is the current number of individuals of the species that will be increased by the management actions at the biobank site, as determined in accordance with section 4.4.
%∆Sgain is the proportional gain in number of the species from the management actions, usually measured as proportional gain in Site Value score (as defined by Equation 3) for the vegetation zone that contains the species polygon. A value of 0.60 (60%) is used as the default value for %∆Sgain where improvement in Site Value cannot be measured directly.
Hcurrent × %∆Sgain measures the gain in number of individuals of the species at the biobank site from the management actions.
The scaling factor of 10 applies on both the development and biobank sites.
Hcurrent x %∆Sgain x 10
Number of species credits created for a species at the
biobank site =
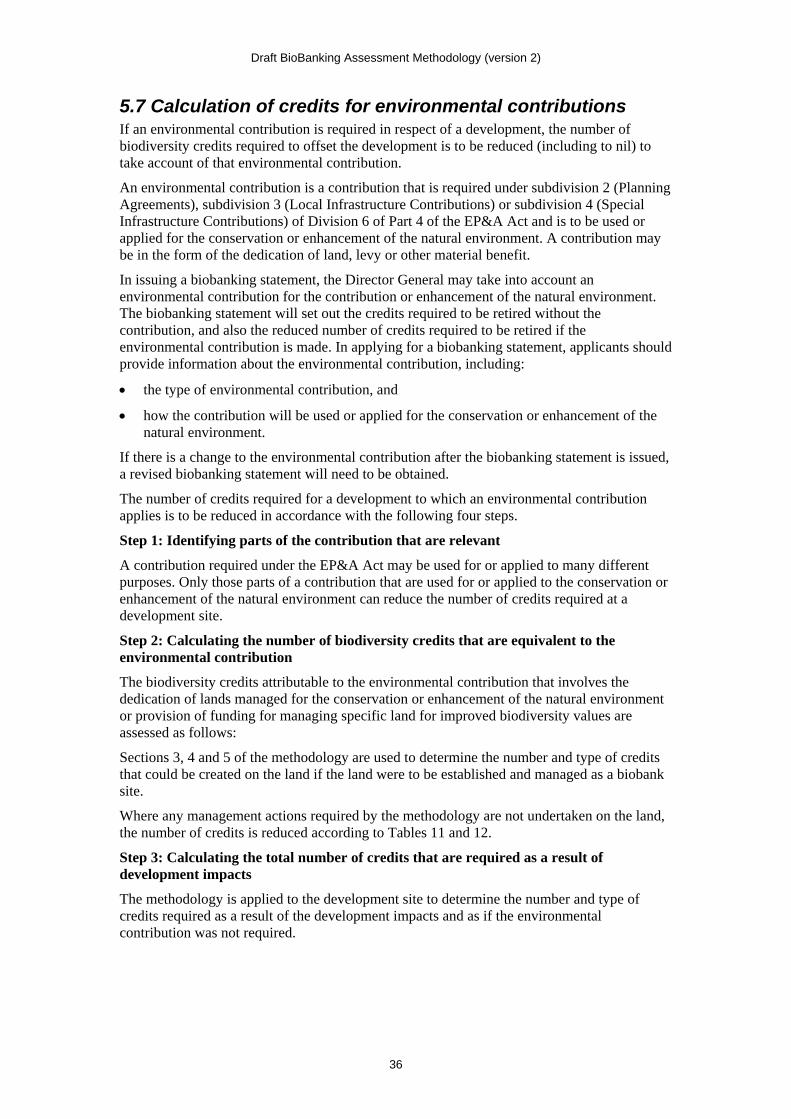
Draft BioBanking Assessment Methodology (version 2)
36
5.7 Calculation of credits for environmental contributions If an environmental contribution is required in respect of a development, the number of biodiversity credits required to offset the development is to be reduced (including to nil) to take account of that environmental contribution.
An environmental contribution is a contribution that is required under subdivision 2 (Planning Agreements), subdivision 3 (Local Infrastructure Contributions) or subdivision 4 (Special Infrastructure Contributions) of Division 6 of Part 4 of the EP&A Act and is to be used or applied for the conservation or enhancement of the natural environment. A contribution may be in the form of the dedication of land, levy or other material benefit.
In issuing a biobanking statement, the Director General may take into account an environmental contribution for the contribution or enhancement of the natural environment. The biobanking statement will set out the credits required to be retired without the contribution, and also the reduced number of credits required to be retired if the environmental contribution is made. In applying for a biobanking statement, applicants should provide information about the environmental contribution, including:
the type of environmental contribution, and
how the contribution will be used or applied for the conservation or enhancement of the natural environment.
If there is a change to the environmental contribution after the biobanking statement is issued, a revised biobanking statement will need to be obtained.
The number of credits required for a development to which an environmental contribution applies is to be reduced in accordance with the following four steps.
Step 1: Identifying parts of the contribution that are relevant
A contribution required under the EP&A Act may be used for or applied to many different purposes. Only those parts of a contribution that are used for or applied to the conservation or enhancement of the natural environment can reduce the number of credits required at a development site.
Step 2: Calculating the number of biodiversity credits that are equivalent to the environmental contribution
The biodiversity credits attributable to the environmental contribution that involves the dedication of lands managed for the conservation or enhancement of the natural environment or provision of funding for managing specific land for improved biodiversity values are assessed as follows:
Sections 3, 4 and 5 of the methodology are used to determine the number and type of credits that could be created on the land if the land were to be established and managed as a biobank site.
Where any management actions required by the methodology are not undertaken on the land, the number of credits is reduced according to Tables 11 and 12.
Step 3: Calculating the total number of credits that are required as a result of development impacts
The methodology is applied to the development site to determine the number and type of credits required as a result of the development impacts and as if the environmental contribution was not required.
Draft BioBanking Assessment Methodology (version 2)
37
Step 4: Calculating the revised number of credits required to offset development taking the environmental contribution into account
The revised number of credits required to offset the development (if any) is calculated by subtracting the number of credits that are equivalent to the relevant actions in step 2 from the number of credits required as a result of the development impacts in step 3. A credit or credits described in step 2 can only be subtracted from the credits required in step 3 if the credits are of a type and profile that are compatible with the credits required in step 3.
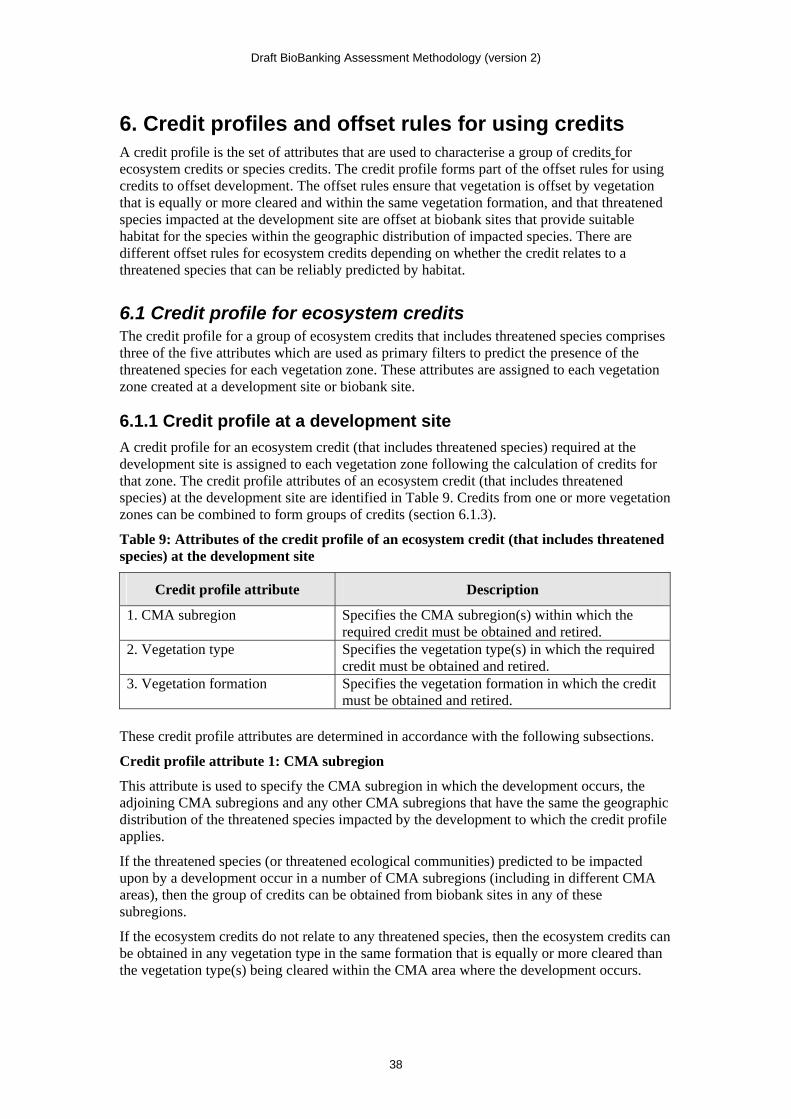
Draft BioBanking Assessment Methodology (version 2)
38
6. Credit profiles and offset rules for using credits A credit profile is the set of attributes that are used to characterise a group of credits for ecosystem credits or species credits. The credit profile forms part of the offset rules for using credits to offset development. The offset rules ensure that vegetation is offset by vegetation that is equally or more cleared and within the same vegetation formation, and that threatened species impacted at the development site are offset at biobank sites that provide suitable habitat for the species within the geographic distribution of impacted species. There are different offset rules for ecosystem credits depending on whether the credit relates to a threatened species that can be reliably predicted by habitat.
6.1 Credit profile for ecosystem credits The credit profile for a group of ecosystem credits that includes threatened species comprises three of the five attributes which are used as primary filters to predict the presence of the threatened species for each vegetation zone. These attributes are assigned to each vegetation zone created at a development site or biobank site.
6.1.1 Credit profile at a development site
A credit profile for an ecosystem credit (that includes threatened species) required at the development site is assigned to each vegetation zone following the calculation of credits for that zone. The credit profile attributes of an ecosystem credit (that includes threatened species) at the development site are identified in Table 9. Credits from one or more vegetation zones can be combined to form groups of credits (section 6.1.3).
Table 9: Attributes of the credit profile of an ecosystem credit (that includes threatened species) at the development site
Credit profile attribute Description
1. CMA subregion Specifies the CMA subregion(s) within which the required credit must be obtained and retired.
2. Vegetation type Specifies the vegetation type(s) in which the required credit must be obtained and retired.
3. Vegetation formation Specifies the vegetation formation in which the credit must be obtained and retired.
These credit profile attributes are determined in accordance with the following subsections.
Credit profile attribute 1: CMA subregion
This attribute is used to specify the CMA subregion in which the development occurs, the adjoining CMA subregions and any other CMA subregions that have the same the geographic distribution of the threatened species impacted by the development to which the credit profile applies.
If the threatened species (or threatened ecological communities) predicted to be impacted upon by a development occur in a number of CMA subregions (including in different CMA areas), then the group of credits can be obtained from biobank sites in any of these subregions.
If the ecosystem credits do not relate to any threatened species, then the ecosystem credits can be obtained in any vegetation type in the same formation that is equally or more cleared than the vegetation type(s) being cleared within the CMA area where the development occurs.
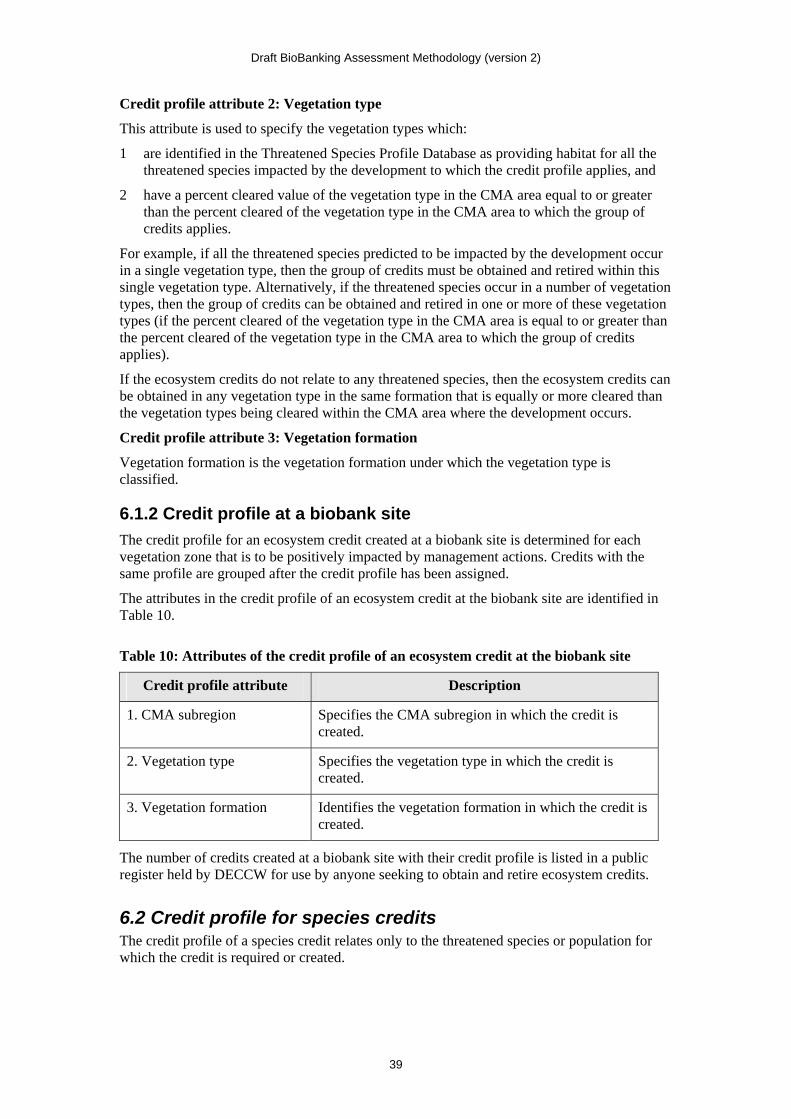
Draft BioBanking Assessment Methodology (version 2)
39
Credit profile attribute 2: Vegetation type
This attribute is used to specify the vegetation types which:
1 are identified in the Threatened Species Profile Database as providing habitat for all the threatened species impacted by the development to which the credit profile applies, and
2 have a percent cleared value of the vegetation type in the CMA area equal to or greater than the percent cleared of the vegetation type in the CMA area to which the group of credits applies.
For example, if all the threatened species predicted to be impacted by the development occur in a single vegetation type, then the group of credits must be obtained and retired within this single vegetation type. Alternatively, if the threatened species occur in a number of vegetation types, then the group of credits can be obtained and retired in one or more of these vegetation types (if the percent cleared of the vegetation type in the CMA area is equal to or greater than the percent cleared of the vegetation type in the CMA area to which the group of credits applies).
If the ecosystem credits do not relate to any threatened species, then the ecosystem credits can be obtained in any vegetation type in the same formation that is equally or more cleared than the vegetation types being cleared within the CMA area where the development occurs.
Credit profile attribute 3: Vegetation formation
Vegetation formation is the vegetation formation under which the vegetation type is classified.
6.1.2 Credit profile at a biobank site
The credit profile for an ecosystem credit created at a biobank site is determined for each vegetation zone that is to be positively impacted by management actions. Credits with the same profile are grouped after the credit profile has been assigned.
The attributes in the credit profile of an ecosystem credit at the biobank site are identified in Table 10.
Table 10: Attributes of the credit profile of an ecosystem credit at the biobank site
Credit profile attribute Description
1. CMA subregion Specifies the CMA subregion in which the credit is created.
2. Vegetation type Specifies the vegetation type in which the credit is created.
3. Vegetation formation Identifies the vegetation formation in which the credit is created.
The number of credits created at a biobank site with their credit profile is listed in a public register held by DECCW for use by anyone seeking to obtain and retire ecosystem credits.
6.2 Credit profile for species credits The credit profile of a species credit relates only to the threatened species or population for which the credit is required or created.
Draft BioBanking Assessment Methodology (version 2)
40
6.3 Offset rules for using credits
6.3.1 Offset rules for ecosystem credits
A biobanking statement can only be issued for a proposed development at a development site if the Director General determines that the proposed development will improve or maintain biodiversity values. The biobanking statement will specify the number and class of credits that must be retired to improve or maintain biodiversity values. The number and class of credits obtained from a biobank site must be compatible with those required at a development site as specified by the biobanking statement.
The ecosystem credits obtained from a biobank site are determined to be compatible with those required at the development site if all of the following conditions are met:
1 The number of ecosystem credits obtained and retired from the biobank site is equal to or greater than the number required at the development site, calculated by Equation 10.
2 The CMA subregion identified in attribute 1 of the credit profile at the biobank site is the same as the subregion(s) identified in attribute 1 of the credit required at the development site.
3 The vegetation type identified in attribute 2 of the credit profile at the biobank site is the same as the vegetation type(s) identified in attribute 2 of the credit required at the development site.
4 The vegetation formation identified in attribute 3 of the credit profile at the biobank site is the same as the vegetation formation identified in attribute 3 of the credit required at the development site.
If no threatened species that require ecosystem credits are predicted to be impacted by the development, then the ecosystem credits retired from a biobank site are determined to be compatible with those required at the development site if the following conditions are met:
1 The number of ecosystem credits obtained and retired from the biobank site(s) is equal to or greater than the number required at the development site, calculated by Equation 10.
2 The CMA subregion identified in attribute 1 of the credit profile at the biobank site is the same as the subregion(s) identified in attribute 1 of the credit required at the development site.
3 The vegetation type identified in attribute 2 of the credit profile at the biobank site is the same as the vegetation type(s) identified in attribute 2 of the credit required at the development site.
4 The vegetation formation identified in attribute 3 of the credit profile at the biobank site is the same as the vegetation formation identified in attribute 3 of the credit required at the development site
6.3.2 Offset rules for species credits
The credit profile of a species credit obtained from a biobank site(s) is determined to be compatible with a credit profile required at a development site if the credit profile at the development and biobank sites refers to the same threatened species.
Draft BioBanking Assessment Methodology (version 2)
41
7. Additional matters
7.1 Deferred retirement arrangements When issuing a biobanking statement, the Director General may approve a deferred retirement arrangement if satisfied that restorative actions will be taken to partially or fully restore or improve the biodiversity values affected by the development.
A deferred retirement arrangement allows the retirement of some or all of the credits required for the development to be deferred pending completion of the restorative actions within a specified time frame. The deferred credits are to be transferred to the Minister and will be held by the Minister pending completion of the relevant restorative actions at the development site.
The types of restorative actions that may be the subject of a deferred retirement arrangement includes, but is not restricted to, the management actions listed in section 2.6 of the methodology.
When the restorative actions are completed, the former holder (or person who acquired the former holder’s rights to apply for the credits) may apply to the Director General for the return of the credits.
When determining the deferred retirement arrangements, the Director General will consider the terms of any lease and/or development consent to assess what restorative actions are required to be carried out on the development site. The Director General will then make an assessment as to whether the terms are suitable to be included in a deferred retirement arrangement. This assessment may also consider any rehabilitation or site restoration plan, such as a Mining, Rehabilitation and Environmental Management Plan, that has been prepared by the applicant and includes the future land use objectives for the site.
The Director General will determine the application in accordance with the requirement of this methodology:
1 The number and class of biodiversity credits that may be returned is determined in accordance with sections 3, 4 and 5 of this methodology as if the restorative actions at the development site were management actions at a biobank site, taking into account the future land use objectives stated in the restoration or rehabilitation plan.
2 The current Site Value in Equation 3 is taken to be the value immediately prior to commencing restorative works. The gain in Site Value score (as determined by Equation 3) is assessed against the benchmark for the vegetation type that was used to determine the number of credits for the original development of the site.
3 The Landscape Value assessment may include newly planted native vegetation where the primary land use objective following the rehabilitation is management for nature conservation.
4 Where the restoration or rehabilitation actions outlined in the restoration or rehabilitation plan do not include or meet the management actions listed in section 2.6 of the methodology, the future site value will be reduced in line with the guidelines in Appendix 4.
5 The Director General must be satisfied that the restorative actions outlined in the plan have been completed to a satisfactory standard.
If the restorative actions are not completed within the time frame specified in the deferred retirement arrangement, the credits may be retired.
The maximum number and class of credits that can be returned is the number and class of credits that are held by the Minister under the deferred retirement arrangement.
Draft BioBanking Assessment Methodology (version 2)
42
Any differences between the number and class of credits returned by the Minister and the number and class of credits required for a biobanking statement requires retirement of the relevant number and class of credits such that the difference is zero.
7.2 Additionality in credit allocations Additionality refers to the extent to which biodiversity credits can be created for management actions that are already required to be carried out pursuant to existing conservation obligations.
Clause 4 of the Regulation requires that biodiversity credits can only be created on land where the management actions are additional to any biodiversity conservation measures, or other actions that are already being carried out on the land or are required to be carried out under the following kinds of existing obligations:
1 a restriction on use or public positive covenant under Part 4A of the Crown Lands Act 1989 (CL Act)
2 a conservation agreement entered into under the NP&W Act
3 a trust agreement entered into under the NCT Act
4 any agreement entered into with a public authority under which the owner of the land receives funding for biodiversity conservation purposes (other than biobanking agreements)
5 in the case of publicly owned land, any legislative requirements to manage the land for biodiversity conservation purposes.
Where a biobank agreement is entered into on land that is subject to one of these existing obligations, the allocation of credits for the biobank site is discounted according to the number and type of conservation measures or actions required to be carried out in relation to the existing obligation. The discount for each management action required is shown in Tables 11 and 12 below.
The current and predicted values of the Site Value score with management are calculated to determine the credit allocation for the site. Additionality is then included by scaling back the number of credits allocated according to which management actions the landholder is already obliged to perform under the existing obligation. For example, if the existing obligation specifies that weed control must be undertaken and that native vegetation regrowth and remnant native vegetation must be retained, then the credit allocation for the biobank site is discounted by 15% for those management actions, that is, 7.5% plus 7.5%.
Where an existing obligation only partially aligns with a biobanking management action (e.g. ‘exclusion of domestic stock’ rather than ‘management of grazing for biodiversity enhancement’), the credit allocation is discounted by 5% rather than by 7.5%.
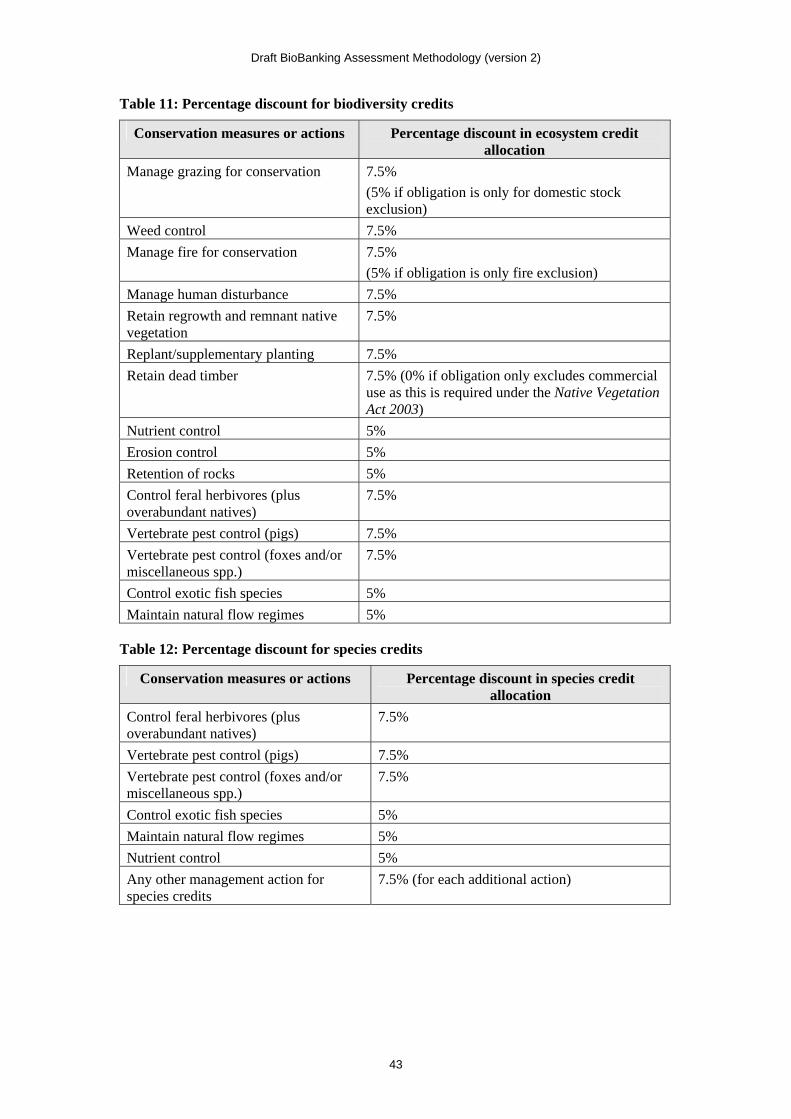
Draft BioBanking Assessment Methodology (version 2)
43
Table 11: Percentage discount for biodiversity credits
Conservation measures or actions Percentage discount in ecosystem credit allocation
Manage grazing for conservation 7.5%
(5% if obligation is only for domestic stock exclusion)
Weed control 7.5%
Manage fire for conservation 7.5%
(5% if obligation is only fire exclusion)
Manage human disturbance 7.5%
Retain regrowth and remnant native vegetation
7.5%
Replant/supplementary planting 7.5%
Retain dead timber 7.5% (0% if obligation only excludes commercial use as this is required under the Native Vegetation Act 2003)
Nutrient control 5%
Erosion control 5%
Retention of rocks 5%
Control feral herbivores (plus overabundant natives)
7.5%
Vertebrate pest control (pigs) 7.5%
Vertebrate pest control (foxes and/or miscellaneous spp.)
7.5%
Control exotic fish species 5%
Maintain natural flow regimes 5% Table 12: Percentage discount for species credits
Conservation measures or actions Percentage discount in species credit allocation
Control feral herbivores (plus overabundant natives)
7.5%
Vertebrate pest control (pigs) 7.5%
Vertebrate pest control (foxes and/or miscellaneous spp.)
7.5%
Control exotic fish species 5%
Maintain natural flow regimes 5%
Nutrient control 5%
Any other management action for species credits
7.5% (for each additional action)
Draft BioBanking Assessment Methodology (version 2)
44
This rule does not apply to:
a restriction on use or public positive covenant under Part 4A of the CL Act that is imposed in connection with an application to purchase land that is duly made by a leaseholder in respect of that land before 1 January 2009
a conservation agreement entered into under the NP&W Act as a result of a proposal made by the landholder to the Minister administering that Act before 1 January 2009
a trust agreement entered into under the NCT Act as a result of a proposal made by the landholder to the Nature Conservation Trust before 1 January 2009.
7.3 Application of the assessment methodology In relation to an application for a biobanking statement or biobanking agreement, the application of the methodology to determine the number of biodiversity credits required at a development site or to be created at a biobank site must be made by a person accredited in accordance with section 142B of the TSC Act to use the methodology and the Credit Calculator.
Draft BioBanking Assessment Methodology (version 2)
45
Glossary Adjacent remnant area: The area of moderate to good condition native vegetation of which the biobank site or development site is a part, which is less than 100 m from the next area of native vegetation. Adjacent remnant area provides landscape context to the biobank or development site, and may extend onto adjoining land.
Assessment circle: Circles of 100 ha and 1000 ha in which percent native vegetation cover in the landscape is assessed, taking into account both cover and condition of vegetation, for credit profiles and for Landscape Value score.
Benchmarks (vegetation benchmarks): Quantitative measures of the range of variability in vegetation condition where there is relatively little evidence of modification by humans since European (post 1750) settlement. Benchmarks are defined for specified variables for vegetation communities. Vegetation with relatively little evidence of modification generally has minimal timber harvesting (few stumps, coppicing, cut logs), minimal firewood collection, minimal exotic weed cover, minimal grazing and trampling by introduced or overabundant native herbivores, minimal soil disturbance, minimal canopy dieback, no evidence of recent fire or flood, not subject to high frequency burning, and evidence of recruitment of native species. Benchmarks are available by vegetation class (sensu Keith 2004) at http://www.environment.nsw.gov.au/projects/BiometricTool.htm, and can also be obtained from reference sites or published sources.
Biobanking agreement: An agreement between the landowner and the Minister for Climate Change and the Environment (under Part 7A of the TSC Act) for the purpose of establishing a biobank site. The agreement states the management actions to be carried out to improve biodiversity values on the site and thereby create biodiversity credits under the scheme (section 127D of the TSC Act).
Biobank site: Land designated by a biobanking agreement to be a biobank site.
Biobanking statement: A statement issued under section 127ZL of the TSC Act specifying the number and class of credits to be retired for a particular development in accordance with the methodology. The statement may include other conditions to minimise the impact of the development on biodiversity values. If provided to a consent or determining authority under the EP&A Act, the statement must be included as a condition of development consent or approval.
Biodiversity credits: Ecosystem or species credits required to offset the loss of biodiversity values on development sites or created on biobank sites from management actions that improve biodiversity values.
Biodiversity values: Include composition, structure and function of ecosystems, and include (but are not limited to) threatened species, populations and ecological communities and their habitats, as defined by the TSC Act, and exclude fish or marine vegetation, unless that fish or marine vegetation has been the subject of an order under section 5A of the TSC Act.
Certified local data: see more appropriate local data
CMA area: The area of operation of a catchment management authority, as described in Schedule 2 of the Catchment Management Authorities Act 2003.
CMA subregion: Subregions of catchment management authority areas as set out in the Environmental Outcomes Assessment Methodology, Native Vegetation Regulation 2005.
Connectivity: A measure of the degree to which an area(s) of native vegetation is linked with other areas of vegetation.
Credit Calculator: A computer program that applies the methodology and calculates the number and classes of credits required at a development site or created at a biobank site.
Draft BioBanking Assessment Methodology (version 2)
46
Credit profile: A description of the credit created or required in a vegetation zone or group of zones, according to the attributes of CMA subregion, vegetation type, vegetation formation, surrounding vegetation cover, and patch size, including low condition.
Critically endangered ecological community: see threatened ecological community
Deferred retirement arrangement: An arrangement under section 127ZT of the TSC Act which enables the Minister for Climate Change and the Environment to hold biodiversity credits until restorative actions have been completed at a development site.
Development: Includes development within the meaning of the Environmental Planning and Assessment Act 1979 and includes an activity within the meaning of Part 5 of that Act, and may also include projects under Part 3A of that Act.
Development site: An area of land that is subject to a proposed development for which a biobanking statement is sought or obtained.
Ecosystem credits: The class of biodiversity credits created or required for the impact on general biodiversity values and some threatened species, i.e. for biodiversity values except threatened species or populations that require species credits. Species that require ecosystem credits are listed in the Threatened Species Profile Database.
Endangered ecological community: see threatened ecological community
Environmental contribution: A contribution for the conservation or enhancement of the natural environment, as defined in section 127B(10) of the TSC Act.
Expert: An expert is a person who is accredited by the Director General under section 142B(1)(b) of the TSC Act, or if arrangements for accreditation under section 142B(1)(b) are not in place, a person who has the relevant experience and/or qualifications to provide expert opinion in relation to the biodiversity values to which an expert report relates.
General biodiversity values: Biodiversity values assessed in the methodology excluding assessment of threatened species and populations.
Grassland: Native vegetation classified in the vegetation formation Grasslands in Keith, D. (2004), Ocean shores to desert dunes: the native vegetation of New South Wales and the ACT, Department of Environment and Conservation (NSW), Hurstville, NSW. Grasslands are generally dominated by large perennial tussock grasses, a lack of woody plants, the presence of broad-leaved herbs in inter-tussock spaces, and their ecological association with fertile, heavy clay soils on flat topography in regions with low to moderate rainfall.
Group of credits: Credits from a development or biobank site that have an identical credit profile.
Habitat: An area or areas occupied, or periodically or occasionally occupied, by a species, population or ecological community, including any biotic or abiotic component.
Habitat surrogates: Measures of habitat for threatened species, populations and communities; in the methodology they are CMA subregion, vegetation type, percent vegetation cover, vegetation condition and patch area, including low condition vegetation.
Herbfield: Native vegetation which predominantly does not contain an over-storey or mid-storey and where the ground cover is dominated by non-grass species.
Highly cleared vegetation type: A vegetation type which has 10% or less of its estimated pre-1750 distribution in the CMA remaining (as shown by the Vegetation Types Database).
Identified population: A population present within an area of land if identified as habitat for a particular species and listed in the Identified Population Database.
Identified Population Database: A database that may be published by DECCW and made publicly available on the internet which contains information such as a map or criteria that describe the location of an identified population.
Draft BioBanking Assessment Methodology (version 2)
47
Impact assessment: The impact assessment referred to in section 127ZK(3)(c) of the TSC Act which must be prepared in accordance with this methodology. The methodology requires the impact assessment to address the criteria used to justify an impact on a red flag area under section 2.3, the assessment of indirect impacts of the development under section 2.4, and the assessment of the direct impacts of the development under sections 3 and 4 of the methodology.
Impacts on biodiversity values: Refers to loss in biodiversity values on or off the development site and gain in biodiversity values at the biobank site.
Individual: A single, mature organism.
Landscape Value: A measure of fragmentation, connectivity and adjacency of native vegetation at a site. Landscape Value comprises: 1) percent native vegetation cover in the 100 ha and 1000 ha assessment circles in which the development or biobank sites are located; 2) connectivity with surrounding vegetation; and 3) total adjacent remnant area.
Low condition vegetation: Woody native vegetation with native over-storey percent foliage cover less than 25% of the lower value of the over-storey percent foliage cover benchmark for that vegetation type, and
less than 50% of ground cover vegetation is indigenous species, or
greater than 90% of ground cover vegetation is cleared.
Native grassland, wetland or herbfield where:
less than 50% of ground cover vegetation is indigenous species, or
more than 90% of ground cover vegetation is cleared.
If native vegetation is not in low condition, it is in moderate to good condition.
Methodology: means the BioBanking Assessment Methodology.
Minister: means the Minister for Climate Change and the Environment.
Mitchell landscape: Landscapes with relatively homogeneous geomorphology, soils and broad vegetation types, mapped at a scale of 1:250,000.
Moderate to good condition vegetation: Native vegetation that is not in low condition, as defined in section 2.1.1.
More appropriate local data: Data that more accurately reflects local environmental conditions as certified by the Director General in relation to the Vegetation Benchmarks Database, the Vegetation Types Database and the Threatened Species Profile Database.
Native vegetation: Vegetation described in section 6 of the NV Act. Native vegetation is used as a surrogate for general biodiversity values in the methodology.
Offset rules: Circumstances in which credits can be used (retired) for a development to improve or maintain biodiversity values.
Operational Manual: Means the BioBanking Operational Manual which provides guidance on how to use the Credit Calculator and undertake surveys.
Patch size, including low condition vegetation: The area of moderate to good and low condition native vegetation of which the biobank site or development site is a part, which is less than 100 m from the next area of native vegetation. Patch size, including low condition vegetation, provides landscape context to the biobank or development site, and may extend onto adjoining land.
Percent cleared: The percentage of a vegetation type that has been cleared within a CMA area as a proportion of its pre-1750 extent, as identified in the Vegetation Types Database.
Draft BioBanking Assessment Methodology (version 2)
48
Percent foliage cover: The percentage of ground that would be covered by a vertical projection of the foliage and branches and trunk of a plant or plants.
Percent vegetation cover (percent native vegetation cover in the landscape, surrounding vegetation cover): The percentage of native vegetation cover in the 100 ha and 1000 ha assessment circles in which the vegetation zone is located. The percent native vegetation cover within the assessment circles is visually estimated from aerial or satellite imagery, taking into account both cover and condition of vegetation
Plot: An area in which some of the 10 site attributes that make up the Site Value score are assessed in a vegetation zone.
Red flag area: An area of land with high biodiversity conservation values. Where a red flag area occurs on a development site, the impact of the development on biodiversity values cannot be offset by the retirement of biodiversity credits in order to improve or maintain biodiversity values, unless the Director General determines that strict avoidance of the red flag area is unnecessary in the circumstances.
Reference sites: Relatively unmodified sites used to obtain local benchmark information when benchmarks in the Vegetation Benchmark Database are too broad or otherwise incorrect for the vegetation type and/or local situation. Benchmarks can also be obtained from published sources.
Retirement of biodiversity credits: A change in the status of a credit such that the credit can no longer be bought or sold. Retirement of credits may be required to comply with a biobanking statement or a direction issued by the Minister for Climate Change and the Environment, or they may be retired voluntarily.
Site attributes: Attributes used to assess Site Value and threatened species habitat. The 10 site attributes are native plant species richness, native over-storey cover, native mid-storey cover, native ground cover (grasses), native ground cover (shrubs), native ground cover (other), exotic plant cover (as a percentage of total ground and mid-storey cover), number of trees with hollows, proportion of over-storey species occurring as regeneration, and total length of fallen logs.
Site Value: A quantitative measure of structural, compositional and functional condition of native vegetation, measured by site attributes.
Species that cannot withstand any loss: In general, a species is identified as not being able to withstand any loss within a CMA if the species is known to occur in less than three populations within that CMA area (also see section 2.3 of the methodology).
Species credits: The class of biodiversity credits created or required for the impact on threatened species that cannot be reliably predicted to use an area of land based on habitat surrogates. Species that require species credits are listed in the Threatened Species Profile Database.
Species polygon: The actual area of habitat, or number of individuals of a threatened species, impacted by development at the development site or by management actions at the biobank site.
Surrounding percent vegetation cover: see percent vegetation cover
Surrounding vegetation cover: see percent vegetation cover
TG value: The ability of a species to respond to improvement in Site Value or other habitat improvement at a biobank site with management actions. TG is based on the lowest value of the following: effectiveness of management actions, life history characteristics, naturally very rare species, and very poorly known species.
Threatened ecological community: Defined in section 4(1) TSC Act or any additional threatened ecological communities listed under Part 13 of the EPBC Act.
Draft BioBanking Assessment Methodology (version 2)
49
Threatened population: An endangered population as defined in section 4(1), TSC Act.
Threatened species: Critically endangered, endangered or vulnerable threatened species and populations as defined in section 4(1) of the TSC Act, or any additional threatened species listed under Part 13 of the EPBC Act as critically endangered, endangered or vulnerable.
TSC Act: means the Threatened Species Conservation Act 1995.
Threatened Species Profile Database: The database containing information on habitat characteristics, range, response to management actions, survey requirements, and the class of biodiversity credit required for the species. It is used for calculation of ecosystem or species credits, filtering to determine the likely presence of threatened species, information on threatened species ability to withstand loss, and threatened species response to management.
Threatened species survey: A targeted survey for a threatened species undertaken in accordance with DECCW guidelines to determine if the species is present.
Transect A line or narrow belt along which environmental data is collected.
Vegetation Benchmarks Database: A database of benchmarks for vegetation classes and some vegetation types. Vegetation benchmarks can also be collected from reference sites.
Vegetation class: Level of classification of vegetation communities defined in Keith, D. (2004), Ocean shores to desert dunes: the native vegetation of New South Wales and the ACT, Department of Environment and Conservation NSW, Hurstville. There are 99 vegetation classes in NSW.
Vegetation formation: A broad level of vegetation classification as defined in Keith, D. (2004), Ocean shores to desert dunes: the native vegetation of New South Wales and the ACT, Department of Environment and Conservation NSW, Hurstville. There are 12 vegetation formations in NSW.
Vegetation type: The finest level of classification of native vegetation used in the methodology. Vegetation types are assigned to vegetation classes, which in turn are assigned to vegetation formations. There are approximately 1600 vegetation types within NSW.
Vegetation Types Database: A database which contains the information on each vegetation type used in the methodology and comprises a description of each vegetation type, its class and formation, the CMA area within which the vegetation type occurs, the percent cleared value of the vegetation type, and the source of the information.
Vegetation zone (zone): A relatively homogenous area in a proposal area (development or biobank site) that is the same vegetation type and broad condition. A single zone must not contain a mix of vegetation in low condition and not in low condition. Zones with the same vegetation type and in moderate to good condition (i.e. not in low condition) can be combined within one ecosystem credit profile (as a subzone). A zone may comprise one or more discontinuous areas.
Viability: The ability of biodiversity values in an area to persist for many generations or long time periods.
Wetland: Native vegetation classified in the vegetation formation defined as Freshwater Wetland in Keith, D. (2004), Ocean shores to desert dunes: the native vegetation of New South Wales and the ACT, Department of Environment and Conservation NSW, Hurstville.
Woody native vegetation: Native vegetation that contains an over-storey and/or mid-storey that predominantly consists of trees and/or shrubs.
Zone: see vegetation zone
Draft BioBanking Assessment Methodology (version 2)
50
Appendix 1: Guidelines for the use of benchmark data from local reference sites or published sources Benchmark data from local reference sites may be used where that data more accurately reflects the local environmental conditions and condition attributes for a vegetation type. Where local benchmark data is developed, it must be derived from measurements taken on reference sites that measure the same vegetation type in a relatively unmodified condition or from published sources. The Director General must approve the use of benchmark data from local reference sites or published sources.
Locating reference sites
Reference sites are required to have little modification relative to other vegetation in the region as indicated by minimal timber harvesting (few stumps, coppicing, cut logs), minimal firewood collection, minimal exotic weed cover, minimal grazing and trampling by introduced or overabundant native herbivores, minimal soil disturbance, dieback not in excess of normal senescence, no evidence of very recent major perturbation such as fire or flood, not subject to high frequency burning, and evidence of recruitment of native plant species.
It may be difficult to find totally unmodified sites in a landscape, particularly in highly cleared regions. Vegetation in relatively unmodified condition can be found in some travelling stock routes and reserves, national parks and nature reserves, state forests (especially flora reserves), cemeteries, roadsides and commons. Appropriate reference sites may also exist on the development site. Reference sites can occur in small remnants, such as narrow roadsides and cemeteries.
Number of reference plots
To obtain a reasonable composite picture that encompasses the variation in condition variables, a minimum of three reference plots for each variable should be measured for each vegetation type, with more plots being desirable.
Published sources
Benchmarks may also be obtained from published sources.
Draft BioBanking Assessment Methodology (version 2)
51
Appendix 2: Survey design – stratification and survey effort This information on survey design and the visual and computer-based interpretation of remotely sensed imagery for the assessment of development and biobank sites is adapted from section 3, section 4 and Appendix 2C of the Native Vegetation Interim Type Standard. The Native Vegetation Interim Type Standard addresses the nature and quality of the scientific process for native vegetation type activities including remote sensing interpretation, field survey, data manipulation, data management and mapping.
For this methodology, the stratification and survey effort relate to the mapping of vegetation zones based on vegetation type and condition, and the extent to which the condition attribute data is collected to determine the condition of the vegetation zone.
The Native Vegetation Type Interim Standard is available from the DECCW website at www.environment.nsw.gov.au/resources/nativeveg/10060nvinttypestand.pdf.
Survey design for biobank sites and development sites Rigorous survey design (stratification and survey effort) ensures that field-based vegetation activities are efficient. The required outcomes for the methodology include mapping of vegetation types based on the Vegetation Types Database, and collection of vegetation zone condition data. This is achieved by:
1 field-based vegetation activities conducted systematically using explicit and repeatable processes
2 data collected with minimum bias and compatible amongst activities
3 field effort commensurate with the spatial and thematic scales of the biobank site or development site, and
4 field-based activities yielding verifiable data which facilitates multiple uses.
Stratification and survey effort
A field survey that is based on a complete and clearly described survey design is essential for vegetation field sampling. Unambiguous design and execution of field sampling reduces bias and variance in the data.
A field survey provides vegetation data from which native vegetation products are derived. Absolute numbers of plots are not stipulated in the Native Vegetation Type Interim Standard as survey effort is determined by a variety of factors that will vary widely across the state.
Random stratified sampling is adopted as best practice for the Native Vegetation Type Interim Standard.
Three important principles underpin the determination of survey effort in the Native Vegetation Interim Type Standard which is adopted for this methodology. These include:
Representation: Vegetation zones represent unique combinations of environmental and biotic factors. By stratifying vegetation into zones on a development or biobank site and in proportion to its total area, a representative sample can be compiled.
Replication: Each vegetation zone is sampled at several locations (see Appendix 4 of the Standard).
Randomisation: Plots/transects are located randomly within the vegetation zone but may be subject to rules regarding relationships with boundaries, clumping and access (see Appendix 3 of the Standard).
Draft BioBanking Assessment Methodology (version 2)
52
Visual interpretation of imagery
Interpretation of remote-sensed imagery or an aerial photograph can provide a primary spatial data layer. It can also define the spatial extent of patterns in native vegetation through expert systems or computer modelling.
For the methodology, the primary function of Remote Image Interpretation is recognising and delineating spatial patterns in native vegetation that can be used to delineate changes in vegetation types and condition into vegetation zones.
In the context of assessing a development or biobank site, vegetation zones are attributed with existing vegetation types according to the Vegetation Types Database. Remotely observed patterns are linked to the vegetation types based on:
(a) prior knowledge of the regional vegetation
(b) linkage of plot data, used in defining the types, with remotely observed patterns
(c) direct field observation from rapid survey.
This process often requires application of all of the above and interaction between experts in interpretation of remote imagery and ecologists with knowledge of the area.
Further information on the visual interpretation of remote or aerial imagery can be found in Appendix 2 Part C of the Standard, or can be provided by DECCW.
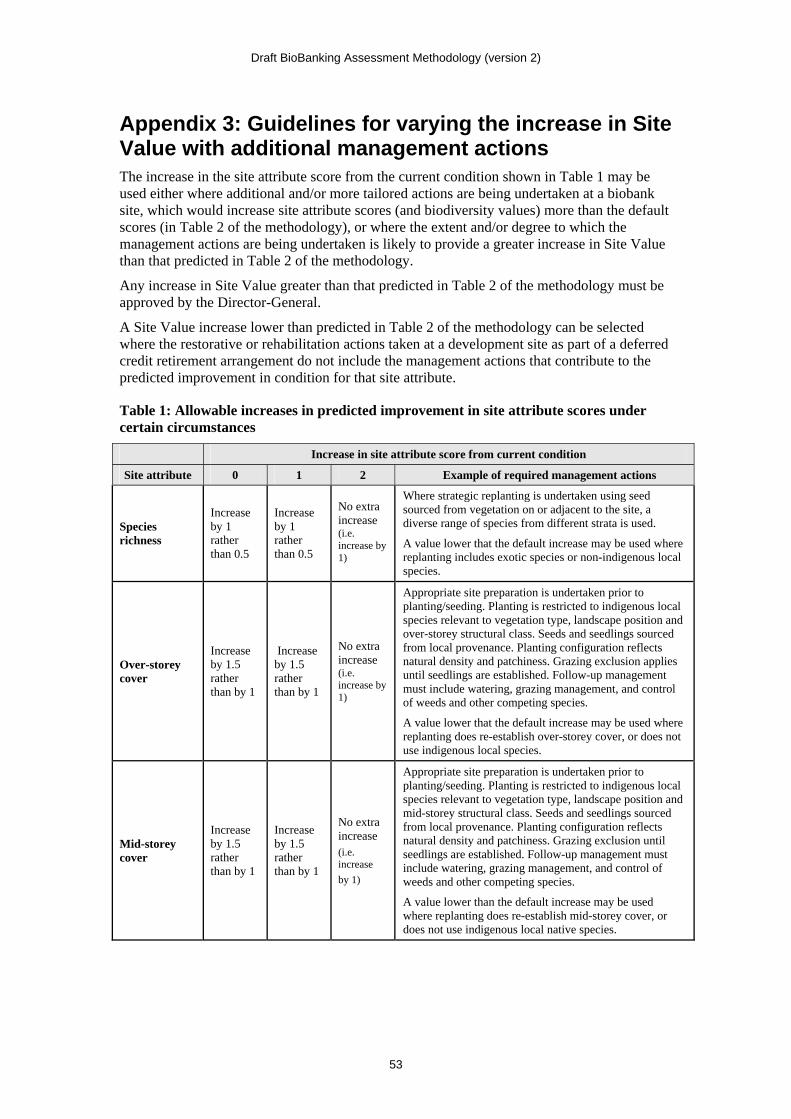
Draft BioBanking Assessment Methodology (version 2)
53
Appendix 3: Guidelines for varying the increase in Site Value with additional management actions The increase in the site attribute score from the current condition shown in Table 1 may be used either where additional and/or more tailored actions are being undertaken at a biobank site, which would increase site attribute scores (and biodiversity values) more than the default scores (in Table 2 of the methodology), or where the extent and/or degree to which the management actions are being undertaken is likely to provide a greater increase in Site Value than that predicted in Table 2 of the methodology.
Any increase in Site Value greater than that predicted in Table 2 of the methodology must be approved by the Director-General.
A Site Value increase lower than predicted in Table 2 of the methodology can be selected where the restorative or rehabilitation actions taken at a development site as part of a deferred credit retirement arrangement do not include the management actions that contribute to the predicted improvement in condition for that site attribute.
Table 1: Allowable increases in predicted improvement in site attribute scores under certain circumstances
Increase in site attribute score from current condition
Site attribute 0 1 2 Example of required management actions
Species richness
Increase by 1 rather than 0.5
Increase by 1 rather than 0.5
No extra increase (i.e. increase by 1)
Where strategic replanting is undertaken using seed sourced from vegetation on or adjacent to the site, a diverse range of species from different strata is used.
A value lower that the default increase may be used where replanting includes exotic species or non-indigenous local species.
Over-storey cover
Increase by 1.5 rather than by 1
Increase by 1.5 rather than by 1
No extra increase (i.e. increase by 1)
Appropriate site preparation is undertaken prior to planting/seeding. Planting is restricted to indigenous local species relevant to vegetation type, landscape position and over-storey structural class. Seeds and seedlings sourced from local provenance. Planting configuration reflects natural density and patchiness. Grazing exclusion applies until seedlings are established. Follow-up management must include watering, grazing management, and control of weeds and other competing species.
A value lower that the default increase may be used where replanting does re-establish over-storey cover, or does not use indigenous local species.
Mid-storey cover
Increase by 1.5 rather than by 1
Increase by 1.5 rather than by 1
No extra increase (i.e. increase
by 1)
Appropriate site preparation is undertaken prior to planting/seeding. Planting is restricted to indigenous local species relevant to vegetation type, landscape position and mid-storey structural class. Seeds and seedlings sourced from local provenance. Planting configuration reflects natural density and patchiness. Grazing exclusion until seedlings are established. Follow-up management must include watering, grazing management, and control of weeds and other competing species.
A value lower than the default increase may be used where replanting does re-establish mid-storey cover, or does not use indigenous local native species.
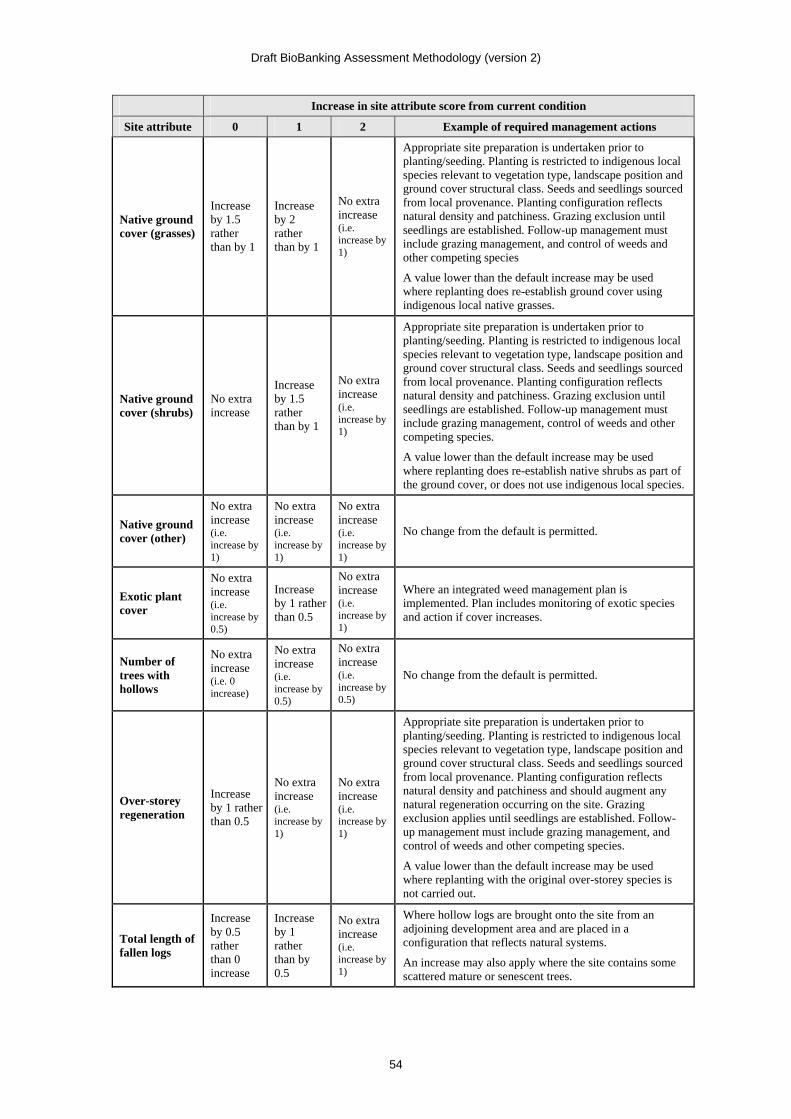
Draft BioBanking Assessment Methodology (version 2)
54
Increase in site attribute score from current condition
Site attribute 0 1 2 Example of required management actions
Native ground cover (grasses)
Increase by 1.5 rather than by 1
Increase by 2 rather than by 1
No extra increase (i.e. increase by 1)
Appropriate site preparation is undertaken prior to planting/seeding. Planting is restricted to indigenous local species relevant to vegetation type, landscape position and ground cover structural class. Seeds and seedlings sourced from local provenance. Planting configuration reflects natural density and patchiness. Grazing exclusion until seedlings are established. Follow-up management must include grazing management, and control of weeds and other competing species
A value lower than the default increase may be used where replanting does re-establish ground cover using indigenous local native grasses.
Native ground cover (shrubs)
No extra increase
Increase by 1.5 rather than by 1
No extra increase (i.e. increase by 1)
Appropriate site preparation is undertaken prior to planting/seeding. Planting is restricted to indigenous local species relevant to vegetation type, landscape position and ground cover structural class. Seeds and seedlings sourced from local provenance. Planting configuration reflects natural density and patchiness. Grazing exclusion until seedlings are established. Follow-up management must include grazing management, control of weeds and other competing species.
A value lower than the default increase may be used where replanting does re-establish native shrubs as part of the ground cover, or does not use indigenous local species.
Native ground cover (other)
No extra increase (i.e. increase by 1)
No extra increase (i.e. increase by 1)
No extra increase (i.e. increase by 1)
No change from the default is permitted.
Exotic plant cover
No extra increase (i.e. increase by 0.5)
Increase by 1 rather than 0.5
No extra increase (i.e. increase by 1)
Where an integrated weed management plan is implemented. Plan includes monitoring of exotic species and action if cover increases.
Number of trees with hollows
No extra increase (i.e. 0 increase)
No extra increase (i.e. increase by 0.5)
No extra increase (i.e. increase by 0.5)
No change from the default is permitted.
Over-storey regeneration
Increase by 1 rather than 0.5
No extra increase (i.e. increase by 1)
No extra increase (i.e. increase by 1)
Appropriate site preparation is undertaken prior to planting/seeding. Planting is restricted to indigenous local species relevant to vegetation type, landscape position and ground cover structural class. Seeds and seedlings sourced from local provenance. Planting configuration reflects natural density and patchiness and should augment any natural regeneration occurring on the site. Grazing exclusion applies until seedlings are established. Follow-up management must include grazing management, and control of weeds and other competing species.
A value lower than the default increase may be used where replanting with the original over-storey species is not carried out.
Total length of fallen logs
Increase by 0.5 rather than 0 increase
Increase by 1 rather than by 0.5
No extra increase (i.e. increase by 1)
Where hollow logs are brought onto the site from an adjoining development area and are placed in a configuration that reflects natural systems.
An increase may also apply where the site contains some scattered mature or senescent trees.


