DRAFT DISCUSSION DOCUMENT 3 CCXG seminar breakout session 3a Setting National and Sectoral Baselines 1 Prepared for the CCXG/Global Forum on Environment Seminar on MRV and Carbon Markets2 28-29 March 2011, Paris Please do not cite or quote the contents of this document. The ideas expressed hereafter are those of the authors and do not necessarily represent views of the OECD, the IEA, or their member countries, or the endorsement of any approach described herein. 1 This document was prepared by Andrew Prag (OECD) and Christa Clapp (OECD). The authors would like to thank OECD/IEA colleagues Shardul Agrawala, Richard Baron, Gregory Briner, Christina Hood, Jane Ellis, Katia Karousakis and Virginie Marchal for their inputs to an earlier draft. Please send any comments to [email protected]. 2 The CCXG Secretariat would like to thank the EC, Germany and Japan, who provided funding specifically for this event, as well as OECD member countries that provide funding for the Global Forum. They would also like to thank Canada, Finland, Japan, Netherlands, Norway, Sweden, Switzerland, UK and US for their direct funding of the CCXG in 2010, and OECD and IEA for their in-kind support.
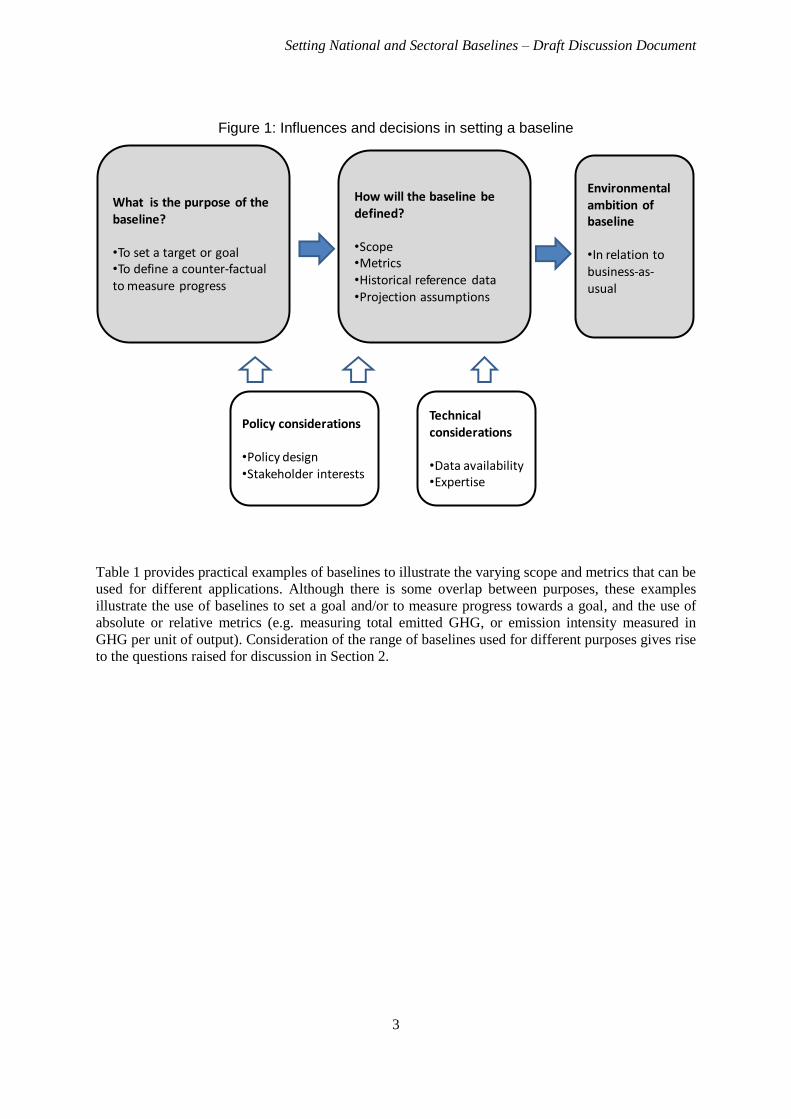
•To set a target or goal•To define a counter-factual to measure progress
Environmental ambition of baseline
•In relation to business-as-usual
Table 1 provides practical examples of baselines to illustrate the varying scope and metrics that can be
used for different applications. Although there is some overlap between purposes, these examples
illustrate the use of baselines to set a goal and/or to measure progress towards a goal, and the use of
absolute or relative metrics (e.g. measuring total emitted GHG, or emission intensity measured in
GHG per unit of output). Consideration of the range of baselines used for different purposes gives rise
to the questions raised for discussion in Section 2.
Setting National and Sectoral Baselines – Draft Discussion Document
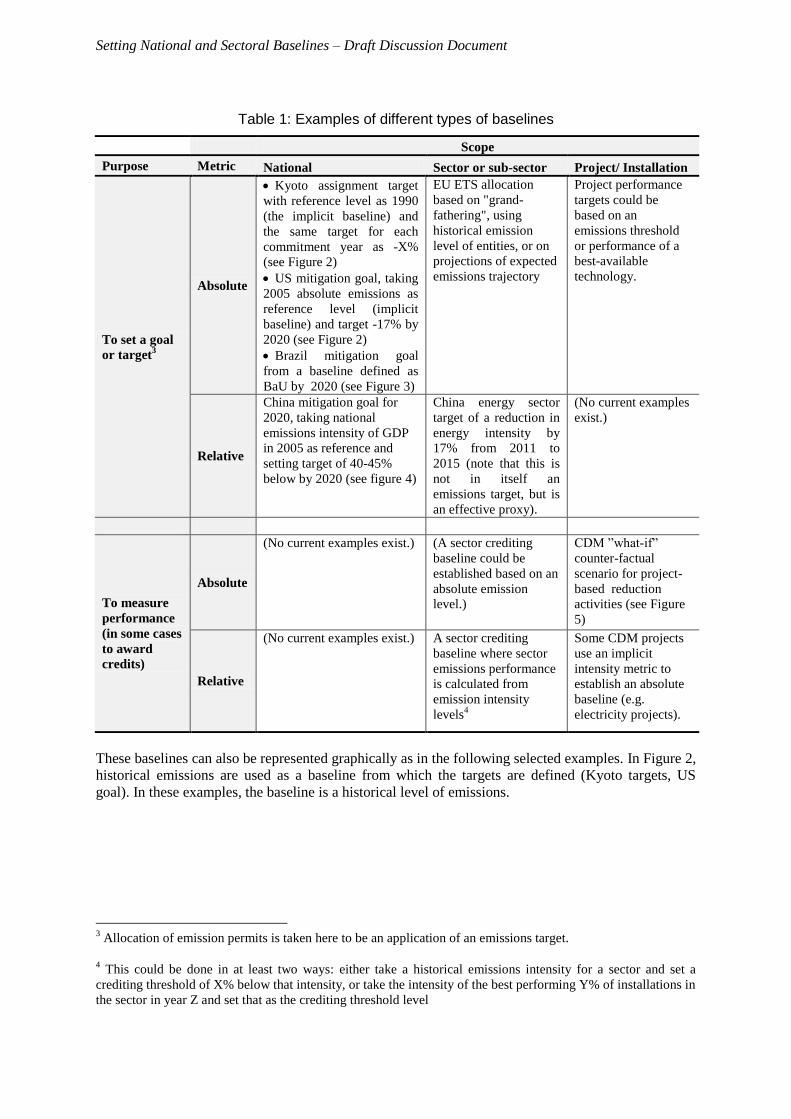
Table 1: Examples of different types of baselines
Scope
Purpose Metric National Sector or sub-sector Project/ Installation
To set a goal
or target3
Absolute
Kyoto assignment target
with reference level as 1990
(the implicit baseline) and
the same target for each
commitment year as -X%
(see Figure 2)
US mitigation goal, taking
2005 absolute emissions as
reference level (implicit
baseline) and target -17% by
2020 (see Figure 2)
Brazil mitigation goal
from a baseline defined as
BaU by 2020 (see Figure 3)
EU ETS allocation
based on "grand-
fathering", using
historical emission
level of entities, or on
projections of expected
emissions trajectory
Project performance
targets could be
based on an
emissions threshold
or performance of a
best-available
technology.
Relative
China mitigation goal for
2020, taking national
emissions intensity of GDP
in 2005 as reference and
setting target of 40-45%
below by 2020 (see figure 4)
China energy sector
target of a reduction in
energy intensity by
17% from 2011 to
2015 (note that this is
not in itself an
emissions target, but is
an effective proxy).
(No current examples
exist.)
To measure
performance
(in some cases
to award
credits)
Absolute
(No current examples exist.) (A sector crediting
baseline could be
established based on an
absolute emission
level.)
CDM ”what-if”
counter-factual
scenario for project-
based reduction
activities (see Figure
5)
Relative
(No current examples exist.) A sector crediting
baseline where sector
emissions performance
is calculated from
emission intensity
levels4
Some CDM projects
use an implicit
intensity metric to
establish an absolute
baseline (e.g.
electricity projects).
These baselines can also be represented graphically as in the following selected examples. In Figure 2,
historical emissions are used as a baseline from which the targets are defined (Kyoto targets, US
goal). In these examples, the baseline is a historical level of emissions.
3 Allocation of emission permits is taken here to be an application of an emissions target.
4 This could be done in at least two ways: either take a historical emissions intensity for a sector and set a
crediting threshold of X% below that intensity, or take the intensity of the best performing Y% of installations in
the sector in year Z and set that as the crediting threshold level
Setting National and Sectoral Baselines – Draft Discussion Document
5
Figure 2: Absolute baselines based on historical reference levels used to set a target: Kyoto allocation with one reference for multiple target years (top), and US 2020 goal with single
target year (bottom)
1990 2008 20102009 2011 2012
1990 20202005
Ab
solu
te e
mis
sio
ns
tCO
2e
Abs
olut
e em
issi
ons
tCO
2e
Agreed Kyoto reduction level for commitment period (X%)
Agreed % reduction level to 2020
His
tori
cal e
mis
sio
ns
His
tori
cal e
mis
sio
ns
Targ
et le
vel
Targ
et le
vel
Targ
et le
vel
Targ
et le
vel
Targ
et le
vel
Targ
et l
eve
l
In Figure 3, projected emissions are used as a baseline representing a BaU from which Brazil‟s goal is
defined. In this example, the baseline is a projected business-as-usual level of emissions.
Figure 3: Absolute baseline using a forward projection to define a goal: Brazil’s mitigation goal for 2020
Decision to reduce intensity by X% from reference level
His
tori
cal
em
issi
on
s
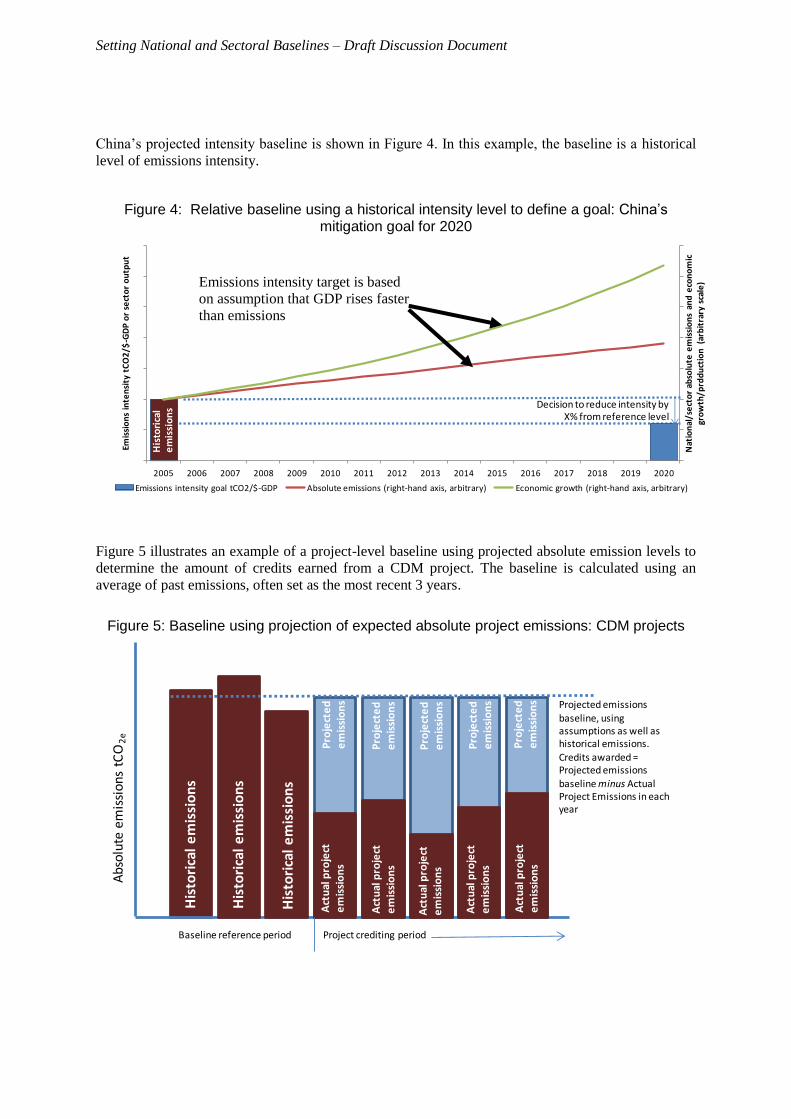
Figure 5 illustrates an example of a project-level baseline using projected absolute emission levels to
determine the amount of credits earned from a CDM project. The baseline is calculated using an
average of past emissions, often set as the most recent 3 years.
Figure 5: Baseline using projection of expected absolute project emissions: CDM projects
Baseline reference period Project crediting period
His
tori
cal
em
issi
on
s
His
tori
cal
em
issi
on
s
His
tori
cal
em
issi
on
s
Abs
olut
e em
issi
ons
tCO
2e
Act
ual
pro
ject
e
mis
sio
ns
Act
ual
pro
ject
e
mis
sio
ns
Act
ual
pro
ject
e
mis
sio
ns
Act
ual
pro
ject
e
mis
sio
ns
Act
ual
pro
ject
e
mis
sio
ns
Pro
ject
ed
e
mis
sio
ns
Pro
ject
ed
e
mis
sio
ns
Pro
ject
ed
e
mis
sio
ns
Pro
ject
ed
e
mis
sio
ns
Pro
ject
ed
e
mis
sio
ns Projected emissions
baseline, using assumptions as well as historical emissions.
Credits awarded = Projected emissions baseline minus Actual Project Emissions in each year
Emissions intensity target is based
on assumption that GDP rises faster
than emissions
Setting National and Sectoral Baselines – Draft Discussion Document
7
2. Key issues and challenges for setting baselines
Setting a baseline involves defining key characteristics such as scope (e.g. national or sectoral) and
metrics (e.g. tCO2e or tCO2e/unit of output). A baseline can be calculated based on either historical
data and/or projections based on assumptions about an expected future emissions pathway that would
occur in the absence of a project or policy (a counter-factual). Such projections could be a „business
as usual‟ scenario, or another type of counter-factual scenario.5 Table 2 describes the options and
considerations for each of these variables.
Table 2: Key variables in setting and updating baselines
Baseline
variable
Options Considerations
Scope
Project, programme, sub-sector,
sector, country/ies; in some
cases could also be specific to
technology type or age of
plant/entity
Defines the level of aggregation and bounds the emissions
included. Boundaries can be hard to define as projects, sub-
sectors, etc. often contain complex emissions pathways that can
have influences beyond their primary sector (e.g. baselines for
the cement sector can be influenced by electricity sector inputs
used in the manufacturing of cement). Scope must be defined
through a decision on what needs to be included given the
limits of data availability, and the potential risks of leakage6
(e.g. as a result of an emissions target). For a crediting baseline,
the scope defined for setting the baseline may differ from the
population to which the baseline is then applied.
Metric
Absolute GHG or CO2
emissions, relative GHG
emissions7
Depending on the circumstances, baselines could be calculated
using total emissions levels over the time period chosen or
could be calculated on a relative basis, e.g. as intensity of
emissions against economic or production output.
Historical
reference
data
Single time period (such as one
year), or multiple time periods
(such as an average over several
years)
A baseline requires a root in historical emissions data, even if it
is ultimately developed into a projection. This can be a single
time period (sometimes known as a base year), the average of
emissions of several periods, the emissions trend over a period,
etc. The choice of which particular year(s) are used for
historical data can be important.
Future
assumptions
Assumed continuation of
historical emissions (project),
continued rate of growth of
emissions/emission intensity
(sector), modelled development;
depends on policies included in
baseline and time period of
projections
For a baseline calculated using a projection, assumptions need
to be made about how emissions would evolve in the future.
This could be a simple linear projection of historical emissions
into the future, a projection based on expected change of
growth rate or a more complex model of potential emissions
pathways. Which policies to include in the baseline must be
decided (e.g. business-as-usual, no new policies after a cut-off
date, etc.). Projections further into the future are inherently
more uncertain than baselines projected over a shorter time
period. Furthermore, the circumstances that influence a baseline
are likely to change over time, which may warrant systematic
review or updating of a baseline after it is established.
2.1 Scope of the baseline
The issue and key challenges: The scope is largely driven by the purpose of the baseline, but is not
always obvious to define. The scope of a baseline can influence the ambition of a baseline in relation
5 For example, Annex I national communications include “without measures”, “with measures,” and “with
additional measures” projections, none of which is specifically defined as a reference or BaU. 6 Leakage in this context means a corresponding rise in emissions outside of a targeted sector or country due to
changes in relative prices, competitive advantage or other factors. 7 Other types of baselines could be established based on activity-level data (e.g. level of forested area or
technology market penetration rate), but are not the focus of this discussion paper.
Setting National and Sectoral Baselines – Draft Discussion Document
to a measured emission reduction. There are at least two key questions involved: how to precisely set
definitions of scope in order to draw boundaries, and what broad level of data is needed (and
available). A national scope of emissions can involve complexities such as net land-use emissions. A
baseline for an individual project may have clearer boundaries, but this does not mean that data will
be available or reliable. To set a baseline for a sector, part of a sector, a single complex industrial site,
or a group of projects, the issue of what should be included within the boundary may be less
straightforward (Baron and Ellis, 2006). The definition of the sector or sub-sector can be further
broken down into two related issues: what entities or types of entities are included, and which
emissions sources from these entities should be counted. The situation is yet more complex for sectors
that have very heterogeneous emissions performance. For example, within the power sector, decisions
are needed on whether to compare a coal-fired power plant with average emissions for coal-fired
plants or with the performance standard of a newly-built plant or best-available technology. If a
baseline is used as a reference against which to measure performance, then defining the scope can
have politically contentious impacts. For instance, how the scope is defined could either penalise
well-performing early movers, or allow the worst-performing entities to weaken the ambition of the
baseline in relation to a goal.
Experience to date:
Sector crediting case studies: work on possible design features of sector crediting schemes
using sector baselines has thrown up issues of scope, particularly in boundary setting (Baron
et al., 2009). For example, in the power sector in many countries there is a wide range of
emissions from different power generating technologies, from near-zero for renewables to
emissions-intensive coal plants. As such it is not clear whether a single sector crediting
baseline using emissions intensity could be effective for the whole sector. Some industrial
sectors involve on-site power generation, such as iron and steel production. A decision needs
to be made as to whether these emissions are included in the sector in which they are
physically located – in this case iron and steel – or as part of the power sector given that the
emissions are created in generating electric power. Another issue of scope is whether to set
the baseline using the performance of new entities or plants, or include a broader application
of the whole sector (Baron and Ellis, 2006), which can have implications on ambition
compared with a mitigation goal.
CDM: although most CDM projects set project-specific baselines that are limited in scope to
the individual project boundary, those individual project baselines may be calculated using
standardised factors. This highlights the difference between a standardised baseline and a
baseline devised through standardised approaches (Ellis, 2000). There is therefore a spectrum
of possible “standardisation” of baselines that ranges from standardised methodologies and/or
parameters to standardised emission levels. For example, many projects use an electricity grid
emissions factor to calculate the effect on emissions of reduced consumption of grid
electricity; this is calculated using national or sub-national data.8 Furthermore the CDM
modalities (UNFCCC, 2005) do allow for benchmark approaches in CDM baselines and some
such methodologies have been developed. These vary in the level of aggregation used and by
whether the benchmark serves for just the baseline or for also justifying the additionality of
the project. Experience with the latter has shown that aggregating data across a sector can be
prohibitively expensive for early movers (UNFCCC, 2010a). This may explain the lack of
uptake of a methodology for manufacture of energy-efficient fridges (AM0070; UNFCCC,
2008). Much experience has also been gained with the methodology designed by the World
Business Council for Sustainable Development (WBCSD) under the Cement Sustainability
Initiative; this is based on multiple benchmarks for the cement sector, but has not yet found
approval with the CDM Executive Board (WBCSD, 2009).
8 The CDM tool used to calculate this factor uses a weighted average to take into account the usually better
performance of the more recent plant in the sector. This is one approach for how to make allowances for
heterogeneous performance levels across a sector. The Tool to calculate the emission factor for an electricity
system is available at http://cdm.unfccc.int/methodologies/PAmethodologies/tools/am-tool-07-v2.pdf
The environmental integrity of a sector or other sub-national baseline is also affected by the national
framework that it is operating under. For example, if a non-Annex I country announces a national
mitigation goal to reduce overall emissions intensity per unit of GDP, should this affect the baseline
of a sectoral mechanism operating in that country? Should the crediting baseline be set to be more
ambitious than the national target (equivalent to a baseline “with measures”), or should the sector
mechanism operate independently? This is a political as well as a technical issue, with bearing on
international negotiations.
Guidance on baseline setting could help enhance transparency and environmental integrity. For
example, an examination of projection guidelines in Annex I national communications could focus on
improving guidelines for assumptions and data sources (Clapp et al., 2010). Further, for CDM of
sectoral crediting mechanisms, moving towards a more standardised baseline could reduce transaction
costs (Aasrud et al., 2009).
The following options to help improve the environmental integrity of baselines are proposed for
discussion:
Technical capacity building efforts could identify gaps in data and expertise, and enhance
regional data sharing and collaboration efforts, and build in-country data sets and expertise
(e.g. focusing on Africa, Asia, Latin America)
Setting National and Sectoral Baselines – Draft Discussion Document
13
Guidance on setting baselines could:
o Enhance guidelines for baseline projections in Annex I national communications,
including on: which measures should be included in the baselines (i.e. further
guidance on “without measures,” “with measures,” and “with additional measures”
projections); and on international data sets that could be used for underlying
assumptions (e.g. GDP, population, energy use); and/or
o Analyse issues in setting baselines across a broad range of purposes, including the use
of baselines in exploring future pathways in LEDS, and in crediting mechanisms. The
focus could be on what assumptions ought to be made more explicit, when
standardisation makes sense, and what review process (if any) makes sense. This
analysis should build on expertise in developed and developing countries, and
potentially in industrial organisations for sectoral baselines.
In addition, the questions for discussion raised throughout this document are summarised in the
Annex.
Setting National and Sectoral Baselines – Draft Discussion Document
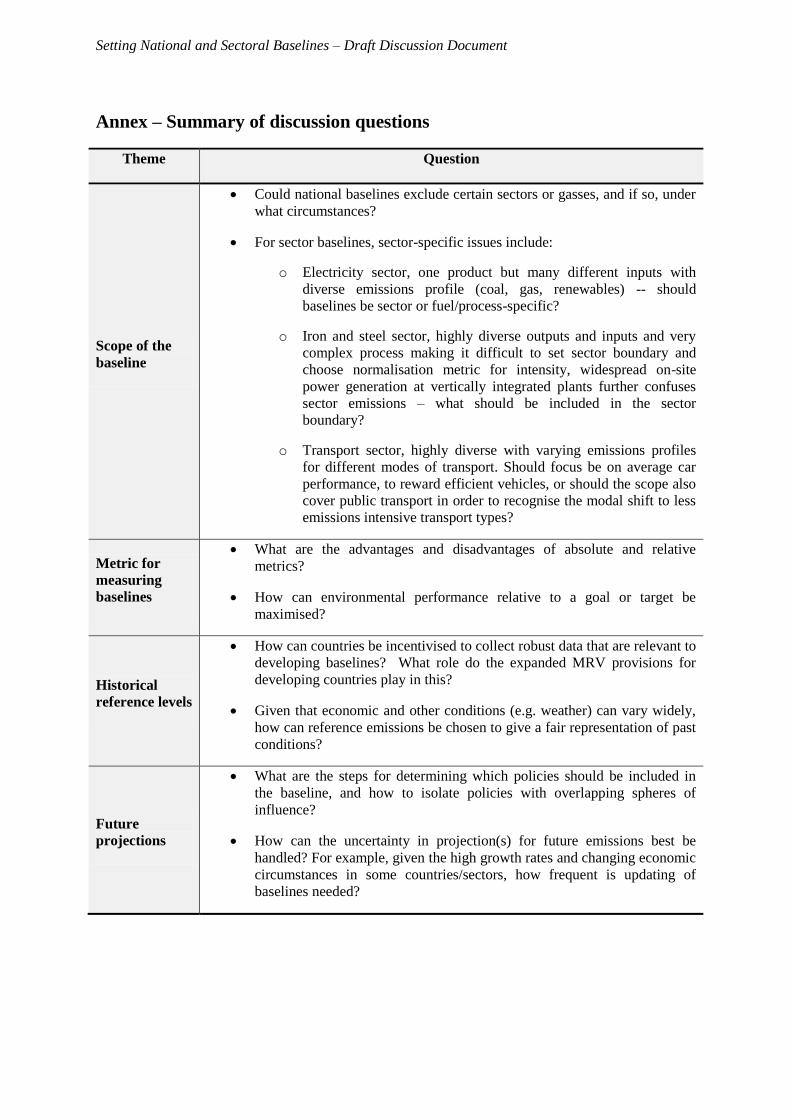
Annex – Summary of discussion questions
Theme Question
Scope of the
baseline
Could national baselines exclude certain sectors or gasses, and if so, under
what circumstances?
For sector baselines, sector-specific issues include:
o Electricity sector, one product but many different inputs with
diverse emissions profile (coal, gas, renewables) -- should
baselines be sector or fuel/process-specific?
o Iron and steel sector, highly diverse outputs and inputs and very
complex process making it difficult to set sector boundary and
choose normalisation metric for intensity, widespread on-site
power generation at vertically integrated plants further confuses
sector emissions – what should be included in the sector
boundary?
o Transport sector, highly diverse with varying emissions profiles
for different modes of transport. Should focus be on average car
performance, to reward efficient vehicles, or should the scope also
cover public transport in order to recognise the modal shift to less
emissions intensive transport types?
Metric for
measuring
baselines
What are the advantages and disadvantages of absolute and relative
metrics?
How can environmental performance relative to a goal or target be
maximised?
Historical
reference levels
How can countries be incentivised to collect robust data that are relevant to
developing baselines? What role do the expanded MRV provisions for
developing countries play in this?
Given that economic and other conditions (e.g. weather) can vary widely,
how can reference emissions be chosen to give a fair representation of past
conditions?
Future
projections
What are the steps for determining which policies should be included in
the baseline, and how to isolate policies with overlapping spheres of
influence?
How can the uncertainty in projection(s) for future emissions best be
handled? For example, given the high growth rates and changing economic
circumstances in some countries/sectors, how frequent is updating of
baselines needed?
Setting National and Sectoral Baselines – Draft Discussion Document
15
References
Aasrud, A., R. Baron, B. Buchner, and K. McCall (2009). Sectoral Market Mechanisms – Issues for
Negotiation and Domestic Implementation, OECD/IEA.
Baron R. ,B. Buchner and J. Ellis (2009) Sectoral Approaches and the Carbon Market. OECD/IEA information paper. COM/ENV/EPOC/IEA/SLT(2009)3
Baron, R., and J. Ellis (2006). Sectoral Crediting Mechanisms for Greenhouse Gas Mitigation: Institutional and Operational Issues, OECD/IEA.Bureau of Energy Efficiency (2011). National
Mission For Enhanced Energy Efficiency PAT Consultation Document. Ministry of Power, Govt
Hood, C. (2010). “Reviewing existing and proposed emissions trading systems,” IEA Information Paper,
OECD/IEA Publishing.
Ministry for the Environment (2009). Development of Industrial Allocation Regulations under the New Zealand Emissions Trading Scheme: Consultation Document. Wellington: Ministry for the
UNFCCC (2008). Approved baseline and monitoring methodology AM0070 „Manufacturing of energy
efficient domestic refrigerators‟. Approved 26/09/2008, Available at
http://cdm.unfccc.int/methodologies/index.html
UNFCCC (2010a), Views related to modalities and procedures for the development of standardized
baselines from the clean development mechanism. Submissions from Parties and relevant
organizations. SUBSIDIARY BODY FOR SCIENTIFIC AND TECHNOLOGICAL ADVICE,
Thirty-second session. Available at http://unfccc.int/resource/docs/2010/sbsta/eng/misc03.pdf
UNFCCC (2010b). Outcome of the work of the Ad Hoc Working Group on Long-term Cooperative Action
under the Convention, Draft decision -/CP.16.
US (2006). U.S. Climate Action Report – 2006: Fourth National Communication of the United States of America under the United Nations Framework Convention on Climate Change.
WBCSD (2009). CDM methodology for cement and clinker production facilities based on benchmarking,


![[DISCUSSION DRAFT] TH D CONGRESS SESSION H. R. · [Discussion Draft] [DISCUSSION DRAFT] 114TH CONGRESS 2D SESSION H. R. ll To amend title 38, United States Code, to establish the](https://static.documents.pub/doc/80x56/5f02292f7e708231d402df89/discussion-draft-th-d-congress-session-h-r-discussion-draft-discussion-draft.jpg)

![[DISCUSSION DRAFT] TH ST CONGRESS SESSION …[Discussion Draft] [DISCUSSION DRAFT] 115TH CONGRESS 1ST SESSION H. R. ll To amend the Foreign Intelligence Surveillance Act of 1978 to](https://static.documents.pub/doc/80x56/5ea81ff331363179e019078c/discussion-draft-th-st-congress-session-discussion-draft-discussion-draft.jpg)


![[PRELIMINARY DISCUSSION DRAFT] TH D CONGRESS SESSION … · 2018-12-06 · [Discussion Draft] [PRELIMINARY DISCUSSION DRAFT] 115TH CONGRESS 2D SESSION H. R. ll To amend the Federal](https://static.documents.pub/doc/80x56/5f039e0a7e708231d409efbf/preliminary-discussion-draft-th-d-congress-session-2018-12-06-discussion-draft.jpg)


