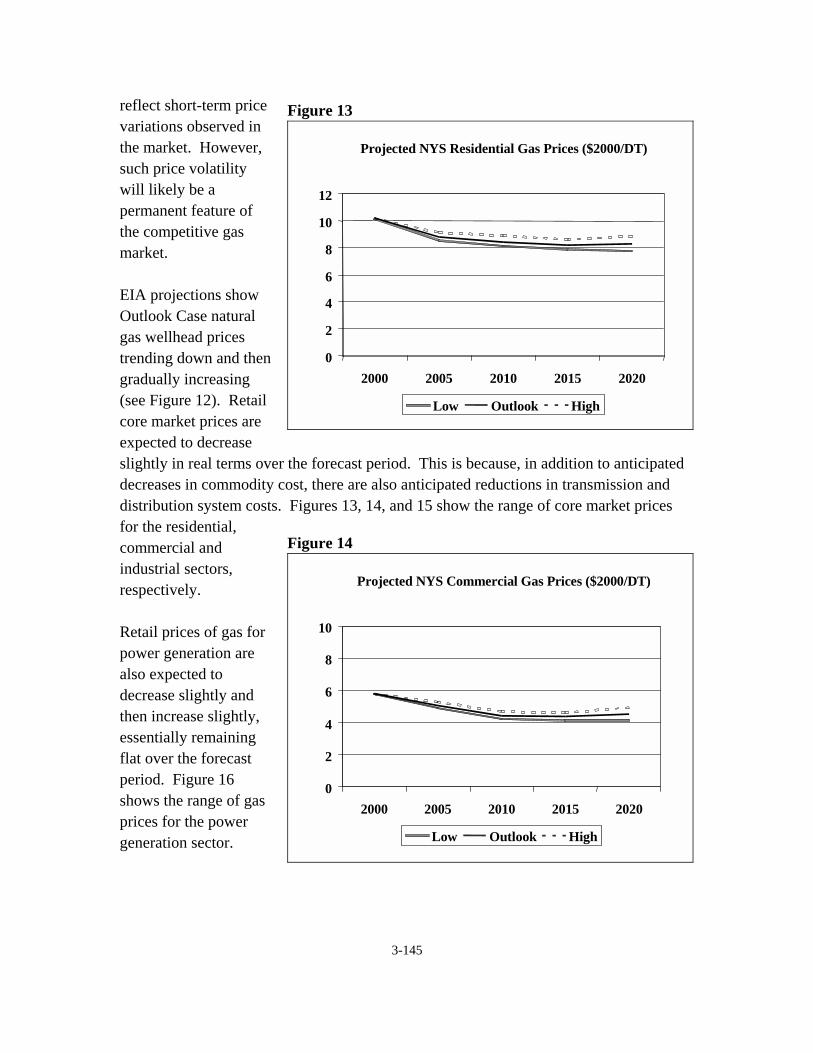
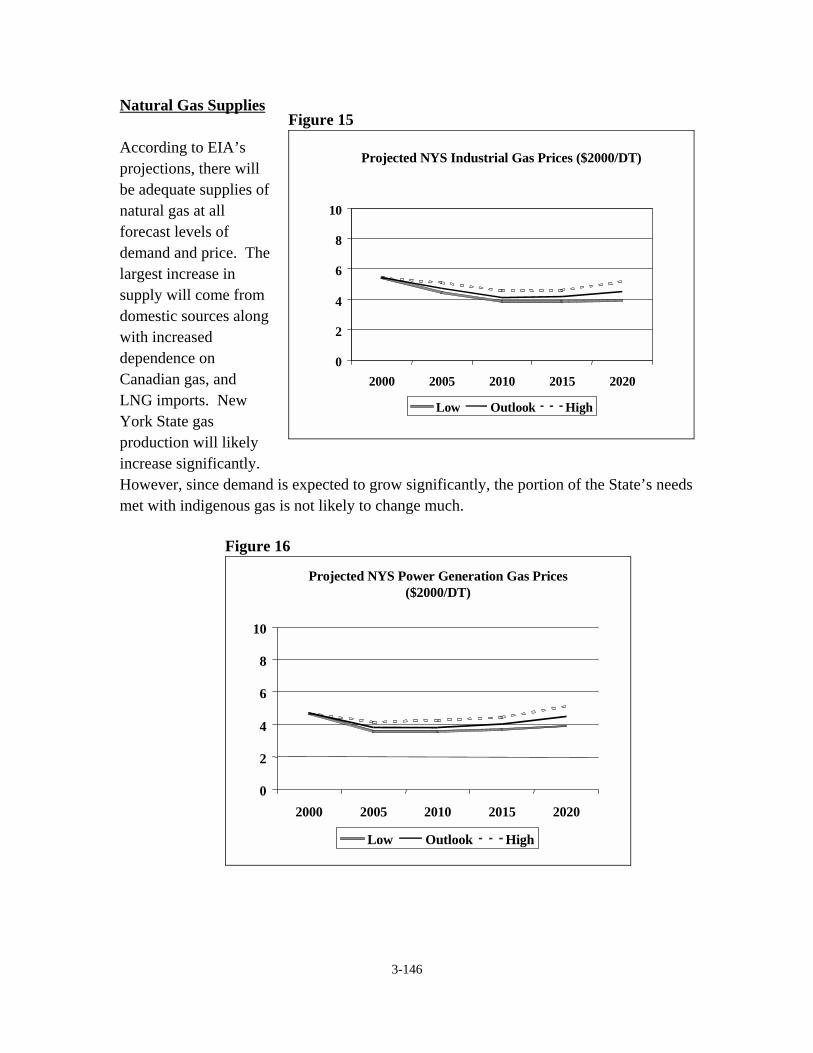
NEW YORK STATE ENERGY PLANNING BOARD William M. Flynn, Chairman of the Energy Planning Board President New York State Energy Research and Development Authority Joseph H. Boardman, Commissioner New York State Department of Transportation Erin M. Crotty, Commissioner New York State Department of Environmental Conservation Charles A. Gargano, Commissioner New York State Department of Economic Development Maureen O. Helmer, Chairman New York State Public Service Commission DRAFT NEW YORK STATE ENERGY PLAN AND DRAFT ENVIRONMENTAL IMPACT STATEMENT December 2001 George E. Pataki, Governor
Transcript
NEW YORK STATEENERGY PLANNINGBOARD
William M. Flynn, Chairman of the Energy Planning BoardPresidentNew York State Energy Research andDevelopment Authority
Joseph H. Boardman, CommissionerNew York State Departmentof Transportation
Erin M. Crotty, CommissionerNew York State Departmentof EnvironmentalConservation
Charles A. Gargano, CommissionerNew York State Departmentof Economic Development
Maureen O. Helmer, ChairmanNew York StatePublic Service Commission
SECTION 3.31 Primary Energy Use in 1999 in New York State and in the U.S. . . . . . . . . . 3-442 Contribution of Renewable Energy Sources to New York State Electricity
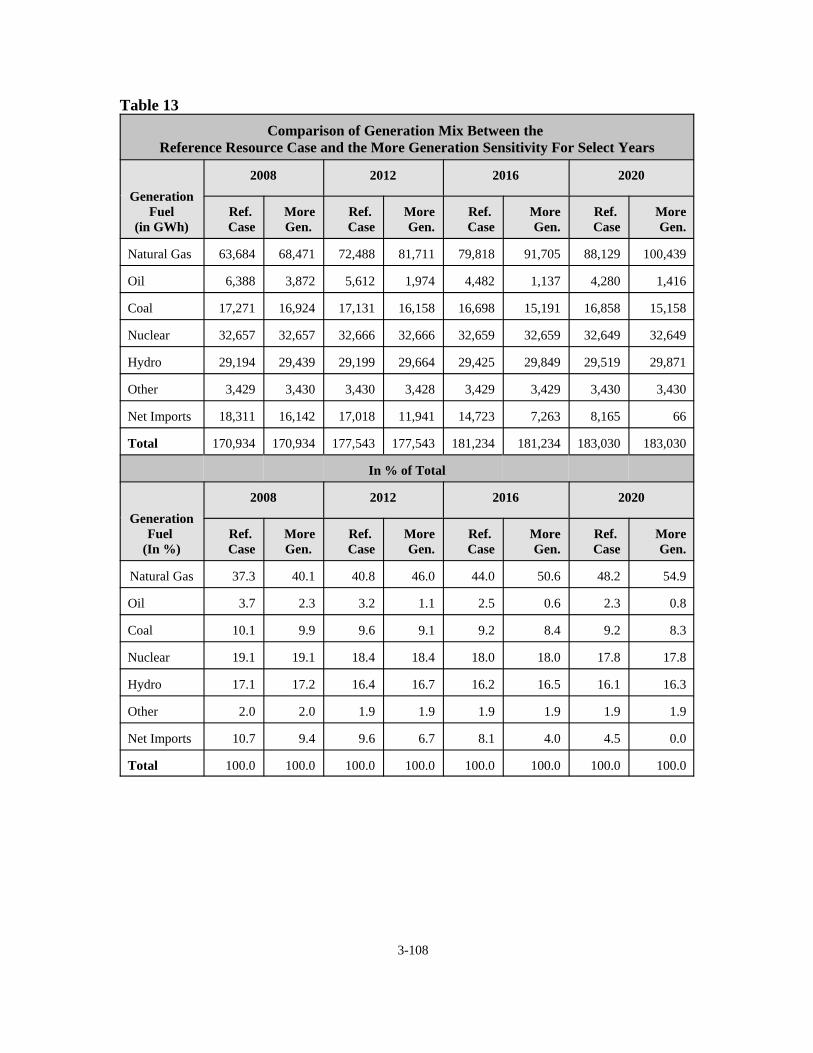
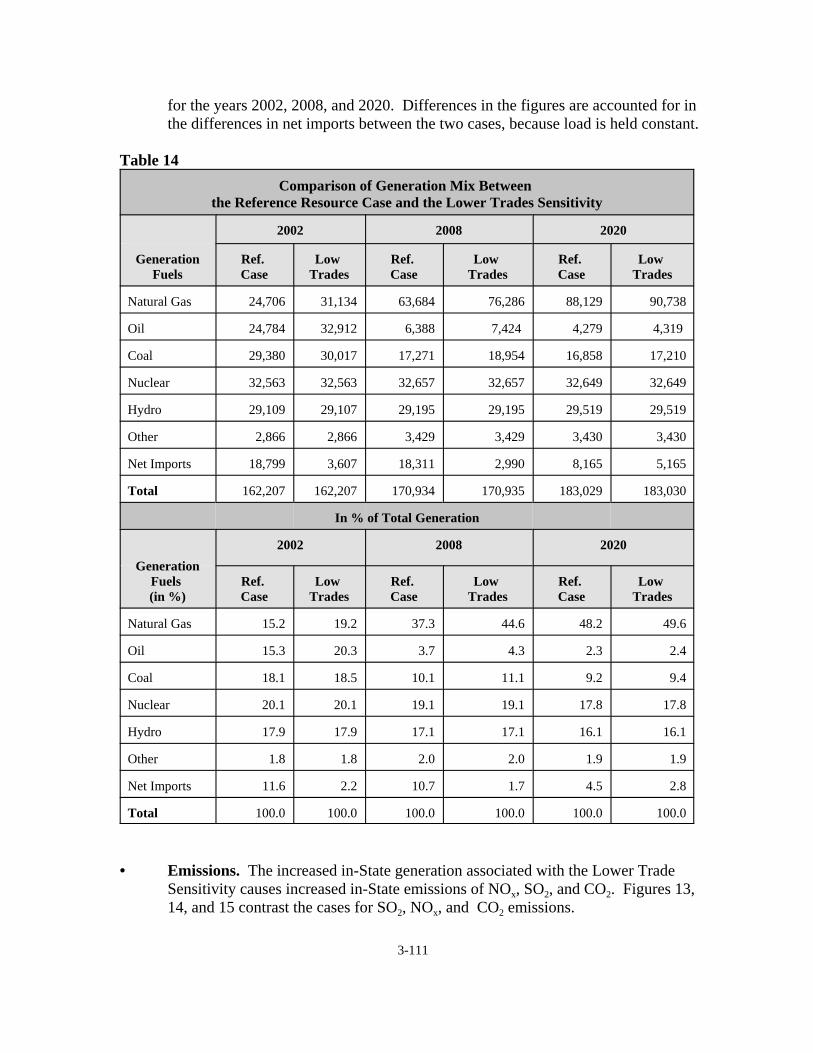
and the Lower Load Sensitivity . . . . . . . . . . . . . . . . . . . . . . . . . . . . . . . . 3-10413 Comparison of Generation Mix Between the Reference Resource Case
and the More Generation Sensitivity for Select Years . . . . . . . . . . . . . . . 3-10814 Comparison of Generation Mix Between the Reference Resource Case
SECTION 3.71 2000 United States Coal Production, Use, and Prices . . . . . . . . . . . . . . . . . 3-1722 2000 United States Coal Production by Coal-Producing State . . . . . . . . . . 3-1733 United States Coal Production, 2000. . . . . . . . . . . . . . . . . . . . . . . . . . . . . . 3-1744 Estimate of Recoverable Reserves of Coal in United States . . . . . . . . . . . . 3-1755 United States Coal Mining Statistics. . . . . . . . . . . . . . . . . . . . . . . . . . . . . . 3-176
Table Number Title Page
6 Coal-Fired Genrating Units in New York State . . . . . . . . . . . . . . . . . . . . . . 3-1787 Average Delivered Cost of Coal to New York State Electric Utility Plants 3-1798 2000 Average Delivered Cost of Coal to New York State Electric
Utility Plants . . . . . . . . . . . . . . . . . . . . . . . . . . . . . . . . . . . . . . . . . . . . . . . 3-1799 Origin of Domestic Coal Delivered to New York State by Method of
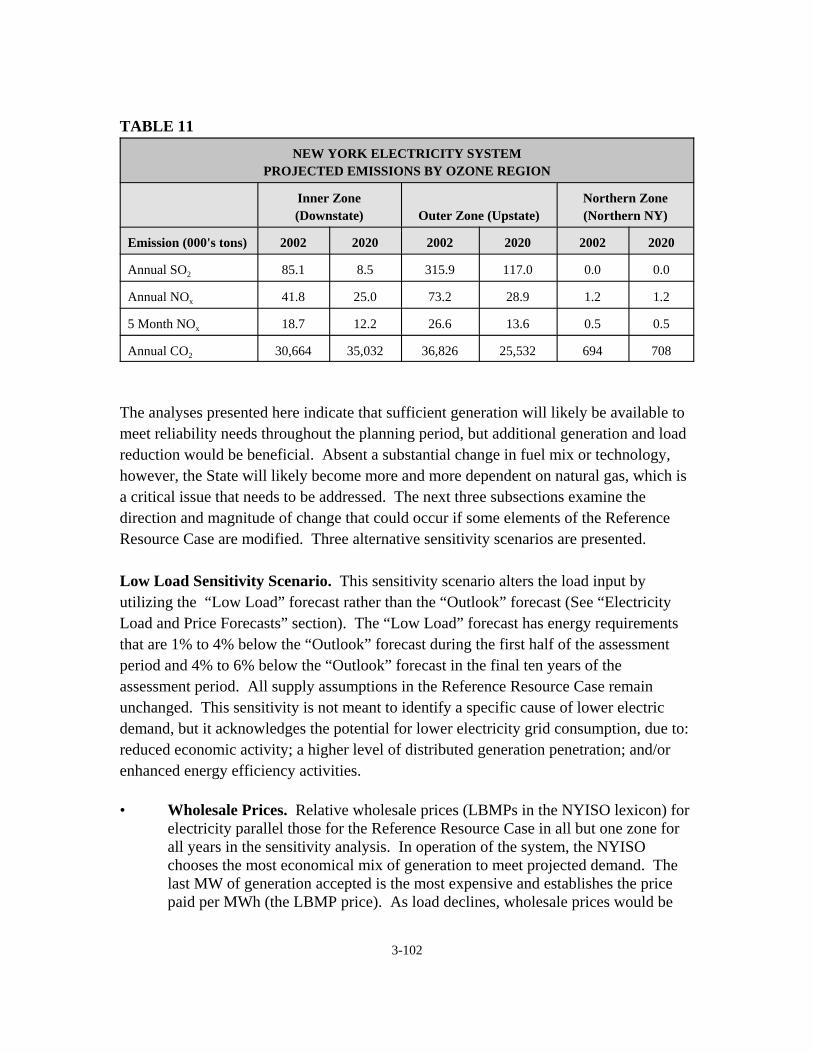
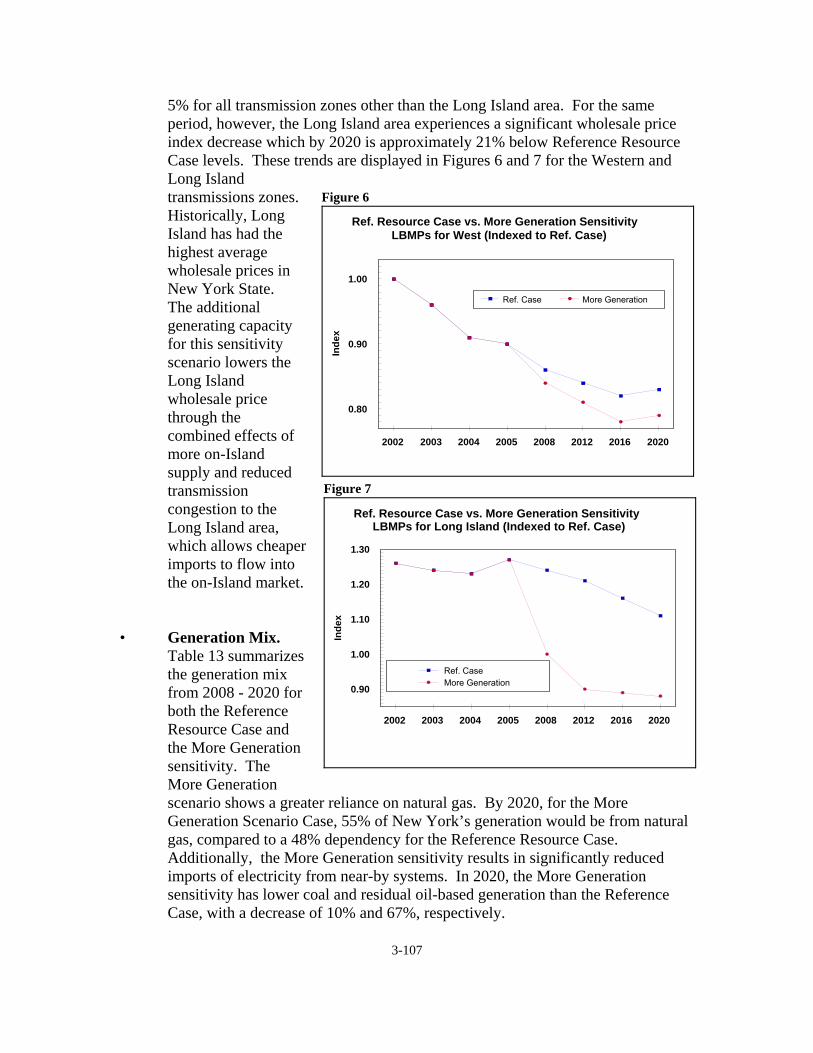
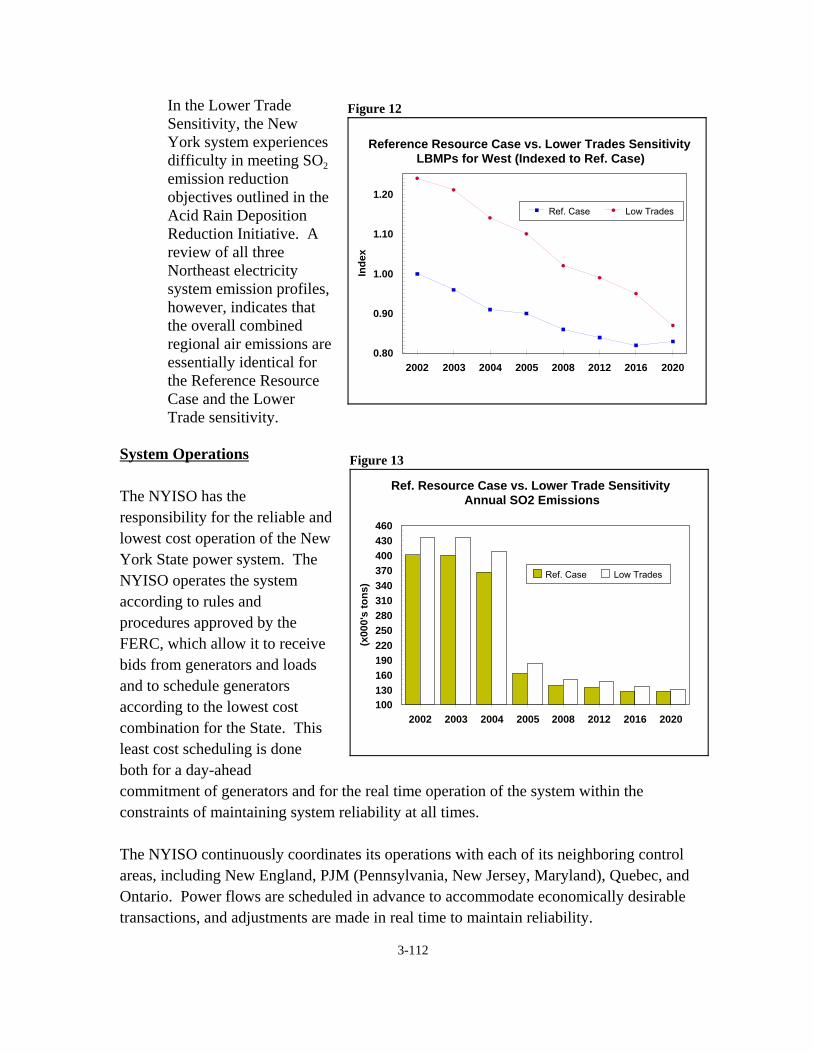
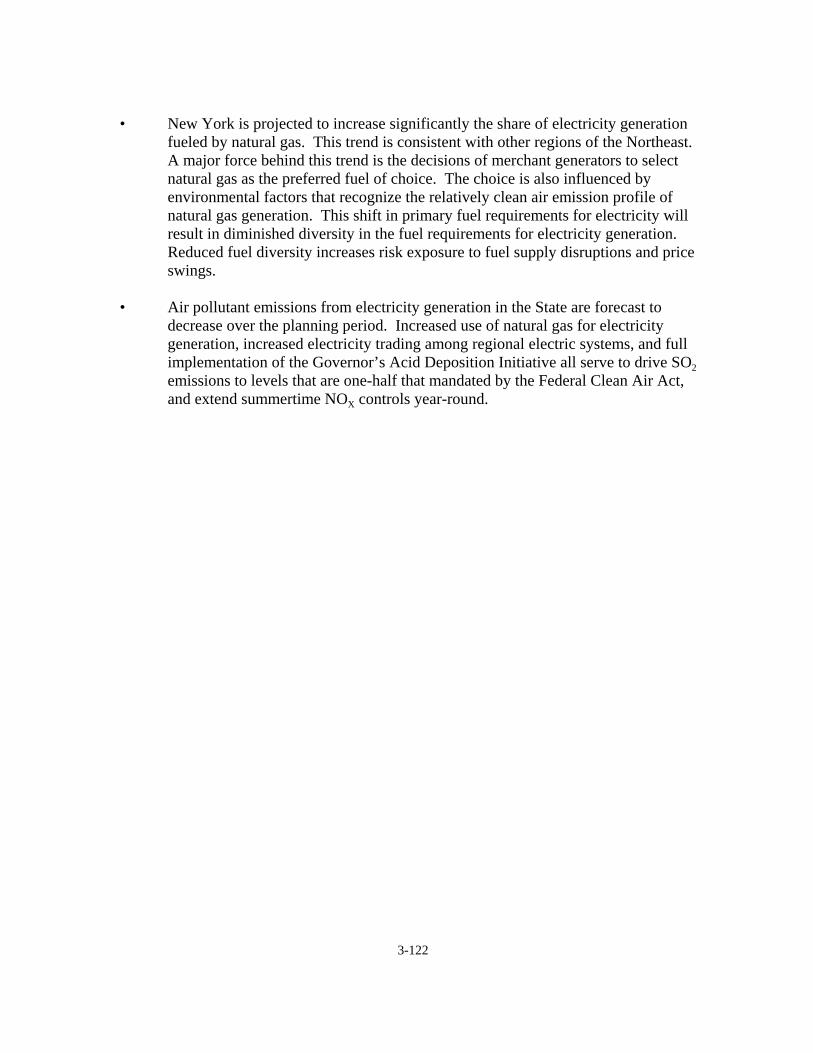
SECTION 3.41 Ref. Resource Case vs. Low Load Sensitivity, LBMPs for West . . . . . . . . 3-1032 Ref. Resource Case vs. Low Load Sensitivity, LBMPs for Long Island . . . 3-1033 Ref. Resource Case vs. Low Load Sensitivity, Annual SO2 Emissions . . . . 3-1054 Ref. Resource Case vs. Low Load Sensitivity, Annual NOx Emissions . . . 3-1055 Ref. Resource Case vs. Low Load Sensitivity, Annual CO2 Emissions . . . 3-1066 Ref. Resource Case vs. More Generation Sensitivity, LBMPs for West . . . 3-1077 Ref. Resource Case vs. More Generation Sensitivity, LBMPs for
Section 1.3 Energy Policy Objectives and Recommendations
1-1
SECTION 1.1
PREFACE
INTRODUCTION
The United States, by and large, has access to abundant supplies of energy. These energyresources enable our country to be the world’s largest producer of goods and services and theleader in the world economy. Events in recent years, however, have served to remindAmericans just how critical energy is to our society. After having access to plentiful andinexpensive energy supplies through much of the 1980s and 1990s, the nation has experiencedintermittent price increases for natural gas and petroleum products, particularly over the pastseveral years. In the winters of 1996-1997 and 2000-2001, natural gas prices spiked, asincreasing demand for this fuel threatened to outstrip available supply, and starting in 1999,heating oil and gasoline prices also increased. During this same period, after a natural gaspipeline explosion in New Mexico, and power outages in the West and Midwest, concernsbegan to grow over the safety and reliability of the nation’s energy infrastructure. In 2000,events in the State of California focused the country’s attention on the adequacy and reliabilityof electricity markets, when its plan to restructure the electricity industry was undermined bysupply shortages and extreme price volatility.
The New York State Energy Planning Board (Planning Board) recognizes the inextricable linkbetween economic activity and the availability and price of energy. The country’s position inthe world economy and the standard of living of its residents cannot be maintained withoutready access to sources of energy. The primary sources of energy are, to a large degree,imported from abroad, have significant and long-term effects on the environment, and facedepletion. Until new and sustainable sources of energy are developed, the United States (U.S.)and New York will continue to experience the economic and social challenges of fossil fueldependency. A global problem – such as ensuring an adequate energy supply – requires a global solution. There is, however, a vital role for the states in addressing future energy needs. Although thereis considerable uncertainty surrounding emerging developments in energy markets andtechnology, states can position themselves for the future. They can adopt policies to: diversifyenergy supplies, sources, and uses; cost-effectively improve the efficiency of energy use;stimulate the production of indigenous energy resources; foster production of new products and
1-2
services that can be developed, manufactured, and sold for the benefit of local economies;enhance mobility; and minimize harm to the environment from energy use.
The Draft 2002 State Energy Plan and Draft Environmental Impact Statement (DraftEnergy Plan) encompasses policies designed to keep New York at the forefront among thestates in providing its citizens with fairly priced, clean, and efficient energy resources. This DraftEnergy Plan positions New York to take advantage of technological developments among themost advanced uses of energy, and to participate in emerging markets for valuing and tradingenvironmental attributes associated with energy use. In addition, implementation of this plan willstimulate job growth associated with the development of new technologies for the efficientproduction and use of a variety of energy sources and the expanded use of indigenous sourcesof power.
The Draft Energy Plan is a blueprint to inform energy decision making and help ensure that: customers have the ability to choose the energy products and services that best suit their needs;a secure and well-maintained energy infrastructure is provided; the State’s transportationsystem becomes more energy-efficient; and, adequate energy supplies that are critical to theState’s stability are available.
Draft Energy Plan
Providing a secure and well-maintained energy infrastructure, while ensuring adequate energysupplies in New York, is critical to the State’s economy. New Yorkers spent $38 billion onenergy in 2000 to support the State’s economy and residents, including its industrial processes,commerce, services, transportation, lighting, heating, and cooling. The State’s economicresurgence and expanding employment since 1998 resulted in larger than anticipated increasesin energy demand, particularly for electricity. In turn, this has spurred the State’s need for newenergy supplies and enhanced delivery capability. Further, in light of the recent terrorist attacksin New York and Washington, D.C. and additional threats, the State is working closely with theFederal government to further protect the State’s entire energy and transportation infrastructureagainst future terrorist attacks or acts of war.
In response to the tragic events of September 11, 2001, Governor Pataki created the Office ofPublic Security to coordinate and bolster anti-terrorist efforts throughout New York State. TheOffice, which reports directly to the Governor, is responsible for:
1-3
• Reviewing existing State policies, protocols and strategies designed to detect, respondto and recover from terrorist acts or threats, identifying potential shortfalls, andimplementing appropriate revisions and enhancements;
• Coordinating State resources for the collection and analysis of information regardingterrorist threats, and facilitating information sharing among local, State and Federal lawenforcement; and
• Assessing the preparedness of State and local health systems to respond to terroristsattacks.
The Office of Public Security is specifically charged with developing a comprehensiveStatewide anti-terrorism strategy, including an assessment of the vulnerability of criticalinfrastructures to terrorist attack. Energy Planning Board agencies, specifically the StateDepartments of Transportation (DOT), Public Service (DPS), and the New York State EnergyResearch and Development Authority (NYSERDA), are working closely with the Office ofPublic Security to address security at important energy and public resources, including nuclearpower plants and other electric generating facilities, electricity transmission and distributionsystems, telecommunication systems, public roadways, railways, bridges and tunnels, naturalgas pipelines, and water systems. The Energy Planning Board agencies have committed theirfull support to the Office as it develops strategies and plans to protect these facilities fromattack, and if attacks occur, ensure rapid restoration of critical infrastructures.
As energy demand increases, the effects of energy production and use on the State’s naturalresources require that New York consider the implications of energy decisions on the State’senvironment and the public’s health and safety. The Draft Energy Plan balances the need fornew energy supplies and investments in critical energy infrastructures with the need to protectthe State’s environment and public health. It also takes into consideration the significantchanges that are transforming New York’s energy markets. Finally, the Draft Energy Planprovides strategic direction and policy guidance to foster further collaboration on the State’senergy, environmental, transportation, and economic development activities.
The Draft Energy Plan’s balanced approach considers the role of new energy supplies,enhanced energy distribution infrastructure, and improved energy productivity, to meet energyneeds. This balanced approach incorporates environmentally-sound strategies for developingnew sources of energy, improving energy efficiency and energy demand management, andgreater energy diversity. This balance requires access to the financial resources necessary to
1 The Planning Board is required by statute to hold three public comment hearings in three geographiclocations in the State upon release of the Draft Energy Plan. The Planning Board held five public commenthearings in development of the 1998 Energy Plan and plans to hold eight in development of the 2002 EnergyPlan.
1-4
develop new energy supplies and a commitment to environmental protection by energy decisionmakers. A benefit of greater energy diversity, as discussed elsewhere in the Draft Energy Plan,is greater energy security in the form of reduced risk of energy supply disruption and pricevolatility. Moreover, a balanced portfolio of energy resources provides greater economicdevelopment opportunities within the State, particularly in the development of indigenous energyresources, including renewable energy resources, and energy service reliability.
Energy Planning Process
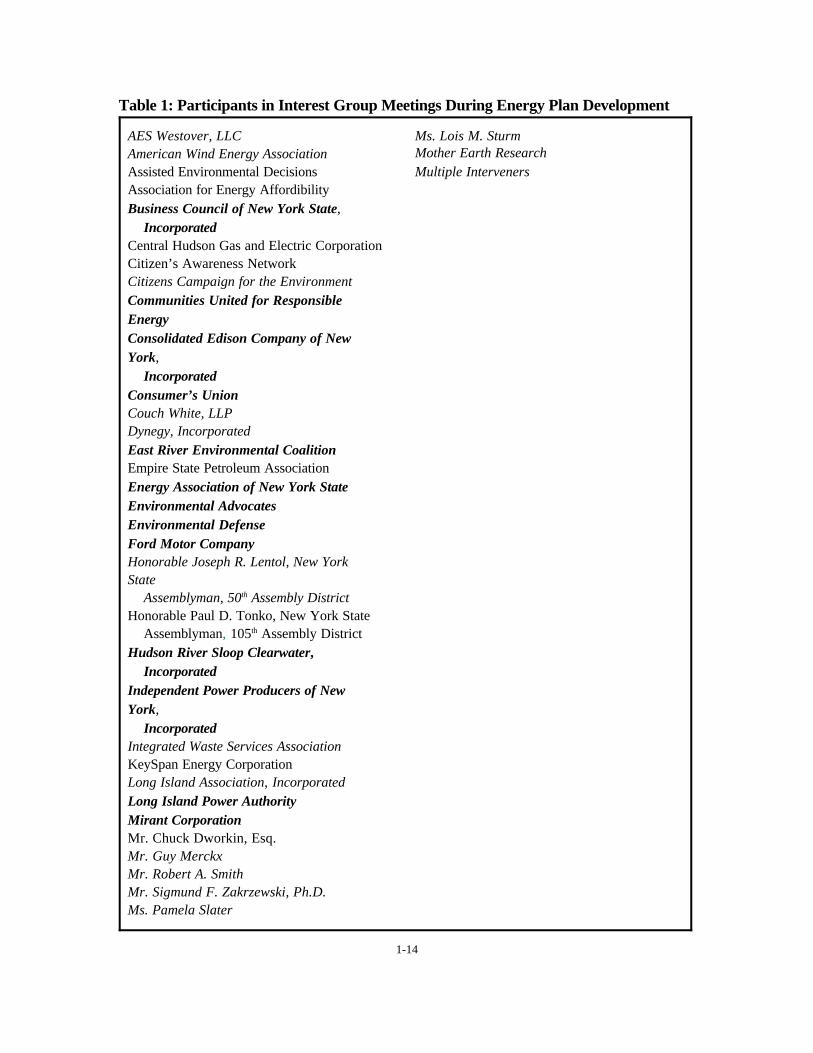
The Planning Board initiated the 2002 Energy Planning Proceeding at its March 12, 2001meeting. A Notice of Commencement, published in the April 18, 2001 New York StateRegister, opened the 60-day public comment period. The comment period closed on June 18,2001; however, several parties have continued to correspond with the Planning Boardagencies’ staffs throughout development of the Draft Energy Plan. During the comment period,the Planning Board received 47 sets of written comments from interested parties regarding theissues raised by the Planning Board for inclusion in the Draft Energy Plan. Parties thatsubmitted comments are listed in Table 1, included at the end of this Section. Throughoutdevelopment of the Draft Energy Plan, the staffs of the Planning Board agencies met with 50interest groups, also listed in Table 1. The increased outreach efforts of agencies’ staffs and thelevel of public comment by interested parties throughout development of this Draft Energy Planare unprecedented.
Continuing on this track, the Planning Board will schedule a Technical Briefing on the contentand analyses contained in the Draft Energy Plan, and eight Public Hearings will be heldthroughout the State to solicit public comment on the Draft Energy Plan.1 Following completionof the Public Hearings, the Planning Board anticipates releasing the Final 2002 State EnergyPlan and Final Environmental Impact Statement in Spring 2002.
NEW YORK’S ENERGY MARKETS
New York’s energy markets have changed significantly over the past few years. Thesechanges, especially in the utility sector, have focused the State’s attention to ensure that the
1-5
transition to competition and customer choice unfolds in an orderly and reliable manner. Whileenergy supplies and prices are determined to a great extent by world and national markets, theState continues monitoring markets and adopting polices to support the development ofcompetitive energy markets and to maintain necessary consumer protections. The benefits ofgreater competition, in the form of increased diversity in supplies, greater supply availability,greater technological innovation, and prices that are lower than might otherwise be anticipatedunder regulation, are expected to be realized once this transition is completed. The Statecontinues to monitor the reliability and safety of its energy infrastructure during the transition tocompetition to ensure that the quality of energy services is maintained.
Recent Accomplishments
During the past several years, the State’s electric and gas customers have received the benefitsof significant reductions in their electric and gas delivery rates. Since 1996, the New YorkPublic Service Commission (PSC) has issued orders that have so far resulted in cumulativecustomer rate reductions of about $3.4 billion, with at least that same amount of furthercumulative savings to be available over the next several years. The Long Island PowerAuthority has similarly provided rate reductions for its customers in the amount of about $2billion through 2001. In addition, further customer savings ($152 million per year) will resultfrom the recent PSC Order determining electric revenue requirements for the Niagara MohawkPower Corporation, and customer savings might also result when the on-going New York StateElectric and Gas Corporation and Rochester Gas and Electric merger proceeding is completed.
While changes are occurring in all energy markets, the State’s electricity system has undergoneprofound changes. Utility companies have nearly completed the process of divesting theirgeneration assets, including nuclear plants, transforming themselves from vertically integratedutilities to distributors of electricity and natural gas. Generation is largely independently-ownedand managed in New York, with generators selling electricity, either directly to wholesalecustomers through bilateral contracts or to the wholesale market operated by the New YorkIndependent System Operator (NYISO). This, in turn, has created opportunities forindependently-owned energy providers, marketers, and brokers to serve New York’selectricity customers. As a result of State regulatory initiatives, more than 80% of the electricitygenerating capacity formerly owned by regulated investor-owned utilities has been sold toindependent power producers. Such independently-owned generating capacity nowparticipates in the State’s new competitive wholesale electricity market, operated since 1999by the NYISO.
1-6
Currently, all electricity and natural gas customers in New York that were formerly served byregulated utilities are able to choose their electricity and natural gas commodity supplier. Inaddition, the New York State Public Service Commission (PSC) is requiring that metering (for50 kilowatt or greater demand customers), billing, and associated administrative customerservice functions be opened to competition.
Ensuring the delivery of adequate supplies of electricity remains an important challenge for NewYork. Recent State efforts have simplified the certification and review process for siting newpower plants. Article X of State Public Service Law (PSL) authorizes the State Board onElectricity Generation and the Environment (Siting Board) to issue a Certificate ofEnvironmental Compatibility and Public Need prior to construction and operation of an electricgenerating facility with a capacity of 80 megawatts (MW) or more. Article X was amended in2001 (Chapter 222 Of the Laws of 2001) to require Siting Board action within six months forapplications that replace or repower existing generating facilities and result in decreased wateruse and decreased emissions of certain air pollutants. The Article X amendments, in effect,expedite the certification process for applications that replace or repower facilities with newfacilities that meet certain air and water standards.
In a competitive market, participants will determine when and where new electricity generationor demand reductions are most needed and economically viable. Plans for new electricitygeneration that promote or contribute to development of a competitive market will be consistentwith the long-range plans for expansion of the State’s electricity system, as envisioned in theDraft Energy Plan.
Many new independently-owned power plants have been proposed to serve the New Yorkmarket. As of December 2001, five new power plants, totaling approximately 3,490megawatts (MW) of additional capacity (representing a net addition of 3,300 MW), have beenapproved through New York’s Article X siting process. Developers of an additional nineplants, totaling 6,156 MW, have filed applications and another nine proposed plants,representing 5,575 MW, have been announced. As the metropolitan New York region faced alimited ability to import power and a rising demand that threatened to outpace local generationcapacity in 2001, the New York Power Authority (NYPA) purchased and installed 11 new44-MW natural gas-fired generating plants in New York City and Long Island, greatly addingto the reliability of the regional electric system, particularly during the peak summer demandperiods.
2 The SBC is a non-bypassable charge on the transmission and distribution of electricity in New York Statethat is collected by the State’s electricity load serving entities.3 NYSERDA administers approximately $140 million annually with the remainder of funding beingadministered by utilities to serve selected low-income customer needs. These programs are described morefully in the Preserving Energy-Related Public Benefits Programs issue report, and the Energy Efficiency, andRenewable Energy assessment reports in the Draft Energy Plan.
1-7
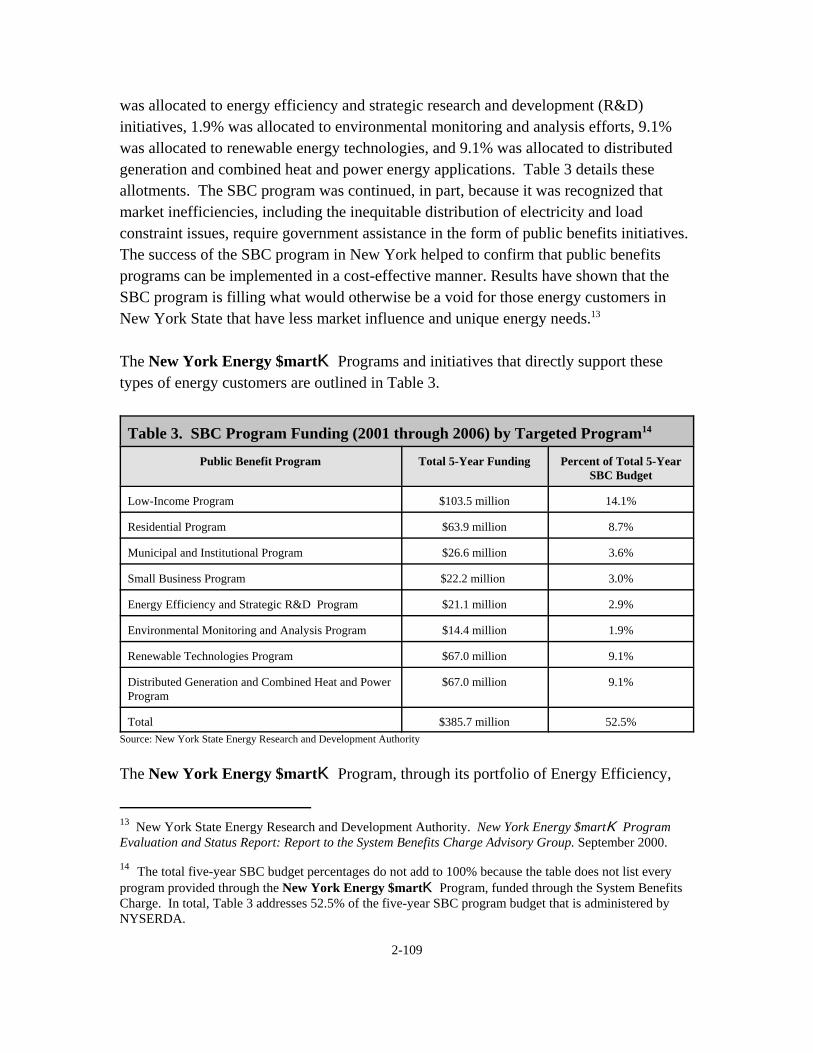
In addition to opening the electricity and natural gas markets to greater competition, the PSChas enacted a public benefits program through which System Benefits Charge2 (SBC) funds areused to promote energy efficiency, assist low-income customers, encourage research anddevelopment (R&D), and protect the environment. The PSC recognized the responsibility toensure that electricity service be provided safely, cleanly, and efficiently, and that continuingsuch public benefits programs beyond what competitive markets might provide was necessary. This program, predominately administered by the NYSERDA, is funded through June 2006 at$150 million a year.3 From 1998 through 2006, New York’s public benefits funding is $984million. With interest earnings, this amount will exceed $1 billion. In addition to this funding,the NYPA and the Long Island Power Authority (LIPA) together will spend another $130million annually on energy efficiency and related public benefits programs.
Collectively, over the eight-year period of 1998 through 2006, the State will spend more than$2.0 billion on public benefits energy programs. Moreover, these programs are designed toforge partnerships with New York businesses and require investments of private capital forenergy efficiency and improvements and research and development projects. Overall, theseprograms result in more than $2 of private investment for every $1 of public funding provided. In many instances, this amount is more than $3 for every $1 of public funding.
Improving energy efficiency remains a central focus of New York’s energy policy. Effectiveenergy efficiency programs reduce energy use and energy costs, and improve the environmentthrough reduced pollutant emissions that result from energy use. Through its public benefitsprogram, the State has begun assisting development of an energy services industry that will helpshift the impetus for providing energy efficiency to the private sector. The economicdevelopment potential of investments in energy efficiency, in terms of lower energy bills andjobs created or retained in the State, is on the order of 20 jobs per $1.0 million in energysavings. The long-term effects of facilitating market development, new technologymanufacturing and use, and expanded choice in consumer services, are expected to help grow
4 Guidelines for implementing the Executive Order were issued in December 2001, in the NYSERDA reportentitled, Executive Order No. 111 “Green and Clean” Buildings and Vehicles Guidelines.
1-8
the State’s economy in an environmentally-sound manner. Upon issuing Executive Order 111,Governor Pataki put State government in a leadership role for promoting energy efficiency andthe wise use of natural resources to protect and enhance the State’s environment and economy. Under the Executive Order, all State agencies, departments, and authorities must seek toreduce their buildings’energy use by 35% relative to 1990 levels and seek to purchase 20% oftheir electricity from renewable energy sources by 2010.4
During the transition period to competition, the State’s SBC-funded public benefits programsare providing a wide range of services to residents and businesses. These programs provideenergy efficiency and related services to small customers and low-income households, supportdevelopment of markets for manufacturing, stocking and sales of energy efficient products, andsupport R&D activities in renewable energy development, new product development andapplications, and environmental protection. At the direction of the PSC, the State’s publicbenefits program was expanded to include load management and emergency generationresources procurement to help meet the State’s peak electricity needs until new generationresources become available.
In support of the State’s load management initiatives, in 2001, the NYISO implemented a day-ahead economic demand response program. This program enables demand reductions andnew electricity supplies to compete on equal footing to meet the State’s peak load needs and inan emergency requires cooperating customers to reduce demand when requested by theNYISO. These efforts facilitate competition among alternatives (e.g., energy efficiency andload management and electricity generation) and are expected to promote greater customerchoice and diversity in energy resources. During the summer of 2001, as a result of thesecoordinated efforts, the State’s peak demand was reduced by approximately 710 MW. Inaddition, through public appeal, State government programs, and voltage reductions, peak loadwas reduced by another 840 MW, bringing the total Statewide reduction to approximately1,550 MW. The availability of these demand management resources, including energyefficiency, enabled New York to assist neighboring states in maintaining electricity service andstabilized wholesale electricity prices at the time of system peak.
While load reduction and energy efficiency programs are important components of NewYork’s strategy, California has demonstrated the risk in relying solely on these initiatives tomeet future energy needs. As our economy continues to grow and businesses and residents
5 The State is studying the interdependencies of its energy markets and assessing the need for energysystem improvements to facilitate a workably competitive market for energy and energy services asdescribed later in this Draft Energy Plan. The study is jointly funded by NYSERDA and the NYISO.
1-9
become more reliant on technology, so too does the State’s demand for electricity grow. Tokeep pace with this growth, the State must increase its capacity to generate electricity by sitingnew, cleaner, state-of-the-art power plants and by increasing other alternative sources ofelectricity generation.
As electricity and natural gas markets become more competitive, petroleum and other energycommodity markets become increasingly interdependent. Natural gas and petroleum marketsare already very competitive in the heating fuels and industrial processes market. With greatercompetition in the electric industry, more electricity generating plants are being proposed thathave dual-fuel capability, to burn natural gas or petroleum, depending on prevailing marketeconomics. The volatile nature of these markets requires that energy decisions be made quicklyand that an adequate energy supply infrastructure be in place to respond to nearly instantaneouschanges in the demand for particular fuels.5 In addition to the large number of new powerplants proposed to serve the New York market, the Federal Energy Regulatory Commission(FERC) recently approved five natural gas pipeline projects to serve the Northeast, andanother 13 projects have been proposed.
To address the environmental impacts of stationary sources of pollution, the State is currentlydeveloping and implementing strategies to reduce stationary source emissions. These include: (1) working with industry to promulgate emission standards for distributed generation; (2)implementing the Governor’s Acid Deposition Reduction Initiative, (3) providing expeditedpermitting procedures to encourage siting of electricity generating facilities that minimize aquaticand air quality impacts; (4) working with the Federal government to develop national strategiesto reduce multi-pollutant emissions from electricity generating facilities; and, (5) using SystemsBenefit Charge-funding to promote the development of clean energy generation technologies.
The State continues to be heavily dependent on petroleum products for sectors other thanelectricity generation. These include motor gasoline, home heating oil, diesel fuel, propane, andresidual oil. New York is the fourth largest petroleum fuel market in the U.S., exceeded onlyby Texas, California, and Florida, and the largest market for home heating oil in the U.S. Adiverse distribution network has developed over the years to transport petroleum products intoand throughout the State, including several pipelines connecting New York to Gulf and East
1-10
Coast states and a vast port and barge waterway system. As demand for energy increases andinvestment in new supplies and distribution infrastructures becomes increasingly responsive tomarket forces, energy producers, suppliers, and users also must have the ability to respond tomarket forces.
The State is continuing its efforts to maintain and improve the existing transportation network toprovide mobility to its residents and businesses and enhance the efficiency of the transportationsystem. Actions to enhance efficiency include greater emphasis on public transportation,technological innovations, alternative fuel vehicle deployment, and pollutant emission reductions. To lessen the State’s reliance on a single transportation fuel, the State now leads the nation inthe use of alternative fueled vehicles and is continually incorporating new clean-fueled vehicletechnologies. Since 1995, the State has increased the number of alternative-fueled vehicles inthe State fleet from less than one dozen to more than 1,400.
In 2000, the New York State DOT approved $7.0 million for capital improvements throughoutthe State to improve mobility, promote economic development, and improve the environment. These projects include the purchase of new buses that use a clean-burning diesel technologyand will reduce hydrocarbon and particulate emissions. In addition, beginning with model year2004, the California Low Emission Vehicle (LEV II) standards will be required of all light- andmedium-duty vehicles in New York State. The LEV II program: extends passenger caremission standards to sport utility vehicles and pick-up trucks; expands and tightens averagefleet emission standards; and presents a super-ultra-low-emission vehicle category for light dutyvehicles. In addition, LEV II requires that 10% of vehicles sold be advanced technologyvehicles, which includes electric vehicles, hybrid vehicles, and vehicles powered by fuel cells.
These programs are expected to reduce the amount of air pollution from motor vehicles,especially in metropolitan areas, by continuing to drive the development of new technology toproduce cleaner and more durable cars and trucks. DOT, through its Environmental Initiative,has integrated environmental considerations into its Statewide transportation planning andproject development. The State is developing and implementing innovative strategies to reduceenvironmental impacts from mobile sources of pollution by: (1) working with automobile andtruck manufacturers to develop new technologies to reduce emissions from such vehicles, andto promote the introduction of such technologies into the marketplace; and, (2) promoting theintroduction of clean fuels, including renewable-based fuels, low-sulfur diesel, and otheralternative fuels by purchasing vehicles that use such fuels for use in the State fleet anddeveloping incentives to encourage their use in the private sector.
1-11
New York State has established the first business park in the country that is specificallydevoted to promoting the development of clean energy technologies. Over the next five years,the new Saratoga Technology Energy Park (STEP), located in Malta, NY, will help attractbetween 1,000 and 1,500 jobs to the Capitol Region as emerging, environmentally-friendlyenergy companies take advantage of the park's resources. The business park will providecompanies with technology development and prototyping support through the University atAlbany, funding to support technology development and commercialization throughNYSERDA, and tax incentives and other economic development incentives through SaratogaEconomic Development Corporation. The project advances the local development of cleanerenergy technologies that address energy supply and reliability issues, as well as environmentalimpacts.
National statistics indicate that the energy technology sector grew by 134% in 2000 and themarket for clean energy technologies is projected to grow from $7 billion per year to about $82billion per year by 2010. New York State, already home to more than 20 leading energytechnology companies, is well suited to take advantage of this rapid growth. The STEPdemonstrates how the State can use its resources to partner with local communities and createopportunities for new jobs and new businesses. The partnership among State government, theSaratoga Economic Development Corporation, and the University at Albany can attract newbusinesses and jobs to New York State to address the growing need and demand for clean-energy and energy-efficient technologies.
The State’s commitment to reducing energy costs and developing energy markets by loweringtaxes, streamlining and eliminating unnecessary regulations, and providing energy customerswith greater choices among energy service providers is an important impetus behind the policesand strategies in the Draft Energy Plan. Equally important, however, is the State’s commitmentto: improving energy diversity and energy efficiency; increasing energy supplies; fostering asustainable market for indigenous and renewable energy; encouraging new, cleaner energytechnologies; and improving transportation system efficiencies. These commitments will lead toincreased economic development in an environmentally sustainable manner.
The 2000-2001 State Budget eliminated the Gross Receipts Tax (GRT) paid by manufacturersand industrial energy customers, began a gradual elimination of the GRT for all other businesscustomers over five years, and provided a major reduction in GRT for residential energycustomers over a five-year period. When fully implemented in 2005, annual tax savings fromGRT modifications are expected to reach $330 million. The State also is eliminating the sales
1-12
tax on the delivery of energy, providing $150 million in tax savings to the State’s natural gas andelectricity customers. The first phase of this tax cut began in September 2000, and the entirereduction will be fully implemented by September 2004. When combined with the GRTreductions, State taxpayers will save approximately $580 million a year, further lowering theirenergy costs.
NEW YORK’S ENERGY POLICY
The policies and strategies included in the Draft Energy Plan place New York on a path towardgreater energy self-sufficiency and customer choice. The policy and strategy recommendationssupport a flexible and market-based approach to growing the State’s economy, improving theenvironment, and enhancing the transportation system. The recommendations will drivetechnological innovation and facilitate competition in energy markets that will result in thedelivery of new and efficient energy products and services at competitive prices. In addition,they are designed to provide for continued energy system security and reliability.
Energy Policy Objectives
The Draft Energy Plan provides broad statewide energy policy direction rather than prescribingspecific government agency actions. As markets continue to develop and new energyresources and services become available, new policies may be warranted. The broad publicpolicy objectives are:
1. Supporting the continued safe, secure, and reliable operation of the State’s energy andtransportation systems infrastructure;
2. Stimulating sustainable economic growth through greater reliance on market forces tospur technological innovation and job growth in the State’s energy and transportationsectors;
3. Increasing energy diversity in all sectors of the State’s economy through greater use ofenergy efficiency technologies and alternative fuels;
4. Promoting and achieving a cleaner and healthier environment; and,
5. Ensuring fairness, equity, and consumer protections in an increasingly competitivemarket economy.
1-13
To meet these public policy objectives, State government policies must be balanced and basedon long-term strategies that encourage and support development of new cleaner technologies,more efficient energy-consuming practices, and improved transportation, energy production,and delivery systems.
New Yorkers want affordable energy from reliable, clean, and efficient sources. The energypolicies and long-range planning strategies presented in the Draft Energy Plan are designed toensure that New York’s energy needs are met by encouraging competition while ensuringfairness and equity, ensuring mobility, ensuring system reliability, and improving the State’senvironment.
ORGANIZATION
The Draft State Energy Plan is organized as follows:
Section 1 Preface, Draft Energy Plan Findings and Conclusions, and Energy PolicyObjectives and Recommendations.
Section 2 Analyses of the energy related issues that the Planning Board identified forinclusion in the Draft Energy Plan.
Section 3 Assessments of the State’s energy markets and infrastructure, includingforecasts of energy demand, prices, and supplies; and assessments of energyefficiency and renewable energy resources.
Section 4 The compliance document integrating the requirements of the StateEnvironmental Quality Review Act (SEQRA) within the Draft Energy Plan.
1-14
AES Westover, LLCAmerican Wind Energy AssociationAssisted Environmental DecisionsAssociation for Energy AffordibilityBusiness Council of New York State, IncorporatedCentral Hudson Gas and Electric CorporationCitizen’s Awareness NetworkCitizens Campaign for the EnvironmentCommunities United for ResponsibleEnergyConsolidated Edison Company of NewYork, IncorporatedConsumer’s UnionCouch White, LLPDynegy, IncorporatedEast River Environmental CoalitionEmpire State Petroleum AssociationEnergy Association of New York StateEnvironmental AdvocatesEnvironmental DefenseFord Motor CompanyHonorable Joseph R. Lentol, New YorkState Assemblyman, 50th Assembly DistrictHonorable Paul D. Tonko, New York State Assemblyman, 105th Assembly District Hudson River Sloop Clearwater, IncorporatedIndependent Power Producers of NewYork, IncorporatedIntegrated Waste Services AssociationKeySpan Energy CorporationLong Island Association, IncorporatedLong Island Power Authority Mirant CorporationMr. Chuck Dworkin, Esq. Mr. Guy MerckxMr. Robert A. SmithMr. Sigmund F. Zakrzewski, Ph.D.Ms. Pamela Slater
Ms. Lois M. SturmMother Earth ResearchMultiple Interveners
Table 1: Participants in Interest Group Meetings During Energy Plan Development
1-15
SECTION 1.2
DRAFT ENERGY PLAN FINDINGS AND CONCLUSIONS
INTRODUCTION
In conformance with the Planning Board’s direction, and in compliance with Article 6 ofState Energy Law, the Draft Energy Plan contains five Issue Reports and six AssessmentReports. The Planning Board directed agencies staffs to address these issues in the DraftEnergy Plan at its July 17, 2001 meeting, following a review of public comments and ofthe matters discussed during the staffs outreach meetings with interested parties. Broadlydefined, these issues are:
1. Promoting Energy Industry Competition
2. Energy and Economic Development
3. Energy and the Environment
4. Energy and Transportation
5. Preserving Energy-Related Public Benefits Programs
Promoting Energy Industry Competition. The Energy Industry Competition reportassesses the status and effects of energy industry competition on the development ofenergy markets, energy prices, energy facility planning and siting, and theinterrelationships existing among major energy sources, including electricity, natural gas,and petroleum products.
Energy and the Environment. The Energy and the Environment report addresses theinteractions between energy use and environmental quality, particularly with regard tocurrent trends in environmental regulation, acid rain, greenhouse gas emissions, and non-air impacts.
Energy and Transportation. The Energy and Transportation report addresses theinteractions between energy use and transportation, particularly with regard totransportation system use and management, technology, and efficiency. This reportexplores the interrelationship between a modern, effective, safe, and environmentally
1-16
sound transportation system and enhancing the efficient use of energy in thetransportation sector.
Energy and Economic Development. The Energy and Economic Development reportaddresses the interactions between energy use, costs, and economic development,including the State’s competitiveness in attracting and retaining jobs. This report alsodiscusses the factors that influence New York’s energy prices and rates, including taxes,delivery costs and infrastructure maintenance, and the effects of energy costs on thecompetitiveness of New York’s industries and businesses.
Preserve Public Benefits for New York’s Energy Consumers. This report addresses therole of market-based and needs-based public benefits programs in an era of energyindustry restructuring and greater competitiveness in energy choices, particularly withregard to government-coordinated efforts to serve small commercial, residential, andlow-income consumers.
In addition to the Issue Reports, the Draft Energy Plan contains several AssessmentReports (20-year forecasts of energy demand and prices, and assessments of availableenergy supplies, including energy efficiency, renewable energy, electricity, natural gas,petroleum, and coal). The Assessment Reports identify emerging trends related to energysupply, price, and demand. The Draft Energy Plan also contains a statement of theState’s energy policies, long-range planning objectives, and strategies, andrecommendations for administrative and legislative actions to implement the State’senergy policies, objectives, and strategies. A Draft Environmental Impact Statement isintegrated into the Draft Energy Plan.
The Issue Reports are presented in the Draft Energy Plan as Sections 2.1 through 2.5,respectively. Following are the key findings from these Issue Reports.
ISSUE REPORT FINDINGS AND CONCLUSIONS
Promoting Energy Industry Competition
• The findings of the 1998 State Energy Plan related to the introduction ofcompetition in the electricity and natural gas industries remain valid today.
• The State must remain vigilant and flexible, and it must resolve issues as theyarise, in order for the competitive energy markets in New York State to reachtheir true potential and for New Yorkers to realize the full benefits ofrestructuring.
1-17
• The State’s administrative approach to restructuring its energy industries waspremised on input from stakeholders and experts and designed to provideflexibility to make adjustments, as necessary, as competitive barriers are revealedand competitive markets develop. This approach has served New York Statewell.
• The primary barrier to achieving effective wholesale competition in the energyindustries is the lack of adequate resources (energy commodity, deliveryinfrastructure, and demand reduction techniques) where they are needed.
• The Article X Power Plant Siting Process in New York State has benefitted theState and provided protection for its environment.
• The natural gas delivery system, built to serve the winter peak needs ofresidential, commercial, and industrial customers, is now fully used during peakperiods. The competitive electricity generation market is moving toward a greaterdependency on natural gas. Such a greater dependency on natural gas suggests a need to: expand the natural gas infrastructure; use resources that will reduce ourdependency on natural gas, such as greater use of renewable energy resources;implement further electricity demand reduction techniques; continue safeoperation of nuclear power plants; and apply clean coal technologies, whereviable.
• The U.S. Congress can assist New York by repealing the mandatory purchase ofpower from qualified generating facilities required of utilities under the PublicUtility Regulatory Policy Act (PURPA), by reforming the Public Utility HoldingCompany Act (PUHCA) to allow utilities to diversify their operations in waysthat could enhance competition, and by establishing national mandatory reliabilityrules for the bulk power system (while allowing states to continue to set morerigorous standards when it is in the public interest).
Energy and Economic Development
• Businesses need secure and reliable energy supplies that are reasonably priced toexpand operations and grow in the State. Policies promoting greater energysupply certainty will lead to greater private sector investment in New York State.
• Low-cost power programs have been successful to date in retaining and
expanding employment opportunities in the State. The development of joint Stateand utility economic development programs has been successful in supportingeconomic development.
1-18
• Power for Jobs has been successful and consideration should be given toauthorizing an additional phase or to development of a new, yet similar program.
• Offering electricity discounts as a means of retaining or attracting jobs is animportant economic development tool.
• Efforts should continue to be made to forge State and private businesspartnerships to grow New York’s economy in an environmentally-sound manner.
• Energy prices need to be brought more in-line with other states to compete moreeffectively for economic opportunities.
Energy and the Environment
• The generation and use of energy results in impacts on the environment, includingthe release of pollutants into the air and impacts on aquatic resources.
• Since the 1998 State Energy Plan was released, the State has made significant gains in reducing the environmental impacts associated with energy generationand consumption. Emission standards on new motor vehicles have beenstrengthened, as have the requirements on electricity generating plants and otherstationary sources of air pollution. The impacts of energy generation on theState’s aquatic resources are analyzed and addressed through existing regulatoryprograms. New electricity generating plants are required to use much less waterthan existing facilities, and the impacts on fish and other aquatic organisms mustbe minimized to the greatest extent possible.
• The State has become a national leader in developing new technologies to reduceemissions from diesel-powered trucks and buses and has created a market forclean-burning low sulfur fuels. These programs will help ensure that New York,already one of the most energy efficient states in the nation, produces andconsumes energy with the lowest possible impacts on the environment.
• New York State has made great progress in meeting its air quality goals, currentlymeeting the National Ambient Air Quality Standards for five of the six federalcriteria pollutants. The New York metropolitan area has not yet attained thecurrent National Ambient Air Quality Standard for ozone (one-hour) and is notlikely to be designated as meeting the pending standards for ozone (eight-hour) orfine-particulates (PM2.5). Meeting these standards will require additionalemission reductions from all sectors.
• New York has adopted the most stringent tailpipe emission standards for newmotor vehicles in the nation and continues to develop new strategies to reduceemissions from mobiles sources such as cars and trucks.
1-19
• The State has made significant progress in reducing emissions that cause aciddeposition and will soon adopt stringent new standards on power plants to furtherreduce these emissions. Scientific data indicates that many water bodies andforested regions in the State are still adversely affected by acidic deposition, andthat there is a need for additional national efforts to address these impacts.
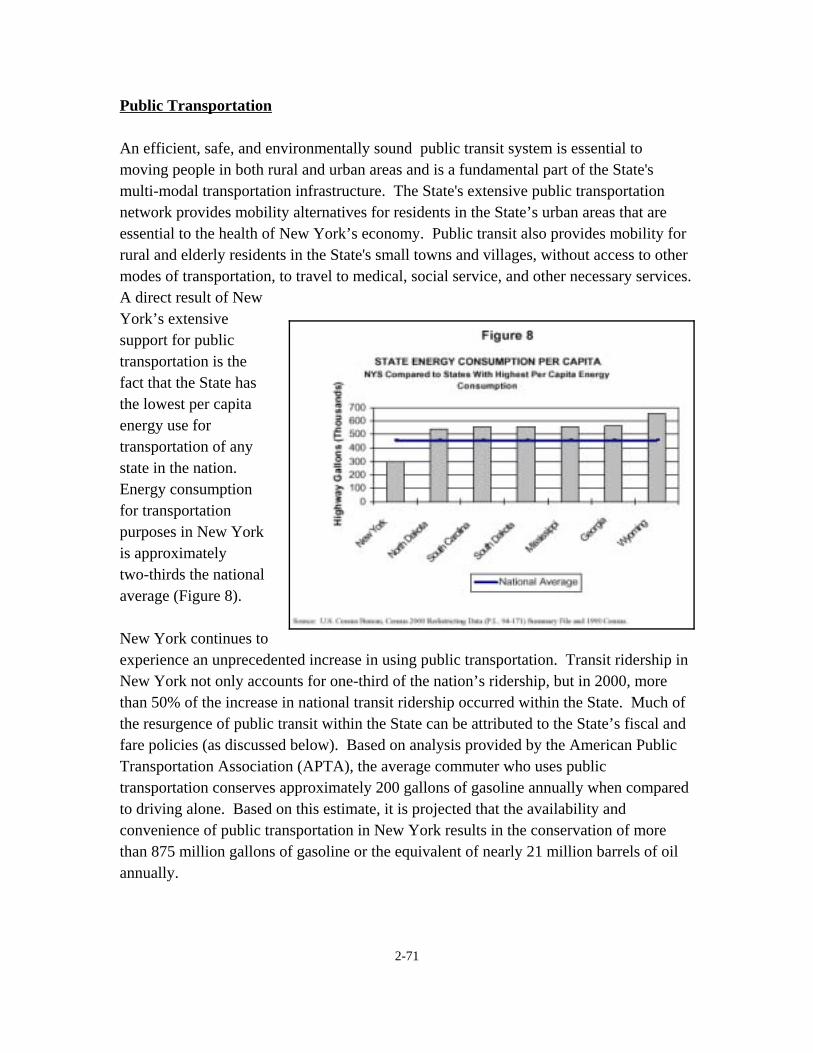
• Public transportation has the potential to reduce significantly the impacts ofenergy used in the transportation sector, particularly through the decrease insingle occupant vehicles on the State’s roadways.
• The fuel additive methyl tertiary butyl ether (MTBE), added to gasoline to meetfederal oxygenate requirements, has negatively affected surface and groundwaters in New York State and across the nation. New York has enacted alegislative ban on MTBE beginning in 2004.
• Environmental Justice (EJ) has become significant issue in the siting of newpower plants and other facilities. The State is working to develop acomprehensive policy on how EJ issues will be addressed.
Energy and Transportation
• New York has the most energy-efficient transportation sector in the United Statesdue to its high-per-capita-use of transit. One-third of all national transit trips arein New York. The use of public transportation is experiencing unprecedentedgrowth, averaging about by 5% annually.
• Statewide, vehicle miles traveled (VMT) and congestion (especially urbancongestion) continue to increase, but VMT should grow at a slower rate in thefuture. Transportation system management, technology improvements, andcapital construction projects are underway to reduce the growth in congestion. Freight truck traffic increases are of concern.
• Bicycle and pedestrian initiatives, passenger ferry service, intermodal freightcapabilities, and high-speed rail efforts are important measures to increase theenergy efficiency of New York’s transportation sector.
• New York has made a significant commitment in alternative fuel vehicle (AFV)technology. More than 1,400 State-owned AFVs and over 50 commercialcompressed natural gas (CNG) stations are in use. Executive Order 111 requiresState agency purchases of light-duty vehicles to be 100% AFV by 2010.
• Progress in reducing the transportation sector’s energy use and air emissions isongoing and will continue in the future through measures such as Commuter
1-20
Choice, Ozone Action Days, and traffic signal coordination. Quantitative buildand no-build energy and emissions analyses of transportation plans and programswould facilitate continued energy and environmental benefits.
• Energy efficiency can be enhanced by actions at the federal level. Reauthorizingfederal surface transportation legislation can substantially affect New York’sstatus as the most transportation-energy-efficient state by providing fortransportation programs that enhance energy efficiency and reduce emissions.
• Fuel economy standards for vehicles have the potential to be the most significantaction to conserve energy in the transportation sector. Fuel economy standardsfor passenger cars have been frozen since 1985 and for light duty trucks since1996. Fuel economy, generally, has worsened between 1990 and 2000.
Preserving Energy-Related Public Benefits Programs
• Government interventions to assist in energy market development are necessaryto align public and private interests, particularly in situations where markets arenot allocating resources efficiently or fairly.
• Energy customer protections must be continued with the same vigor as they havebeen afforded in the past. This becomes increasingly important as energy marketsbecome more competitive and customer choice in service providers increases.
• Public benefits programs have contributed to energy and cost savings forresidential, low-income, small business, and municipal and institutionalcustomers. These programs also provide environmental benefits, includingcleaner air and water, for all of New York’s energy customers.
• Opportunities for further coordination among State agencies with roles insponsoring and providing low-income energy assistance and other public benefitsprograms are beneficial to program participants and should be fostered.
• Public benefits programs directed toward research and development havesignificantly contributed to developing, demonstrating, and providing strategicenergy technologies, including the advancement of renewable energytechnologies, while encouraging and promoting environmental safeguards andprotection.
ENERGY SUPPLY ASSESSMENTS FINDINGS AND CONCLUSIONS
In addition to the Issue Reports, a number of critical energy supply assessments areincluded, as required by Article 6 of the Energy Law. These include supply assessmentsfor:
1-21
1. Energy Demand and Price Forecasts
2. Energy Efficiency
3. Renewable Energy Resources
4. Electricity
5. Natural Gas
6. Petroleum
7. Coal
Following are the key findings of these Issue Reports.
Energy Demand and Price Forecasts
• Demand and nominal prices for all fuels are forecast to increase at different ratesover the forecast period; however, real prices (accounting for inflation) declinefor all fuels over the forecast period.
• New York’s aggregate demand for petroleum products is projected to risemoderately over the forecast period, with increases projected for motor gasolineand decreases for residential heating oil. Increased world demand is expected toexert upward pressure on prices, even given stable supplies. Over the forecastperiod, demand for motor gasoline is projected to increase 21.1%. Year 2000prices were unusually high, 158.8 cents per gallon, so prices are expected to drop8.0% from this level, to 146.1 cents per gallon in 2021.
• Natural gas supply availability, being predominately domestic, is expected to befairly stable. Natural gas prices rose sharply in 2000. This increase was due totight natural gas supplies both in production and storage. A result of this priceincrease was greater U.S. exploration and drilling, increases in inventory levels,and hence, lower real prices over the forecast period. Demand growth will bestrong in New York, with 73.4% projected growth over the forecast period. Thisis primarily due to a 172.5% increase in natural gas demand for electric powergeneration. Real natural gas prices are expected to decrease an average of 0.26%annually, from $5.61 per dekatherm to $5.31 per dekatherm.
• Total electricity use in New York is expected to grow 16.5% over the forecastperiod, while prices in real terms decline. Real electricity prices are forecast todecline 25.0% over the forecast period due to increased competition amongsuppliers and lower fuel prices. Peak megawatt demand is forecast to grow at a
1 The loss of load in New York City resulting from the terrorist attack on the World Trade Center is not factored into theforecast. This load is expected to be restored gradually during rebuilding efforts and completely restored once rebuilding is finished. Load is expected to be fully restored sometime in the early half of the forecast period.
1-22
slightly slower rate than total electricity requirements (15.4% versus 16.5%) overthe forecast period.1
• Coal demand is expected to rise moderately, by a total of 24.1% over the forecastperiod. Customer coal prices decline over the forecast period along with mine-mouth coal prices. Productivity increases continue to result from technologyenhancements, economies of scale, and better mine design. As a result, real coalprices are forecast to decline 14.5% over the forecast period.
Energy Efficiency
• New York is the most energy-efficient state in the continental U.S., on a per-capita basis, with 7% of the nations’s population and accounting for only 5% ofthe nation’s primary energy use. New York is the third most energy-efficientstate in the U.S. on an energy intensity basis, measured as British thermal unitsper dollar of Gross State Product.
• Over the past decade, energy efficiency programs in New York have evolved interms of their depth, breadth, and focus. The State now offers a diverse portfolioof programs that better captures available energy efficiency potential where pastefforts could not.
• Over the past decade, the State has spent nearly $2.8 billion on energy efficiencyprograms, even while total annual spending declined between 1990 and 2000from a high in the early 1990s of more than $400 million per year. Annual energyefficiency spending has been increased through 2006 due to the continuation andexpansion of the State’s System Benefits Charge (SBC) program, and theanticipated spending of the New York Power Authority (NYPA) and the LongIsland Power Authority (LIPA) on public benefits programs.
• Between 1990 and 2000, the State’s major energy efficiency programs have saved50,160 GWh of electricity and have reduced summer peak demand by nearly1,600 MW. Cumulative annual savings in 1999 were 6,519 GWh, or about 5.1%of the 127,998 GWh of electricity sales to ultimate consumers. Natural gas andoil savings of approximately 40 TBtus have also been achieved over this period.
• The cumulative total electricity savings over the period from 1990 to 2000 areestimated to have led to emission reductions of about 37,600 tons of nitrogenoxide (NOX), 75,700 tons of sulfur dioxide (SO2), and 22 million tons of carbondioxide (CO2). Cumulative natural gas and oil savings add an additional 2,000
1-23
tons of NOx, 840 tons of SO2, and 2.5 million tons of CO2 reductions.Approximately 14,500 jobs were created or sustained as a result of theseprograms. These jobs will be sustained for the life of the energy efficiencyequipment installed.
Renewable Energy Resources
• The State has abundant untapped renewable energy resource potential foradditional wind, photovoltaic (PV), and biomass, as well as more efficienthydropower at existing dams, passive solar, solar heating, and geothermal energydevelopment.
• Higher prices for renewable energy will continue to be a barrier to widespread
adoption of renewable energy technologies. To foster greater investment inrenewable energy-based distributed generation technologies, interconnection rulesneed to be monitored and periodically reevaluated with the goal of easinginterconnections without compromising reliability and system protection, andstand-by rates need to be fair and equitable.
• The cost of renewable energy technologies will continue to be dependent onnational and global renewable market development activities. Commercializationefforts, and hence, product prices are currently driven by national and worldwidedemand for renewable energy. As a consequence, it is important for the State tocollaborate with other states and the Federal government to develop policies thatsupport renewable energy technology and industry development.
• The State is making significant progress compared to other states in thepromotion of renewable energy. By November 2001, New York will have 48megawatts of installed wind capacity, the highest capacity in any Northeasternstate. The State is continuing to build a sustainable renewable energy industry bypromoting growth in consumer demand, supporting consumer education,constructing and operating renewable energy facilities, and reducing regulatorybarriers that might hinder greater development of renewable energy resources inthe State.
• The State’s continued support for renewable energy is necessary to increaseconsumer interest, advance the development of renewable energy technologies,and achieve widespread commercialization and use.
Electricity
• New York is a national leader in restructuring its electricity industry. More than15% of customer load has switched from local utility to new retail serviceproviders. Most switching in retail service providers has occurred in the
2 Report of the New York State Energy Planning Board as mandated by Chapter 636 of the Laws of 1999.
1-24
commercial and industrial sectors with considerable variability throughout theState. More progress in increasing customer choice can be expected, especiallywhen more supplies and demand reducing options become available.
• The initial years of wholesale electricity market operations in New Yorkcoincided with periods of high fuel prices, significant transmission congestion,and tight supply conditions. Wholesale electricity prices reflected theseconditions, but they have begun to moderate, although not in a uniform pattern,across the State. Wholesale electricity prices are forecast to decline in real terms,as are retail prices, over the planning period. This expectation is stronglyconditioned on new demand and supply resources being added, especially atcritical locations that will serve to reduce transmission congestion.
• Electricity peak demand is forecast to grow at annual average rates ranging from0.32% to 1.05%, with a mid-range value of 0.68%. The loss of load in New YorkCity resulting from the terrorist attack on the World Trade Center is not factoredinto the forecast. This load is expected to be restored gradually during rebuildingefforts and completely restored once rebuilding efforts are finished. Load isexpected to be fully restored sometime in the early half of the forecast period.
• Reserve margins, representing one measure of system reliability, are expected toexceed the current requirement of 18% throughout the planning period. A higherpeak demand growth rate than expected, however, will require more newresources than are currently expected, especially in the later years of the planningperiod.
• In the near-term, additional single-cycle gas turbines and demand reductionprograms will be used to address growth in peak electricity demand. Over thelonger-term, gas-fired combined-cycle base-load units will be added to thesystem. As of December 2001, five generating projects which totalapproximately 3,490 MW have been approved under the Article X of the PublicService Law. Another 19 projects are in the regulatory review process or havebeen publically announced.
• The State’s transmission system is generally adequate to provide reliableelectricity service; however, there are limitations in the use of the transmissionsystem in moving power between regions of the State for economic reasons. Thesiting of new generating facilities can reduce price impacts attributed to economiccongestion of the transmission system. This finding is consistent with thePlanning Board’s recent “Report on the Reliability of New York’s ElectricTransmission and Distribution Systems.”2 Some local transmissionreinforcements might be necessary in the New York City and Long Island areas.
1-25
• A Northeast regional transmission organization (RTO) offers possibilities forenhanced market efficiencies and economic benefits for most participants. TheRTO structure may also offer a vehicle for developing new transmission lines toincrease power transfers across New York’s borders. There are certain principlesfor RTO formation that should be followed to ensure benefits are realized by NewYork consumers.
• New York will increase significantly the share of electricity generation fueled bynatural gas. This trend is consistent with other regions of the Northeast. A majorforce behind this trend is the decisions of merchant generators to select naturalgas as the preferred fuel of choice. The choice is also influenced byenvironmental factors that recognize the relatively clean air emission profile ofnatural gas generation. This shift in primary fuel requirements for electricity willresult in diminished diversity in the fuel requirements for electricity generation. Reduced fuel diversity increases risk exposure to fuel supply disruptions andprice swings.
• Air pollutant emissions from electricity generation in the State are expected to decrease over the planning period. Increased use of natural gas for electricitygeneration, increased electricity trading among regional electric systems, and fullimplementation of the Governor’s Acid Deposition Initiative all serve to driveSO2 emissions to levels that are one-half that mandated by the Federal Clean AirAct and extend summertime NOX controls year-round.
Natural Gas
• The demand for natural gas is expected to expand significantly over the planningperiod, particularly in the near-term, with the greatest increase in the use of gasfor power generation.
• More pipeline capacity will be needed to meet the increased demand for natural
gas. Interest in expanding interstate pipeline delivery capacity to the Northeastand New York continues to be strong. The local distribution company (LDC)systems will also have to be expanded to meet these increased needs.
• The Federal Energy Regulatory Commission (FERC) recently approved fivenatural gas pipeline projects to serve the Northeast, and another 13 projects havebeen proposed.
• Natural gas prices will decrease slightly in real dollars over the long-term and arelikely to remain somewhat volatile.
• There is a general need to continue LDC system integrity and safety programs as
1-26
well as to continue research and development efforts to develop cost savingstechniques to maintain and upgrade the existing distribution system.
Petroleum
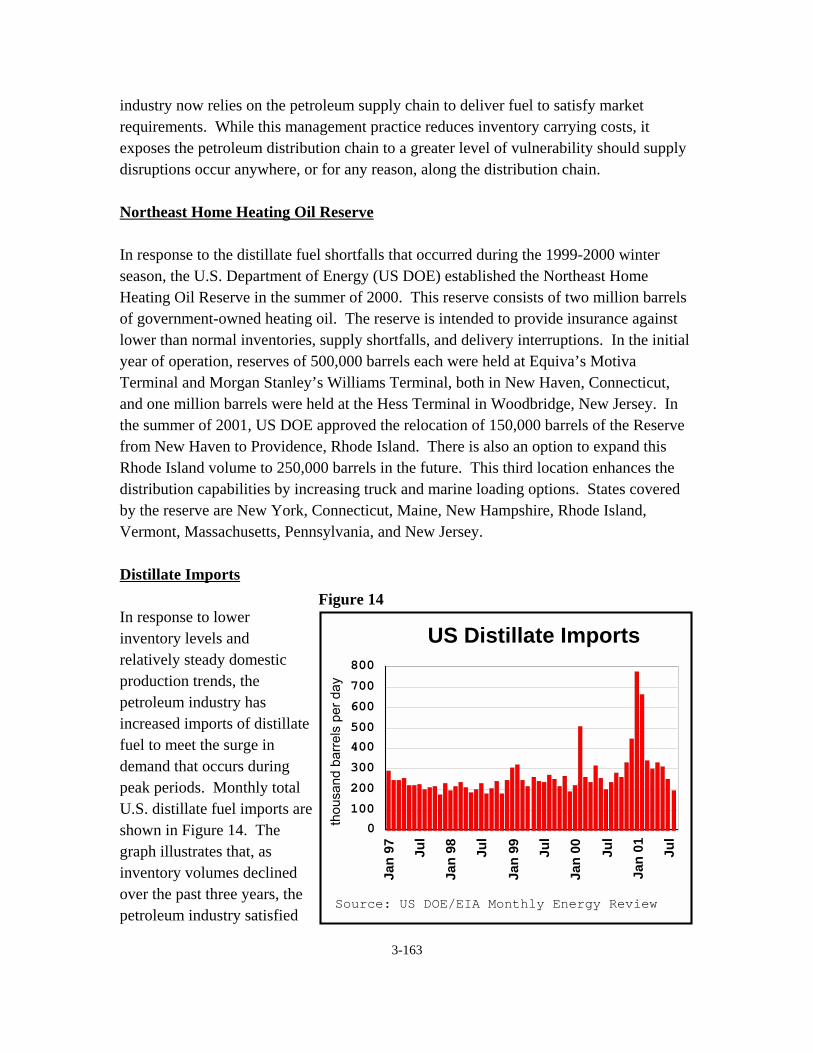
• U.S. production of crude oil continues to decline. As a consequence, both U.S.and New York State continue to increase their dependance on foreign sources ofcrude oil and refined petroleum products to meet consumer demand.
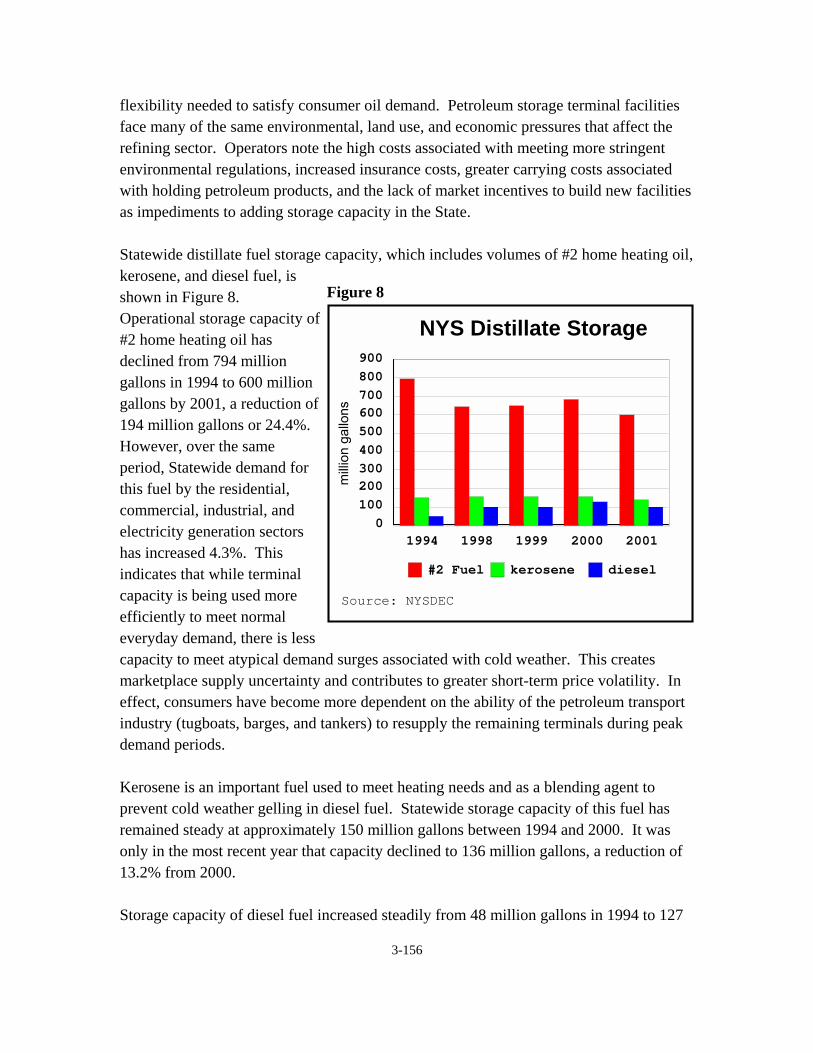
• In-State petroleum terminal storage capacity for distillate fuels, gasoline, andresidual fuel continues to decline. Reasons for this decline include land useconcerns associated with storage, costs associated with properly maintainingfacilities, increased insurance costs, lack of market incentives to construct newfacilities, and the costs of holding large volumes of fuel.
• Lower inventory storage can result in degradation of the operational flexibilityneeded to satisfy consumer demand, greater supply uncertainty, and greater short-term price volatility.
• If the natural gas fueled electric generation facilities with interruptible gascontracts are unable to acquire their primary fuel and are forced to switch todistillate fuel, they will use significant quantities of distillate over a very shortperiod of time. This could strain the ability of the petroleum infrastructure torespond to this need.
• Electricity generation facilities burning distillate fuel as a backup when naturalgas is interrupted, have the potential to disrupt the delivery of electricity in caseswhere such facilities are being relied upon to meet peak demand and whereavailability of distillate fuel is limited. In addition, a sudden, large increase inpetroleum use in electricity generation could potentially have negative impacts onair quality.
Coal
• Coal is America’s most abundant indigenous fossil fuel resource, accounting for95% of the nation’s fossil energy reserves. The United States has a 250-yearsupply of coal.
• The U.S. is second only to China among world coal producers. In 2000, over onebillion tons of coal were produced in the United States, mined in 25 coal-producing states.
• Approximately two-thirds of all coal mined in the United States is transported byrail, making coal the largest single source of freight revenue for United States
1-27
railroads.
• In 2000, nearly 12.1 million tons of coal were used in the State, representing lessthan 1% of the nation’s coal demand. While coal use represents 8% of the State’stotal primary fuel mix, most of the coal (80%) was used to produce electricity.
• New York has 46 coal-fired electricity generation units located in the State,representing nearly 4,000 MW of net summer capability for the State’s electricitygrid.
• A major consideration in the use of coal as a fuel in electricity generation is theemission of sulfur dioxide, nitrogen oxides, particulate matter, and carbondioxide. Clean coal technologies offer utilities options for making substantialreductions in acid rain and greenhouse gas emissions, while providing health-related benefits as the result of improved air quality.
• Clean coal technology can play a role in helping the State to achieve its energy,economic, and environmental goals.
1-28
SECTION 1.3
ENERGY POLICY OBJECTIVES AND RECOMMENDATIONS
INTRODUCTION
The Draft Energy Plan provides broad Statewide energy policy direction rather thanrecommending specific government agency actions. The Energy Planning Board’s strategies forputting New York on a path toward greater energy self-sufficiency and supporting a flexibleand market-based approach to growing the State’s economy, improving the environment, andimproving transportation systems are outlined in this Section. These strategy recommendationsare grouped according to the primary objective that the recommendations most directlysupport. Clearly, several of the strategy recommendations support multiple objectives. Forexample, several recommendations have emerged from the Governor’s Greenhouse Gas TaskForce (Task Force) and are identified as such in the Draft Energy Plan. Several otherrecommendations support greenhouse gas emission reductions but are grouped under theobjective that they most directly support, whether or not they have been recommended by theTask Force.
The strategy recommendations that follow are intended to achieve the public policy objectivesof the Draft Energy Plan. Moving forward, however, more analysis will be required on some ofthe recommendations prior to their implementation, giving due consideration to such factors asenergy cost impacts, security and diversity of energy supplies and electricity generationtechnologies, protection of public health and safety, beneficial and adverse environmentalimpacts, and the State’s ability to compete economically.
1. Supporting the continued safe, secure, and reliable operation of the State’senergy and transportation systems infrastructure.
A. The State should initiate a study of the security of New York’s energyinfrastructure for production, storage, and delivery, including a risk andvulnerabilities assessment and recommendations for appropriate actions. Thisstudy should be conducted cooperatively with the Office of Public Security, theEnergy Planning Board agencies, and major energy suppliers.
B. The State should support investments in utility natural gas and electricitydistribution system maintenance, supporting multiple redundancies, shared
1-29
design practices, shared inventories, and flexibility necessary to ensurecontinued safe and reliable system operation.
C. State agencies and authorities should encourage the New York IndependentSystem Operator (NYISO) to consider the certainty and availability of primaryand back-up fuels as factors in the valuation of capacity from electricitygenerators, to ensure that the reliability of the electricity, natural gas, andpetroleum supply and delivery infrastructures are not adversely affected ifgenerator fuel supplies are disrupted.
D. The State should support energy diversity in all sectors of the economy throughinvestments in, and infrastructure development assistance for, indigenous andrenewable fuels, and energy efficiency, to reduce the risks associated withsingle fuel dependency and price volatility.
E. The State should continue its efforts to reduce traffic congestion and delays,and increase energy efficiency in transportation through a complement ofactions that include public transit, transportation management, intelligenttransportation systems, and capital construction.
1. The State should ensure that transportation planning and construction iscompatible with current and planned community development.
2. The State should reduce transportation sector energy use by promotinginter-modal freight capabilities.
3. The State’s emphasis on maintaining the existing transportationinfrastructure, through its capital construction programs, should becontinued.
4. The State should work more closely with utility companies to betteridentify, and, if possible, design project work around utility facilities. The State should work in partnership with municipal governments toaccomplish this objective for municipal projects.
2. Stimulating sustainable economic growth through greater reliance on marketforces to spur technological innovation and job growth in the State’s energy andtransportation sectors.
1-30
A. The State should reauthorize Public Service Law (PSL) Article X relating to thesiting of new major electric generating facilities, scheduled to expire on January1, 2003. As part of this process, the following issues should be considered.
1. The State should continue to encourage public participation in theArticle X siting process. State agencies should continue their pre-application information programs and training workshops forprospective applicants and affected communities. The State shouldalso evaluate the effectiveness of current statutory language providingfor intervenor funding.
2. The State should examine whether provisions requiring expeditedproceedings for facilities meeting environmental performance standardsshould be modified or expanded to include facilities that would furtherother public policy goals.
3. The State should evaluate the appropriateness of developing specificprocedures with respect to the expansion, modification, or repoweringof existing major generating facilities.
4. The State should consider additional modifications and measures toArticle X=s procedural requirements that would enable the Siting Boardto streamline its review where interested parties, including affectedcommunity groups, have reached consensus as to the specific issuespresented by an Article X application.
5. The State should consider adding the New York State Department ofState and the New York State Office of Parks, Recreation, andHistoric Preservation as statutory parties to Article X proceedings inorder to coordinate State review of Article X applications.
6. The State should consider whether a Certificate of EnvironmentalCompatibility and Public Need issued pursuant to Article X should, inappropriate cases, include conditions and requirements that areintended to promote improved energy systems reliability and ensure thatpeak electricity demand requirements are met.
B. The State should reauthorize, with modifications, Article 6 of the Energy Law,for Statewide energy planning, scheduled to expire on January 1, 2003. Modifications should include reducing the forecasting period for energy demandand prices from 20 years to 10 years and changing statutory language to reflect
1-31
changes in the electricity industry. In addition, to statutory modifications, thefollowing administrative steps should be taken.
1. The State Energy Planning Board should meet annually to coordinatedevelopment and implementation of energy-related strategies andpolicies, receive reports from the agencies’ staffs on the compliance ofmajor energy suppliers with its information filing requirements, andreceive summary reports on the information filed.
2. The information filing regulations of the Planning Board should bemodified to recognize new entrants into the energy marketplace and theneed for certain information and data.
C. The State should support and work expeditiously toward establishing a regionaltransmission organization (RTO), merging the operations of the NYISO, theNew England Independent System Operator, and the Pennsylvania, NewJersey, and Maryland (PJM) Independent System Operator.
1. The State should continue to participate in RTO negotiations to ensurethat integration of the New England ISO, the Pennsylvania, NewJersey, and Maryland ISO, and NYISO incorporates the bestpractices of each existing ISO and provides fair representation withinthe RTO’s governance structure.
2. Any system developed for merging the NYISO into a larger RTO mustbe designed to incorporate local reliability requirements and ensure thatshort-term economic pressures do not shortchange the reliableoperation of New York’s integrated electric system.
D. The State should move expeditiously to a fully-competitive retail electricitymarketplace while maintaining appropriate customer service protections.
1. The State should complete the unbundling of electricity services andimplement Statewide competitive services for metering, billing, andother services for which competition is expected to lower costs andimprove service quality.
2. The State should support the use of interval meters, where appropriate,to enable customers to respond to real-time electricity prices.
1-32
E. The State should coordinate rebuilding efforts in New York City amongaffected State agencies, and provide technical and design assistance andfinancial incentives, to ensure that these efforts maximize the use of energy-efficient and environmentally-sound design and construction practices to reduceenergy use and costs, reduce pollutant emissions, and improve indoor airquality.
3. Increasing energy diversity in all sectors of the State’s economy throughgreater use of energy efficiency technologies and alternative fuels.
A. The State should significantly increase energy resource diversity in electricitygeneration and transportation energy use, through greater reliance onindigenous and renewable energy resources.
1. The State should competitively solicit 60 to 120 MW of renewableelectricity generation to meet the requirements of the Governor’sExecutive Order No. 111 that calls for up to 10% of State facilities’electricity needs to be provided from renewable resources by 2005 and20% by 2010.
2. The New York Power Authority (NYPA) should competitively solicitbids for long-term contracts for the purchase of electricity fromrenewable energy resources, with a particular emphasis on windgeneration in upstate areas and photovoltaic generation in the NewYork City Metropolitan area.
3. The Long Island Power Authority (LIPA) should competitively solicitbids for long-term contracts for the purchase of electricity fromrenewable energy resources, with a particular emphasis on windgeneration on Long Island.
4. The State should examine and report on the feasibility of establishing aStatewide renewable portfolio standard (RPS) for electricity generationand a Statewide energy efficiency standard, and assess the economicimpacts of such standards and analyze whether an RPS and an energyefficiency standard can be harmonized with a restructured andcompetitive electricity market.
5. The State should encourage greater use of indigenous fuels andrenewable-based electricity generation by removing regulatory barriers,expanding net-metering programs, effectively enforcing interconnection
1-33
standards, consolidating and enhancing tax incentives, and supportingdevelopment of a renewable fuels industry in New York.
6. The State should support clean coal technology research,demonstration, and commercialization, and work closely with industryto retrofit existing coal-fired electricity generating facilities in the State toreduce harmful pollutant emissions and improve the State’s energydiversity. To this end, the State should expand its research,development, and demonstration of clean-coal technology through thecollaborative efforts of the New York State Department ofEnvironmental Conservation (DEC), the New York State EnergyResearch and Development Authority (NYSERDA), NYPA, LIPA,and private developers. The State should support joint demonstrationprojects at existing coal-fired facilities in the State.
7. The State should expand bio-fuels research and development activitieswith the goal of creating a self-sustaining private sector bio-fuelsindustry in the State within the next five to 10 years. The State should,possibly working in cooperation with other states, develop a specificplan for producing, refining, and marketing biomass fuels derived fromwaste, soybean, and corn oils, and from paper sludge, municipal solidwaste, and other cellulose sources. The State should support thecommercialization of bio-fuels technology and use of bio-fuels asvehicle fuel, heating fuel, emergency electricity generation fuel, and inmarine applications.
B. The State should encourage the development and use of distributed generation(DG) and combined heat and power (CHP) technologies at customer sites,with the goal of becoming a national leader in the deployment of distributedgeneration technology. Primary focus should be on applications where suchtechnologies can be shown to reduce energy costs, improve electricity systemreliability, and reduce harmful pollutant emissions.
1. The State should continue its research and development support forDG and CHP technologies and applications, supporting, in particular,clean and renewable energy-based DG and CHP technologies.
2. The State should coordinate agencies’ efforts to facilitate theinterconnection of DG and CHP resources into the electricity systemand increase the use of DG and CHP resources in the State.
1-34
3. The State should consider offering investment tax credits to spur privatesector investment in environmentally-sound and cost-effective DG andCHP technologies.
C. The State should maintain fuel neutrality in its support for alternate-fueledvehicle technology.
1. The New York Alternate Fuels Tax Credit program, scheduled toexpire on February 28, 2003, should be extended and consideration given to enhancing it by including all types of alternate fueled light-,medium-, and heavy-duty vehicles. Incentives should also be extendedto fuel providers to continue the development of an alternative fuelsinfrastructure in New York.
D. The State should support federal surface transportation legislation that leads tomore energy-efficient transportation. Specific elements should includeincreased federal funding for transit, retention of the Congestion Mitigation andAir Quality program, continued funding for intelligent transportation systems andtransportation systems operations, and modification of the FederalTransportation Equity Act for the 21st Century (TEA-21) programs to improverail service.
E. The State should encourage the Federal government to adopt new corporateaverage fuel economy standards (CAFÉ) for vehicles to address vehicle energyefficiency in a way that protects driver and passenger safety.
4. Promoting and achieving a cleaner and healthier environment.
A. The State should proceed to phase-out the use of methyl tertiary butyl ether(MTBE) as an oxygenate additive in motor gasoline as required by State law. At the same time, the State should seek relief in the form of a waiver from theU.S. Environmental Protection Agency (U.S. EPA) from the oxygenaterequirement. The State should begin supporting infrastructure development foran indigenous and renewable-based substitute for MTBE in the event that awaiver is denied. The State should recommend strategies for building andsupporting such an infrastructure and industry in New York.
B. The State should review the recommendations of the Governor’s GreenhouseGas (GHG) Task Force and implement appropriate recommendations in atimely manner. In addition to considering other recommendations upon
1-35
development of a final report from the Center for Clean Air Policy with inputfrom GHG Task Force, the State should:
1. Commit to a Statewide greenhouse gas (GHG) emission target withnear-term (e.g., 2010), mid-term (e.g., 2020), and long-term (e.g.,2050) stages.
2. Develop an annual GHG emission inventory and sequestration registryfor carbon dioxide (CO2), methane (CH4), nitrous oxide (N2O),perfluorocarbons (PFCs), hydrofluorocarbons (HFCs), and sulfurhexafluoride (SF6), and report on progress made to reduce theseemissions against State and sectoral targets and goals by public andprivate entities. The State should support the prospect of tradeablecredits for actions already taken, in the event that enforceable carbonlimits are established nationally.
3. Incorporate energy-efficient technologies, sustainable transportationservices, and site design features into the reconstruction of the WorldTrade Center in New York City.
4. Emphasize the greenhouse gas emission reduction potential, mostnotably of carbon dioxide (CO2), as a criterion in developing newprogram initiatives in the State’s public benefits programs.
5. Expand the State’s efforts to improve the efficiency of energygeneration and encourage use of indigenous and renewable energyresources.
a. Significantly increase the amount of indigenous renewableenergy resources in the State’s energy mix, including solar,wind, hydroelectricity expansions, waste methane, geothermal,and sustainable biomass.
b. Maximize the development and use of cost-effective combinedheat and power and other forms of clean, efficient distributedgeneration, by providing technical and financial assistance toqualifying projects; developing performance-based emissionand certification standards for new distributed generation thatencourages technological improvements and reduced emissions;and eliminating disincentives for distributed generation.
1-36
c. Adopt a specific plan to develop an indigenous bio-fuelsindustry in New York to produce, refine, and markettransportation and other fuels from indigenous biomassresources.
6. Develop a program that allows businesses to enter into voluntaryagreements to meet certain energy efficiency targets and reducegreenhouse gas emissions. To assist businesses in meeting suchvoluntary agreements, the State should offer technical assistance, publicrecognition, expedited regulatory permit review, and financialincentives, as appropriate or necessary.
7. Redirect transportation funding toward energy-efficient transportationalternatives, including public transportation, walking, and bicycling, andprovide incentives to encourage greater use of related alternatives thatimprove transportation efficiency.
8. Include in the State Environmental Quality Review Act (SEQRA)analysis and State transportation planning processes, consideration ofCO2 production and mitigation strategies, as appropriate.
9. Target open space funding to prevent suburban sprawl, promoteQuality Communities, reduce vehicle miles traveled, and support,adopt, and enhance transportation measures that reduce energy use andpollutant emissions.
10. Support, adopt, and enhance transportation measures that reduceenergy use and pollutant emissions, such as Commuter Choice, OzoneAction Days, diesel vehicle retrofits, improved traffic signalcoordination with light emitting diode (LED) replacement technology,transportation system management, and other similar actions.
11. Encourage low-cost, passive building efficiency measures, such aswhite roofs, passive solar design, and improved foundation membranes,and incorporate such measures in the State’s building constructioncodes. In addition, the State should support local building anddevelopment projects that include funding for open space conservationand urban forestry and that reduce the need for air-conditioning inurban “heat islands.”
1-37
12. Expand research, development, and demonstration (RD&D) of energyand GHG-efficient vehicle technologies, add GHG goals to vehicle taxcredits and incentives, and coordinate with other states to encourageimprovements in vehicle fuel economy.
13. Working with regional and local planning organizations, analyze andquantify the energy use and air pollution emissions expected to resultfrom transportation plans and programs.
14. Support the design and construction of energy-efficient andenvironmentally-friendly “green buildings” through financial incentives,technical assistance, and related program initiatives.
15. Implement the Governor’s Acid Deposition Reduction Initiative, whichis expected to significantly reduce GHG emissions and the acid rainprecursors SO2 and NOX.
5. Ensuring fairness, equity, and consumer protections in an increasinglycompetitive market economy.
A. The State should examine the feasibility of effectively aligning public policyinterests in energy efficiency, combined heat and power, and indigenous andrenewable-based electricity generation, with the financial interests of utilityshareholders and ratepayers.
B. The State should expedite efforts to have electricity transmission, distribution,and customer service prices to consumers reflect the true cost of service andeliminate inter-class and intra-class subsidies, to the extent practicable.
C. The State should review forthcoming recommendations from the Department ofEnvironmental Conservation’s Environmental Justice Advisory Group andimplement appropriate recommendations in a timely manner.
D. The State should consider the effectiveness, efficiency, and coordination of itslow-income energy assistance programs, including the New York Energy$martKK program, the Weatherization Assistance Program (WAP), the Low-Income Home Energy Assistance Program (LIHEAP), and other Stateprograms that offer incentives, assistance, or information services to improvethe efficiency of energy use and reduce the energy burden of low-incomehouseholds. The State should consider consolidating programs whereopportunities exist to improve administrative efficiency and customer service.
Section 2
ISSUE REPORTS
Section 2.1 Promoting Energy Industry Competition
Section 2.2 Energy and Economic Development
Section 2.3 Energy and the Environment
Section 2.4 Energy and Transportation
Section 2.5 Preserving Energy-Related Public BenefitsPrograms
2-1
SECTION 2.1
PROMOTING ENERGY INDUSTRY COMPETITION
INTRODUCTION
The pursuit of effective competition, wherever practicable, in the provision of natural gasand electricity services is the policy of the State of New York. Such competition has thepotential to reduce energy costs over the long term, increase customer choices andsatisfaction, provide economic development advantages, enhance system reliability,promote technological changes and improvements, and improve environmental quality. The 1994 State Energy Plan introduced the potential for energy competition in New YorkState, and the 1998 State Energy Plan identified New York’s vision and the State’sactions and plans for achieving that vision. This 2002 Draft State Energy Plan (DraftEnergy Plan) reflects on the achievements made to date in opening energy markets togreater competition and considers whether any changes should be made in the State’svision for the future.
In the wake of recent developments in energy markets, particularly in the western regionof the country, many people question whether customers are better off today than theywere under full regulation of utility services. To answer that question, several key areasshould be considered: price, reliability, economic development, adequacy of supply anddelivery capability, and environmental impact. Each of these were discussed in the 1998Energy Plan and findings were made. This section of the Draft Energy Plan will discussthose areas, relating the 1998 Findings to current conditions, and then will present anddiscuss several specific issues that are currently facing New Yorkers. The Electricity andNatural Gas Resource Assessments, found elsewhere in this Draft Energy Plan, provide amore detailed review of the state of the competitive markets, as well as the state of theinfrastructures available to support those markets.
STATUS OF COMPETITION
Price
The 1998 State Energy Plan noted that the natural gas and electric industries were intransition to retail competition. Prior to reaching the end-state, however, the 1998 StateEnergy Plan concluded that customers would still be able to experience reduced pricesbecause of multi-year rate plans that had been authorized by the New York State PublicService Commission (PSC) and because customers would now begin to have the ability
2-2
to choose suppliers. In particular, the 1998 State Energy Plan projected that electric ratescould be expected to decrease statewide by an average of 9.7% through 2002 eventhough modest increases in the prices of fuels used to generate electricity could beexpected. The 1998 State Energy Plan also found that restructuring the gas and electricindustries would provide consumers with competitive energy prices and services,stimulate economic growth, and improve the job market.
From 1998 until recently, the State has experienced significant economic growth, jobmarkets have improved, and energy delivery rates have declined, as anticipated. Inaddition, those customers that have opted to seek competitive suppliers have been able toreceive lower commodity prices than they might have received through their utilitycompany as full service customers. Wholesale commodity prices for both natural gasand electricity, however, increased significantly in 2000 due to factors mainly unrelatedto industry restructuring, which in turn has had significant impacts on the overall pricesthat customers pay for their utility services. Of these factors, the most significant was thesharp increase in the wholesale price of natural gas from the second quarter of 2000 tothe second quarter of 2001 (see the Natural Gas Assessment for a discussion of thisincrease).
In recent months, wholesale natural gas prices have receded toward the level prior to thedramatic run-up in 2000. Electricity prices have also fallen back to earlier levels. In thelong-term, wholesale natural gas prices (which are beyond the State’s control), areforecast to decline in real terms through 2010 and then increase slowly until the end ofthe planning period, but they are not projected to exceed the real price experienced in2000. Retail natural gas prices are forecast to follow a similar trend, as discussed in theNatural Gas Resource Assessment. With regard to electricity prices, the ElectricityResource Assessment presented in this Draft Energy Plan projects that retail prices willlikely decline in real terms throughout the planning period because of the use of moreefficient generation and increased use of demand reduction programs. Reliability
The 1998 State Energy Plan found that electric system reliability can be maintained orenhanced in a competitive market. Indeed, since the transition to wholesale electriccompetition began, the State has continually met or exceeded all of the reliability criteriaestablished by both the Northeast Power Coordinating Council and by the New YorkState Reliability Council. While bulk electric resources have been strained at time, thecriteria have not been violated. As new generation and demand reduction resourcesbecome available over the next few years, bulk electric system reliability should continue
2-3
to improve. With regard to electric distribution system resources, reliability has alsogenerally remained stable, although pressures have increased for utility managers tominimize costs.
Economic Development
The 1998 State Energy Plan held that using some of the benefits of restructuring theelectric and natural gas utility industries to maximize economic development is soundpolicy for New York. Industrial and large commercial customers have taken advantageof the opportunities available to them to choose their energy suppliers through thecompetitive markets, and they have also benefitted from reduced delivery charges thatbecame available through the regulatory process. Innovative programs, such as the newdemand response and load bidding programs recently established by the utilities and theNew York Independent System Operator (NYISO), are also important opportunities thatcan help these classes of customers manage their utility budgets effectively. As newelectricity generation and additional gas transportation capability become available, thebenefits of competition will expand and so will the potential for greater economicdevelopment.
Adequacy of Supply and Delivery
The 1998 State Energy Plan held that energy supplies should continue to be adequatethroughout the planning period, but new facilities would be needed. It predicted that newelectricity resources would be needed sometime within the 2001 and 2005 time frame. Recent events have shown that the 1998 prediction was accurate, although the need forthe new resources arrived somewhat earlier in the period than was projected due toeconomic and load growth at the upper bound of the range that had been forecast. Fortunately, the State’s policies put in place to facilitate competition in New York haveset the stage for new baseload generation to be built and operational in the near futureand for demand reduction programs to be developed. Prior to the summer of 2001, theNew York Power Authority (NYPA) “Power Now!” projects installed 450 megawatts(MW) of new gas turbines in the New York City area, and public and private sectorutilities and the NYISO developed and initiated demand reduction programs that enabledthe State to maintain a reliable electric system as the new baseload generation and furthergrowth in demand reduction programs are pursued. The Electricity ResourceAssessment, presented later in this Draft Energy Plan, provides a more in-depthassessment of the electricity infrastructure and shows that electric system reliability canbe maintained as competitive markets develop.
1 Three other applications have been filed, but they have not yet been deemed complete. In addition, nine otherproposals are in various stages of the “pre-application” process for Article X.
2-4
With regard to the siting of major electric facilities under Article X of New York’s PublicService Law (PSL), the 1998 State Energy Plan held that certification may be premisedon a determination that the proposed facilities would promote or contribute to acompetitive market for wholesale or retail electricity. Eleven complete applications formajor electric facilities under Article X have been filed1 based on the stateddetermination that they will promote or contribute to a competitive market, and fiveprojects so far have been approved as contributing to competitive markets. The processfor review of all these projects has addressed the same environmental issues that wouldbe addressed in a fully regulated electric utility environment. With regard to natural gas,additional delivery system facilities are needed, and several are pending before theFederal Energy Regulatory Commission (FERC) or have recently been authorized. Anin-depth study is now underway to assess the interrelationships between natural gas andelectricity, as well as the interrelationship with petroleum products. Preliminary findingsof that study support the need for new natural gas pipeline facilities.
Environmental Impacts
The 1998 State Energy Plan maintained that increased competition in the energy marketswould not have an undue adverse impact on the environment, as compared withtraditional industry regulation, because environmental oversight would continue andmitigation measures would be implemented as necessary. Most of the Article Xapplications filed to date are for efficient, gas-fired combined cycle generation units;several are simple cycle installations. All use state-of-the-art clean technology, andseveral will result in the repowering of existing, inefficient, and more pollutinggeneration. Models for these proposed power plants project reduction in air pollution inthe State by displacing older, more polluting, electricity generation, and the analysesperformed for the Electricity Resource Assessment in this Draft Energy Plan support thisfinding. Of equal importance to the addition of new supplies are the new programs thatare designed to reduce customer energy demand, increase the efficiency of generationtechnologies, and promote indigenous and renewable resource development.
All Article X applicants and non-Article X power project developers must apply forapplicable air and water quality permits from the New York State Department ofEnvironmental Conservation (DEC). The permits are based on compliance with allapplicable State and federal air and water quality regulations and requirements, includingPrevention of Significant Deterioration (PSD), New Source Review (NSR), and
2-5
Maximum Achievable Control Technology (MACT). Many Article X applicants haveproposed air-cooled condensers (dry cooling), which use very little water compared towet evaporative cooling or once-through cooling technologies. Additionally, dependingon site locations, other environmental mitigation measures have been imposed by theArticle X Siting Boards.
The events of the past four years continue to support the validity of the 1998 StateEnergy Plan findings. In all the key areas (price, reliability, economic development,adequacy, and environmental impact), the evidence shows that competition has beenbeneficial, but greater benefits can be achieved. The transition to competitive energymarkets is still underway, so the State must remain vigilant and flexible to resolve issuesas they arise.
COMPETITIVE ISSUES FOR THE FUTURE
The Electricity and other Resource Assessments presented in this Draft Energy Planprovide assessments of both the state of the energy infrastructures and the markets thatare supported by this infrastructure. The Assessments identify issues and barriers thatconfront the implementation of competitive markets and the strategies and efforts that arecurrently underway to address those issues and overcome the barriers. With thebackground provided by the Assessments, this section addresses in more detail a few ofthe critical issues affecting competition.
Policy Framework
The rigid, statutory-based approaches used for restructuring the utility industries in someother regions of the country have led to significant problems and have caused someadvocates of competition to reevaluate their positions. Consequently, some states haveretreated to “wait and see” positions, and some have even considered reversing course. In contrast, New York State’s approach to restructuring is designed to provide theflexibility needed so that adjustments can be made as lessons are learned, competitivebarriers are revealed, and progress is made.
For example, most stakeholders agree that a primary barrier today to achieving effectivewholesale competition in the energy industries is the lack of adequate resources wherethey are needed most. This translates to a need both for additional supply resources (bothcommodity and delivery resources) and demand-reduction techniques. The lack ofadequate natural gas delivery and storage infrastructure in some areas puts strains on themarket, which, in turn, leads to more volatile prices (a further discussion of the issues
2 The State supports development of a single, regional transmission organization (RTO), subject to certainprinciples described in the Electricity Resource assessment. Similarly, as discussed later in this issue paper,the State supports federal legislation to remove some of the current barriers to effective competition in theutility industries.
2-6
surrounding the State’s growing reliance on natural gas is presented later in this section). For electricity, additions to the delivery system and/or added generation and reduceddemand in certain areas of the State are needed today. In response, the State hasadvocated increasing gas and electric transmission into constrained areas, and it has takensteps to install small gas-powered peaking facilities in New York City and on LongIsland.
The Electricity Resource Assessment and the Natural Gas Resource Assessment in thisDraft Energy Plan each describe the state of competition for their sectors and discuss theremaining impediments to fully competitive markets and, thus, competitive prices andmore choices for customers. The Assessments then identify the many initiatives andactions that have been taken and are in progress. As these initiatives and actions unfold,the impediments identified are being addressed and the State will endeavor to make anymodifications that might be necessary for those issues that fall under its purview.
As described in the Assessments, the regulation of wholesale electricity and natural gas isprimarily under the jurisdiction of the FERC. Consequently, the State has little directcontrol over the wholesale price of energy, but does take an active advocacy role insupport of maintaining system reliability and truly competitive markets. Over the nextseveral years, developments will continue to unfold in wholesale markets, the NYISOwill continue to improve its operations, the FERC will continue its deliberations onregional transmission operations, and the U.S. Congress will continue to consider nation-wide industry restructuring legislation. New York will monitor these activities andprovide input where necessary to ensure that the State’s interests are protected, especiallywith regard to energy systems security and reliability, and the ability of consumers toseek the lowest possible commodity prices.2
Power Plant Siting
PSL Article X authorizes the Siting Board to issue a Certificate of EnvironmentalCompatibility and Public Need prior to construction and operation of an electricgenerating facility with a capacity of 80 MW or more. Article X, enacted July 24, 1992,
3 Before enactment of Article X, PSL Article VIII established requirements relating to siting of major steamelectric generating facilities. Article VIII was first enacted as Chapter 385 of the Laws of 1972; it expiredin 1978. Article VIII was then reenacted as Chapter 708 of the Laws of 1978; it expired in 1988. Aninterruption in the PSL certification process occurred from January 1, 1989 to January 20, 1993. The StateEnvironmental Quality Review Act applied to developers of major generating facilities during theinterruption.
2-7
expires on January 1, 2003. It remains operative and effective with regard to applicationsfiled on or before December 31, 2002.3
Article X provides for a pre-application process to allow early public involvement and toattempt to obtain agreement of the affected agencies and others on the scope of studiesand analyses necessary to complete an application. Intervenor funding up to $300,000 isavailable to municipal and local parties to fund expert witnesses and consultants once anapplication is filed. The Siting Board is required to render a final decision within twelvemonths of notice of a complete application, or within six months for facilities thatinvolve replacement or repowering of existing facilities and reduce water use and certainair pollutants. The Siting Board is required to make specific findings in its decisions onapplications. It is authorized to refuse to apply any local law upon certain findings (PSL§ 168 (2) (d)).
While the effective date of Article X was in 1992, the statute and process has beenmodified and streamlined in several ways. In 1999, the State enacted amendments toArticle X that authorize DEC to issue air and water permits for proposed facilities. Theamendments were necessary to ensure continued federal delegation for air and waterpermits. The New York State Department of Public Service (DPS) and DEC are workingtogether cooperatively to coordinate their respective responsibilities in the Article Xprocess. The 1999 amendments also increased intervenor funding and strengthened theagencies’ mandate to have applicants implement appropriate public involvementprograms and to increase public awareness and involvement in the process. In 2001,Article X was further amended to provide a shortened certification period for certainprojects at existing generation sites, provided that emissions into the air will be reducedby 75% and water usage will be reduced dramatically.
The State agencies administering Article X and the air and water permitting have alsoundertaken measures to streamline the process and to provide opportunities forparticipation. Intervenor funding is initiated soon after an application is filed, and theDPS web site was expanded to provide ready access to case documents, status reportsand an easily understood guide to Article X. The agencies have conducted workshops toexplain the process and filing requirements to applicants and conducted forums to
4 The five certified facilities are: the 1080 MW Athens Generating Project; the 800 MW Heritage Project;the 360 MW East River Repowering Project (196 MW net increase); the 250 MW RavenswoodCogeneration Project; and the 1000 MW Astoria Project.
2-8
explain the Article X process to the public. The agencies also conduct one-on-onemeetings with potential applicants and public interest groups to disseminate Article Xmaterial. These measures, consequently, helped the Article X certification processmature into a smoother and more expeditious process, while enhancing publicparticipation, without sacrificing its fair and comprehensive intent.
The 1080 MW Athens Generating Plant, now under construction in Greene County, wasthe first generating facility certified under Article X. It received certification on June 15,2000. As of December 1, 2001, 14 applications had been submitted, and Article X SitingBoards had certified five combined cycle, gas-fired, electric generating facilities that willadd over 3,300 MW.4 Nine other proposals were in the Preliminary Scoping Statementor Pre-application stages.
Written and oral comments were received about the effectiveness of Article X inresponse to the State Energy Planning Board’s (Planning Board) request for comments onthe scope of this Draft Energy Plan. In general, the comments call for extending ArticleX for five years. Recommendations for improving Article X included proposals for:
• Streamlining Article X procedures, including conducting more expeditiousproceedings;
• Giving priority to brownfield and repowering facilities;
• Exempting mini power plants (a single turbine or pairs of turbines with anameplate rating of over 80 MW but an actual output to the electric system ofunder 80 MW);
• Providing more and earlier public involvement;
• Requiring cumulative power plant and neighborhood impact (environmentaljustice) analyses;
• Evaluating health issues associated with fine particulates (PM 2.5) and non-ammonia technologies;
• Coordinating reviews by State and federal agencies;
5 The Appellate Division, Second Department, has upheld the Siting Board Chairman’s definition of majorelectric power plants. Several parties have moved for leave to appeal to the Court of Appeals on this issue.
2-9
• Locating generating facilities closer to the loads they are intended to serve; and
• Ensuring reliability of supply.
Since the filing of public comments, several important events advanced the interestsnoted in the comments. Also, Article X was amended in 2001 (Chapter 222 of the Lawsof 2001) to require Siting Board action within six months for applications that replace orrepower existing generating facilities and result in decreased water use and decreasedemissions of certain air pollutants. The Article X amendments, in effect, prioritizeapplications for replacing or repowering facilities that meet certain air standards. Consideration, however, might now be given to developing specific procedures for suchfacilities and also to requiring expedited proceedings for facilities that meet other publicpolicy goals.
The manufacturers of gas turbines often produce standard size turbines. The turbinesmay have a name-plate rated capacity of more than 80 MW. Owners and operators whomake a legally binding commitment to operate the plants with a total output of less than80 MW are not subject to Article X review.5 Nonetheless, power plants that are notsubject to Article X are required to comply with the State Environmental Quality ReviewAct, Environmental Conservation Law air and water permit provisions, and PublicService Law § 68 certification provisions.
Some commentors propose streamlining Article X to shorten the process. In addition,citizen and environmental groups and local governments request more meaningful publicparticipation. These two objectives might be addressed through evaluation of theeffectiveness of the current statutory language for intervenor funding andcontinuation/expansion of State agencies’ pre-application information programs andtraining workshops for prospective applicants and others interested in the process. Inaddition, the Article X procedural requirements might be modified to enable SitingBoards to streamline reviews where interested parties, including affected communitygroups, reach consensus on specific issues presented by an Article X application.
In addition, when warranted, several applicants have included comparative studiesinvolving proposed facilities in specific cases. Because each Article X application isreviewed by its own separately-constituted Siting Board, which results in Article X
6 Two ad hoc members, one a resident of the judicial district and one a resident of the county where thefacility is proposed to be located, are appointed to each Board. 7 The New York State Department of State has been delegated responsibility for coastal zone management,and the Office of Parks, Recreation, and Historic Places has been delegated certain responsibilities withregard to national historic places and parks.
2-10
applicants having different Siting Boards,6 some commentors suggested that it may bedesirable to change the Article X statute to allow Siting Boards to share information, tomake comparative analyses of competing applications, and to prioritize or select amongthe proposed facilities. For example, if competing proposals are under consideration inseparate proceedings and only one of the proposed facilities can reasonably be built andoperated, the Siting Boards could select the one that best meets the public interest,including environmental and electrical system impacts and customer benefits. Currently,however, Article X sets forth a process and schedule for each case individually that mightlimit such comparative analyses.
Several parties have raised issues relating to studies of the health issues associated withfine particulates (PM 2.5). The Appellate Division, Second Department held that theNYPA’s analysis of potential adverse environmental impacts of certain small gas turbinepower projects under the State Environmental Quality Review Act (SEQRA) was notsufficiently detailed as to PM 2.5 emissions. The court remanded the matter to NYPAwith a requirement that NYPA prepare an environmental impact statement on the issue. NYPA moved for leave to appeal to the New York State Court of Appeals, which motionwas denied. Article X applicants typically include a PM 2.5 analysis. Rulemakings toregulate PM 2.5 by the United States Environmental Protection Agency (U.S. EPA) andDEC will provide further guidance for future Siting Boards.
In addition to Article X certification, construction of proposed generating facilities issubject to other federal and State requirements. Some groups call for more coordinationbetween the Article X review process and the investigations conducted by other State andfederal agencies. Applicants could improve coordination by filing applications earlierwith the other State and federal agencies and providing regular reports to the SitingBoard on the other regulatory review processes. In addition, the State could consideramending Article X to designate as statutory parties other State organizations withresponsibilities relating to siting electricity generating facilities.7 Statutory parties arerequired to submit expert testimony if they determine that a proposed facility impacts aresource under their jurisdiction.
It is expected that economic incentives in the marketplace will in most cases attract newgeneration facilities to locate where they will be most beneficial. Consideration might
2-11
also be given, however, for providing Article X certificates that include conditions andrequirements to promote improved energy system reliability and ensure that peakelectricity demand requirements are met.
Natural Gas and Electricity Interrelationships
Natural gas is the fuel of choice for new power generation projects (see ElectricityResource Assessment). Plans to build about 15,000 MW of new gas-fired generationcapacity have been announced, with about 70% of these to be located in an areaextending from Orange and Rockland counties through Long Island. These proposedplants will require very large quantities of natural gas. For example, if electric systemdemand and capability were to expand greatly and all of the proposed plants were builtand operated at full capacity, they would require about 2,500 thousand dekatherms ofnatural gas per day (MDT/D). To deliver that amount of gas would require about a 40%increase in current delivery capacity to New York State. The natural gas deliverycapacity that exists today, however, was built to serve the winter peak needs of core(residential, commercial, and industrial) customers. In essence, it is now operating atmaximum capacity during peak periods. It is not clear which and how many of theseplants actually will be built or when they will be built. Furthermore, for the plants thatare built, it is not clear whether they will operate year-round or perhaps just on a seasonalbasis. In addition, the sponsors of some of these proposed plants are seeking permits toburn oil as an alternate fuel and have proposed to install oil storage facilities. Otherproposed generators would be natural gas-only plants. These new plants will competeagainst other generators and may well displace natural gas now used in older, lessefficient power plants.
Some project sponsors have signed agreements for capacity on proposed pipelineprojects, at least to meet some of their requirements. However, others have not and orplan to rely on wholesale marketers to provide them with natural gas. Some wholesalemarketers have contracted for capacity on proposed new pipeline expansion projects, butthat capacity would not necessarily be dedicated to particular power plants.
A study has been initiated by the New York State Energy Research and DevelopmentAuthority (NYSERDA) and the NYISO to better understand power generation naturalgas requirements. The study will evaluate power dispatch scenarios with additionallevels of generation and fuel supply assumptions. It will also assess power generationsector use of petroleum and thus provide information on fuel diversity and the marketinfrastructure in this sector. In addition, the study will assess the adequacy of natural gasdelivery capacity in light of these requirements and explore contingency issues associated
8 This situation can have adverse consequences for gas system reliability if the generators refuse todiscontinue use of natural gas; can have adverse consequences for the petroleum market if many suchgenerators enter the market to purchase supplies at the same time (i.e., if they don’t have adequatepetroleum reserves in dedicated storage); or can have adverse consequences on the electric system if thegenerator operators choose to reduce output or shut down.
2-12
with increased interdependence between gas and electricity. Final results from the studyare expected by early summer 2002.
One particular contingency situation bears careful study. Electric generator gascustomers that rely on interruptible natural gas may choose, when natural gas is curtailed,to enter the petroleum market for fuel oil or shut down operations entirely.8 The studywill evaluate these circumstances so that appropriate measures can be considered by theState. In the interim, State agencies and authorities should encourage the NYISO toconsider the certainty and availability of primary and back-up fuels as factors in thevaluation of capacity from electric generators to ensure that the reliability of the electric,natural gas, and petroleum supply and delivery infrastructures are not adversely affectedwhen generator fuel supplies are disrupted.
During the initial phase of the study, simulation modeling of the electricity system wasused to quantify the potential demand for gas to generate electricity between the year2002 and the year 2005 under various scenarios. This change is measured between whatthe existing generating system would use in the year 2002 and how much gas would beused under several cases for new capacity additions. In the base case, new generationcapacity additions are assumed to be limited to approved projects, plus 50% of thecapacity of those projects with completed Article X applications, and a generic 600 MWof capacity to represent likely additions on Long Island. In another case, new generationcapacity additions are assumed to include all Article X projects that had been approvedor had complete applications at the time of the study. These cases provide an indicationof the amount of gas required for electricity generation assuming no restrictions on gasavailability. Two other cases were also examined: a case in which it was assumed that nonew plants would be built; and a case in which gas availability was restricted (achievedby setting gas prices higher than oil prices). All cases were examined for both a summerand a winter peak day.
On a Summer peak day in the study, gas demand increases by 546 MDT/D in the basecase between 2002 and 2005. When nearly 3,860 MW more generation capacity isassumed (the more-plants case), however, the increase in gas is actually less than thebase case (331 MDT/D). This is because these new, efficient plants displace older, lessefficient gas plants and can use the gas that the older plants would otherwise have used.
2-13
In the case where no new plants are added, the increase in gas use is much less at 153MDT/D, and when gas availability is restricted, gas use is nearly identical to the basecase.
On a winter peak day in the study, gas demand increases by 413 MDT/D in the base case,increases by 585 MDT/D when more generation is added, and is nearly identical to thebase case when gas availability is restricted. When no new generation facilities areadded, gas demand decreases by 6 MDT/D.
Once the final report is issued, the New York State Energy Planning Board will be betterpositioned to address this important issue. From the information presented in theElectricity and Natural Gas Assessments, however, it seems clear at this time that theState is moving toward greater dependency on natural gas and additional emphasis mustbe given to the development and deployment of alternatives to the use of natural gas andpetroleum (e.g., demand reduction, renewable energy resources, energy efficiencyimprovements, clean coal technology).
Federal Competitive Agenda
There are several actions that the U.S. Congress can take to assist New York State in itsenergy industry restructuring efforts. These include: repeal of the mandatory purchase ofpower from qualified generating facilities by utilities under the Public Utility RegulatoryPolicy Act (PURPA); reform of the Public Utility Holding Company Act (PUHCA),which would allow utilities to diversify their operations in ways that could enhancecompetition; and establishment of national mandatory reliability rules for the bulk powersystem (while allowing states to continue to set more rigorous standards when it is in thepublic interest).
FINDINGS AND CONCLUSIONS
• The findings of the 1998 State Energy Plan related to the introduction ofcompetition in the electricity and natural gas industries remain valid today.
• The State must remain vigilant and flexible, and it must resolve issues as theyarise, in order for the competitive energy markets in New York State to reachtheir true potential and for New Yorkers to realize the full benefits ofrestructuring.
• The State’s administrative approach to restructuring its energy industries waspremised on input from stakeholders and experts, and designed to provide
2-14
flexibility to make adjustments, as necessary, as competitive barriers wererevealed and competitive markets developed. This approached has served NewYork State well.
• The primary barrier to achieving effective wholesale competition in the energyindustries is the lack of adequate resources (energy commodity, deliveryinfrastructure, and demand reduction techniques) where they are needed.
• The Article X Power Plant Siting Process in New York State has benefitted theState and provided protection for its environment.
• The natural gas delivery system, built to serve the winter peak needs ofresidential, commercial, and industrial customers, is now fully used during peakperiods. The competitive electricity generation market is moving toward agreater dependency on natural gas. Such a greater dependency on natural gassuggests a need to expand the natural gas infrastructure; use resources that willreduce our dependency on natural gas, such as greater use of renewable energyresources; implement further electricity demand reduction techniques; continuesafe operation of nuclear power plants; and apply clean coal technologies, whereviable.
• The U.S. Congress can assist New York by repealing the mandatory purchase ofpower from qualified generating facilities required of utilities under the PURPA,by reforming the PUHCA to allow utilities to diversify their operations in waysthat could enhance competition, and by establishing national mandatory reliabilityrules for the bulk power system (while allowing states to continue to set morerigorous standards when it is in the public interest).
2-15
SECTION 2.2
ENERGY AND ECONOMIC DEVELOPMENT
INTRODUCTION
Policies that promote a secure, competitive, and reasonably priced energy supply willhelp attract, retain, and expand businesses in New York State. These include policiesthat support the reduction of energy costs to consumers, the reliability of the State’senergy supply and infrastructure, and the development of energy-related industries inNew York. In addition, promotion of cost-effective energy efficiency technologies,indigenous and renewable energy resources, and alternative-fueled vehicles stimulates in-State job creation, particularly when these technologies or their components aremanufactured in New York.
A secure and reliable energy supply will provide businesses with the confidencenecessary to invest in New York State. The increase in business profitability andconsumer purchasing power that results from lower energy costs will further stimulatebusiness investment, consumer spending, and employment growth within the State.
ENERGY SUPPLY
With the growth in electricity demand that has occurred over the last five years, adequateand reliable energy supplies are critical to the State’s continuing economic prosperity. New York State has added 802,000 private sector jobs since 1995, leading all otherNorthern industrialized states in the rate of job creation. From 1999 to 2000, the Stateranked tenth among all states for private sector job growth. The continuation of thiseconomic growth will depend, in part, on the State securing additional electricitygenerating capacity, energy resources, and infrastructure.
The State has taken a number of actions to ensure that electricity supply is adequate tomeet demand. In the near-term, the New York Independent System Operator (NYISO)has implemented the Emergency Demand Response and Day-Ahead Demand Biddingprograms, the New York Power Authority (NYPA) has installed new generators in themetropolitan New York City area, and the New York State Energy Research andDevelopment Authority (NYSERDA) and utilities have implemented new programs toassist businesses in reducing demand and becoming more energy-efficient. In the long-term, the siting of new base load plants will help ensure reliability and support more stable
1 Area Development, Sites and Facility Planning, "Corporate Survey," December, 1997.
2 Glen Weisbrod (Hagler Bailly Consulting, Inc.) and Howard Friedman (DynCorp), Economic Competitiveness
Impacts of Utility Rates and Programs, April 1, 1996, p.8.
2-16
pricing. In addition to new generation resources, the State is promoting greaterinvestment in energy efficiency, indigenous and renewable resources, and distributedgeneration.
ROLE OF ENERGY PRICES IN BUSINESS LOCATION AND EXPANSION Geographic variation in energy prices gives businesses some degree of control over theprices they pay, but only to the extent that they are able to easily relocate. As a result,energy prices tend to be important factors in business location and expansion decisions,particularly for energy-intensive businesses. Other considerations of varying importance,depending on the type of business, include availability and reliability of energy supply,taxes, availability of raw materials and other process inputs, access to capital, proximity totransportation systems and markets, availability of a skilled workforce, labor costs,government regulation, and environmental policies.
In a national survey of businesses that primarily included manufacturers, 81% ofrespondents considered energy cost and availability to be either an important or veryimportant site-selection factor.1 Given the relative cost of energy in New York,manufacturers in the State regard energy costs as being even more significant than isindicated by the national survey. For most businesses in New York, the cost of energyrepresents less than 5% of total product cost; however, energy prices can have asubstantial impact on profits. In many industries, profit margins are extremely thin,representing less than 5% of gross sales.2 An energy cost reduction, therefore, can have asubstantial effect on a business’s profitability. Moreover, facilities in New York competewith other companies within the State and with facilities within the same company locatedin states with lower operating costs. In some cases, same-company facilities compete foradditional capacity and jobs; in other cases, they compete to remain in operation. Corporations routinely favor locations that have the greatest profit potential. Lessprofitable facilities will, at best, not be expanded. At worst, they will be closed, with aresultant loss of jobs.
2-17
ECONOMIC DEVELOPMENT PROGRAMS
To overcome relatively higher energy costs, various programs, policies, and initiativeshave been developed to attract and retain businesses in the State. Both of the State’spublic power authorities, the Long Island Power Authority (LIPA) and NYPA, haveeconomic development programs to attract and retain businesses in New York. NYPAalso administers the Power for Jobs program. NYSERDA offers a variety of programs toencourage business growth, and the State’s investor-owned utilities offer flexible rates andfixed discount programs to businesses that meet strict eligibility criteria.
New York Power Authority
NYPA provides low-cost electricity to businesses through programs designed to promoteeconomic development. In 2001, NYPA provided more than 1,500 megawatts (MW) to990 employers, ranging from heavy manufacturing and financial services to health carefacilities and cultural institutions. NYPA’s low-cost power supports more than 450,000jobs Statewide. It operates two major hydroelectric power projects (Niagara and St.Lawrence-FDR), a pumped storage hydro power project (Blenheim-Gilboa), five smallhydroelctric plants, two fossil fuel power projects (Poletti and Flynn) and 11 small naturalgas-fired turbines. In 2000, these facilities generated 22,710,360 megawatthours (MWh)of electricity. That figure does not include the electricity produced by the FitzPatrick andIndian Point 3 nuclear facilities, which were sold to Entergy in November 2000. Theoutput of the nuclear facilities is purchased by NYPA under a long-term agreement. Besides providing electricity, NYPA provides energy efficiency assistance and othercustomized services to assist its customers and other public entities to lower energy costs.
NYPA’s programs to assist economic growth include two programs using low-cost hydropower from its Niagara Power Project. The Expansion Power program provides 250 MWearmarked under State law for job creation and retention in New York's three westernmostcounties. The Replacement Power program provides 445 MW designated by federal lawfor industries located in the Niagara Mohawk service territory within 30 miles of theNiagara Power Project. Under both programs, the contracts for the power allocationsinclude customer commitments to sustain agreed-upon levels of employment.
NYPA's sales of low-cost power to the State's 51 municipal electric systems and ruralcooperatives also benefit many businesses located within these service areas. TheEconomic Development Power (EDP) program provides for job creation and businessrevitalization throughout the State. Electricity for this program is supplied by theFitzPatrick Purchased Power and Energy Agreement with Entergy. To receive EDP,
2-18
companies must commit to maintain a specific level of jobs and, in the case of businessretention, invest in real property improvements. The State EDP Allocation Board, createdby the State Legislature, evaluates applications and makes recommendations to NYPA’strustees. New York's businesses also benefit from NYPA's Municipal DistributionAgency (MDA) power, another designated portion of the FitzPatrick nuclear power that issold to downstate local municipal distribution agencies.
The Power for Jobs program was signed into law in July 1997. This program provides low-cost electricity to assist New York State employers at risk of reducing or closing theiroperations or moving out of State, or who were willing to expand job opportunities in theState. The program authorizes NYPA to allocate 450 additional MW of low-costelectricity to New York businesses that commit to preserve or create jobs, with up to 100MW set aside for small businesses and not-for-profit corporations. Applications arerecommended by the EDP Allocation Board to the NYPA trustees. One-half the electricityprovided under the Power for Jobs program is produced at the FitzPatrick Nuclear PowerPlant and the remainder is purchased by NYPA under a competitive procurement process. Allocation of the power available under the first three phases of the program wascompleted by March 28, 2000. In 2000, NYPA was authorized to provide a fourth phase ofthe Power for Jobs program, making 300 MW available beginning January 1, 2001.Allocation of power available under Phase Four of the program was completed by July 1,2001.
In October 2001, legislation was signed into law containing an array of measures toaddress New York State’s economic recovery in the wake of the events of September 11,2001. Among the provisions of the legislation was authorization for NYPA to sell up to80 MW to assist in the economic recovery of New York City. NYPA had previouslyprovided 80 MW of electricity to the Port Authority of New York and New Jersey for theWorld Trade Center. The New York City Economic Recovery Power program willprovide low-cost electricity to former tenants of the World Trade Center and otherbusinesses located in, or intending to locate in, the Liberty Zone and Resurgence Zone, asdesignated by the legislation.
New York State Energy Research and Development Authority
NYSERDA is a public benefit corporation created by the State Legislature in 1975. Itprovides technical and financial assistance for the development and deployment ofinnovative technologies that improve energy efficiency and reduce energy-relatedenvironmental impacts for businesses, municipalities, and residents.
2-19
In January 1998, the New York State Public Service Commission (PSC) designatedNYSERDA the administrator of the public benefits program. This program, known asNew York Energy $martK, supports activities that are not expected to be adequatelycarried out during the transition to a more competitive electricity market. Activitiessupported by the public benefits program include energy efficiency deployment, low-income assistance programs, research and development, and environmental monitoringand protection. A total of $174 million was made available to NYSERDA to develop andimplement a variety of programs for the initial three-year period from July 1, 1998 to June30, 2001. In January 2001, the PSC extended and increased the amount of public benefitsprogram funding to approximately $150 million per year through June 2006. Theextended programs continue to address market barriers, but will also expand peak loadreduction and price-sensitive load initiatives, including non-electric energy efficiencymeasures to promote fuel-switching, and expand the Statewide coverage of the programs.
NYSERDA’s research, development, and demonstration (RD&D) program focuses ondeveloping high-value-added energy and environmental products, addressing energy-related environmental concerns when there is insufficient private-sector incentive to do so,assisting customers, and providing objective technical analysis. The program has fivemain areas: Industry, Buildings, Energy Resources, Environment, and Transportation andPower Systems. Funding for this program reaches about $16.5 million per year and fundsapproximately 150 projects each year with businesses, municipalities, institutions, anduniversities. Since 1991, NYSERDA’s RD&D program has stimulated new product salesof $200 million for New York companies, created 1,174 permanent jobs, developed 141new products, processes, or services for commercial use, and leveraged nearly $2 offunding from outside sources for every dollar invested by NYSERDA.
NYSERDA’s energy efficiency deployment program complements its RD&D program byaiding in the commercialization of new technologies and encouraging their use. Theprogram targets five areas: small business, institutions and government, residential, low-income, and vehicle fleets. It focuses on stimulating markets and promoting competitionfor energy-efficient and environmentally clean products, removing barriers to marketadoption of proven technologies and practices, and building manufacturing and salesinfrastructure to make energy-efficiency products available to customers. Value-addedservices and technical economic assistance are provided to help small customers staycompetitive. Since 1991, NYSERDA's programs have saved $277 million in energy andother costs for New York's businesses, municipalities, and institutions.
NYSERDA’s newly created Economic Development Program strives to improve theState’s business climate through strategic partnerships and product development. The
2-20
Economic Development Program provides assistance to companies concerned with energyand environmental efficiency, innovative product development, and productcommercialization to help these companies create, enhance, and retain jobs. Using bothinternal and external sources of funding to enhance its efforts, NYSERDA works to forgestrategic partnerships with a variety of organizations (both public and private) to be ableto provide expertise in marketing, financing, and business development to its constituents. The types of assistance pursued by NYSERDA include federal and State grants, loans,bond financing, venture capital, and technical services.
In August 2001, NYSERDA announced the creation of the Saratoga Energy TechnologyPark, specifically devoted to promoting the development of new, clean energytechnologies. NYSERDA, working jointly with the University at Albany and the SaratogaEconomic Development Corporation (SEDC), hopes to attract between 1,000 and 1,500jobs to the Capital Region when emerging, environmentally-friendly energy companiestake advantage of the park’s resources.
NYSERDA is forging other partnerships with many public and private organizations towork on the following projects:
1. Promotion of NYSERDA's core programs to support the State’s revitalizationefforts in the Niagara Falls area has led to the investment of $4 million in variousenergy and environmental programs and projects.
2. Working to establish partnerships with local businesses, government, anddevelopers to build wind farms in Western New York. A 30-megawatt wind farmpower project is being developed in the Town of Fenner.
3. Examining the potential development of Power Quality Parks. Such parks, ifdeveloped, will feature industrial sites with reliable power sources to help attractnew businesses.
4. Working with the Rensselaer Polytechnic Institute (RPI) and its Venture B SeriesProgram to find venture capital for businesses. NYSERDA is also a member ofthe Tech Valley Angel Network (TVAN) as a partner in this program. NYSERDAserves as a link between entrepreneurs and investors in northeastern New York tofacilitate access to venture capital.
2-21
Department of Public Service
Staff of the Department of Public Service (DPS) assist businesses in learning abouteconomic development programs, resolving disputes between businesses and utilitiesabout economic development issues, working with State and local government inretaining, attracting and expanding businesses, and participating in the Power For Jobsprogram.
DPS staff have participated with parties in several recent utility restructuring, rate, andmerger proceedings to improve the utilities’ ability to assist in economic development. For example, as a result of the PSC’s decision in a recent Central Hudson Gas & ElectricCorporation case, a collaborative effort among the utility, DPS, Empire StateDevelopment, State and local governments, and other interested parties has been initiatedto design new, more effective economic development programs, including electricitydiscounts, suited to the needs of the utility’s customers.
The PSC’s electricity cost and pricing policies are changing to reflect the restructuring ofinvestor-owned utilities, the transition to competitive markets, and the need for moreservice unbundling. These policies are pointing in the long-term to separating the deliveryfunction from commodity sales. Such policies will be especially beneficial to businessesby reducing delivery costs of electricity, and facilitating the ability of businesses to shopfor electricity. During the transition to competitive markets, there is a continuing need tomaintain economic development incentives and discounts that will ensure that the Statewill have the ability to retain, expand, and attract businesses.
Utility Flexible Rates and Fixed Discount Programs
Since 1983, New York State’s electric and gas utilities have encouraged economic growthby filing tariffs with the PSC that provide discounted rates to qualified commercial andindustrial customers, including incentive rates for businesses that are certified as eligiblefor Economic Development Zone (Empire Zones) benefits pursuant to State law. Utilitieshave designed economic development programs to suit the needs of their particularregions by offering varying terms and levels of discounts from the standard tariff rates. Among other things, such programs include: Flexible Rates, designed to allowindividually negotiated contracts with customers who have competitive energyalternatives to standard utility service; Business Incentive Rates, designed to bring in new
3 NYS Department of Labor Employment Review, December 1996, p. 7.
2-22
businesses or expand existing commercial or industrial load in a utility’s service territory; Economic Revitalization rate programs, designed to retain customers by helping themregain economic competitiveness; and Economic Development (Empire Zone) Rates,designed to attract businesses to locate in specially designated areas.
The Empire Zones Program was developed to encourage economic development, with amission to assist in the revitalization of economically distressed geographic regions withinNew York characterized by “persistent and pervasive poverty, high unemployment,limited new job creation, a dependence on public assistance income, dilapidated andabandoned industrial and commercial facilities, and shrinking tax base.” Currently, thereare 59 Empire Zones in New York. Among the incentives applicable to businesseslocating within these zones are capital investment credits, wage tax credits, sales and localtax relief, and low cost power contractual agreements with utilities, usually with ten-yearterms. Since the start of the program, over 125,000 New Yorkers have been employed atmore than 2,600 certified businesses, attracting over $3.7 billion in private investment.
The discount programs offered by utilities are designed to encourage business retentionand expansion, as well as to encourage new businesses to expand or locate ineconomically depressed areas, while preventing rate increases for remaining customersthat might otherwise be necessary if the participating customers were to leave the utilitysystem. Utility economic development programs provide an estimated $85 million indiscounts annually. In today’s newly competitive era, however, the issue of how toappropriately fund such electricity discounts needs consideration.
Energy Programs and Policies to Promote Economic Development
Between 1985 and 1994, the State lost more than 342,634 (or nearly 26%) of itsmanufacturing jobs.3 The State, however, has been able to add more than 802,000 privatesector jobs since 1995. These data highlight the importance of job growth and retention inthe State’s industries that drive economic activity, including manufacturing and otherhigher-wage industries that export services from the State. Industries that drive economicactivity, typically large, higher-wage industrial and commercial firms, support a variety ofother industries that provide intermediate inputs to production of goods and services, aswell as numerous service industries and retail establishments. The State has taken a
4 The REMI Economic and Demographic Forecasting Model, developed by Regional Economic Models, Inc. ofAmherst, MA., is a 53-sector dynamic structural model of the New York State economy that is linked to a U.S.economic model. The model simulates inter-industry transactions and trading flows into and out of the State, based onthe costs of doing business. The relative cost of doing business is built up for each industry based on wages, costs ofintermediate inputs, fuel costs, and taxes.
2-23
number of steps to attract business, including reducing State taxes, providing incentives tomunicipalities to lower local taxes, reducing workers' compensation costs, and modifyingor removing regulations that hinder business productivity and economic growth.
The cost of energy, however, remains an obstacle to overcome in New York’s efforts toretain, expand, and attract businesses. New York's success in working with businessesthat could relocate to other states frequently depends on the availability of discounted,low-cost energy and incentives offered through various State and local government andutility-sponsored programs. Even though a competitive electricity market is expected toresult in lower prices, New York's energy prices may remain somewhat higher than thoseof most other states in the short-term. Therefore, effective energy-related economicdevelopment programs for businesses will continue to be necessary to help preserve andexpand the State's economic base.
ECONOMIC DEVELOPMENT POTENTIAL OF REDUCING ENERGY COSTS
Reducing energy costs will make the State’s businesses and industries more competitivewith other states and regions of the country. In addition, lower energy costs will positionNew York to attract new businesses and retain and expand existing businesses. Moreover,lower energy costs will increase business profitability and consumer purchasing power,which, in turn, will stimulate business investment and consumer spending and contributeto continued job growth.
An economic analysis, using the REMI Statewide economic model, demonstrates theimportance of energy cost reductions as a means to stimulate economic growth.4 Important indicators of economic development potential include: gross output, or totalsales value of goods and services produced, which is an indicator of total economicactivity in the State; personal income, which measures the aggregate wages, salaries, andproprietors’ income earned by in-State workers; and employment, which is the number ofin-State jobs. The analysis reflects the expected effects on economic activity of increasedbusiness profits and consumer spending that result from lower energy costs. The analysis
2-24
estimates that a permanent energy price reduction of $100 million per year wouldstimulate, over a ten-year period, the development of approximately 1,600 jobs in NewYork, increase the State’s gross output of goods and services by about $119 million, andincrease personal income by about $105 million. Incremental output of goods andservices, personal income, and jobs created as a result of lower energy prices wouldgenerally be sustained over time because the incremental business profits and consumerpurchasing power would be available in each subsequent year, resulting in a continuedhigher level of business investment and consumer spending.
EMPLOYMENT IMPACTS OF ENERGY EFFICIENCY IMPROVEMENTS
While the State is the fourth largest energy user among all states, only an estimated 11%of New York's total end-use energy requirements are met from indigenous resources, ofwhich 55% is hydroelectric power and 41% is from bio-fuels. In 2000, New Yorkersspent $38 billion on energy, consisting of $15.7 billion for electricity, $5.9 billion fornatural gas, $16.3 billion for petroleum products, and $0.1 billion for coal. Petroleumproducts include distillate and residual fuel oil, motor gasoline, aviation fuels, kerosene,and propane.
Because the State imports most of its primary energy supplies from other states andforeign sources, a large portion of the $38 billion annual energy expenditure flows out ofthe State to pay for imported energy. While imported energy supplies contribute to someeconomic activity within the State, investment in cost-effective energy efficiency reduceseconomic leakage, as more dollars are retained in the State, thereby increasingdiscretionary income. In addition to the jobs created by in-State spending of energysavings, jobs are created by the purchase and installation of new equipment, to the extentthat the equipment or its components are manufactured in New York, purchased from in-State suppliers, and installed by in-State labor. The precise number of jobs created is site-and industry-specific and is sensitive to business and consumer spending patterns,payback periods, and useful life-spans of the technologies installed.
NEW YORK’S ENERGY PRICES COMPARED TO U.S. AVERAGES
This section compares New York's retail energy prices to U.S. averages. The energyprices analyzed include electricity, natural gas, heating oil, gasoline, and diesel fuel. Figure 1 compares New York’s end-use energy prices for selected fuels to U.S. average
2-25
Electric. Res.Electric. Comm.
Electric. Indus.Nat. Gas Res.
Nat. Gas Comm.Home Heating Oil
Motor Gasoline0
10
20
30
40
50
Dollars per million Btu
NYSUS
End-Use Energy Prices for Selected FuelsNew York Compared to U.S.
2000
Figure 1
Electric. Res.Electric. Comm.
Electric. Indus.Nat. Gas Res.
Nat. Gas Comm.Home Heating Oil
Motor Gasoline(20)
(10)
0
10
20
30
40
Percent
NYSUS
Changes in Price for Selected FuelsNew York Compared to U.S.
1996 - 2000
Figure 2
prices for comparable fuels in2000. New York's retailenergy prices are generallyhigher than national averageprices for comparable fuelsand customer sectors. Figure2 shows, for each fuel, the rateof change in price from 1996to 2000 for New Yorkcompared to the U.S. Since 1996, improvements inthe price differential betweenNew York and U.S. priceshave been observed forindustrial electricity,residential natural gas, andcommercial natural gas. Incontrast, the differentialsbetween New York and U.S.prices in 2000 were somewhatgreater than in 1996 forresidential electricity,commercial electricity, homeheating oil, and motorgasoline. It should berecognized that use of year2000 prices for comparativepurposes presents anincomplete picture of energy prices because of the unusual short-term run-up in naturalgas prices that year, which have since returned to lower levels. Year 2000 prices,however, are the most recent available and are used in the comparisons that follow.
NEW YORK’S ENERGY PRICES COMPARED TO SELECTED STATES
This section compares New York's retail energy prices to prices paid in other states thatcompete with New York in attracting business. To the extent possible, the analysis
2-26
includes component analyses of retail energy prices for the eleven states studied. Thesestates include two New England states (Massachusetts and Connecticut), two Mid-Atlanticstates (Pennsylvania and New Jersey), one Midwestern state (Ohio), three Southeasternstates (North Carolina, South Carolina, and Florida), and one South Central state (Texas). Two West Coast states (California and Washington) are also included to present a widerperspective.
This analysis of the various fuel types considers property taxes and State and federalincome taxes, where applicable, as components of distribution costs. Data are notavailable to estimate the specific amounts of these types of taxes for electricity, naturalgas, and petroleum products. As a result, the tax components shown for these fuels reflectonly taxes that are easily isolated and are specifically added to the retail price of fuel, suchas the Gross Receipts Tax, franchise tax, Petroleum Business Tax, excise tax, and statesales tax. Local sales tax is not included due to the variability between states andlocalities within states.
New York State has historically taxed energy products and services to a greater degreethan other states. In an effort to reduce energy costs, the State has initiated the phase-outof the Gross Receipts Tax (GRT) on energy and telecommunication utilities, as well as thesales tax on transmission and delivery of electricity and natural gas for industrial andcommercial consumers. When fully effective on January 1, 2005, elimination of the GRTis expected to save approximately $330 million per year, and it is anticipated that the salestax phase-out will save approximately $150 million per year when fully effective onJanuary 1, 2004. Phase-out of the GRT, collected by utilities but paid by both businessesand consumers, was initiated in 1998 and will continue in stages, ultimately resulting intotal elimination by 2004. Also, the Petroleum Business Tax (PBT), a business taxsurcharge, will be reduced on oil used by commercial and industrial customers by up toeight cents per gallon. The PBT was, in essence, a “tax on a tax” that addedapproximately 15% to the amount of GRT collected from all customers. Effective in1997, the net PBT on commercial heating and railroad fuel was reduced, and themanufacturing fuel oil PBT was eliminated. Also, the net PBT on diesel fuel was reduced.
Electricity
Figure 3 compares New York’s average electricity price in 2000 with the averageelectricity prices in eleven other states. With the advent of restructuring, data to perform a
2-27
NY MA CT NJ PA OH NC SC FL TX CA WA0
2
4
6
8
10
12
14
Cents per KWh
All-Sector Electricity PriceNew York Compared to Selected States
2000
Figure 3
complete analysis of the various components of electric prices are no longer available. This is because certain market participants are no longer required to file data with theFederal Energy Regulatory Commission. Nevertheless, the primary factors that contributeto New York’s highelectricity prices relative toother states are wellknown. As documented inthe 1998 State EnergyPlan, these factors include: higher State and local taxeson electricity and onequipment and propertyused to generate, transmit,and distribute electricity; the cost of powerpurchased by utilitiesunder contract (asmandated by State andfederal laws); the costsassociated with two large nuclear projects; and the higher costs, in wages and operationsand maintenance, of doing business in New York.
The State has taken steps to address each of these factors:
C In addition to the State tax reform initiatives described earlier, the new owners ofdivested utility generating plants have in many cases negotiated reductions in localproperty taxes. These lower tax levels can be expected to be passed along tocustomers in the form of lower wholesale prices, as generators lower the pricescharged for their output.
C Since the repeal in 1992 of the mandatory minimum six-cent per kilowatt-hourpurchase price for power produced by cogenerators and other qualifying facilities,utilities have generally lowered the costs for purchased power to market-basedlevels. In addition, some utilities have been successful in renegotiating long-term power purchase contracts to obtain a lower price. Still, the legacy of the six-centlaw and contract prices based on administratively-determined long-run avoidedcosts continue to be a major cost driver in New York’s electricity prices.
5 In a study presented to the New York ISO, the ISO’s market advisor concluded that the increase in naturalgas and oil prices and the sustained outage of the Indian Point 2 nuclear plant in Buchanan were the primaryfactors in the run-up in wholesale electricity prices in 2000 (New York Market Advisor Annual Report onthe New York Electric Markets for Calendar Year 2000).
2-28
1996 1997 1998 1999 2000 0
4
8
12
16
Cents per KWh
New York StateAverage Revenue per Kilowatthour
Residential
Commercial
All Sector
Industrial
Figure 4
C The State has been more successful in reducing the costs associated with theShoreham and Nine Mile Point Two nuclear plants. LIPA, as part of the takeoverof the electric system on Long Island, refinanced the debt associated withShoreham, decreasing rates significantly on Long Island. More recently, nearly allof the remaining debt associated with the Nine Mile plant has been eliminated inthe process of the sale of that plant to an independent firm, Constellation Energy.
C Finally, after more than a decade of price caps and other incentive plans to reducerates, utilities have significantly reduced wage and operation and maintenancecosts.
As shown in Figure 4, New York’s Statewide electricity price (average revenue across allsectors) fell 6.3% from 1996 to 1999, a direct result of the above-described efforts andrate restructuring orders issued by the PSC. Despite the reduction in rates for the portionof utility services that remain regulated after restructuring, the dramatic increase in naturalgas prices starting in the second quarter of 2000, and persisting into the second quarter of2001, had the effect ofincreasing retail electricityprices, particularly downstate,during that time period.5 Inparticular, customers ofConsolidated Edison andOrange and Rockland enduredsteep increases in the price forpower, associated with naturalgas-fired generation setting thewholesale market clearingprice for power. Because theseutilities purchase much of theirpower directly in short-termmarkets, and pass fuel andpurchased power costs throughto customers every month, bills
6 A comparison of New York’s average price in the first seven months of 2001 to that of MA, PA, FL, TX and CA shows the difference in prices to be much reduced from what it was in 2000, as utilities in theseother states gained approval to increase retail rates in response to increased power costs.
7 For example, the October 2001 bill for the typical Consolidated Edison residential customer was $50.87 or17.0 cents per kWh, compared to $56.88 or 19.0 cents per kWh in October 2000.
2-29
for electric service from these utilities increased by about 16% in 2000. Although most ofthe other utilities in the State had capped rates in 2000, the increase in downstate bills wasenough to cause Statewide average retail prices to increase approximately 6%, temporarilyreversing the gains of the previous three years.
Utilities in the other states used for comparison either are less dependent on natural gasand oil for electricity generation, or had to wait for the outcome of regulatory proceedingsbefore passing through increased power costs to their customers. Therefore, the gapbetween New York electric prices and the other states compared widened in 2000.6
Since the second quarter of 2001, natural gas prices have dropped to previous levels. Electric prices have also declined, and the most recent bills for Consolidated Edison andOrange and Rockland customers have moderated significantly from 2000 levels.7 Inaddition, in 2001, the PSC significantly lowered distribution rates for customers ofConsolidated Edison, Rochester Gas & Electric, and Central Hudson Gas and Electric. Niagara Mohawk’s distribution rates were reduced 8% (largely offsetting earlier approvedincreases in commodity prices) with the approval of its merger with National Grid, andmany parties are supporting even greater reductions in New York State Electric and Gas’distribution rates. The trend in lower distribution rates, with decreasing, but perhapsvolatile, commodity prices, is expected to continue in the future (see the ElectricityResource Assessment).
Residential Natural Gas
New York's average natural gas price, after taxes, for residential customers in 2000 was$10.51, lower than Connecticut and Florida but higher than the other states studied, asshown in Figure 5. The wellhead price component for natural gas is identical for all statesbecause this price is determined by North American market conditions rather than byactual production costs.
2-30
NY MA CT NJ PA OH NC SC FL TX CA WA0
2
4
6
8
10
12
14
Dol
lars
per
Mcf
Retail Price after taxesWellhead price
Source: Based on 2000 average annual prices; Natural Gas Monthly 7/01 issue;prices include state taxes (e.g., gross receipts tax); exclude state and local sales taxes
Residential Natural Gas Price Components for Selected States
Figure 5
The largest price component is “processing, transportation, and distribution.” Processingrefers to any cleaning or liquid removal that occurs after the natural gas is removed from
the wellhead. Transportation refers to moving the natural gas from the wellhead to theentry point of the local distribution carrier’s network. Distribution refers to moving thenatural gas through the local distribution carrier’s network and delivering the product toend-users. Besides the direct costs of installing, maintaining, and repairing the natural gasdistribution system itself (e.g., materials, wages, workers’ compensation premiums, etc.),distribution costs include, for example, local property taxes, income taxes, and return onequity.
Many other states assess taxes on residential natural gas sales that are comparable to NewYork's. While New York does not collect general sales tax on residential natural gas sales,the residential retail price does include a GRT of 2.5%, equivalent to about 21 cents perthousand cubic feet (Mcf). Tax legislation enacted in 1997 reduced the GRT onresidential natural gas from 3.5% to 2.5%. This tax will be completely phased-out byJanuary 1, 2005, and is expected to improve New York’s price position relative to otherstates.
2-31
NY MA CT NJ PA OH NC SC FL TX CA WA0
2
4
6
8
10
Dol
lars
per
Mcf
Retail price after taxesWellhead Price
Source: Based on 2000 average annual prices; Natural Gas Monthly 7/01 issue;prices include state taxes (e.g., gross receipts tax); exclude state and local sales taxes
Figure 6
New York's average price for residential natural gas is higher than the average price of theother states studied, primarily due to the processing, transportation, and distributioncomponents of the price. Distribution costs, which comprise the major portion of thiscomponent, are higher in New York than in most other states. This is largely due to thehigher costs of installing, maintaining, and repairing natural gas distribution facilities inthe densely populated New York City metropolitan region. For example, the low-costtrenching techniques used for most natural gas systems cannot be used in New York City. Distribution costs in the downstate region are further increased by programs to replaceaging cast iron natural gas pipes. New York's higher natural gas price compared to statesto its south and west is also partially due to the State’s location near the end of theinterstate pipeline distribution system.
Commercial Natural Gas
The relationship of New York's average commercial natural gas price to those of otherstates studied is similar in most respects to that of the residential natural gas price, as shown in Figure 6. In 2000, New York's average price was $6.00 per Mcf which is lower
2-32
NY MA CT NJ PA OH NC SC FL TX CA WA
0102030405060708090
100110120130140150160
Cen
ts p
er G
allo
n
State TaxProd/Trans/MktgCrude
Source: Based on 2000 average annual prices; Petroleum Marketing Annual (2000 issue)
Home Heating Oil Components for Selected States
Figure 7
than in eight of the eleven states studied. Only Texas, Washington, and New Jersey hadlower prices. Many other states assess taxes on commercial natural gas sales that arecomparable to New York's. New York's retail commercial gas price includes a GRT of2.5% (about 15 cents per Mcf), as well as State sales tax of 4% (about 24 cents per Mcf).As with residential natural gas sales, the differences in average prices from state to stateare largely due to variation in distribution costs.
Home Heating Oil
New York's average price for home heating oil in 2000 was $1.44 per gallon, which wasthree to 32 cents higher than the average price in most of the other states studied. Homeheating oil prices have increased in all states for which data is available. The two WestCoast states had average prices higher than New York, as shown in Figure 7. Of the statesstudied, California, North Carolina, Ohio, and Washington tax the use of homeheating oil; New York State does not. New York's higher-than-the-national-averagehome heating oil price is largely a result of higher costs of doing business, particularlydownstate, which include higher local property taxes, wages, workers’ compensationpremiums, and State income taxes.
2-33
NY MA CT NJ PA OH NC SC FL TX CA WA
0
10
20
30
40
50
60
70
80
90
100
110
120
130
Cen
ts p
er G
allo
n
State TaxProd/Trans/MktgCrude
Source: Based on 2000 average annual prices; Petroleum Marketing Annual (2000)
Components of Commercial #2 Distillate for Selected States
Figure 8
Commercial Distillate Oil
New York's 2000 average distillate oil retail price for commercial customers was $1.10 per gallon, which was two to 22% higher than the average price in each of the other statesstudied, except California, as shown in Figure 8. The states with average prices closest toNew York's were California, which was virtually equal, and Connecticut, which was threecents per gallon lower. Most of the studied states’ average prices were two to 22 cents pergallon lower than New York's. Many of the states studied, like New York, collect somesales tax on commercial distillate oil, but no other state collects a Petroleum Business Tax(PBT) or other oil tax comparable to New York's. The PBT increases New York's averagecommercial distillate oil price by approximately 7.3 cents per gallon.
2-34
NY MA CT NJ PA OH NC SC FL TX CA WA
0102030405060708090
100110120130140150160170
Cen
ts p
er G
allo
n
State TaxFederal TaxProd/Trans/MktgCrude
Source: Based on 2000 average annual prices; Weighted average of all grades; Petroleum Marketing Annual (2000).State tax component includes state sales tax; local sales tax not included.
Figure 9
Gasoline
New York's 2000 average gasoline price for all grades of gasoline was $1.56 per gallon(excluding local sales taxes), as shown in Figure 9. This price was higher than that inseven of the states studied, but it was lower than Connecticut, California, and Washington. Connecticut's average price was 10 cents per gallon higher than New York's,due primarily to higher state taxes. Washington's average price was higher than NewYork's, due primarily to the longer transport distance to retail outlets. Average gasolineprices in New Jersey and South Carolina were lower than in New York as a result of lowerstate taxes. Average gasoline prices in the remaining states studied were between six and18 cents per gallon less than in New York.
Gasoline prices vary from state to state largely as a result of differences in state taxpolicies and regional differences in costs of doing business. Refiner acquisition costs ofcrude oil are identical for all states because crude oil commodity prices are determined byworld markets. Similarly, the federal gasoline tax of 18.4 cents per gallon is the same forall states. Most of the states studied, with the exception of Connecticut, New Jersey, and
2-35
NY MA CT NJ PA OH NC SC FL CA TX WA
0
10
20
30
40
50
60
70
80
90
100
110
120
130
140
150
160
170
Cen
ts p
er G
allo
n State TaxFederal TaxProd/Trans/MktgCrude
Source: Based on 2000 average annual prices; Petroleum Marketing Annual (2000)includes state sales tax; local sales tax not included.
Components of Diesel Fuel Price for Selected States
Figure 10
South Carolina, impose a combination of excise or other taxes on gasoline. The combinedeffect of these taxes on retail price is comparable to that of New York's excise tax andPBT. For example, New York's excise tax and PBT are 22 cents per gallon; similar statetaxes in Massachusetts, Pennsylvania, and Ohio are 21, 26, and 22 cents, respectively.New York's average price appears to be higher than those of the other states studiedlargely due to the fact that it collects general State sales tax on gasoline. Of the studygroup states, New York and California are the only states to assess a sales tax on gasoline.
Diesel Fuel
As shown in Figure 10, New York's 2000 average price for diesel fuel was $1.63 pergallon (excluding local sales tax). This price was higher than that in many of the otherstates studied. New York's average price appears to be higher largely because it collectsgeneral State sales tax on diesel fuel. States with the lowest diesel fuel prices are NewJersey, South Carolina, and Texas, which have relatively low state taxes as well as lowrefining, transportation, and distribution costs.
2-36
FINDINGS AND CONCLUSIONS
• Businesses need secure and reliable energy supplies that are reasonably priced toexpand operations and grow in the State. Policies promoting greater energy supplycertainty will lead to greater private sector investment in New York State.
• Low-cost power programs have been successful to date in retaining and expanding
employment opportunities in the State. The development of joint State and utilityeconomic development programs has been successful in supporting economicdevelopment.
• Power for Jobs has been successful and consideration should be given toauthorizing an additional phase or to development of a new, yet similar program.
• Offering electricity discounts as a means of retaining or attracting jobs is animportant economic development tool.
• Efforts should continue to be made to forge State and private business partnershipsto grow New York’s economy in an environmentally-sound manner.
• Energy prices need to be brought more in-line with other states to compete moreeffectively for economic opportunities.
2-37
SECTION 2.3
ENERGY AND THE ENVIRONMENT
INTRODUCTION
The technologies we employ to generate, distribute, and use energy all have clear impactson the environment. This issue report examines recent trends in air and water quality,and summarizes some of the programs created to identify and mitigate the impacts energygeneration and use have on the environment. Some of these programs addressenvironmental impacts from cars, trucks, and other mobile sources, while others areaimed at reducing air emissions from stationary sources such as power plants andfactories. The report will also examine the impacts of energy generation on water qualityand aquatic life. Finally, this issue report will discuss new efforts to understand howenvironmental impacts from energy use affect different social-economic groups in theState.
TRENDS IN NEW YORK STATE AIR QUALITY
The 1990 amendments to the federal Clean Air Act requires states to monitor ambientlevels of six pollutants in the atmosphere. These contaminants, called “criteriapollutants,” include lead, sulfur dioxide, nitrogen dioxide, carbon monoxide, andparticulate matter measuring less than 10 microns in diameter (PM10 ).
The New York State Department of Environmental Conservation (DEC) operates anextensive network of air quality monitors designed to provide accurate information aboutambient air quality in New York State. This network, which is designed, sited, andmaintained to meet strict federal guidelines, provides the data necessary to determinewhether air quality in the State meets the National Ambient Air Quality Standard(NAAQS) for the six criteria pollutants. The allowable concentrations for each of thesepollutants is established by the U.S. Environmental Protection Agency (USEPA) asrequired by the federal Clean Air Act. The criteria pollutants are regulated because healthexperts and scientists have identified them as posing a large threat to public health andthe environment. In addition to these federal requirements, New York State also monitorsambient concentrations of 39 toxic volatile organic compounds (VOCs). In addition tobeing toxic to humans, many of these VOCs are also precursors to ground-level ozone(smog), and measuring for them can often provide data as to the source of the pollution.
2-38
For the purposes of air quality compliance monitoring, the State is divided into two mainregions: the downstate region, consisting of New York City, Long Island, andWestchester, Rockland Putnam and lower Orange Counties; and the upstate region,consisting of the remainder of the state. All regions of New York have attained theNAAQS for lead, sulfur dioxide, and nitrogen oxide. Portions of New York State havebeen found to be in non-compliance with the standards for carbon monoxide, ozone, andPM10, although USEPA recently announced that the entire state is now in compliancewith the standard for carbon monoxide.
The following is a description of the NAAQS for each of the five criteria pollutants, andnumber of days from 1996 to 2000 that the standard was violated for each of the tworegions. Air quality data for 2001 is available on DEC’s website at www.dec.state.ny.us.
1. Carbon Monoxide. NAAQS - 1 hour: 35 ppm; 8 hour: 9 ppm. Upstate - noviolations during time period. Downstate - no violations during time period.
2. Lead. NAAQS - quarterly average: 1.5 :g/m3. Upstate - no violations duringtime period. Downstate - no violations during time period.
3. Nitrogen Dioxide. NAAQS - annual average: 0.05 ppm. Upstate - no violationsduring time period. Downstate - no violations during time period.
4. PM10. NAAQS - 24 hours: 150 :g/m3; annual average 50 :g/m3. Upstate - noviolations during time period. Downstate - no violations during time period.
5. Sulfur Dioxide. NAAQS - 3 hour: 0.5 ppm; 24 hour: 0.14 ppm. Upstate - noviolations during time period. Downstate - no violations during time period.
USEPA proposed a new NAAQS for particulate matter measuring less than 2.5 micronsin diameter (PM2.5) in 2000. Since that time, an industry organization has challengedUSEPA’s statutory authority to create the new standard, and a federal court asked formore information supporting the new NAAQS. Federal law requires that three yearsworth of monitoring data be collected before a given region can be designated as being incompliance or non-compliance with a NAAQS. Since monitoring has not beencompleted for three years, no region of the State has yet been designated as being inviolation of the standard for annual averages. The NAAQS for PM2.5 is as follows:24 hours - 65 :g/m3; annual (average over 3 years) - 15 : g/m3. Data collected to date inNew York is as follows: Upstate - no values > 65 :g/m3 ; one site > 15 :g/m3 annualaverage in 2000. Downstate - One value > 65 :g/m3; seven sites > 15 :g/m3 annualaverage in 2000.
2-39
In addition to the existing NAAQS for ozone, which measures concentrations of thepollutant over a one hour period, USEPA recently proposed a new eight-hour ozonestandard. Scientists felt that the eight-hour standard would provide better informationabout long-term exposure to the contaminant. As with the new standard for PM2.5, thenew ozone NAAQS was challenged by an industry organization and remanded by afederal court back to USEPA for additional supporting information. DEC hasnevertheless installed the equipment needed to monitor both the one-hour and eight-hourozone standards. The NAAQS for ozone is as follows: 1 hour - 0.12 ppm; 8 hour - 0.08ppm (average of fourth highest daily value for past three years). Table 1 indicates thenumber of days ozone levels exceeded the standard.
Table 1. Ozone Level Exceedance in New York (Number of Days)
Downstate Upstate
Date 8 Hour 1 Hour 8 Hour 1 Hour
1996 15 3 14 2
1997 25 9 15 0
1998 19 3 28 0
1999 27 9 28 5
2000 11 1 9 0
2001 (1/1/-8-13) 13 4 23 3
RECENT AIR QUALITY IMPROVEMENT PROGRAMS
New York State has established itself as a national leader in the development andimplementation of programs to reduce air pollutant emissions into the atmosphere. Theseinclude a number of approaches to reducing air pollution, including emissions testing forlight and heavy duty vehicles, adoption of the California Low Emission Vehiclestandards for new cars and trucks, clean fuels, and advanced technologies to reduce sootemissions from trucks. The state has implemented a number of control strategies forstationary sources like power plants and factories to reduce acid rain and ground-levelsmog. In addition, strategies to reduce emissions of greenhouse gases are beingdeveloped by the Governor’s Greenhouse Gas Task Force.
2-40
California Low Emission Vehicle Program
Although many people often identify air pollution as coming from factories and powerplants, automobiles and other motor vehicles are a significant part of the inventory. Inthe greater New York City area, these mobile sources account for about half of theemissions of volatile organic compounds and nitrogen oxides, and virtually all of thecarbon monoxide emitted into the air.
In recognition of the large contribution of mobile sources to air pollution, the 1970federal Clean Air Act authorized the USEPA to create emission standards for new carsand light trucks. Prior to this, there were no restrictions on the emissions motor vehiclescould release into the atmosphere with the exception of vehicles sold in California, whichhad implemented its own new vehicle standards in the early 1960's. As a result, theClean Air Act allowed California to continue to set its own emission standards, butprohibited other states from creating their own. Amendments to the Clean Air Act passedin 1977 allowed other states the option of using the federal standards or opting into theCalifornia program. In 1993, New York became the first state in the nation to adopt themore stringent California standards.
As emissions control technologies have matured, California has continued to increasedthe stringency of its standards and recently implemented a second round of its LowEmission Vehicle program, referred to as LEV-2. New York has since followed suit,formally adopting the LEV-2 program in 2000 and implementing the California standardsfor medium-duty vehicles weighing up to 14,000 pounds. In this manner, new vehiclesales of Sport Utility Vehicles in New York are now covered by the more stringentstandards. Because most of these vehicles are built on truck-based platforms, many wereexempt from emission standards for passenger cars. This is no longer the case.
Diesel Particulate Filters
Although light-duty cars make up the majority of vehicles on the road, trucks, buses andother heavy-duty vehicles are also significant contributors to air pollution. Because mostof these vehicles are powered by diesel engines, the contaminants they release aredifferent from those that are emitted by gasoline powered cars and light trucks. Forinstance, diesel powered vehicles tend to be high emitters of fine particulates. The NewYork City metropolitan area boasts one of the largest mass transit systems in the world. Along with subways and commuter trains, this system includes over 4,000 transit buses. Although mass transit results in lower total emissions than single-occupant vehicles, thefine particulate and soot emissions from diesel-powered buses are a considerable source
2-41
of air pollution. In an effort to address this pollution, the New York MetropolitanTransportation Authority (MTA) working in conjunction with the DEC developed andnow uses a new generation of technology, called Diesel Particulate Filters, which hasbeen demonstrated to make diesel-powered buses as clean as those powered byalternative fuels such as compressed natural gas. Initial testing of this technology,conducted on four transit buses in service in New York City, and at a Canadian emissionslaboratory in Ottawa, Ontario, is so promising that MTA has committed to using filterson its entire diesel-powered fleet. Although alternative fuel technology is beginning tomake in-roads into the heavy-duty vehicle market, it is clear that diesel engines willdominate this sector for the foreseeable future. The New York project was the first of itskind in the nation to demonstrate that significant emission reductions can achieved fromdiesel trucks and buses. As a result, a number of cities and states across the country areimplementing their own programs patterned on the New York model.
Low-Sulfur Fuels
One obstacle to utilizing Diesel Particulate Filters has been that the technology requiresthe use of ultra-low sulfur diesel fuel, which had not been readily available in the UnitedStates. Sulfur levels in such fuel is below 30 parts per million (ppm), compared to 500ppm or more found in regular diesel fuel. Although such fuel is necessary to use thediesel particulate filters, there is evidence that lower sulfur levels provide someenvironmental benefits in standard diesel engines, as well. An arrangement was workedout for special delivery of the required fuel for the four-bus demonstration project, butmuch larger quantities were required before MTA’s entire fleet could be converted to usethe new technology. As a result of the State’s action, refineries are now producing thelow sulfur fuel in the quantities needed to supply MTA’s entire fleet. The program hasgenerated technical evidence to support USEPA’s efforts to reduce sulfur levels in dieselfuel and gasoline nationwide.
Status of Acid Deposition Initiative
Both the 1984 State Acid Deposition Control Act and the 1990 federal Clean Air Actincluded provisions intended to reduce the devastating impacts of acid deposition on NewYork’s natural resources. Although tremendous progress has been made, there is stillstrong evidence that the problem of acid deposition has not yet been adequatelyaddressed, especially in the sensitive forests and water bodies of the AdirondackMountains. The National Acid Precipitation Assessment Program estimates that 24% ofAdirondack Lakes are seriously acidic. A 1995 USEPA study found that, even with theemission reductions required by the federal Clean Air Act, the number of acidic lakes in
2-42
the Adirondacks will double by 2040 and that 100% of its rivers and streams will be tooacidic to support life during spring snow melts. The report called for additionalreductions of sulfur dioxide (SO2) and nitrogen oxides (NOx) of 40 to 50%.
Because so much of the emissions that result in acid deposition come from power plantsand other facilities located upwind from New York, the State has continued to lobbyCongress to adopt legislation that would address the problem on a national level. NewYork has also taken steps to reduce emissions from sources located within the state.
The Acid Rain Initiative (ARI) announced by Governor Pataki in October of 1999, callsfor two measures to reduce emissions that cause acid deposition. First, DEC must act tolimit emissions of sulfur dioxide (SO2 ) from electricity generating units generating 25MW or more to a level that is 50% of the quantity of emissions (in tons) that wouldotherwise be allowed under the federal acid rain program established in Title IV of thefederal Clean Air Act. Second, DEC must act to limit emissions of nitrogen oxides(NOx) from electricity generating units during the non-ozone season (October 1 - April30) to a level that corresponds to the emissions level allowed during the ozone season(May 1 - September 30).
DEC is promulgating regulations that would establish emissions “cap and trade”programs. These regulations are patterned after the existing ozone-season NOx cap andtrade program. DEC developed the program to comply with the federal NOx controlrequirements and the State’s commitment to reduce NOx emissions under a 1994agreement among Northeastern states, referred to as the “Northeast Ozone TransportCommission NOx Memorandum of Understanding.” Part 237 would implement a newNOx cap and trade program that would operate throughout the year. As with the existingNOx cap-and-trade program, the statewide NOx emissions cap is calculated based on anaverage NOx emissions limit of 0.15 lb/MMBtu. Each subject unit would be allocatedNOx allowances based on a allocation methodology crafted by DEC. Each allowancerepresents a limited authorization to emit one ton of NOx during the non-ozone season. The number of tons of permissible emissions from each subject unit for a particularnon-ozone season is limited to the number of allowances that the unit has in its“allowance tracking account” for that time period. As with Part 204, the administrationof the allowance and emissions tracking systems for the regulatory program would beadministered by USEPA. The program will begin on October 1, 2004.
A new SO2 cap and trade program would also apply year round. The regulation wouldcover the same units that are subject to the federal acid rain program. The SO2 emissions cap would be set at approximately 130,000 tons annually (about half of the
2-43
number of federal SO2 allowances annually allocated to the subject sources). As withthe NOx programs, the new SO2 program would maintain the emissions cap by use ofallowances which will be allocated pursuant to a methodology developed by DEC. USEPA will administer the allowance and emissions tracking systems. The programwill take effect starting in January 2005 with implementation of 25% of the totalemissions reduction for the program. Full implementation would be achieved by January2008.
DEC issued preliminary drafts of the proposed regulations to representatives of theelectricity generating industry on January 18, 2001. A stakeholders working group, withrepresentation from the generating industry, the environmental community, and otherinterested parties, was created to develop the regulatory tools necessary to implement theARI. Elements of the energy industry has expressed some concerns about portions theprogram, and these concerns will be addressed in the formal rule-making process.
Energy Efficiency and Renewable Set-Aside Component of NOx Budget TradingProgram
Established by the adoption of 6 NYCRR Part 204, the program provides incentives toimplement electric end-use energy efficiency and renewable generation projects byallocating 3% or about 1,200 tons of New York’s ozone-season NOx allowance budget toeligible projects beginning in 2003. A pilot program under which 115 tons of NOx
allowances are available for end-use efficiency projects has been in place since 1999. Projects are certified as tradeable emission allowances which can be bought and sold onthe open market.
NOx allowances are accredited at the rate of 0.0015 lb per kWh, or one ton per 1,333,333kWh reduced during the five-month ozone season. This rate approximates the heat input-based rate of 0.15 lb per MMBtu used to allocate the Ozone Transport Region NOx Budgetamong individual states for the 2003 control period forward. Certifiable kWh reductionsfrom energy efficiency projects are based on the International Performance Measurementand Verification Protocol (IPMVP), developed jointly by the U.S. Department of Energy(DOE) and a consortium of public and private organizations for the purpose of establishingthe industry standard for measuring and evaluating the outcome of investments in energyefficiency.
The Set-Aside Program recognizes that emission reductions needed to meet air qualityobjectives can be achieved by implementing end-use electric energy efficiency measuresand renewable energy projects as well as by installing control devices on fossil fuel-fired
2-44
electricity generation sources. Ancillary environmental benefits of the program includeyear-round reductions of NOx emissions, thereby contributing to reducing acid depositionin the sensitive receptor areas of the Adirondacks, as well as reducing eutrophication (i.e.nutrient-loading) of water bodies such as the Long Island Sound. Furthermore, energyefficiency measures and renewable energy projects contribute to reducing emissions ofcarbon dioxide, the primary greenhouse gas, thereby providing long-term climate changebenefits.
Status of Governor’s Greenhouse Gas Task Force
In June 2001, Governor Pataki announced the formation of a Greenhouse Gas (GHG)Task Force comprised of representatives from the business community, environmentalorganizations, State government, and universities. The GHG Task Force is charged withadvising the Governor on specific actions and policies to achieve major GHG reductionsacross all sectors of the State’s economy, and to position New York State as a nationalleader in addressing these issues.
The GHG Task Force was formed in direct response to the national and internationalpolicy concern that increasing concentrations of carbon dioxide and other GHGs arecausing long-term changes in global climate by trapping more of the sun's heat within theatmosphere. Increasing average global temperatures and severity of weather patternsover the next century could cause the world's oceans to rise, damage forests and otherecosystems, disrupt agriculture, and increase health risks, posing risks to large numbersof inhabitants and businesses, as well as to infrastructure such as roads and bridges,.
The GHG Task Force has convened twice, and is working toward its objectives throughfive sector-specific Working Groups: electricity generation, buildings and industry,transportation, agriculture and forestry, and emissions trading. Preliminaryrecommendations for actions and policies from each Working Group have been vetted bythe Task Force and are included in “Energy Plan Findings and Recommendations”(Section 1.2). Recommended actions include establishing a Statewide target for GHGemission reductions relative to 1990 levels, promoting renewable energy resources,optimizing use of combined heat and power, improving the mass transit infrastructure,developing an indigenous bio-fuel industry, developing programs to encourage moreefficient use of oil and natural gas at customer sites, and establishing a GHG registry todocument baseline emissions and voluntary emissions reductions for participatingcustomers. The GHG Task Force will result in a Final Report, to be completed by March2002.
2-45
GREEN BUILDING TAX CREDIT PROGRAM
A Green Building Tax Credit was enacted in Chapter 63 of the Laws of 2000 thatprovides tax credits to building owners and tenants of eligible buildings and tenant spaceswhich meet certain "green" standards which, among other things, increase energyefficiency, improve indoor air quality, and reduce the environmental impacts of largecommercial and residential buildings in New York State. New York is the first state inthe nation to implement a tax incentive program for the construction of environmentally-friendly green buildings. The State provides up to $25 million in tax breaks for suchthings as green buildings that meet requirements for energy efficiency, indoor air quality,and use of recycled materials and wood resulting from sustainable forestry practices. Regulations have been proposed to implement the program, which were crafted withinput from the DEC, the Departments of Health (DOH), Tax and Finance, andNYSERDA, as well as experts in the building trades, real estate, and environmentalcommunities. It is expected that the regulations will be in effect in January, 2002.
METHYL TERTIARY BUTYL ETHER (MTBE)
Metyl tertiary butyl ether (MTBE) was approved by USEPA for use in gasoline in 1979as an additive to boost the octane rating of motor fuel as it required phasing out of earlieroctane enhancers, such as tetra-ethyl lead and benzene. In the mid 1980s it wasdiscovered that adding oxygen to motor fuel promoted more complete combustion andreduced pollutant emissions. Early programs in Colorado and elsewhere reportedapproximately 10% reductions in carbon monoxide emissions, as well as reductions involatile organic compounds (VOCs). As a result of these early programs, the 1990amendments to the federal Clean Air Act required the use of "reformulated gasoline"(RFG) in areas that failed to comply with national ambient air quality standards for ozonespecifying, among other things, that 2% of the fuel be comprised of oxygen.
Fuel providers had two primary options to meet the oxygen requirement: ethanol, analcohol made primarily from corn and other biomass, and MTBE, generally made fromnatural gas. During the 1970s, the federal government and many states (including NewYork) conducted pilot programs to evaluate the potential of ethanol to extend fuelsupplies. New York's program, like most others, ended in failure due to the tendency ofethanol to dissolve fuel lines and gasket materials, and because its use resulted insignificantly higher emissions of VOCs through increased evaporation of the fuel. Automakers have since employed new materials that eliminate the fuel line and gasketcorrosion, but the volatility problem of ethanol remains.
2-46
The other primary option to meet the oxygen requirement is MTBE. MTBE has severalchemical properties that make it an excellent fuel additive, including its relatively lowtoxicity (compared to lead or benzene), its octane enhancing ability, and its relatively lowvolatility. Unfortunately, it also has some unique hydro-geologic properties that make ita threat to groundwater. It is highly soluble in water, so that if spilled it tends to migratefurther and be more difficult to remediate than the other gasoline additives. It also has astrong turpentine-like smell that makes it easy to taste and smell at low concentrations(levels below 50 ppb).
Until recently, concentrations of MTBE in groundwater were not specifically regulated inNew York, although DEC did use the DOH drinking water value of 50 ppb (for MTBE asan unspecified organic contaminant) as a cleanup goal. DEC recently finalized anambient water quality guidance value of 10 ppb for MTBE, the lowest allowableconcentration in the nation. It is anticipated that DOH will shortly finalize similarstandards for drinking water. In February, 2000, the Division of Remediation issued amemorandum evaluating the extent of MTBE contamination in New York. The memostated that of 5,262 spills, 1706 (32%) were identified to have MTBE impacts togroundwater. In addition, 866 private wells and 47 public water supplies were found tobe impacted by MTBE. These numbers have continued to climb over the ensuing year,and it is clear that MTBE poses a severe threat to New York State's groundwater anddrinking water.
Because of these impacts, several Northeast states and California have taken steps toreduce the harmful effects of MTBE. States including New York have enactedlegislative phase-outs of MTBE. New York's action will take effect in 2004. In addition,several states (including Maine, and California) have requested USEPA to waive theoxygenate requirement as provided for in Clean Air Act. USEPA recently notifiedCalifornia that it will not approve the oxygenate waiver. Because California (like NewYork) has a pending ban on MTBE, and no other readily available additive has beentested and determined to be acceptable, USEPA’s decision effectively becomes amandate for the use of ethanol to meet the oxygenate requirement.
Use of ethanol, however, raises new concerns such as the potential for higher VOCemissions. Also, there is currently little if any ethanol production capacity in theNortheast. Ethanol is hydroscopic, absorbing moisture from the air, thus making itdifficult to ship gasoline containing ethanol via pipeline. As a result, ethanol would mostlikely have to be trucked separately from production sites and "splash-blended" atgasoline distribution centers. Additionally, it is unlikely that the national ethanol
2-47
production capacity exists to replace MTBE any time soon. MTBE accounts forapproximately 10-12% of the fuel supply in greater New York City. There is currentlyinsufficient ethanol production capacity in the Northeast to replace the portion of the fuelsupply currently made up of MTBE.
Removing MTBE from gasoline and replacing it with ethanol could have severalnegative effects. Ethanol has unique characteristics of its own that could have impacts onwater and air quality. Ethanol may be as difficult to remove from groundwater as MTBE,and it has been found to cause damage to the structures used to contain spills at fuelstorage and distribution facilities. As mentioned previously, ethanol has been shown todissolve gaskets and hoses in older cars, and may cause similar problems in off-roadequipment like lawnmowers, chain saws, and older outboard engines.
From an air quality perspective, substitution of ethanol for MTBE will most likely resultin increased evaporative emissions from fuel tanks. Fuel companies are already seekingpermission to raise the volatility of gasoline to allow for the use of ethanol. Along withits role as a source of oxygen, MTBE also increases the octane rating of fuels. Additivesused to replace the octane lost with the elimination of MTBE could potentially increasethe toxicity of fuels.
If ethanol were used in New York as a substitute for MTBE to comply with the 2.0%-by-weight oxygen requirement of federal reformulated gasoline, it is likely that ethanolwould be used at about 5.7% by volume to comply with the requirement. The EnergyPolicy Act of 1992 includes provisions granting a partial excise tax exemption forethanol used in gasoline. The excise tax exemption is 54 cents per gallon (cpg) ofethanol, which translates to 5.4 cpg for 10% by volume blends and 3.08 cpg for 5.7% byvolume blends.
New York State uses roughly 350,000,000 gallons of MTBE annually. Because ethanolhas a higher oxygen content than MTBE it would take about 180,000,000 gallons ofethanol to replace the MTBE. Substitution of ethanol for MTBE in New York would
therefore result in over $100,000,000 a year in losses to New York’s contribution to theHighway Trust Fund.
ENVIRONMENTAL JUSTICE ISSUES
Environmental Justice is meant to ensure the fair treatment and meaningful involvementof all people regardless of race, color, national origin or income with respect to the
2-48
development, implementation and enforcement of environmental laws, regulations andpolicies. In order to effect fair treatment and meaningful involvement of all people,environmental justice efforts focus on under-served communities and seek to addressdisproportionate adverse environmental effects on minority and low-income populations.
The DEC’s Office of Environmental Justice was created in 1999 to addressenvironmental justice concerns and ensure community participation in DEC’senvironmental permitting process. The Office of Environmental Justice is tasked withdevelopment of environmental justice policy and oversight of its integration into DEC’spolicies, programs and activities.
The DEC received a U.S. EPA State and Tribal Environmental Justice Grant to assist indevelopment of comprehensive environmental justice programs and policies. Pursuant tothe grant specification, the New York State DEC Environmental Justice Advisory Group(Advisory Group) was formed in January 2000 comprising representatives from state,local, and federal government, community groups, environmental groups, and businesses. The Advisory Group is tasked with developing recommendations for a DECenvironmental justice permit policy and other elements to be included in a strategicenvironmental justice plan. The Advisory Group is currently drafting recommendationsto be presented to the DEC Commissioner. The draft recommendations include:recommendations to address environmental justice concerns in the permit process;recommendations for incorporating environmental justice concepts into the StateEnvironmental Quality Review Act; and recommendations relative to Native Americanenvironmental justice issues, green benefits, enforcement, and more.
DEC will continue to address the environmental justice issues and incorporateenvironmental justice concepts into a variety of DEC programs.
2-49
CLEAN WATER/CLEAN AIR BOND ACT UPDATE
The Clean Water/Clean Air Bond Act authorizes $230 million for projects to improve theState’s air quality. These funds support programs that use innovative and moderntechnologies to provide the State’s citizens with a healthier and cleaner environment. This portion of the Bond Act provides funding for the following program categoriesrelated to energy use: the Clean Air for Schools Program; Clean Transportation projects,which includes funding for clean-fueled buses and vehicles; and other air qualityimprovement projects. As of September 1, 2001, $224 million has been appropriatedfrom the Bond Act for air quality improvement projects, with more than $175 millioncommitted to specific air quality initiatives.
Clean Air for Schools Program
The Clean Air for Schools Program, administered by the New York Power Authority(NYPA), is making dramatic progress to ensure that New York’s children have a cleanand healthy environment in which to learn and grow. The Bond Act authorizes $125million for this program to replace aging coal-fired furnaces at public schools withmodern boilers that use cleaner-burning fuels.
Through September 1, 2001, $117 million has been appropriated and fully committed toprojects at 74 schools in New York City, Buffalo, and Long Island. The projects areproducing real and measurable benefits in the air quality of these schools andsurrounding neighborhoods. As a result, emissions of air pollutants, such as sulfurdioxide, nitrogen oxide, and particulate matter have been significantly reduced andstudents, teachers, and community residents are breathing cleaner air. This program hasresulted in the elimination of use of coal-fired boilers in school buildings, and a largereduction of pollutants. NYPA estimates that the project has resulted the annualreduction of 31,000 tons of pollutants, including 30,400 tons of carbon dioxide.
Clean-Fueled Bus Program
The Bond Act also supports the State’s Clean-Fueled Bus Program, which has hadtremendous benefits for State’s environment and economy. The Program, administeredby NYSERDA, has assisted municipalities and transportation authorities in replacingdirty diesel-powered buses with buses using cleaner energy sources, while alsopromoting the manufacture of clean technologies in New York State. Under theProgram, Bond Act funds are awarded for up to 100% of the incremental cost of aclean-fueled bus, infrastructure related to refueling or recharging clean-fueled buses, and
2-50
any required depot conversions. Clean-fueled buses are defined as motor vehicles with aseating capacity of 15 or more passengers that are used for transportation on publichighways, and are powered by compressed natural gas, propane, methanol, hydrogen,ethanol, or electricity, including electricity from solar energy. Eligible applicants includemunicipalities, school districts, State agencies, and public authorities.
Four rounds of funding have been awarded to date, which have resulted in the purchaseof 300 buses powered by compressed natural gas, 67 hybrid electric buses, and 11 batteryelectric buses. NYSERDA estimates that these buses will result in reductions of 10,000tons of NOx, 560 tons of particulate matter, and 1.3 million tons of carbon dioxide overthe lifetime of the buses.
Projects are selected for Bond Act funding by NYSERDA after completion of acompetitive application process. Priority is given to projects that result in the greatestemissions reduction per dollar invested; are located in areas where air qualityimprovements are needed; provide the greatest economic benefits to the State; leverageadditional funding from the applicant or other sources; support emerging technologies;and are consistent with other clean-fuel vehicles activities.
As of September 1, 2001, $16 million in Bond Act funding has been committed to thepurchase of 376 clean-fueled buses for operation in New York City, Long Island,Onondaga County, the City of Rochester, and the City of Ithaca, as well as funding fortwo fueling infrastructure projects in New York City. The buses being purchased includea combination of electric, hybrid-electric diesel and compressed natural gas.
State Clean-Fueled Vehicles Program
Funding from the Bond Act also supports the State Clean-Fueled Vehicles Program. TheProgram, administered by the Office of General Services (OGS), is a coordinated effortto assist New York State agencies, public authorities, and the State University of NewYork in acquiring and using alternative fueled vehicles. OGS also serves as the Chair ofthe Clean-Fueled Vehicles Council, a working group of State agencies and authoritiesthat guides the State’s efforts to acquire clean-fueled vehicles and develop the fuelinginfrastructure to support the vehicles.
Through September 1, 2001, $16 million was appropriated from the Bond Act for theState Clean-Fueled Vehicles Program. The program finances the incremental costsassociated with the State’s acquisition of clean-fueled vehicles, as well as costs forrelated refueling and recharging facilities. To date, State agencies have acquired or
2-51
committed to purchase nearly 1,000 electric and alternative fueled vehicles for use intheir daily operations. A number of agencies have received funding from the Bond Actunder this program, including: the Departments of Transportation, Motor Vehicles, andCorrectional Services; DEC; OGS; Office of Mental Health; Thruway Authority;Olympic Regional Development Authority; and the State University of New York(SUNY) campuses at Albany and Buffalo.
Bond Act dollars are also being used to develop a comprehensive plan to provideconveniently located fueling sites for State agencies’ clean-fueled vehicles. The firstphase of the plan calls for construction of 30 new compressed natural gas fueling stationsto supplement 52 existing stations across the State. The first site, located off of I-87 inLatham, Albany County, opened in the spring of 2000, and the second site, in HudsonFalls, Washington County, is also in operation. The remaining sites are expected to beoperating soon. The second phase of the infrastructure plan includes establishing 18high-volume compressed natural gas fueling stations that will be easily accessible andlocated in major metropolitan areas along high-profile travel corridors, including theState Thruway between Albany and New York City. Bond Act funding will also be usedto address the need for other alternative fuels, and will include a network of electricvehicle charging sites.
Other Air Projects
The Bond Act provides up to $20 million for projects which enhance the quality of theState’s environment and the State’s air quality. To date, funding from this category hassupported a total of four programs. The newest program funded under this category isthe Heavy-Duty Vehicles Inspection and Maintenance Program. Other programssupported under this category include: the Ultra-Clean Power Generation TechnologiesProgram, the Clean Diesel Vehicle Program, and the Vehicle Inspection and Maintenanceassistance program.
Heavy-Duty Vehicles Inspection and Maintenance Program
In 1998, the State required emissions testing for heavy-duty diesel vehicles. The lawrequires that diesel-powered vehicles of 8,500 pounds or more be tested annually todetermine if they meet federal emissions standards for particulates or smog. These new
requirements will reduce pollution from diesel vehicles, improve air quality, and protectpublic health.
2-52
To facilitate implementation of the new testing requirements, Bond Act funding has beencommitted for a Heavy-Duty Vehicle Inspection and Maintenance State AssistanceProgram. The Program, administered by the Environmental Facilities Corporation(EFC), will provide resources to eligible service station owners and other eligibleparticipants toward the purchase of certified equipment to test emissions from heavy-dutydiesel vehicles.
Under the program, state assistance payments of $1,000 to $2,000 per project will bemade available to eligible facilities throughout the State that perform heavy-duty vehicleemissions tests for the public and to municipalities that purchase equipment necessary totest emissions from heavy-duty diesel vehicles. To date, $1.15 million in Bond Actfunding has been set aside for this program.
Ultra-Clean Power Generation Technologies
A total of $5.6 million in Bond Act funding has been awarded under this program forultra-clean power generation technologies that demonstrate improvements to air quality.This competitive program, administered by the NYSERDA, has provided funding toprojects that improve air quality by accelerating the widespread use of ultra-clean,innovative and advanced power generation technologies. Projects must also provide airquality, energy, and economic benefits to New York State.
Clean Diesel Vehicle Program
Under this program, administered by DEC, proposals were sought for projects todemonstrate technologies with the potential for reducing emissions from diesel-poweredvehicles. A total of $1 million was awarded to New York City Transit for a project todemonstrate a specific technology designed to reduce air pollutants from diesel-poweredbuses. Under the project, diesel buses operating in Manhattan and the Bronx are beingretrofitted with Continuously Regenerating Technology (CRT) devices. The devicecaptures and burns pollutants before emission. This demonstration project will verify theemissions reduction benefits of the technology, as well as the durability of the technologyon buses operated in a rigorous urban duty cycle.
The project is also an important element of the Metropolitan Transportation Authority’s(MTA) new capital plan. The unprecedented, multi-part plan ensures that MTA willhave the cleanest bus fleet in the world. As part of the initiative, MTA will step up thepurchase of clean-fueled buses, retrofit diesel buses, phase-out older and dirtier busesfrom its fleet, use low-sulfur fuels, and develop depots with alternative fueling
2-53
capabilities. These strategies will significantly reduce emissions and greatly improve airquality.
Enhanced Vehicle Inspection and Maintenance Assistance Program
Funding has been provided from this portion of the Bond Act for grants to service stationowners in New York City, as well as larger stations outside the City, that areparticipating in the State’s Enhanced Vehicle Inspection and Maintenance Program. These facilities were not eligible for funding under the Small Business EnvironmentalCompliance section of the Bond Act. The Environmental Facilities Corporation isadministering this program which provides $5,000 to eligible service stations toward thepurchase of the required testing equipment. Through September 1, 2001, approximately$6.2 million was provided to 1,250 participating service stations in New York City,Westchester, Nassau, and Suffolk Counties.
MITIGATING THE AQUATIC IMPACTS OF ELECTRIC GENERATION
Construction, operation, and maintenance of energy developments projects can producenegative environmental impacts on associated water bodies as well as other media suchas air quality, terrestrial habitat and wetlands. However, with appropriate mitigationmeasures, electric generation can have minimal environmental impacts. DEC hasachieved great success in reducing the impacts of existing projects and preventingnegative impacts from new projects while simultaneously ensuring the development ofcleaner energy projects.
Steam-Electric Power
Most steam-electric projects use water to condense steam, although many new plants areusing dry condenser (air) cooling, a form of closed-cycle cooling. Environmentalimpacts to aquatic life can be significantly reduced or eliminated through the use ofclosed-cycle cooling where water use is greatly reduced by recycling. There arenumerous examples of operating steam-electric plants of various sizes that have virtuallyno fish impact, as well as several recently permitted low impact closed-cycle plants. Similar energy projects are either under consideration in hearings or in the applicationprocess.
Many older steam plants do not recycle water in closed-cycle systems, but rather usesignificant quantities of water to cool the steam condensers with once-through coolingsystems. In fact, energy projects are among the largest water users of the State. As a
2-54
consequence of using this amount of water, fish and other aquatic life may be drawn intothe plants and be impinged on the intake screens (designed to keep debris in the waterfrom entering the plant), or passed through the screen mesh and into the station (a processcalled entrainment). Entrainment usually results in 100% mortality to the eggs andlarvae; small adult fish are also entrained. Impingement may damage or cause mortalityto fish. Adverse impacts to aquatic life can also occur through the discharge of thermalpollution (heated cooling water) back to the lake or river. Thermal pollution can kill fishdirectly, block fish migrations, and cause the growth of nuisance species.
DEC has been and continues to be a national leader in finding ways to mitigate theimpacts of these older plants without adverse impacts on power production. Somemitigation measures, like variable speed pumps, fish return systems, and chlorineminimization studies, have saved money and improved plant efficiency. New York wasalso the first to successfully employ new technologies to substantially reduce fishmortality while permitting once-through cooling to continue without de-rating plantgeneration. Examples are filter fabric aquatic life exclusion systems around intake pipesand high-power, high-frequency sonar repulsion system for alewives (herring). Conversion of older plants to closed-cycle cooling to mitigate significant impacts mayalso be used where appropriate. Under legislation signed into law by Governor Pataki inNovember 2001, applicants seeking an expedited, six-month approval process formodifying or siting of major electric generating facilities in New York must install air-cooled condensers or evaporative cooling water intake systems that use no more than 15gallons of water per minute per megawatt of total plant generating capacity. Severalpending applications for re-powering have proposed reducing aquatic impacts to 1% ofcurrent levels, while increasing energy output and nearly doubling energy productionefficiency. Conversion of existing once-through plants to closed-cycle cooling is alsopossible, but will result in some lost energy production. For example, to produce a 95%reduction in water use and fish entrainment mortality using closed cycle cooling, a 1200-MW fossil-fueled plant might typically be de-rated 35 MW summer (2.9%) and 17 MWnon-summer (1.4%) .
Hydropower
The manner in which a hydroelectric project is operated can also dramatically affect fishand wildlife resources. DEC has been a national leader in getting projects licensed,re-licensed, or permitted through exemption, while restoring water quality andminimizing associated environmental impacts without causing significant energy losses. This has been accomplished through:
2-55
• Restoring adequate base flows in rivers within project operating limitations. Thisensures navigation and dampens the impact to aquatic organisms, vegetation, andwetlands of pulsed generation that may be permitted.
• Restoring minimum river flows and fish passage flows in main stem reaches thatare bypassed by penstocks or power canals. This eliminates water qualityviolations and restores an acceptable (though impacted) aquatic ecosystem.
• Reducing impoundment fluctuations to acceptable levels, especially during fishspawning seasons. Often more liberal fluctuations are permitted outsideecologically critical times.
• Reducing fish impingement and entrainment mortality through appropriatelysized trash racks and fish bypass systems. If trash rack replacement is necessaryto protect fish it is often scheduled for a year when routine wear-and-tear replacement is scheduled. And fish bypass flows are often integrated withminimum flows required to maintain water quality standards.
DEC has also been a leader in using Federal Energy Regulatory Commission’scollaborative Alternate Licensing Process where the developer and stakeholderscooperate in a streamlined licensing process. It has been successfully used in re-licensing facilities on the Hudson River. Governor Pataki announced in October 2001 that NYPAhad submitted its application to FERC for a new 50-year license to operate the 800 MWSt. Lawrence-Franklin D. Roosevelt Power Project in Massena. The current licenseexpires in 2003. The Governor said that the application, which was developed using thealternative licensing process, achieved “an unprecedented level of community support.” The FERC license for the largest project in the State, the NYPA’s 2,400 MW NiagaraPower Project on the Niagara River, expires in 2007. It is anticipated that NYPA willseek FERC approval for use of an alternative licensing procedure for the new license.
FINDINGS AND CONCLUSIONS
Since the 1998 State Energy Plan was released, the State has made significant gains inreducing the environmental impacts associated with energy generation and consumption. Emission standards on new motor vehicles have been strengthened, as have therequirements on power plants and other stationary sources of air pollution. The impactsof energy generation on the state’s aquatic resources have been addressed. New powerplants must consume much less water than older facilities, and the impacts on fish andother marine organisms must be minimized to the greatest extent possible. Otherprograms have been developed to address the concerns of the Environmental JusticeCommunity.
2-56
• The generation and use of energy results in impacts on the environment, includingthe release of pollutants into the air and impacts on aquatic resources.
• Since the 1998 State Energy Plan was released, the State has made significant gains in reducing the environmental impacts associated with energy generationand consumption. Emission standards on new motor vehicles have beenstrengthened, as have the requirements on electricity generating plants and otherstationary sources of air pollution. The impacts of energy generation on theState’s aquatic resources are analyzed and addressed through existing regulatoryprograms. New electricity generating plants are required to use much less waterthan existing facilities, and the impacts on fish and other aquatic organisms mustbe minimized to the greatest extent possible.
• The State has become a national leader in developing new technologies to reduceemissions from diesel-powered trucks and buses, and has created a market forclean-burning low sulfur fuels. These programs will help ensure that New York,already one of the most energy efficient states in the nation, produces andconsumes energy with the lowest possible impacts on the environment.
• New York has made great progress in meeting its air quality goals, currentlymeeting the National Ambient Air Quality Standards for five of the six federalcriteria pollutants. The New York metropolitan area has not yet attained thecurrent National Ambient Air Quality Standard for ozone (one-hour), and is notlikely to be designated as meeting the pending standards for ozone (eight-hour) orfine-particulates (PM2.5). Meeting these standards will require additionalemission reductions from all sectors.
• New York has adopted the most stringent tailpipe emission standards for newmotor vehicles in the nation, and continues to develop new strategies to reduceemissions from mobiles sources such as cars and trucks.
• The State has made significant progress in reducing emissions that cause aciddeposition, and will soon adopt stringent new standards on power plants to furtherreduce these emissions. Scientific data indicates that many water bodies andforested regions in the state are still adversely impacted by acidic deposition, andthat there is a need for additional national efforts to address these impacts.
• Public transportation has the potential to significantly reduce the impacts ofenergy used in the transportation sector, particularly through the decrease insingle occupant vehicles on the State’s roadways.
• The fuel additive methyl tertiary butyl ether (MTBE), added to gasoline to meetfederal oxygenate requirements, has negatively impacted surface and groundwaters in New York State and across the nation. New York has enacted a
2-57
legislative ban on MTBE beginning in 2004.
• Environmental Justice (EJ) has become significant issue in the siting of newpower plants and other facilities. The State is working to develop acomprehensive policy on how EJ issues will be addressed.
2-58
SECTION 2.4
ENERGY AND TRANSPORTATION
INTRODUCTION
This issue report examines the relationship between meeting New York’s transportationneeds and the complementary goals of fostering economic growth, preserving andenhancing the environment for an improved quality of life, and increasing energyefficiency. The success in meeting transportation needs is an important determinant insuccessfully achieving these other important goals.
The 1998 State Energy Plan laid the foundation for many of the State’s transportationpolicies with regard to energy-efficient travel. The themes, policies and objectivesidentified in the 1998 State Energy Plan remain valid today. Many of the strategies andimplementation steps discussed in that Plan are continuing. In addition to the importanceof establishing energy related goals and objectives for the State, the State Energy Plan isvaluable because it also facilitates the integration and coordination of important policydecisions by the State. The State Energy Plan is coordinated with the Statewide MasterTransportation Plan and the State Implementation Plan for air quality.
This issue report stresses several broad themes, in the context of energy-efficienttransportation, as follows:
• Trends in transportation and travel;
• How State, regional and local transportation providers can effectively enhanceand encourage efficient transportation;
• Innovation in transportation technology for improving energy efficiency in thetransportation sector;
• Activities and programs that enhance the use of alternative fuels and alternativefuel technology and infrastructure to reduce the transportation sector’soverwhelming dependence on conventional fuels; and,
• Role of energy-efficient transportation measures for meeting federal and State airquality goals.
2-59
TRANSPORTATION PATTERNS AND TRENDS - AN OVERVIEW
Highways
Highway travel (in daily vehicle miles traveled [DVMT]) on New York roadways from1990 to 2023 is presented in Figure 1. Travel on New York roadways is currently about352 million vehicle miles per day. This traffic volume results in an annual total of 128.7billion VMT. Historically, vehicle travel in New York has grown by approximately 2.5%to 3% per year or moresince 1950. However,the 1990's have shownslower growth in vehiclemiles traveled, about 2%per year. While DVMTis expected to growthroughout the 20-yearforecast period, the rateof growth is expected todecline slightly with a10- year growth rate ofaround 1.4% per year for2000 to 2010, and 1%per year for 2010 to2020. Nonetheless, ifcurrent trends continue,DVMT on New Yorkroadways are forecastedto increase by 30% in thenext 20 years.
The existing andforecasted travel trendsfor the downstate NewYork metropolitanregion is shown inFigure 2, and Figure 3depicts travel in upstate
2-60
New York. Theforecasted increase intravel in the downstateNew York City region isat a slightly lowerpercentage than theremainder of the State. The higher use ofregional public transit inthe downstatemetropolitan regionprovides a restraint onincreasing DVMTcompared with upstateNew York, wheredevelopment patterns continue to result in increasing travel as household discretionarytravel and work trip distances both increase, and related truck delivery trips also rise.
Transit
New York has the mostenergy-efficienttransportation sector inthe nation, owing to thehigh per capita use oftransit alternativesincluding buses,subways, commuterrail, and ferries. Morethan one-third of allnational transitpassengers are in NewYork. The percentageof all daily person tripsby travel mode for all travel purposes reported in the 1995 National PersonalTransportation Survey (NPTS) is shown in Figure 4, with New York having a muchlarger percentage of transit trips than the rest of the U.S. (9% vs. 1%). Examining
Source: NYSDOT, Planning Data Analysis GroupData Source: 1990 US Census, Summary Tape File #3, P49
1990 Census Journey-to-Work
Figure 5
journey-to-work trips, Figures 5 and 6 clearly delineate the impact of 50% transit use forthe New York City metropolitan area compared to the overall State travel picture and the
rest of the nation, respectively. New York leads the nation with the lowest fuelconsumption per capita of any state. Also contributing to low-per-capita fuelconsumption is that the number of New York residents working at home has increaseddramatically in the past decade, rising from 2.6% of all workers in 1990 to 5.1% in 1995,as reported by the 1995 NPTS.
The Statewide Master Transportation Plan emphasizes maintaining transit infrastructureand providing operating improvements that will continue to improve the energyefficiency of travel in New York. The significant continuing investment in IntelligentTransportation Systems (ITS) Statewide is also expected to have a positive effect onfuture energy use. Were it not for New York’s investment in public transit service,resulting in a more energy-efficient transportation system, the diversion of those riders tosingle-occupant vehicles would increase annual vehicle miles traveled by 25 billionmiles.
Source: NYSDOT, Planning Data Analysis GroupData Source: 1990 US Census, Summary Tape File #3, P49
1990 Census Journey-to-Work
Figure 6
Freight
There is evidence of the recent growing importance of freight truck traffic on NewYork’s roadways. Truck traffic showed increases of 20% to 37% on six of the eightbridge crossings between New York and Canada from 1996 to 2000. Clearly, the NorthAtlantic Free Trade Agreement (NAFTA) has had an impact on truck travel in the State,as the number of trucks traveling through New York to and from Canada, as well as toand from destinations in New York, have led to this increase. In the New York Citymetropolitan area, while auto traffic dominates in terms of the overall number ofvehicles, on a percent basis, the increases in truck traffic on bridge crossings is alsosubstantially higher than increases in auto traffic. This represents significant futurechallenges for infrastructure repair, congestion, economic development, and air qualitygoals.
Trends in freight travel are presented in Figure 7, which compares the value and tonnageof goods movement between New York and destinations in the rest of the U.S. in 1993and 1997, with the New England states also included as a subcategory of trade. Based on
Comparison of 1993 and 1997 Commodity Flow SurveyNYS - Value and tonnage of goods movement
Key
NEW YORK
$16,767 -38 %
12,603 8 %
Value $ (M) % ChgTons (T) % Chg
$35,331 56 %
9,282 2 %
$122,301 13 %
217,676 30 %$187,685 14 %
100,273 -9 %
$151,282 19 % 50,735 25 %
$255,747 13 %
91,185 19 %
Figure 7
the Census Bureau’s 1997 Economic Census’ Commodity Flow Survey, the value of goods shipped to New York is increasing while the total tonnage of these goods isdecreasing. This underlines the fact that heavy raw materials, which tend to have highertonnage and lower value, relative to higher-value goods (e.g. computer software andelectronic retail goods) are a declining percentage of freight travel to New York, whilethe lighter, high-value freight shipments are increasing. Note also the summary table oftotal commodity flow in Figure 7 indicates that New York is a net importer of freightshipments, as both the value and tonnage originating outside New York is greater thanthe amount New York ships to the rest of the nation.
Trucking is the predominant mode of freight transportation in New York. Rail carries asubstantial amount also; in 1997 over 7 million tons of freight were exported from NewYork. Waterborne freight exports accounted for nearly 20 million tons. These freighttravel trends have implications for future energy use. The increase in the professionalservice sector has also spawned an increase in overnight deliveries of letter packages because smaller trucks (e.g., Federal Express, United Parcel Service) comprise a higher
2-64
portion of goods movement in New York than previous years. The New York Citymetropolitan region, a large market with excess disposable income resulting in deliveriesof high-end value goods, disproportionately contributes to increases in truck traffic. Traditional heavy-duty, long-haul trips still make up a significant portion of the traveland resulting congestion in New York, but are not growing as fast as the short-tripdeliveries of high-value goods for New York’s retail and business markets andconsumers.
Personal Travel Trends
The National Personal Transportation Survey (NPTS) household travel trends provides abreakdown of personal travel throughout the State by trip purpose, travel mode andvehicle type. The NPTS trends provide an estimate of how changing travel patternsimpact energy use, taking into account estimates of fuel use by vehicle type. The UnitedStates Department of Transportation’s (USDOT) Federal Highway Administration alsoprovides national reports on the entire NPTS that are valuable for judging regional andinterstate travel trends, which are growing in importance for examining futuretransportation energy impacts.
The personal travel trends identified by New York’s portion of the NPTS follows thenational trends in several key categories that impact energy use. The 1995 resultsshowed that the number of persons per household continues to decline, while the numberof vehicles and workers per household continues to increase and the average trip lengthcontinues to grow. These trends combine to increase DVMT even with a stablepopulation base. In addition, the 1995 NPTS showed that the number of trips perhousehold and the miles traveled to work both continued to increase compared withprevious survey years. Another NPTS is currently underway, so that it will be possible tosee if these trends are continuing. For now they lead to the conclusion that the personaltravel portion of New York’s DVMT will likely continue it’s upward trend, with theresulting total Statewide DVMT also impacted by the general business cycle for theremaining portion of business travel.
The policies and objectives set forth in this Draft Energy Plan provide many areas whereefforts to improve the efficiency of the transportation system are aligning with these newtravel trends, such as the Statewide ITS program, passenger rail and bus infrastructureupgrades, promotion of new pedestrian and bicycle facilities, intermodal freight accessimprovements, and the New York High Speed Rail Initiative.
2-65
Enhancing and Encouraging Energy Efficient Transportation
Energy use in the transportation sector is derived from the amount of travel, expressed asvehicle miles of travel (VMT), and fuel economy, expressed as miles per gallon (MPG). Increasing energy efficiency in the transportation sector can be accomplished byreducing VMT, increasing the fuel economy of the vehicles used for travel, or byreducing congestion and vehicle delays. Reducing VMT can be achieved in a number ofways, from an absolute reduction in travel to increasing the occupancy of each vehicle tomove the same or more travelers in fewer vehicles (shifting from single-occupantvehicles [SOVs] to high-occupancy vehicles [HOVs], which include carpools, vanpools,and transit vehicles).
As travel has increased, the level of congestion, often expressed as vehicle hours of delay(VHD), on many roads has also increased. A major impact of congested travel is anincrease in the amount of fuel used to make a trip. For 2000, it is estimated that traveldelays on the State highway system resulted in almost 285 million gallons of wasted fuel. If nothing is done to address congestion, the amount of wasted fuel would rise to over400 million gallons by 2006, an increase of 40%. Across the State, many actions havebeen taken to reduce the worsening congestion on New York’s highways, but it remains amajor challenge, especially in urban areas. New York is proposing and implementing anumber of congestion mitigation measures as part of its capital and operating programs. Estimates from the most recent capital program update in 2000, for the 5-year periodfrom State fiscal year (SFY) 2001/2002 through SFY 2005/2006, indicate that thesecongestion mitigation measures would reduce the growth of VHD by almost 120,000hours per day, resulting in estimated fuel savings of 45 million gallons annually, asavings of over 10% compared to the fuel wasted under the "no build" projection. Ascongestion decreases, air pollutant emissions and energy use also decline. The followingsections describe some of the actions undertaken by New York that enhance mobilitywithin the State through congestion mitigation and have a positive impact on energyusage and efficiency in the transportation sector.
Reducing Person Hours of Delay And Vehicle Miles Traveled
The cost of congestion to New York residents is exceedingly high, including unnecessaryextra vehicle wear and tear, lost time, increased fuel use, and increased delivery costs. Using current information on traffic flows and roadway facilities, the New York StateDepartment of Transportation (DOT) estimates that congestion on State-owned highwaysalone cost New Yorkers almost $5 billion in 2000. Assuming nothing is done to easecongestion, and assuming typical traffic growth rates and current fuel prices, this figure
2-66
grows to just under $7 billion in 2006, a 40% increase. These figures do not includetravel and delays on roads owned by local governments, which generally have lowertraffic volumes.
The primary methods to reduce congestion and its impacts are by decreasing vehiclehours of delay and total vehicle miles of travel. Every action undertaken by the State orlocal transportation agencies to mitigate the growth of congestion attempts to accomplishone or both of these objectives. These actions by nature are multi-modal, coveringhighway construction and operating projects, transit capital projects and operatingpolicies (e.g., fare incentives), and motor carrier and rail freight services. As an exampleof the scope and range of activities, the following international border crossing projectsand initiatives have been implemented or are being implemented at New York’sinternational border crossings to help reduce congestion and reduce energy use:
• Deploying two Intelligent Transportation Systems and Commercial Vehicle
Operations (ITS/CVO) units at the Peace Bridge, which are expected to improvethe efficiency and flow of traffic and trade across the border by reducing the timefor processing commercial vehicles and reducing the number of requiredsecondary inspections.
• Developing a strategic plan with the Niagara Falls Bridge Commission(NFBC) toaddress the traffic queuing and safety concerns within the plaza and along theapproaches to the Lewiston/Queenston bridge, including installing cameras withinthe plaza, and variable message signing and pavement sensors on the approachesand connecting highway that will be tied to a transportation management center.
• Modernizing the Interstate Route 87/Champlain Inspection Plaza to increase its
capacity and reduce traffic queues.
Carefully selected highway construction and operating projects can enhance mobility, reduce traffic congestion, increase travel speeds, and decrease energy use. Highway andbridge construction projects can improve traffic conditions and travel speeds that lead toenergy savings.
Examples of highway capital projects that decrease energy use through mobilityimprovements include the following:
• Rebuilding State Route 17 into a four-lane, controlled-access facility fordesignation as Interstate Route 86. This will result in increased safety andeconomic development along the Southern Tier and in Western New York, andwill reduce delays along this corridor.
1 TDM focus areas included the monitoring, program funding, and evaluation of voluntary TDM programs;TDM incentive and grant programs to facilitate participation in alternative commute modes; TDM integrationwith other mobility and capital programming initiatives; TDM modeling and evaluation mechanisms; commuterchoice/employer issues; employer based technical assistance services; and development of TDM partnerships.
2-67
• Expanding the HOV lane network along the Long Island Expressway in Nassauand Suffolk counties.
• Reconstructing the Interstate Route 684, State Route 120, and State Route 22interchange in Westchester County.
• Widening State Route 22 from Interstate Route 84 to County Road 65 in PutnamCounty.
In addition to capital improvements to the highway system, New York addresses theoperating efficiency of the network through the use of Transportation DemandManagement (TDM) actions and Transportation System Management (TSM) measures. TDM actions alleviate traffic problems through improved management of vehicle tripdemand. These actions are primarily directed at commuter travel and are structured toreduce the dependence on and use of single-occupant vehicles, or to alter the timing oftravel to other, less-congested times outside the peak periods.1 TSM measures arefocused on increasing the efficiency of the transportation system through measures suchas ITS techniques, traffic signal improvements and coordination, incident management,and providing traveler information through Variable Message Signs (VMS). It isimportant to recognize that there are two kinds of delay that must be addressed. Recurring delays occur when traffic volumes exceed the roadway capacity and tend tohappen on a regular basis. Actions to reduce recurring delay include most of the TDMstrategies and TSM actions such as signal coordination and ITS. Incident, ornon-recurring, delay is caused by incidents on the roadway that reduce traffic flow.Incidents include accidents, vehicle breakdowns, debris in the travel lanes, or specialevents. Most incident delays are random, unpredictable events. Incident managementstrategies specifically target the congestion resulting from traffic incidents.
All TDM and TSM measures have the potential to save substantial amounts of fuel byreducing VMT or reducing delay. A wide variety of TDM and TSM actions are targetedat reducing the growth of congestion in the State. Some examples of these TSM andTDM actions include the following:
• Implement a Highway Emergency Local Patrol (HELP) program to decreasehighway delay caused by incidents, such as accidents and breakdowns. HELP
2-68
trucks are currently operating in several areas across the State, including NewYork City, Long Island, the Lower Hudson valley, and the Capital District. Anadditional program is planned for Buffalo.
• Coordinate traffic signals, which reduces delay at intersections and increasestravel speeds on arterial streets.
• Develop and/or expand express bus and vanpool/shuttle services in the CrossWestchester Expressway and Long Island Expressway transportation corridors.
• Develop and/or expand park-and-ride lots, primarily in the lower Hudson Valleyand Long Island.
• Install TDM signs to promote carpooling opportunities on the Staten IslandExpressway.
• Provide grants to assist private employers on Long Island and in the lowerHudson Valley to develop alternative commuter transportation services at worksites.
ENCOURAGING ENERGY-EFFICIENT ACTIONS BY TRANSPORTATIONPROVIDERS
Governments at all levels provide transportation infrastructure by constructing,maintaining, and operating roads, bridges, and other facilities. This infrastructure is usedby travelers and public and private transportation providers such as public transitauthorities, intercity bus companies, and the trucking industry. Government agenciesneed to work with these public and private transportation providers to encourage them toadopt programs and policies that meet traveler needs and contribute to improving energyefficiency. Government agencies can encourage energy-efficient actions bytransportation providers through pricing structures, taxing methods, subsidies, andregulations. In addition, government transportation providers must carefully apportiontransportation resources between existing facilities and the need to expand the network tosatisfy unmet demand. Using the majority of scarce resources to keeping transportationfacilities in a state of good repair continues to be an essential element of good energypolicy. Inadequate infrastructure investment increases direct and indirect costs tobusinesses and consumers. A deteriorated highway and bridge network increases directeconomic and energy-related costs, including unnecessary fuel consumption, motorvehicle depreciation, labor costs, and accidents.
In 1995, the Governor developed a five-year capital program to address the infrastructure
2-69
needs of the State’s highways and bridges. The goal of the program was to stabilize thecondition of the State’s roads, improve the condition of the State’s bridges, and facilitateeconomic expansion through the implementation of capital and preventive maintenancework. During the five year period between SFY 1996/97 and SFY 2000/01, DOTreceived bids on nearly $6 billion worth of construction. Fully 88% of those projects, ata cost of over $5 billion, were infrastructure projects. It is expected that over the next fiveyears this percentage will climb to 92%. In addition, capital projects include energy-saving improvements such as new or improved traffic signals and other intersectionimprovements. These activities improve traffic flow, reduce travel time, and increasemobility. DOT employs night-time construction on its most heavily-traveled roadways tomake infrastructure repairs under low-traffic conditions, while still moving the majorityof people and goods during the day in an effective and energy-efficient manner. A sizeable portion of this construction work may involve relocation of utility facilities.Currently, under existing law, most relocation costs are not reimbursed to the affectedutilities. The utility industry has asked DOT to review the existing legislation and relatedpolicy regarding utility relocation. The industry seeks relief from the expenses they incurwhen they are required to move their facilities because of a DOT project. DOT has had along standing policy that it views as fair: access is provided to the right-of-way withoutany fees and while the purpose of the highway infrastructure is mainly for its customers,the traveling public and business, every effort is made to accommodate the needs of andthe costs to the utilities. DOT continues to seek ways to reduce overall project costs,including utility relocation, and has modified its policies and procedures, consistent withexisting state law, regarding when and how utilities are reimbursed. DOT continues towork with the utilities to make the process more efficient and reduce costs by developingprojects more closely with the utility industry, precisely identifying the locations ofutilities and, if possible from a highway and safety standpoint, designing around them.This approach is becoming more critical as the demand for use of the right-of-wayexpands with new technology. DOT is willing to share its successful approach withinterested municipalities on their projects, which constitute the largest number ofrelocations.
Encourage Use of More Fuel-Efficient Vehicles
Efforts to encourage energy efficiency in transportation have traditionally focused onencouraging the shift from SOVs to multi-occupant vehicles. While the fuel efficiency ofthe vehicle is unchanged, the multi-occupant vehicle trip is many times more energy-efficient than a SOV trip. Some government programs promote the purchase of morefuel-efficient vehicles, require stricter fuel economy standards on manufacturers (seelater section on CAFE standard), and offer tax rebates for the purchase of alternate-fuel
2 Passenger intermodal transportation centers are locations where travelers can switch from one mode of travelto another. Examples include subway or rail stops at airports and bus terminals co-located at passenger railroadterminals
2-70
vehicles. Each of these measures will provide some incentive for the traveling public tobuy and use more fuel-efficient vehicles.
The Quality Communities Initiative
The Governor’s Executive Order #102 created an interagency Quality Communities TaskForce that was charged with studying community growth in New York and assistingcommunities in implementing effective land development, preservation, andrehabilitation strategies that promote both economic development and environmentalprotection. The Task Force’s report, State and Local Governments Partnering for aBetter New York, identified elements critical to Quality Community development anddefined the challenges inherent in that development. Among the seven qualitycommunity principles recommended to improve the quality of life for the citizens of NewYork were enhanced transportation choices, more liveable neighborhoods, andsustainable development.
DOT’s participation on the Task Force reinforced the need to ensure that transportationplanned for the community is compatible with current and future communitydevelopment. A number of programs have been implemented or expanded that willbetter address community objectives and, at the same time, result in more cost-effectivedelivery of energy or reduced transportation sector energy demands. These include:implementing new and enhanced rural public transportation in the North Country andcountywide coordinated transit services in Sullivan County; planning for passengerintermodal transportation centers2 in Binghamton, Jamaica, New Rochelle, Poughkeepsie,Saratoga Springs, Rochester, Utica and Tompkins County; and, developing a freightintermodal terminal on Long Island. Successfully implementing these and otherprinciples will result in less VMT, reduced congestion, and improved traffic flow, allleading to less fuel use and improved energy efficiency.
DOT’s Main Street Initiative, where state highways traversing villages are reconstructedin ways that enhance the quality of life for residents and support the economic frameworkof rural "Main Streets," is underway across the State. Sidewalks, bicycle travel ways,and better transit access are all potential components of a Main Street initiative andencourage a more energy-efficient local transportation system.
2-71
Public Transportation
An efficient, safe, and environmentally sound public transit system is essential tomoving people in both rural and urban areas and is a fundamental part of the State'smulti-modal transportation infrastructure. The State's extensive public transportationnetwork provides mobility alternatives for residents in the State’s urban areas that areessential to the health of New York’s economy. Public transit also provides mobility forrural and elderly residents in the State's small towns and villages, without access to othermodes of transportation, to travel to medical, social service, and other necessary services. A direct result of NewYork’s extensivesupport for publictransportation is thefact that the State hasthe lowest per capitaenergy use fortransportation of anystate in the nation. Energy consumptionfor transportationpurposes in New Yorkis approximatelytwo-thirds the nationalaverage (Figure 8).
New York continues toexperience an unprecedented increase in using public transportation. Transit ridership inNew York not only accounts for one-third of the nation’s ridership, but in 2000, morethan 50% of the increase in national transit ridership occurred within the State. Much ofthe resurgence of public transit within the State can be attributed to the State’s fiscal andfare policies (as discussed below). Based on analysis provided by the American PublicTransportation Association (APTA), the average commuter who uses publictransportation conserves approximately 200 gallons of gasoline annually when comparedto driving alone. Based on this estimate, it is projected that the availability andconvenience of public transportation in New York results in the conservation of morethan 875 million gallons of gasoline or the equivalent of nearly 21 million barrels of oilannually.
2-72
State Public Transportation Assistance
Under the Governor’s leadership, the State has made and will continue to make importantcapital and operating investments to improve New York’s transportation system. NewYork provides $1.7 billion in operating assistance annually for public transportation,more than any State in the nation. Not only does public transportation support economicand environmental policies, the State’s significant financial assistance helps createenergy efficiencies while at the same time mitigates traffic congestion in the State’smajor urbanized areas. Including the Governor’s 2001-02 budget recommendation, Statesupport for public transportation operating assistance has increased by approximately22% since 1997 (Figure 9). The increases in State funding has allowed transit systems tomaintain and enhance public transportation services as well as enable the State and transitsystems to supportemerging publictransportation needs,including the following:suburban mobility,welfare-to-work, specialneeds of the elderly, andaccessibility for personswith disabilities. Thisstrong support hasenabled transit systemsin the State’s urbanizedand rural areas tomaintain fares at orbelow the nationalaverage making transit aviable and affordable transportation alternative. Assuming current funding levels, it isanticipated that the State will provide more than $8.5 billion in operating assistance overthe next five year period, resulting in the conservation of more than 4.4 billion gallons ofgasoline.
In addition, the Governor’s multi-year capital program has identified nearly $2.2 billionin State funding for the Metropolitan Transportation Authority’s (MTA) capital programfor the 2000-2004 period. For systems other than the MTA, the multi-year programincludes $146.0 million in capital assistance during this period. These new funds will beused for bus acquisition, maintenance facility improvements, and other regionally-
2-73
significant capitalprojects that areexpected to have apositive energy impactwithin the State.
Return on Investment
The return on Stateinvestment in publictransportation is clear. In 2000, ridership onservices receivingStatewide MassTransportation OperatingAssistance (STOA)increased by 7% to 2.4 billion trips annually - the largest ridership level since theprogram was authorized in 1974. Additionally, over the past five years, ridershipStatewide has increased by 31% (Figure 10). It is estimated that more than 70% of thesetrips are work-related,significantly supportingthe State’s economicgrowth. Assuming thatcurrent growthcontinues for thenational and Stateeconomies, no majorchanges in local farepolicies, and increasedroadway congestion, itis estimated that Statetransit ridership willcontinue to increaseover the next five yearsby approximately 5.0%annually to a level of 3.2 billion trips annually (Figure 11).
2-74
MetroCard Fare Policies/Incentives
Direct State support of public transportation has enabled transit systems in the State’surbanized and rural areas to maintain fares at or below the national average. In addition,the Governor has championed one of the most aggressive fare incentive policy programsin the nation within the New York City metropolitan area. In July 1997, MTA beganimplementing the MetroCard program on a system-wide basis for its operating services,for private bus services sponsored by the New York City Department of Transportation(NYCDOT), and for suburban bus service operated in Nassau County by MTA LongIsland Bus (MTA-LIB). The MetroCard program, a series of fare discounts offered byMTA, has proven beneficial in terms of increasing transit ridership thereby mitigatinghighway congestion and automobile pollution as well as increasing the State’s overallenergy efficiency.
The following are the fare discounts/incentives implemented under the MetroCardprogram since 1997:
C Free bus-to-subway or subway-to-bus transfer -- effectively eliminating the two-fare zone;
C Eliminated the fare for pedestrian passengers on the Staten Island Ferry;
C Established an 11-for-10 discount program whereby an individual who purchases10 rides will automatically get the 11th ride for free;
C Reduced express bus fares by 25% (from $4.00 to $3.00); and,
C Implemented 30-day, 7-day, and 1-day fun passes, which provide unlimited usefor those time periods.
As a result of fare incentives, ridership has dramatically increased on participatingsystems. For example, comparing the first half of 1997, before the MetroCard fareincentives went into effect, with the first half of 1999, after all the MetoCard fareincentives went into effect, finds that subway and bus ridership in New York Cityincreased 19%. Nearly 5% of that increase can be explained by the increase in thenumber of jobs created in New York City. The remaining 14% can be explained by thefare incentive program. Similar ridership increases occurred on NYCDOT private busand MTA-LIB services. Comparing 1996 annual ridership with 2000 annual ridershipfinds that NYCDOT ridership increased 33.8% and MTA-LIB ridership increased 16.6%. The State, through its Master Links initiative, is reviewing opportunities to extend
3 Again using the Staten Island Ferry as an example, its large Kennedy Class boats can carry upwards of6,000 persons per trip. The Staten Island Ferry takes a significant percentage of potential automobilecommuters from extremely congested highways and bridges that connect Staten Island with Manhattan.
2-75
MetroCard to all public transit services within the immediate New York CityMetropolitan area.
Commuter Choice
The Governor has proposed a new transit initiative to reduce the need for individualcommuting by New York State employees and further stimulate ridership for transitsystems around the State. This new initiative will allow employees to set aside up to$780 annually in pre-tax income to pay for public transportation and/or other eligiblecommuter expenses. The pre-tax transit benefit will apply to most forms of publictransportation services, including buses, trains, ferries, and vanpools.
Legislation is already in place that allows employers, including New York State, toestablish pre-tax programs for implementing Commuter Choice programs. CommuterChoice offers the opportunity for New York’s already energy-efficient transportationsystem to become even more energy-efficient (see the discussion on thetransportation/energy/air quality connection).
Ferries
Over the past several years there has been a resurgence in the use of ferries in New York. This resurgence has been especially noticeable in the New York City area, where 15 ferryroutes are operated carrying approximately 100,000 passengers daily. The publically-owned-and-operated Staten Island Ferry is by far the largest and serves 65,000 dailypassengers free-of-charge. The remaining private operators, which started service after1986, currently provide daily service to approximately 35,000 commuters. Ferries are oneof the most energy efficient means of transporting people.3 Accordingly, the presence ofthis ferry service has energy benefits not only because of its relatively low fuelconsumption but also because of its ability to divert passengers from longer and morecongested automobile trips.
Bicycle and Pedestrian Initiatives
Pedestrian and bicycle travel provides many benefits for the community. These includeimproved mobility, public health, and environmental quality, while at the same time
2-76
reducing vehicle congestion, emissions, and energy consumption. The State, through itsBicycle and Pedestrian Program at DOT, promotes the benefits of bicycling and walkingas an alternative to the continued-reliance on motorized vehicles for all trips. DOTrecognizes engineering, encouragement, and education as the keys to making the Statemore walkable and bikeable, and therefore, more energy efficient.
According to the 1995 NPTS statistics for New York, 14.7% of all trips in the State aremade by bicycling or walking, accounting for 1.2% of all personal miles traveled or 1.1million miles annually. Statistics from the 1994 National Bicycling and Walking Studyindicate that replacing automobile trips with non-motorized, energy- efficient bicyclingor walking trips would save between $.05 and $.22 for every automobile mile displaced,or between $55 millon and $242 million annually. To promote walking and bicycling,the State has created or sponsored thousands of miles of on-road bicycle facilities(including over 1,200 miles of state bicycle routes), tens of thousands of miles ofsidewalk, and over 16,000 miles of shared use and special use paths.
An important aspect of encouraging walking and cycling in New York State is to haveseamless linkage between walking and bicycling, and public transportation trips. National surveys have shown that many persons would walk or ride their bicycles to getto public transportation, if appropriate facilities were provided. Bicyclists would bemore willing to use public transportation if provided with: (1) suitable bicycle parkingfacilities where cyclists can store their bicycles, protected from the weather, theft, andvandalism; and, (2) bicycle racks on buses, thereby expanding the range that cyclists maypractically use their bicycles. For pedestrians, the facilities needed include: (1) a secure,well maintained shelter; and, (2) access to bus stops provided through designated paths orwalkways and effective street crossings that provide a direct linkage between their homeor work, and the transit stop.
Intermodal Transportation
The trend in the movement of both passengers and freight is toward intermodaltransportation. Intermodal transportation entails the use of multiple modes (e.g.,highway, rail, air, waterborne) of transportation to take advantage of the efficiencies andflexibility of each mode for specific portions of a trip. Figure 12 shows the distribution of
Source: US Census Bureau, 1997 Economic Census, Transportation - Commodity Flow Survey
1997 Shipment Characteristics by Mode From NYS To All Other States*
Value $(000,000) $290,350Tons (000) 281,014Ton-Miles (000,000) 40,249
ALL MODES
*Includes shipments within NYS
Figure 12freight shipments inNew York byvarious modes.Freight shipmentsfrom New Yorkwere valued atnearly $300 billionin 1997, the latestyear for which dataare available,representing over280 million tons.This is upsignificantly from1993 levels of over$260 billion and 220million tons. Freightshipments by truckwere the predominant mode of shipping, representing about three-fourths of all freightshipments. The advantages of developing multi-modal or intermodal alternatives includecost-efficiency through increased competition, increased transportation capacity throughnon-highway modes, and, energy savings due to the energy efficiencies of modes otherthan personal passenger cars or trucks used for intercity freight movement.
Technologies for truck and rail intermodal transportation effectively reduce energy use.Container-on-flatcar (COFC) and trailer-on-flatcar (TOFC) and bulk cargo transfertechnologies are both cost and energy efficient. To date, New York has not been able totake full advantage of these intermodal technologies because of vertical clearancerestrictions on rail lines serving some major markets, such as New York City and LongIsland, and because of the lack of intermodal transfer facilities. The State, in partnershipwith the Canadian Pacific Railroad, is working to address these physical constraints toenable full intermodal freight access to all areas of the State. Specific initiativesunderway or in the planning phase to better use existing rail and highway capacity, aswell as reduce energy usage include the following:
• Initiating a bridge-over-rail program that provides a minimum clearance of 17'-6"for TOCF and COFC trains and subsequently 20'-6" of clearance for all structuresbetween Montreal and New York City.
• Expanding the number of rail car barges and improving the rail infrastructure at
2-78
the New York Harbor to provide direct rail access from either Staten Island orNew Jersey to Brooklyn and other points in the New York City and Long Islandarea. This will divert truck traffic to rail and also eliminate the need for NewYork City rail traffic originating in the southern U.S. to be routed via Albany.
• Continuing development of a proposed freight intermodal center at the PilgrimState Hospital site in Islip, Long Island. This intermodal center will become akey facility for freight movement onto Long Island.
• Continuing ongoing work with other New York City-based agencies to identifyand implement improved rail access and intermodal facilities. Initiatives understudy include a rail tunnel between Staten Island or New Jersey and Brooklyn,improved freight port facilities in Brooklyn, and establishing a major freightintermodal facility at Maspeth, Queens.
In addition to these specific initiatives, the State is working with the major railroads toidentify projects in New York that can increase rail capacity, promote intermodaltransportation, and provide improved rail access for economic development.
INNOVATION AND NEW TRANSPORTATION TECHNOLOGIES
As in telecommunications and many other arenas, the use of new technologies anddevelopment of innovative applications of existing technologies to transportation servesto advance the state of practice and also makes the transportation system more energy-efficient. Innovative approaches to congestion and ridership patterns enable thetransportation system to meet basic transportation needs of the public within the contextof the current network.
Intelligent Transportation Systems
New advances in this technology are allowing even faster speeds through toll plazas,further reducing fuel use at these sites. A prime example is the E-Z Pass system, whichhas seen significant growth in use due to its ability to reduce delays at toll barriers. Figure 13 shows the trends in the numbers of vehicles using E-Z Pass tags.
ITS applies advanced technologies, such as information processing, communications,computer controls and electronics to implement new management, control, andinformation systems that improve transportation safety and energy efficiency, reduce
2-79
congestion, enhancemobility, minimizeadverse environmentalimpacts and promoteeconomic productivity.
DOT is advancing astatewide ITS programcalled NY MOVES. Strategic deploymentplans for this programhave been developed foreach of the majormetropolitan areas ofthe State (New YorkCity, Long Island,Hudson Valley, Albany, Rochester and Buffalo are complete - Syracuse is still beingdeveloped), as well as the small urban and rural areas.
The following sections summarize some of the key elements of ITS that are expected to significantly reduce energy use in the state:
Traffic Management Systems
Traffic Management Systems involve deploying sensors and traffic control devices toquickly detect and respond to traffic incidents. They facilitate improved real timemanagement of traffic on freeways and arterials, alert incident management patrols thatassist motorists, and improve traffic signal timing and operations. Also included areautomated systems that can expedite traffic flow at international border crossings. Table1 highlights the energy benefits of these type of projects. By 2006, ongoing and plannedITS projects are expected to reduce vehicle delay by about 42,000 hours daily.
Traveler Information Systems
Providing timely, accurate information on routing and current travel conditions allowstravelers to make smart choices on the best route, time, and mode, allowing motorists to
4USDOT Report No. FHWA/TX-99/1790-3 "ITS Benefits: Review of Evaluation Methods and ReportedBenefits" October 1998.
2-80
travel more efficiently and save fuel. A study of Long Island’s INFORM system4 showeda doubling of reported diversions to avoid delay when active messages providing specificrouting information(such as Delay Ahead - Choose X Alternate Route) were used ratherthan passive messages that provided general information (such as Delay Ahead - ChooseAlternate Route).
TABLE 1Energy Benefits of ITS Projects
Reduced Delay/Travel Time Reduced Fuel Consumption
FreewayManagementSystems:
30% reduction in travel time for recurring delay,60% for non-recurring delay
Up to 41% during congestionperiods
IncidentManagementPrograms:
Time to detect and clear incidents on theGowanus Expressway reduced for 90 minutes to31 minutes (61%) with breakdowns reduced to19 minutes
Predicted fuel reduction of 41.3million gallons (42%)
Traffic SignalSystems:
17 - 37% 6 - 12%
Public Transportation and Multimodal Traveler Information Systems
Sustaining the high levels of transit ridership that account for New York’s uniquelyenergy-efficient transportation network requires careful attention to the needs of thetransit rider. Providing reliable, convenient, comfortable, and easy-to-navigate service, isessential to sustaining ridership among customers with transportation choices.
Transit ITS systems are becoming increasingly popular among New York’s transitproviders. Transit ITS has three major emphasis areas:
• Increasing the efficiency and reliability of transit service by managing the fleetbased upon real-time performance information;
• Improving customer access to service information such as customized itinerariesthat permit them to navigate the transit system from door to door, or next-busarrival information at bus stops to improve the customer’s confidence in thereliability of the service; and,
5 The new turboliners will have two-1600 horsepower diesel turbine power units -- one in each of the twolocomotives, which will be located at opposite ends of the train. The diesel power units are quieter, cleaner,more fuel efficient and less polluting than other passenger train equipment. Each trainset is also equipped tooperate on third rail electricity.
2-81
• Improving the convenience of transit use by providing more options and ease infare payment.
Nearly all the major urban transit systems in New York have or are procuring automatedvehicle location (AVL) systems. These systems provide dispatching and control centerswith real time information on bus location and on-time performance information.
ITS Research and Development
The State actively participates the national ITS Automated Highway System program.This is a long-term program that is assessing and developing prototype systems toautomate the vehicle/driver operation so that vehicles can safely travel at high speeds andclose headways. This system has the potential to double the capacity of each highwaylane, significantly reducing congestion and accruing the associated energy benefits ofmore consistent speeds, fewer stops, and less time idling. While an automated highwaysystem is estimated to be at least 20 years from becoming fully-operational, this researchshould lead to incremental improvements in the vehicle, accruing benefits within the nextfew years. A prototype system was tested in San Diego, California in 1997.
High Speed Rail Program
The State and Amtrak are advancing a $200-million program to bring high-speed railservice from New York City, through Albany and on to Buffalo (the Empire Corridor). The program includes the re-manufacturing of seven high-speed turboliner trainsets aswell as track and signal improvements. The High Speed Rail Program will reduce traveltime, offer more frequent and reliable service, and improve passenger amenities, resultingin an expected increase in ridership along the Empire Corridor by as much as 150percent. This ridership increase means less automobile travel, resulting in substantialtime and energy savings.5 Rail infrastructure projects include safety improvements atboth public and private grade crossings, new track, bridge rehabilitation, curvestraightening, and signal improvements.
DOT is also testing the feasibility of new military propulsion technology to improve thethird rail propulsion systems on the trainsets. The new technology involves light-weight,
6The Clean Fueled Vehicles Council includes the following members:Department of Agriculture and Markets New York State Thruway AuthorityDepartment of Correctional Services Office of Children and Family ServicesDepartment of Environmental Conservation Office of General ServicesDepartment of Motor Vehicles Office of Mental HealthDepartment of Transportation Office of Mental Retardation andDivision of the Budget Developmental DisabilitiesEmpire State Development Corporation Office of Parks, Recreation andNew York Power Authority Historic PreservationNew York State Energy Research and State University of New York Development Authority Department of Taxation and Finance
2-82
high-speed motors and control systems recently developed for the military and nowavailable for civilian applications.
ALTERNATIVE FUELS AND ALTERNATIVE FUEL TECHNOLOGIES
One of the most prominent and significant developments in recent years has been alternate-fueled vehicles (AFVs) and the technology and infrastructure associated withthem. This technology is a highlight example of innovation and application of new (aswell as existing) technology in the transportation sector.
Alternate Fuel Vehicles
Governor Pataki’s 1996 Clean Water/Clean Air Bond Act stipulated creating a clean-fueled vehicle program by the Office of General Services, for the purpose of acquiringclean-fueled vehicles for State use and testing, and for evaluating clean-fueled vehicletechnologies. The driving force behind this program is the Clean-Fueled VehiclesCouncil (Council), established in 1998.6 The Council ensured that State governmentwould move quickly in a coordinated approach to using AFVs in their daily operations. In mid-1999, the Council began formulating a comprehensive fueling infrastructure planto accommodate the State’s growing fleet of AFVs. In formulating an overall Statewideinfrastructure plan, compressed natural gas (CNG) was determined to be the mostsuitable fuel at this time.
When fully implemented, a two-phase plan will double the number of existing CNGfueling stations in the State. Phase I calls for 30 low-volume FuelMaker CNG sites atDOT facilities across the State. These sites are open to State vehicles only, and arecapable of producing up to 100 gallons of CNG per day. The first station was opened inJune 2000 and since then, 29 more have opened. Phase II calls for up to 16 high-volumeCNG stations capable of dispensing a minimum of 500 gallons per day under a joint
2-83
Figure 14
public/private partnership. State agencies provide the land and the private-sectorconstructs and operates the fueling stations. These fast-fill CNG stations, installedstrategically around the State at DOT, New York State Thruway, Office of GeneralServices, and Corrections facilities will be commercially-operated and open to the public.
The fuel infrastructure plan also addresses the need for other alternative fuels, andincludes installing a number of electric vehicle charging sites. As an initial step, sevencharging stations have been installed at the Empire State Plaza in Albany toaccommodate visitors. In addition, the feasibility of establishing ethanol and propanefueling stations is being addressed.
The Federal Energy Policy Act of1992 (EPAct) requires stateagencies to acquire AFVs inincreasing annual percentages oftheir fleet light-duty vehiclepurchases, beginning in modelyear 1997. EPAct further requiresannual reporting to the U.S.Department of Energy (U.S.DOE). As shown in Figure 14,New York has exceeded federally-mandated acquisition requirementsunder EPAct for the past threeyears as follows:
1998 Goal 15%; NewYork achieved 22.25%1999 Goal 25%; New York achieved 40.26%2000 Goal 50%; New York achieved 57.70%
New York expects to continue to meet or exceed EPAct goals, which increase to 75% for2001 and thereafter. As of July 1, 2001 New York has acquired 1416 AFVs. In calendaryear 2000, New York purchased 200,000 gasoline-gallon equivalents of CNG. Incalendar year 2001, this figure jumped to 750,000 gasoline-gallon equivalents.
New York is working with the Northeast states in a united effort to influence thedirection of alternate fuel programs. The principal features of New York’s clean-fueledvehicle program model - creative planning, multi-agency participation, and promoting
2-84
favorable manufacturer relations - are strategies that can be easily adapted by other states.
To underscore the importance of AFVs in meeting New York’s transportation, energy,and environmental goals, Governor Pataki, in Executive Order 111, directed that, by2005, at least 50% of State agencies’ light-duty vehicle purchases must be AFVs. By2010, this percentage increases to 100%. The Executive Order covers all agency vehicles,regardless of the number of vehicles in the agency’s fleet or where they are assigned.
New York Power Authority Electric Transportation Program
The NYPA Electric Transportation Program is actively engaged in initiatives that employelectricity as a transportation fuel to address concerns about clean air, noise pollution,and traffic congestion.
NYPA is the nation’s largest supplier of electricity for mass transit, powering the subwayand commuter trains of metropolitan New York City. In addition, NYPA has put intoservice several hundred electric cars, light trucks, buses, vans, and other vehicles for useby its customers and at its own facilities. In 2000, those vehicles achieved the ‘millionmile mark’ for combined AFV-mileage, making NYPA the first utility in the Northeast toachieve this milestone.
The array of NYPA electric vehicle projects includes hybrid-electric transit buses,station/commuter cars, all-electric school buses and shuttles buses, small urban electricvehicles and electric delivery vans and trucks. In October 2001, NYPA and Ford MotorCompany’s electric vehicle group, TH!NK Mobility, launched the “Clean Commute”commuter station car demonstration in cooperation with MTA, NYSERDA, the LongIsland Power Authority, DOT, New York City Department of Transportation, and U.S.DOE. The demonstration program will lease 200 electric vehicles to passenger railcommuters in the metropolitan New York City region.
Alternative Fuel Technology for Transit
New York is a national leader in combining transportation improvements withenvironmental benefits and new energy technologies. In 1991, the State sponsored aconsortium of transit systems interested in alternative fuel development. As a result ofthe initial consortium pilot, several transit systems around the State have committed tomainstreaming AFVs into their urbanized-area fleets. Most transit systems currently useCNG-powered buses and MTA-New York City Transit is also making a significantcommitment to utilizing hybrid-electric buses. Incorporating alternative-fuel buses into
2-85
transit fleets has steadily increased, from 31 in 1991 to more than 2,300 programmedthrough 2004. In addition, MTA-New York City Transit has stated that all its purchasesof standard-sized buses after 2004 will be as clean as AFVs. Relatedly, bus depots arebeing converted to facilities that can store and refuel these buses.
The most significant impediment to further expanding the use of AFV technology is itsincremental cost and the associated infrastructure. To mitigate the impact of costassociated with AFV deployment, NYSERDA, in cooperation with DOT, has beenproviding competitive awards from the Clean-Fueled Bus Program (authorized under the1996 Clean Water/Clean Air Bond Act) for the purchase of alternative fuel buses. TheClean Fueled Bus Program makes funding available annually to cover the incrementalcost of procuring alternative-fuel transit buses and infrastructure.
Alternative Fuel Technology for the Private Sector
To promote fuel diversity and efficiency, it is important that private sector fleets begin toadopt alternative fuel technologies. Progress is being made in this area, primarily as aresult of government incentives. NYSERDA is using approximately $6 million of federalCongestion Mitigation and Air Quality Program (CMAQ) funds to support introductionof natural gas, electric, and hybrid-electric vehicles in New York City, including heavy-duty trucks, delivery vehicles, and taxis. A similar program is operated on Long Islandthrough the local Clean Cities organization. Other federal funds awarded to New Yorkare used for projects to develop the necessary fueling infrastructure to support furtherintroduction of alternative fuel vehicles in all sectors.
The New York Alternate Fuels Tax Credit program for placing these vehicles sunsets in2002; the tax credit for manufacturers sunsets in 2003. The alternate fuel incentivesdescribed above have been a success. A program that includes: all types of alternate-fuel,light-duty vehicles; medium- and heavy-duty vehicles for the same vehicle technology;and incentives for alternative fuel providers to encourage their availability (such as acredit for every gallon of gasoline equivalent provided and/or a credit for installationcosts of alternate fuel infrastructure) is expected to induce even greater penetration ofthese vehicles into fleets.
Energy Research Program
New York is committed to investigating and testing the economic, energy, andenvironmental factors aggressively for all emerging alterative-fuel technologies, and to
2-86
advance the most appropriate technologies and combinations of technologies that addressand support the State’s needs. Based on viability and cost effectiveness, CNG andliquefied natural gas (LNG) are currently the focus of short-term and long-rangeplanning. New York promotes the research, development, deployment, and use of allfuels and technologies designed to improve air quality and reduce the reliance onconventional energy sources.
The Clifton Park Rest Area on Interstate Route 87 was selected by NYSERDA todemonstrate fuel cell technology. Three 7.5-kW-rated fuel cells are being tested there,and three additional fuel cells were recently installed at a Saratoga County maintenancefacility. Funding was provided from the 1996 Clean Water/Clean Air Bond Act. Incollaboration with other State agencies, authorities, universities, and private industry, theDOT State Planning & Research Program (SPR), makes funding available for researchprojects, many of which will reduce the demand for transportation-sector energy.
THE TRANSPORTATION/AIR QUALITY/ENERGY CONNECTION
New York continues to be a national leader in meeting the challenges of improving airquality to healthful levels in all parts of the State. Although New York’s air qualitycontinues to steadily and dramatically improve, there is still much to be done, especiallyin the New York City metropolitan area. Transportation has a role in achieving air qualitygoals through more energy-efficient transportation systems.
Lead emissions and concentrations have been reduced to the point where lead is nolonger considered a transportation-related air pollutant. Carbon monoxide levels andparticulate matter less than 10 microns (PM10) have also improved to such an extent thatattaining National Ambient Air Quality Standards is anticipated soon. Meeting the one-hour ozone, eight-hour ozone, and particulate matter less than 2.5 microns standards,however, will require more effort.
A list of transportation measures that are under consideration to reduce emissions ofozone precursors and, thereby, help lower ozone concentrations is shown in Table 2. Thelist includes measures that have been considered previously in New York or elsewhere inthe nation. It also includes measures that have not been traditionally considered astransportation actions available to reduce emissions (e.g. construction and maintenanceequipment). Each measure also has costs to government or industry that affect itsfeasibility as an emissions reduction alternative.
The measures in Table 2 are being considered in a three-phased approach. The first phase
2-87
has DOT taking actions to improve air quality. Given the size and importance of itscapital programs, DOT can influence other transportation agencies to take similar steps.The second phase includes the federal government and other regional and localgovernments. Collectively, these governments can provide substantial air quality benefitsthrough coordinated implementation efforts. The last phase carries this effort to includethe private sector in the metropolitan areas, which can yield maximum emissionsreduction benefits.
For improving air quality, the more effective measures include the following: limitingemissions from construction and maintenance equipment; implementing CommuterChoice and Ozone Action Day programs; limiting emissions from bridge painting andtraffic marking operations; coordinating traffic signals; and retrofitting diesel equipment. Some measures that improve air quality also reduce energy use. The Commuter Choiceand Ozone Action Day programs are effective in reducing transportation energy use. Forenergy considerations, replacing standard traffic signal light bulbs with energy-efficientlight emitting diodes (LEDs), enhancing transportation system management measures(such a carpooling, van pooling, etc.), and enforcing speed limits can provide substantialenergy benefits. The last two measures are not particularly effective in reducing ozoneprecursor emissions. The measures listed in Table 2 are shown in Table 3 for ozoneprecursor reductions and in Table 4 for energy reductions. Tables 3 and 4 also includeinformation on program costs and cost-effectiveness. A measure that reduces ozoneprecursor emissions may not save energy.
New York is committed to operating an energy-efficient and low-polluting transportationsystem. Examining and analyzing the transportation system’s energy consumption and airemissions when long-range plans and Transportation Improvement Programs are adoptedwould enhance this commitment. This examination could be on a build/no build basis andinclude public review. If a plan or a program increases air emissions or uses more energythan doing nothing at all, additional measures or modifications to the plan or programcould be considered to minimize the increases as much as practicable. This review wouldbe in addition to existing federal and State requirements to address transportationconformity regulations in air quality non-attainment and maintenance areas.
2-88
TABLE 2Possible Transportation Actions to Reduce Emissions
Possible Actions
Construction equipment: limit/avoid use of heavyduty off-road equipment. Continue and expandnighttime construction. Limit use of equipment top.m. periods and/or Ozone Action Days.
Enhance bicycle/pedestrian programs e.g bikeracks on busses, bike lanes, pedestrian crossings,and connections.
Maintenance equipment: limit/avoid use of smalland medium engine equipment such as lawnmowers/tractors, chainsaws, and weedwackers. Limit use of equipment to p.m. periods and/orOzone Action Days.
Alternate fuels: private, transit, state, local fleetsconversions to alternate fuels, promote/reward useof alternate fuels, clean engines inconstruction/maintenance equipment.
Ozone Action Days: continue Ozone Action Days.Extend public education/outreach to encouragealternative travel and avoid actions that pollute.
ITS: improved incident response, corridormanagement with optimized signals.
Commuter Choice, Parking Cash-out programs. Speed limit reduction and enforcement.
4 Commuter ChoiceTotal Metropolitan Area 0.5 - 6.9 0.4 - 4.6 $123,750,000 $123,750,000 $49,136 $73,705Government Component 0.5 - 6.9 0.4 - 4.6 $123,750,000 $123,750,000 $49,136 $73,705NYSDOT Component 0.0 0.0 NA NA NA NA
5 CoatingTotal Metropolitan Area 0 0.03 - 3.9 NA $3,489,714 NA $2,452Government Component 0 0.03 - 0.56 NA $542,844 NA $2,656NYSDOT Component 0 0.03 - 0.5 NA $92,284 NA $506
6 Signals-replace fixed time with ActuatedTotal Metropolitan Area 0.154 0.463 $4,671,875 $4,671,875 $83,012 $27,671Government Component 0.154 0.463 $4,671,875 $4,671,875 $83,012 $27,671NYSDOT Component 0.020 0.061 $703,125 $703,125 $95,506 $31,835
7 LEDTotal Metropolitan Area 0.04 0.01 -$15,923,561 -$15,923,561 NA NAGovernment Component 0.04 0.01 -$15,923,561 -$15,923,561 NA NANYSDOT Component 0.005 0.001 -$2,396,523 -$2,396,523 NA NA
10 BikePedTotal Metropolitan Area 0.036 0.02 $4,345,511 $2,437,726 $327,090 $327,090Government Component 0.036 0.02 $4,345,511 $2,437,726 $327,090 $327,090NYSDOT Component 0 0 NA NANA NA
11 AltFuelsTotal Metropolitan Area 27.4 -0.19 $126,147,408 NA$12,610 NAGovernment Component 7.6 -0.05 $35,000,000 NA $12,610 NANYSDOT Component 0.01 0 $40,000 NA$10,959 NA
12 ITSTotal Metropolitan Area -0.01 0.077 Net Savings Net Savings NA NAGovernment Component -0.01 0.077 Net Savings Net Savings NA NANYSDOT Component -0.01 0.077 Net Savings Net Savings NA NA
13 SpeedLimTotal Metropolitan Area 0.68 0.087 $14,040,000 $14,040,000 $56,872 $440,662Government Component 0.68 0.087 $14,040,000 $14,040,000 $56,872 $440,662NYSDOT Component 0 0 NA NANA NA
14 PubTransTotal Metropolitan Area 0.12 0.37 $2,500,000 $2,500,000 $57,078 $18,512Government Component 0.12 0.37 $2,500,000 $2,500,000 $57,078 $18,512NYSDOT Component 0 0 NA NANA NA
15 Cong PricingTotal Metropolitan Area 0.2 0.3 $52,328,065 $52,328,065 $645,161 $444,444Government Component 0.2 0.3 $52,328,065 $52,328,065 $645,161 $444,444NYSDOT Component 0 0 NA NANA NA
19 IdlingTotal Metropolitan Area 0.02 0.03 $14,040,000 $14,040,000 $1,966,493 $1,433,416Government Component 0.02 0.03 $14,040,000 $14,040,000 $1,966,493 $1,433,416NYSDOT Component 0 0 NA NA NA NA
20 RetrofitTotal Metropolitan Area 0 0.54 NA $5,250,000 NA $52,798Government Component 0 0.54 NA $5,250,000 NA $52,798NYSDOT Component 0 0.27 NA $2,625,000 NA $26,556
TBD - To be determined NA - indicate no cost is applicable because no reduction of the corresponding pollutant is calculated. Numbers in parentheses ( ) are negative cost values.
2-91
ENERGY ISSUES RELATED TO TRANSPORTATION ENERGY AT THEFEDERAL LEVEL The Federal Transportation Equity Act for the 21st Century (TEA-21) provides fundingfor highways and transit. TEA-21 expires on September 30, 2003. Work has alreadybegun to reauthorize TEA-21. The reauthorized TEA-21 would help New Yorkersconserve energy and reduce pollution while enhancing the mobility and safety of goodsand people to expand the regional economy.
Increase Federal Funding For Transit
New York has one-third of the nation’s transit users. As a result of this heavy transit use,New York has the lowest-per-capita gasoline consumption in the nation. Transitridership is growing at record rates nationwide, but especially in New York. The corecapacity of New York’s transit system is inadequate to meet this new demand for service. Increased federal transit funding is needed to maintain the existing system and increaseits capacity.
Communities across the nation are constructing new transit systems. The TEA-21 NewStarts program provides funds to extend existing rail and subway systems or build newsystems. Currently, 190 New Starts projects are authorized for development nationwidewith a total value estimated at $ 75 billion. TEA-21 has made only $ 3.7 billion availableto develop these projects. In New York, the authorized New Starts projects that havereceived federal funding are listed in Table 5. To meet the current demand for new transitservice, Congress must increase New Starts funding in the next surface transportation act.
Retain the Congestion Mitigation And Air Quality Program
The CMAQ program provides funds to implement transportation projects that reduce airpollution in air quality non-attainment areas. Many of these projects not only reduce airpollution, but also reduce fuel consumption. For instance, CMAQ funds have been usedto fund rail freight projets and an electric station car pilot project in the New York Citymetropolitan area, and other transit projects in communities across the State. CMAQfunding is also an important source of funding for Governor Pataki’s High Speed RailPlan. The CMAQ has a vital role in New York’s energy conservation strategy.
2-92
Continue Funding for ITS and Transportation System Operations
Information technology is an important tool for improving the energy efficiency of thetransportation system. TEA-21 provides funds to deploy ITS technologies that providetraveler information, help manage traffic incidents, manage traffic flow, improve themovement of freight, ease the connections between modes, and provide data on thesystem’s condition and performance. Continued Federal funding for ITS will help makethe transportation system operate more efficiently and save energy.
TABLE 5New York TEA-21 New Start Projects with Funding Authorizations
ProjectFFY 1998-2003Authorization
AppropriationsTo Date
% ofAuthorization
Long Island Rail Road East Side Access $353.0 $53.6 15.2%Second Avenue Subway $5.0 -- --Staten Island - Whitehall IntermodalTerminal (1)
(1) FFY 2001 appropriation allocated to Whitehall/St. George.
Modify TEA-21 Programs To Improve Rail Service
Freight traffic is expected to double in the next twenty years. The highway systemcannot absorb this traffic growth. The Northeast Association of Transportation Officials(NASTO) is leading an effort of to prepare a strategic multimodal international freightinvestment plan for the Northeast trading bloc, which extends from Halifax, Nova Scotiato Norfolk, Virginia to Chicago, Illinois. The plan will identify major bottlenecks in theexisting freight transportation system and recommend strategic capital and operatingimprovements for the regional system.
Although TEA-21 is primarily aimed at providing Federal funding for the highway andtransit systems, there are some elements of TEA-21 are designated for improving railservice. The Transportation Infrastructure and Innovation Act of 1998 (TIFIA) providesloan guarantees and credit enhancements for major rail transportation projects. WhileTIFIA could be a powerful tool for promoting investment in energy-efficient rail projects,the project threshold size of $100 million limits the usefulness of the program. TEA-21also established the Railroad Rehabilitation and Improvement Financing (RRIF)program, which provides credit enhancements to fund investments in regional and
2-93
shortline railroads. Providing Federal funds to underwrite the risk premium on loans toshortline and regional railroads will help ensure that rural New York will continue tohave access to energy-efficient rail freight transportation. Corporate Average Fuel Economy Standards
Since the initial oil crisis in 1973 and throughout subsequent episodes in the late 1970s,passenger automobile fuel economy has been a significant transportation energy issue. The authority to administer a program for regulating new passenger and light-truck fueleconomy standards was delegated to the Secretary of Transportation by the MotorVehicle Information and Cost Savings Act of 1972. In 1975 the Energy andConservation Act established Corporate Average Fuel Economy (CAFE) standards thatwere initially implemented for all passenger cars in 1978 and for light-duty trucks in1979. CAFE standards for passenger cars were established at a minimum level of 27.5miles-per-gallon for model year (MY) 1985 and have been frozen at that rate throughMY 2002. Light-duty truck standards have been frozen at the 1996 rate of 20.7 miles-per-gallon through MY 2002. Increasing the CAFE standards for passenger cars andlight-duty trucks for model years beyond 2002 will conserve needed energy.
Given the most recent national VMT projections, which assume that annual highwayinvestment will stay at the 1997 funding level for the next 20 years, urban VMT can beexpected to increase at an annual average rate between 1.78% and 1.83%. Rural VMTcan be expected to increase at an annual average rate between 2.68% and 2.72%.Conversely, vehicle fuel economy performance for passenger cars and light-duty truckshas decreased by 1% over the 10-year period from 1990 to 2000. Fuel economyperformance for the entire fleet was 25.4 mpg in 1990 and at 25.2 mpg in 2000. FINDINGS AND CONCLUSIONS
• New York has the most energy efficient transportation sector in the United Statesdue to its high-per-capita-use of transit. One-third of all national transit trips arein New York. The use of public transportation is experiencing unprecedentedgrowth, averaging approximately 5% annually.
• Statewide, VMT and congestion (especially urban congestion) continue toincrease, but VMT should grow at a slower rate in the future. Transportationsystem management, technology improvements, and capital construction projectsare underway to reduce the growth in congestion. Freight truck traffic increasesare of concern.
2-94
• Bicycle and pedestrian initiatives, passenger ferry service, intermodal freightcapabilities, and high-speed rail efforts are important measures to increase theenergy efficiency of New York’s transportation sector.
• New York has made a significant commitment in AFV technology. More than1400 State-owned AFVs and over 50 commercial CNG stations are in use.Executive Order 111 requires State agency purchase of light-duty vehicles to be100% AFV by 2010.
• Progress in reducing the transportation sector’s energy use and air emissions isongoing and will continue in the future through measures such as CommuterChoice, Ozone Action Days, and traffic signal coordination. Quantitative buildand no-build energy and emissions analyses of transportation plans and programswould facilitate continued energy and environmental benefits.
• Energy efficiency can be enhanced by actions at the federal level. Reauthorizingfederal surface transportation legislation can substantially affect New York’sstatus as the most transportation-energy-efficient state by providing fortransportation programs that enhance energy efficiency and reduce emissions.
• Fuel economy standards for vehicles have the potential to be the most significantaction to conserve energy in the transportation sector. Fuel economy standards forpassenger cars have been frozen since 1985 and for light duty trucks since 1996.Fuel economy generally, has worsened between 1990 and 2000.
2-95
SECTION 2.5
PRESERVING ENERGY-RELATED PUBLIC BENEFITSPROGRAMS
INTRODUCTION
New York’s support for open and competitive energy markets includes, as a component,continuing public benefits programs that serve the State’s residents and businesses. Italso requires maintaining necessary and appropriate consumer safeguards against marketabuse, while promoting the benefits of retail competition. Public benefits programsprovide energy efficiency and related services to smaller customers and low-incomehouseholds, support development of markets for energy-efficient product manufacturing,stocking and sales, and support research and development (R&D) activities in renewableenergy development, new product development and applications, and environmentalprotection. This Section identifies and reviews the public benefits programs offered byNew York State, assesses their effectiveness in meeting public policy goals, and reportson additional efforts that might be required to continue to balance competitive energymarkets with continuing public needs.
HISTORY OF PUBLIC BENEFITS: PROGRAMS AND GOVERNMENT’S ROLE
Prior to the beginning of electric utility restructuring in New York, public benefitsprograms were provided by utilities, local, state and federal governments, and not-for-profit and community-based organizations (CBOs). Over the past 12 years, there havebeen at least four major transformations in the programs. Figure 1 presents thesetransformations chronologically.
With respect to low-income customers, the earliest investor-owned utility public benefitprogram in New York State was approved by the Public Service Commission (PSC) in1988. The program, a pilot project entitled the Power Partnership Pilot, was administeredby the Niagara Mohawk Power Corporation. The design of this program, which testedthe utility company’s ability to provide comprehensive energy efficiency services to low-income customers, influenced the design of future programs. Prior to 1988, low-incomepublic benefits funding in New York State was provided by federal sources for programssuch as the Low-Income Home Energy Assistance Program (LIHEAP) and through theWeatherization Assistance Program (WAP), both administered by the New York StateDepartment of State.
Utility Low-Income Energy Efficiency Program (ULIEEP)
Systems Benefits Charge (SBC) New York Energy
$martSM Program & Continuation of Some Utility-
Run Programs
New York State Investor-Owned Gas and Electric Utility-Run Low-Income
Programs
1 2 3 4
Pre-1988
Federal Funding for - LIHEAP
- WAP
Figure 1. Transformation of Utility and Government-Based Low-Income Programsin New York State
The first statewide comprehensive program targeting low-income customers was implemented shortly after the Niagara Mohawk pilot, and was named the Utility Low-Income Energy Efficiency Program (ULIEEP). This program was established by a June1991 Public Service Commission (PSC) order. Through the ULIEEP program, gas andelectric utilities in New York were directed to provide energy efficiency services,including weatherization services, to low-income customers for approximately threeyears. As the State began to restructure the electric industry, and as competitive marketforces began to exhibit a presence, the role of government in providing services to low-income and other energy customers lacking market influence, increased. Mindful that acompetitive energy market might reduce services targeting these energy customers, theSystems Benefits Charge (SBC) public benefits program was established.
Continuing Energy Public Benefits Programs
In New York, there continues to be a subset of energy customers who either lack marketstatus, representation, and influence, or are limited in their ability to make informedenergy decisions. These customers can include: residential and low-income customers,small business customers, and municipal and institutional (including educational andhealthcare) customers. Some of these energy customers pay a larger percentage of theirincome for energy costs than higher income customers, which can be exacerbated by theinability of these customers to overcome market barriers to improving energy efficiencyand reducing energy use and bills. These market barriers include, lack of information,limited financial resources, and high transaction costs associated with energy-efficient
1 New York State Energy Research and Development Authority. System Benefits Charge: ProposedOperating Plan for the New York Energy $martK Programs (2001-2006), February 15, 2001.
2 This represents 16.7% of New York State’s total resident population.
3 Statistical Abstract of the United States, The National Data Book. U.S. Department of Commerce, 120th
Edition, 2000, p. 477.
2-97
goods and services. All of these barriers contribute to reduced market influence andreduced ability to realize the full potential of competitive energy markets for these energycustomers.
Residential, Including Low-Income, Energy Customers. New York has 3.7 millionresidential buildings, which account for 17% of the State’s total energy use, includingelectric generation. By fuel type, the residential sector used 33% of the electricity, 26%of the natural gas, and 12% of the petroleum used in the State. The residential sectoraccounts for approximately one-third of the total annual State energy expenditures,approximately $10.9 billion per year, more than any other sector in the State.1
New York State has an estimated 550,000 units of publicly-assisted low- and moderate-income multifamily housing, many of which are heated with electricity. The State hasspent over $800 million annually to assist low-income residents in multifamily publichousing to reduce their energy burden. Even with such a large investment, energyefficiency measures have been difficult to implement in this sector because of barriers,such as limited access to financing by low-income tenants, and disincentives to non-owner occupied buildings and tenant conversions.
More than 3 million New Yorkers2 live below 125% of the poverty level, and areconsidered low-income residents on this basis.3 The energy burden for low-incomecustomers, defined as the ratio of energy costs to income, ranges between 25 - 30%,compared to 3 to 8% for higher-income households. Additionally, the private residentialhousing stock for low-income households is generally poor and energy inefficient. Muchof New York’s publicly assisted housing has high energy costs as a result of usingelectric-resistance heat in poorly insulated buildings. The combination of poor housingstock, high energy costs, and New York’s cold winter climate results in low-incomehouseholds facing serious energy hardships. The potential for improved energyefficiency in public housing and for the low-income sector is estimated to range between12-30%.
Small Business Energy Customers. Small business customers in New York State faceseveral barriers to reducing their energy costs and becoming more energy-efficient. For
4 New York State Energy Research and Development Authority. System Benefits Charge: ProposedOperating Plan for the New York Energy $martK Programs (2001-2006), February 15, 2001.
2-98
example, small businesses often do not take advantage of energy efficiencyimprovements simply because they are more focused on their core mission and do nothave the in-house technical expertise to identify, evaluate, and implement these types ofimprovements. Additionally, small businesses are often faced with higher transactioncosts to develop their knowledge base, retain private-sector energy efficiency services,and participate in government sponsored programs.4
Since profit margins and opportunities for replication are lower in this sector for energyservice companies (ESCOs), industry hesitates to develop services for small-andmedium-sized customers or for business processes that are more complex than simplebuilding systems. Consequently, small-and medium-sized businesses have a difficulttime finding technical services or financial assistance to improve their operationalefficiency. Once energy efficiency opportunities are identified by service providers,business owners are skeptical of the energy-savings claims, and lack the financialresources to implement the suggested energy efficiency improvements.
The amount of electricity used to operate motors and lighting is about 60% of NewYork’s commercial and industrial electric energy use and 40% of the State’s total electricenergy use. Office, retail, and restaurant space have a high turnover rate each year,resulting in frequent remodeling and renovation projects. Renovation projects, as well asnew building construction, often do not include cost-effective energy efficiencymeasures. Motors are integral to facility operations such as powering fans, machinedrives, and pumps in small and medium-sized businesses, including light manufacturingand product-assembly facilities where process energy is a major energy concern.Reducing the energy costs of small businesses, through energy efficiency improvementsin end-uses such as motors and lighting, can help to lower their product and service costs. Reduced energy costs have been shown to assist small businesses in creating andretaining jobs.
Municipal, Institutional, and Educational Energy Customers. Across the State, municipaland institutional buildings (including educational, government, not-for-profit, andhospital) use large amounts of energy while investing very little to improve energyefficiency. For example:
• The State owns and operates more than 8,000 buildings, with energy costs thattotal nearly $300 million annually. Over the past ten years, the limited capital
2-99
that has been invested in energy improvements in State-owned buildings has beenused for short payback improvements, such as high-efficiency lighting.
Institutions face similar barriers as those experienced by State and local governments.For example:
• The 711 public K-12 school districts in New York spend nearly $400 millionannually on energy, which is more than what is spent for books and computerscombined. School districts often lack the capital or expertise to reduce theirenergy use.
• New York State has more than 200 hospitals and health-related facilities
representing more than 300 million square feet of floor space. Health careadministrators and facility managers struggle to improve patient care and comfortwhile reducing operating costs in their facilities. The size of health care facilitiesand the nature of the services they provide result in higher unit energy costs thanall other institutional buildings.
The energy needs and requirements of municipal and institutional energy customers can be met through market-based, as well as government sponsored programs. In June 2001,Governor George Pataki issued Executive Order 111 requiring that all State agencies,departments, and authorities seek a 35% reduction in energy use by 2010, relative to theirenergy use in 1990. In addition, each agency, department, and authority is directed topurchase 10% of their energy from renewable energy sources by 2005, increasing to 20%by 2010. Compliance with the Order by local governments and school districts is beingactively encouraged. By seeking to reduce its own energy use, improve its energyefficiency, and improve its environment, New York is striving to eliminate barriers toenergy efficiency and become a national leader in energy efficiency.
Research and Development, Including Renewable Energy Efforts. In New York, publicbenefits funding for research and development (R&D), including renewable energyprograms, is being provided to build a sustainable market for the production and sale ofstrategic and renewable energy technologies and for the development of “green” energymarkets. These programs provide energy security within the State by helping to establisha more balanced and strategic portfolio of energy resources and support technologies.
Opportunities still exist to promote strategic and environmental R&D as well asrenewable energy programs in the State. For example:
• Generating electric power with renewable energy technologies offers theopportunity to reduce air emissions associated with power generation and bring
2-100
power production closer to the consumer.
• The use of photovoltaic (PV) technology to offset peak power demand is oneexample of the value of renewable energy. During the July 1999 New York Citypower shortage, the photovoltaic energy potential was coincident with the peakpower demand and was at 93% of the maximum achievable on a clear, cloudlessday.
• States bordering New York will allocate a total of $68-$102 million annually tosupport renewables. Coordination within the region is necessary to foster thedevelopment of critically needed regional green markets and to insure that NewYork continues to promote its renewable energy industry.
• Electricity generation is a major source of nitrogen and sulfur oxides, volatileorganic compounds, fine particles, air toxins such as mercury, and greenhousegases. These pollutants are associated with environmental and public healthproblems including acid deposition, smog, visibility degradation, climate change,and increased human mortality and morbidity. These pollutants also imposeconsiderable economic burdens by increasing health costs, degrading buildingmaterials, and reducing the value of fishing, tourism, recreational, and scenicresources.
• Research and monitoring data are necessary to formulate effective and equitablepublic policies. There are no market incentives to spur private investment inecosystem monitoring and assessment, given that the benefits are diffuse andcannot be captured by any one private investor. With utility restructuring, utilitieshave stopped sponsoring environmental field programs, leaving a gap in funding.
• Emerging distributed generation (DG) technologies offer the potential to self-generate electric power at efficiencies and with lower emissions than centralstation generators. When heat is recovered for useful purposes, (i.e., cogenerationor CHP), these options can provide the consumer with a highly-efficient andreliable energy supply option at prices competitive with the grid while reducingemissions. The DG/CHP systems can exceed 80% fuel-use efficiency and cansignificantly reduce NOx and other air pollutant emissions.
• New York's deregulated electricity market furthers the potential for DG/CHPgrowth in the long-term, but faces hurdles, such as utility interconnection, exitfees, and standby/backup charges in the near-term. Use of DG/CHP offers ameans to enhance a customer’s power quality and reliability, alleviate load pocketconstraints, and provide customers with an option for load shedding, in additionto energy-efficiency and air quality benefits. Therefore, DG/CHP represents anopportunity to improve energy-efficiency and to reduce environmental impactsassociated with power generation and use.
2-101
1. Improve access to energy efficiency initiatives.
2. Improve energy customer access to energy options(e.g., renewable resources, “green” power).
3. Reduce the environmental impacts of energyproduction and use via energy efficiency and R&Dinitiatives.
4. Facilitate competition for energy efficiency andenergy options to benefit a larger number andvariety of end-users.
6. Facilitate the provision of affordable energy,including affordable rates and other paymentrelated assistance, for low-income customers.
Table 1. New York State’s PublicBenefits Program Goals
The responsibility for preserving public benefits for residential, low-income, smallbusiness, municipal, institutional, and educational energy customers during the transitionto a competitive energy market lies with many energy industry participants, includinggovernment, energy providers, energy service companies, and not-for-profitorganizations. While each participant’s role is instrumental to successfully serving theneeds of these energy customers, government’s role is multi-faceted and occurs on manylevels. Government acts to ensure that energy markets are operating efficiently and thateach energy consumer has equal and open access to equitable energy options.
Public Benefit Programs and the Role of Government
New York State government plays an objective and active role in administering publicbenefits programs. The State studies the patterns, trends, and behaviors of energycustomers lacking market influence, such as low-income households, looking for cost-effective opportunities to better serve their needs. The common goals that the State usesas guidelines to build its network of public benefits programs is presented in Table 1.
To address the energy needs of energycustomers, it is necessary to understandhow these customers are currently beingserved by public benefits programs. TheState coordinates public benefits efforts bybalancing and aligning the interests, needs,and goals of residents and businesses. Aligning goals requires the State tosupport: (1) technology development andtransfer; (2) information and education; (3)policy development and analysis; (4)market support, including infrastructuredevelopment; and (5) collaboration throughthe formation of strategic public and privatealliances while facilitating stakeholderinterests. Figure 2 summarizes thisinteraction.
Energy customers in New York with less market influence require government assistancelargely because competitive market forces have not yet addressed their energy needs. These energy needs include: access to safe, reliable, and affordable energy options;assistance with energy information and education; and enhanced public health and safety
2-102
Policy Development Market Support
Information & Education
Strategic Alliances and Partnerships
Technology Development &
Transfer
Aligning Energy CustomerGoals Through:
COLLABORATION
COALITION BUILDING
COOPERATION
COMMITMENT
COMMUNICATION
BUSINESS
Goals:
(1) Company Growth;(2) Return on Investment;
(3) Market Growth & Expansion;
(4) Lower Risk.
CONSUMER
Goals:
(1) High Quality Products & Services;
(2) Reliable Information;(3) Convenience;
(4) Low Cost.
GOVERNMENT
Public Benefits Goals:
(1) Access to safe, reliable and affordable energy options;(2) Assistance with energy information and education;(3) Public health and safety
protections.
Regulatory Authority
Figure 2. Aligning and Balancing the Goals of Energy Customers
protections. Numerous market barriers exist and must be addressed and overcome forthese customers to have greater market representation. Market barriers that are faced bythese energy customers, and that provide the justification for government assistanceinclude:
• Lack of market influence;
• Insufficient market and technology information available to energy customers;
• Lack of awareness of energy service options, available technology choices, andenergy savings potential and opportunities;
• A high energy burden (the proportion of income devoted to energy costs);
• Lack of interest on the part of energy efficiency services providers; and,
• Energy-efficient products in retail stores are in short supply or are not promoted.
5 The Center for Research and Public Policy. New York State Energy Competition Study; prepared for theNew York State Energy Research and Development Authority. December 2000. 6 Energy customers targeted through the survey included: general customers; African Americans;Hispanics; Switchers (customers who have switched energy suppliers); and Business.
2-103
Public Benefits and Government Coordination
While many low-income public benefits programs across the State are interrelated, thereremain opportunities to coordinate and comprehensively deliver public benefits to energycustomers through greater cooperation among public benefits providers. The benefits oflow-income programs, for example, could be maximized if the services of severalprograms were coordinated and a common strategy was established. Many programs aretrying to achieve similar goals, but rigid program designs, lack of coordination, differenteligibility criteria, and jurisdictional conflicts among programs inhibits the ability toachieve desired results. These structural inadequacies can, over time, createinefficiencies in program delivery, unnecessary overlap of services, and confusion on thepart of customers (e.g., mixed messages, overload of inconsistent information, inability tochoose between program offerings).
Government has been regarded by energy customers and energy industry participants ashaving a leadership role in facilitating market development, coordinating program designand delivery, and providing public benefits to low-income and other energy customers. In December 2000, the Center for Research and Public Policy (CRPP) issued a finalreport5 to NYSERDA that presented results of a New York State Energy CompetitionStudy. The findings of this report provided input on New York’s competitive energymarkets, including the roles and need for continuance of public benefits programs. Aspart of the study’s focus, energy customers were provided with a definition of publicbenefits programs and then asked to rate the importance of each program. Over 90%, ofenergy customers6 surveyed rated programs to help low-income residents afford energyand programs for other energy customers such as elderly, blind and disabled as veryimportant or somewhat important. When asked who should pay for such programs,energy customers identified: (1) government, (2) local utilities, and (3) competitiveenergy suppliers. Government was selected by a majority (over 50%) of energycustomers, as the most appropriate to pay for both of these types of programs.
Another recent study, conducted by the American Council for an Energy-EfficientEconomy (ACEEE), examined the role of private market actors (e.g., ESCOs, electricity
7 Kushler, Martin. Ph.D., and Patti Witte M.A. September 2001. Can We Just “Rely on the Market” ToProvide Energy Efficiency? An Examination of the Role of Private Market Actors in an Era of ElectricUtility Restructuring. American Council for an Energy Efficient Economy. 8 These states are: Arizona, California, Connecticut, Illinois, Massachusetts, Michigan, New York,Pennsylvania, and Rhode Island. These states were selected by ACEEE for their study because they wereearly implementors of electric restructuring. These states were also selected by ACEEE because theyprovide geographic diversity and a wide range of restructuring policies in terms of “public benefit” fundingfor energy efficiency.
2-104
commodity providers, and distribution utilities) in providing energy efficiency services.7 In a study of nine key states,8 ACEEE found that:
(1) There are major gaps in the market segments served by private market actors.In particular, they generally have demonstrated little interest in serving theresidential and small commercial customer markets.
(2) The ESCO industry is intricately involved with, and supported by, existinggovernment and regulatory policies and funding programs. Such programs havebeen a substantial influence on the creation of the ESCO industry and continue toplay a major role in sustaining ESCO projects today.
The CRPP study found that consumers rate government as the most appropriate providerof energy efficiency public benefits, especially to residential customers. The ACEEEstudy affirms private market actors’ recognition that the role of government as thevehicle for delivering energy efficiency programs, especially to residential and smallcommercial customers, is beneficial to their sustained business practices.
New York is working to overcome barriers associated with the limitations of energymarkets, as well as those associated with program design and implementation, ineffectively serving energy customer needs. The State also leverages its efforts withcommunity-action groups, businesses, and other stakeholders through the use of strategicpartnerships. Partnerships provide additional resources, as well as a longer-termcommitment toward reducing or overcoming market barriers.
In 1997 New York began a statewide dialogue on low-income energy affordability issues. The Low-Income Forum on Energy (LIFE) serves as a medium for exchanginginformation on best practices in program delivery and identifying problems and solutions,to providing services to the low-income sector. The LIFE forum has attracted energymarket participants who have an interest in serving low-income customers and in solvingthe problems associated with doing so. Representatives from New York State agencies,utility companies, energy service companies, not-for-profit and consumer advocate
9 Colton, Roger D., Fisher, Sheehan & Colton; Public Finance and Economics. September 2000. “Outreach Strategies for Iowa’s LIHEAP Program: Innovation in Improved Targeting”. Prepared for: IowaDepartment of Human Rights, Des Moines, Iowa.10 Low-Income Forum on Energy (LIFE) 2000 Fall Conference. November 16 and 17, 2000. Albany,New York. LIFE Work Groups Summary of Recommendations.
2-105
groups, independent living centers, energy cooperatives, credit unions, State Assemblyand Senate representatives, and community action agencies, among many others, haveparticipated in LIFE conferences and dialogue. All of these organizations have designedtheir programs to produce benefits to low-income residents; however, the lack of aconcerted program design and evaluation effort inhibits the realization of these benefitsand actually furthers the energy burden of lower-income residents. This situation hasbeen recognized by low-income service advocates and leaders in New York and in otherStates wanting to better serve low-income energy customers.9
The following lessons and recommendations resulted from the November 2000 LIFEConference in Albany, New York:10
• Existing agency relations and activities should be coordinated and centralized.
• There should be a centralized database of information on low-income programsand services in the State that can be accessed by workers to more effectively referlow-income customers to programs and services for which low-income customersand clients are eligible.
• Consistent information regarding customer protection issues, reliability issues,and energy bill arrearages, is needed from regulators, agency networks, andutilities that delivers an accurate message to customers.
• To promote aggregation, additional outreach is essential to inform municipalities,not-for-profits, and county governments.
• Involvement by community-based organizations is necessary for programs tosucceed.
NEW YORK’S PUBLIC BENEFITS PROGRAMS
Nationally, public benefit funding for energy efficiency programs is underway in overtwo dozen states. The purpose of these programs is to ease the transition to full electricretail competition by continuing to support energy efficiency, environmental protection,renewable resource development, and public benefit R&D. In New York State, publicbenefits programs are provided by public and private entities including: investor-ownedutilities, not-for-profit organizations, public benefits corporations, and corporate
2-106
instrumentalities of the State. Funding for public benefits programs comes from federal,State, and private sources. In New York, these programs are working to support thedevelopment of the market for energy-efficient goods and services and are supportingR&D activities directed toward renewable energy development, new productdevelopment and applications, and environmental protection.
Public and Private Utility-Sponsored Programs
Low-income public benefits programs in New York are provided by public authorities,utilities, and State agencies. Some of New York’s utilities continue to offer arrearagereduction programs to low-income customers while also contributing to the State SBCprogram. Table 2 displays the utility-sponsored public benefits programs in New Yorktargeted to low-income customers.
Table 2. Public and Private Utility Sponsored Public Benefits Programs in NYS
Utility-Run Low-Income Program
Targeted Customers/Typical Services Provided
Consolidated EdisonCompany of New York,Inc.
Total funding:$6.4 million annually
Consolidated Edison Company of N.Y., Inc. Low-Income Plan. Targets electric customers. The program objective is to reduce energy bills and promote energy efficiency for low-income customers.
RESULTS. The Low-Income Plan program has saved an estimated $1.8 million on electricbills for Direct Vendor customers since program inception in April 1996. As of May 31,2000:• 21,473 Direct Vendor customers were participating;• 1,521 refrigerators have been replaced for SSI or HEAP customers; and,• Over $950,000 has been spent through the refrigerator replacement program.
Keyspan Energy
Total funding:$2 million annually
Residential Reduced Rate (RRR). Program targets natural gas customers. The objective isto increase the affordability of natural gas customers. In addition, the program provides abenefit to all ratepayers by reducing the uncollectible balances and associated costs.
RESULTS. There are 20,000 active participants in the RRR program.
National Fuel Gas(NFG)Total funding:$2 million annually
Low Income Residential Assistance (LIRA). Targets natural gas customers. The programobjective is to change the payment behavior of participants and to provide benefits to allratepayers by reducing the uncollectible balances and associated costs.
RESULTS. The LIRA program has 1,874 active participants of which 69% are currentlypaying their bills on time. Debt forgiveness for the program has exceeded $2 million andconservation credits exceed $80,000.
National Fuel Gas (NFG)Cont.
Public Assistance Cooperative for Energy (PACE). Targets natural gas customers. Theobjective of the program is to provide the benefits of competition to low-income, payment-troubled customers by offering the opportunity to reduce energy costs.
RESULTS. Program has saved Erie, Chautauqua, and Niagara counties in excess of $1.4million.`
Table 2. Public and Private Utility Sponsored Public Benefits Programs in NYS
Utility-Run Low-Income Program
Targeted Customers/Typical Services Provided
2-107
National Fuel Gas (NFG)Cont.
Elderly, Blind or Disabled Payment Troubled Residential Assistance (EBDPTRA). Program targets natural gas customers. The objective of the program is to change thepayment behavior of participants and to ensure the health and safety of “under-served”customers. In addition, the program provides benefits to all ratepayers by reducing theuncollectible balances and associated costs.
RESULTS. The EBDPTRA program has:
• 265 active participants of which 91% are paying on time;• Spent over $84,000 on energy audits, large dial thermostats, heating
repair/replacement, and insulation of participant residences.
New York State Electricand Gas Corp. (NYSEG) Total funding:$6.25 million annually($1.25 million capped forthe Gas AffordableEnergy Program)
Power Partner Program. NYSEG offers its ‘Power Partner’ program to low-income andelderly energy customers throughout their service territory who want to reduce their energybills, thereby becoming more financially self-reliant.
RESULTS. NYSEG anticipates serving 22,500 customers through its Power Partnerprogram. As of May 31, 2000:
• 16,067 customers enrolled in Power Partner; • 1,817 received new refrigerators; • 596 had their water heater replaced or converted; • 668 received energy audits; and, • 1,019 had their heating systems upgraded.
New York State Electricand Gas Co. Cont.
NYSEG Gas Affordable Energy Program. The program objective is to make natural gasmore affordable for customers. Offers a reduced service charge to all participants. Participants pay a $6.40 per month service charge whereas sales service non-participantswill have minimum charges of $10.00 or $14.00 per month, and aggregation non-participants will have a minimum charge of $13.00 per month.
RESULTS. Program is fully subscribed, and is anticipated to serve 13,500 customers.
Niagara Mohawk PowerCorp. (NMPC)
Total funding:$5 millionannually
The Affordability Program. Targets electric and gas customers who are not on temporaryassistance who have a documented “inability to pay” for their full energy costs. The programprovides participants with a negotiated maximum monthly partial payment, energy usemanagement education, and arrears forgiveness (50% up to a maximum of $250 annually).Energy efficiency services may also be provided, depending upon customer need. Servicesinclude: weatherization services, refrigerator replacement, waterbed mattress replacement,installation of energy-efficient fluorescent fixtures, electric hot water tank, and/or clothes dryerfuel switching.
Niagara Mohawk PowerCorporation, Cont.
Onondaga County DSS Gas Aggregation Project. Targets natural gas customers. Theproject seeks to make energy more affordable for participants by obtaining supply at lowercost and by packaging energy efficiency services to lower overall customer use and cost.
Niagara Mohawk PowerCorporation, Cont.
County Gas Aggregation Grant Program. Targeted to natural gas customers. The objective of the program is to encourage the aggregation of low-income consumers withinNMPC service territory by providing funding to counties for consultant services and otherassistance to develop gas aggregation initiatives that target low-income customers.
RESULTS. Not Available.
Table 2. Public and Private Utility Sponsored Public Benefits Programs in NYS
Utility-Run Low-Income Program
Targeted Customers/Typical Services Provided
11 New York State Public Service Commission. Cases 94-E-0952 et al. In the Matter of CompetitiveOpportunities Regarding Electric Service, Opinion No. 96-12, Opinion and Order Regarding CompetitiveOpportunities for Electric Service. Issued and effective May 20, 1996. 12 New York State Public Service Commission. Cases 94-E-0952 et al. In the Matter of CompetitiveOpportunities Regarding Electric Service, Opinion No. 98-3. Opinion and Order Concerning SystemBenefits Charge Issues. Issued and effective January 30, 1998.
2-108
Orange and RocklandUtilities, Inc.
Total funding:$0.4 million annually
Orange and Rockland Utilities, Inc. Energy Saving Partners. Targets gas and electriccustomers in the 12771 zip code. The program objective is to reduce energy bills andpromote energy efficiency for low-income customers. The program achieves this throughits refrigerator replacement and arrears forgiveness efforts.
RESULTS. The ORU Energy Saving Partners program has:
• Installed 51 refrigerators; and • Provided arrears forgiveness and/or weatherization for 40 customers.
ORU also operates an aggregation program.
Rochester Gas andElectric Corp.
Total funding:$0.5 million annually
Low-Income Assistance Partnership Program. Provides customers assistance (loweredmonthly payments, arrears forgiveness, and budget and energy efficiency counseling). Also provides a weatherization grant program.
TOTAL $23.1 millionannually
Estimated Annual Expenditure From Utility-Run Low-Income Program in New YorkState.
Local, State, and Federal Public Benefits Offerings in New York State
New York State Systems Benefit Charge. The System Benefits Charge (SBC) programin New York State was established in 1996 by the Public Service Commission (PSC).11 In January 1998, NYSERDA was designated as the administrator of New York’s publicbenefits program. NYSERDA has designed, developed, and implemented a broadportfolio of programs, collectively named the New York Energy $martK Program, toadminister public benefits including energy efficiency, low-income services, R&D, andenvironmental protection during the State’s transition to electric retail competition.12
In February 2001, the PSC affirmed the continuation of the SBC program, with additionalprovisions, for a period of five years. Funding was set at approximately $150 million peryear. Of this annual budget, approximately 14.1% will be allocated to low-incomeprogram offerings, 8.7% to residential customers, 3.6% to municipal and institutionalcustomers, and 3.0% to small business customers. In addition to these programs, 2.9%
13 New York State Energy Research and Development Authority. New York Energy $martK ProgramEvaluation and Status Report: Report to the System Benefits Charge Advisory Group. September 2000.
14 The total five-year SBC budget percentages do not add to 100% because the table does not list everyprogram provided through the New York Energy $martK Program, funded through the System BenefitsCharge. In total, Table 3 addresses 52.5% of the five-year SBC program budget that is administered byNYSERDA.
2-109
was allocated to energy efficiency and strategic research and development (R&D)initiatives, 1.9% was allocated to environmental monitoring and analysis efforts, 9.1%was allocated to renewable energy technologies, and 9.1% was allocated to distributedgeneration and combined heat and power energy applications. Table 3 details theseallotments. The SBC program was continued, in part, because it was recognized thatmarket inefficiencies, including the inequitable distribution of electricity and loadconstraint issues, require government assistance in the form of public benefits initiatives. The success of the SBC program in New York helped to confirm that public benefitsprograms can be implemented in a cost-effective manner. Results have shown that theSBC program is filling what would otherwise be a void for those energy customers inNew York State that have less market influence and unique energy needs.13
The New York Energy $martK Programs and initiatives that directly support thesetypes of energy customers are outlined in Table 3.
Table 3. SBC Program Funding (2001 through 2006) by Targeted Program14
Public Benefit Program Total 5-Year Funding Percent of Total 5-YearSBC Budget
Low-Income Program $103.5 million 14.1%
Residential Program $63.9 million 8.7%
Municipal and Institutional Program $26.6 million 3.6%
Small Business Program $22.2 million 3.0%
Energy Efficiency and Strategic R&D Program $21.1 million 2.9%
Environmental Monitoring and Analysis Program $14.4 million 1.9%
Renewable Technologies Program $67.0 million 9.1%
Distributed Generation and Combined Heat and PowerProgram
$67.0 million 9.1%
Total $385.7 million 52.5%Source: New York State Energy Research and Development Authority
The New York Energy $martK Program, through its portfolio of Energy Efficiency,
15 New York State Energy Research and Development Authority. New York Energy $martK ProgramEvaluation and Status Report: Quarterly Report to the System Benefits Charge Advisory Group. June 2001.16 Results are based on New York Energy $martK funds awarded through March 31, 2001. Energysavings include clean generation from wind and PV generation sources.
2-110
Low-Income, and Research and Development programs, has achieved 846 million kWhin annual electricity savings. These energy savings translate into emissions reductionsof: 800 tons of NOx; 1,364 tons of SO2; and 574,607 tons of CO2, respectively. Additionally, 219 MW of summer peak demand reduction has been achieved by theProgram. The Program has also achieved an annual bill reduction of $97.1 million forNew York’s energy customers.15 These results16 of the New York Energy $martKProgram benefit all energy customers, but especially those who have less marketinfluence or who have more specialized energy needs.
New York Energy $martK Residential Program. The purpose of the residential publicbenefits program is to improve the affordability of energy and the efficiency of its use byresidential customers. Residential customers are generally unfamiliar with new energy-efficient products and their energy savings potential. Residential energy efficiencyprograms have spurred customer demand for energy-efficient products and services bypromoting ENERGY STAR® products while ensuring access to financing and theavailability for these products. Approximately $63.9 million has been allocated forResidential New York Energy $martK energy efficiency programs between 2001 to2006. Funding will be spent on:
• ENERGY STAR® Public Awareness Program. This program is increasing thesupply, promotion, and sales of ENERGY STAR® - qualifying residential productsand homes by providing assistance, tools, consumer incentives and support toretailers, contractors, remodelers, multifamily building owners, and productvendors who are in a position to influence purchasing decisions.
• Home Performance with ENERGY STAR® Program. This program is developing anetwork of building performance services (e.g., HVAC and insulation contractors,remodelers, building performance contractors, home energy raters, and tradegroups) that evaluate and make energy efficiency improvements to 1-4 familydwellings.
• Residential Financing. This effort is leveraging private investment in energyefficiency and renewable technologies while reducing barriers to energy financingin markets where energy service companies are least likely to participate.
17 Bill savings of $1,125,748 are based upon the total kWh savings achieved from program inception(April 1999, with SBC 1 funding) through July 2001. Savings were calculated based upon an electricityrate of 21¢ per kWh for the Consolidated Edison Company of New York territory, where the majority ofmeasures have been installed.
2-111
To date the following results have been achieved:
• Home Performance with ENERGY STAR® Program has assisted in certifying over120 contractors with the Building Performance Institute. The Program has 30active contractors. Over 124 homes have received services (valued over $1million), while over 180 homes are anticipated to receive services (valued over$2 million).
• ENERGY STAR® Homes Program has over 40 builders enlisted. Builders havecommitted to building more than 100 ENERGY STAR® homes, while 35 homeshave already been certified as ENERGY STAR® homes.
It is estimated that over 265,000 multi-family and single-family households will haveparticipated by the end of the program, achieving an estimated 200 million kWh inenergy savings per year. Over 700 retailers and 500 contractors and remodelers areanticipated to participate by program end.
New York Energy $martK Low-Income Program. Table 4 provides a brief summaryof the low-income initiatives provided through the New York Energy $martK Low-Income Program. Approximately $103.5 million has been allocated for the Low-IncomeProgram between 2001 to 2006. The Direct Installation Program has provided services toover 400 units during its implementation period. Participating households typicallyachieve a 25% reduction in their electric energy costs. Through July 2001, the DirectInstallation program has contributed to the installation of 2,868 refrigerators and 19,705compact fluorescent bulbs in over 7,800 small homes and over 43,400 multifamily units. The program has achieved an estimated 5.6 million kWh in electricity savings,accounting for over $1.1 million in electricity bill savings for low-income customers.17 In addition, it has been estimated that this funding has leveraged an additional $10.2million from private sources. Based upon the estimated kWh savings, the DirectInstallation program has effectuated the reduction of: 4.2 tons of nitrogen oxides (NOx);8.5 tons of sulfur dioxide (SO2); and 2,470 tons of carbon dioxide (CO2); per year.
Low-income programs, including the Direct Installation Program, have also contributedto increasing the awareness of energy efficiency and conservation options by low-incomebuilding owners and tenants. In fact, it is estimated that over 150 building owners and
18 New York State Energy Research and Development Authority. New York Energy $martK ProgramEvaluation and Status Report: Report to the System Benefits Charge Advisory Group; Interim Report. September 2000.
2-112
over 6,700 low-income residents have received education on electric energy use.18
Table 4. SBC Funded Low-Income Initiatives
Low-Income PublicBenefits Programs Public Benefit Services Offered
New York Energy $martKDirect Installation Program
Extends the existing service infrastructure of the federal Weatherization Assistance Program (WAP)by offering electric reduction measures including energy efficient lighting, appliances, and electric-to-gas conversions for low-income customers. The goal is to reduce the energy burden of low-income households, while providing information and related services to the low-income communityregarding energy use and efficiency.
New York Energy $martKAffordable AssistedHousing Program
The program has established an incentive pool to write down the incremental costs associated withenergy efficiency measures and electric heat conversions in the Division of Housing and CommunityRenewal (DHCR) and Housing and Urban Development (HUD) publicly-assisted housing portfolios.
New York Energy $martKLow-Income Aggregation
Program
The program improves the energy affordability of low-income customers by aggregating thesecustomers to secure lower prices through the bulk purchase of electricity, natural gas, fuel oil, andpropane. The program also supplies energy efficiency services to low-income customers in an effortto reduce electric demand.
New York Energy $martKLow-Income PublicAwareness Program
This program informs low-income persons, communities, and State and community-based serviceproviders of the energy services and options available to them under the Low-Income EnergyAffordability program. This program also provides consumer and energy education and referralsto existing credit and budget counseling services locally available, as well as information on thechanges taking place in the newly deregulated marketplace to energy customers. The program alsosupports the Low-Income Forum on Energy (LIFE).
New York Energy $martKTechnical Assistance for
Publicly-Assisted HousingProgram
This program increases the affordability of public housing available to lower-income residents byimproving the energy efficiency and energy management operations of the State’s publicly-assistedhousing stock. The program is achieving this by: (1) using new replacement technologies for electricresistance heat; (2) improving the efficiency of boiler plants by training boiler mechanics responsiblefor large heating plants; (3) purchasing energy-efficient appliances in bulk; and (4) utilizinginnovative financing mechanisms to fund energy efficiency upgrades and investments.
TOTAL Low-Income Program ($103.5 million over 5-years)
New York Energy $martK Small Business Program. The purpose of the smallbusiness public benefits program provided through New York Energy $martK is toimprove the affordability of energy and the improved efficiency of its use by businessesby advising them of cost-reduction opportunities via load management, rate analysis,aggregation, capital improvements, and operating improvements. Approximately $22.2million has been allocated for Small Business New York Energy $martK Programsbetween 2001 to 2006. Funding will be spent on:
• Technical Assistance Program. This effort is providing on-site engineering
2-113
services including: (1) energy audits, to identify missed energy improvements; (2)targeted technical studies, to address critical sectors or technologies; and (3)custom studies, to identify a specific customers energy efficiency needs andopportunities available.
• Peak Load Reduction Program. This program is providing financial incentives toaccelerate the implementation of: (1) demand reduction measures; (2)productivity improvements; (3) direct load-control measures; and (4) energymanagement and demand monitoring technologies.
• Loan Fund. This program is providing reduced-cost financing for demand-savingand energy-efficient capital improvements for small businesses, through aStatewide network of financial institutions.
The initial three-year SBC funding allocation helped to establish the New York Energy$martK Technical Assistance and Loan Fund Programs. The Technical AssistanceProgram has approximately 260 participants from commercial and industrial sectors. TheLoan Fund Program has built a network of 25 lenders, and is offering reduced interestloans to small commercial customers.
The Small Business Program is expected to have over 4,000 participants by program end. These participants are expected to yield over 400 million kWh in energy savings peryear. Potential exists for over $270 million to be leveraged by the Small BusinessProgram during the implementation of the program.
New York Energy $martK Municipal and Institutional Program. The purpose of themunicipal and institutional public benefits programs is to improve the affordability ofenergy and the efficiency of its use by municipal and institutional customers. Theprogram provides technical assistance to schools, hospitals, and government units. Theprogram provides financial incentives, including standard performance contractingarrangements and equipment leases and loans to these customers. Approximately $26.6million has been allocated for Municipal and Institutional New York Energy $martKPrograms between 2001 to 2006. Funding will be spent on:
• Energy Management Program. This program is targeted to public and private K-12 schools, and the healthcare sector. The program is reducing energy use andelectric demand while spurring price-sensitive load strategies for these vulnerablecustomers. The program provides: (1) internet-based monitoring of electric loadsvia advanced metering technologies; (2) outreach; (3) technical assistance; (4)educational materials; (5) targeted recognition programs; and (6) constructionincentives for renovation projects too small for energy performance contracting.
2-114
• Municipal and Wastewater Initiative. This program is accelerating the use ofenergy-efficient and innovative technologies by municipal water and wastewatersystems in New York. The program provides risk reduction, demonstration, andeducation through (1) technical assistance; (2) energy efficiency audits andelectricity submetering; (3) demonstrations of new energy-efficient technologies;and (4) deployment of proven, energy-efficient technologies and processes.
New York Energy $martK Energy Efficiency and Strategic R&D Program. Thepurpose of the Energy Efficiency and Strategic R&D public benefits program is toincrease the efficiency of end-use electric energy consumption and reduce the demand forelectricity in New York State. Approximately $21.1 million has been allocated forEnergy Efficiency and Strategic New York Energy $martK Programs between 2001 to2006. Program projects address developing energy-efficient technologies that could bemanufactured in the State, if the public benefit is compelling and near-term private returnis adequate to spur R&D investment. Projects occur in the major electric end-use sectorsof the State (i.e., residential, commercial, industrial, and municipal).
Several lighting projects aimed toward energy customers lacking market influence havebeen funded through the Energy Efficiency R&D Program. The projects cover an arrayof technologies and span from product development, to demonstration, to informationdissemination. Examples include:
• New York State companies that are developing an energy-efficient high intensitydischarge (HID) wallpack and floodlight for commercial and multifamilybuildings. The project is focused on developing a high-quality, low-cost fixturethat will make the HID technology economically attractive for residential andcommercial customers.
• The Lighting Research Center at Rensselaer Polytechnic Institute has partneredwith the Energy Center of Wisconsin to demonstrate how provenCoolDaylighting™ techniques can reduce energy costs by as much as one-halfwithin New York State classrooms. This project aims to overcome technical,economic, and institutional barriers to the use of daylighting in schools.
• Several funded projects have focused on disseminating lighting information. Oneproject utilizes a two-pronged approach toward overcoming barriers that inhibitthe adoption of energy-efficient lighting in residential, commercial, and industrialmarkets. The project provides financial support for the National Lighting ProductInformation Program (NLPIP). In addition, funding has been provided to theLighting Research Center to help companies evaluate product designs and catchpotential deficiencies early in product development.
2-115
Other sectors and technologies have benefitted from the Energy Efficiency and StrategicR&D Program, including:
• A project, funded through the Energy Efficiency R&D Program, with SaintVincent’s Hospital and the Harvard Medical School, is demonstrating andevaluating the use of ultraviolet light for air disinfection to control thetransmission of infectious disease. The project is part of a six-city, multi-yearfield trial to study the efficacy of ultraviolet germicidal irradiation (UVGI) incontrolling tuberculosis (TB) spread in homeless shelters. Results from existingstudies show that significant energy savings and environmental benefits areassociated with UVGI air treatment as compared to traditional multiple air changemethods.
• A project, funded through the Strategic R&D Program with the EatonCommercial Mixed-use Center and the New York State Electric and GasCorporation (NYSEG), investigated the potential for using combined heat andpower (CHP) for the site. The Eaton Center, located in Norwich, NY, contains 11buildings occupied by several small businesses. The study indicated that the CHPsystem would be technically and economically viable for reducing utility gridconsumption and supplying hot water and heating for the site. The project hashelped reduce barriers to the use of CHP technologies thereby aiding smallbusinesses in an area of energy use where they may otherwise not consider.
New York Energy $martK Environmental Monitoring and Analysis. The purpose ofthe Environmental Monitoring and Analysis public benefits program provided throughNew York Energy $martK is to provide objective and scientifically credibleinformation on the environmental impacts of energy systems to assist policy makers. Theinitial three-year SBC funding helped fund 17 research projects covering environmentalissues such as acid rain, fine particles, mercury deposition, and ozone. The program hasleveraged over $4 million in national co-funding, and is helping to sustain theenvironmental research infrastructure of New York State. For example:
• In collaboration with the New York State Department of EnvironmentalConservation (DEC), the Environmental Monitoring and Analysis program isproviding support to the Adirondack Lake Survey Corporation to sample waterquality in 52 lakes in the Adirondack Park. This data is being used to evaluate theeffectiveness of our nation’s acid rain control strategies on protecting sensitiveecosystems in New York.
Approximately $14.4 million has been allocated for Environmental Monitoring andAnalysis of New York Energy $martK initiatives between 2001 to 2006. Programfunding will be spent on:
2-116
• Developing emission characteristics for fine and ultra-fine particles from existingand emerging combustion technology so that accurate emission inventories can bedeveloped;
• Increasing the understanding of the role of local as opposed to regional sources ofair pollution so that more equitable control strategies can be developed; and
• Improving the scientific understanding of the cycling, co-pollutant interactions,and the impacts in New York of primary and secondary pollutants related toenergy production and use so that policy makers can identify more effectivepublic protection strategies.
New York Energy $martK Renewable Technologies Programs. The purpose of therenewable energy public benefits program provided through New York Energy $martKis to build a sustainable market for the production and sale of renewable energytechnologies and for the development of “green” energy markets.
With the financial support of SBC funds, the first merchant wind power plant wasconstructed in Madison County, New York, and two other wind farms are expectedbefore the end of 2001. Additional wind sites are in the process of being identified anddeveloped. Approximately 1 MW of photovoltaic (PV) energy systems will be installedthrough renewable technology programs, including upwards of 250 residential PVinstallations, and numerous commercial and institutional building installations. Over350kW of the PV will be located in New York City. In addition, the Tompkins CountyLibrary now has a 150kW PV roof installation.
Approximately $67 million has been allocated to support the Renewable EnergyTechnologies New York Energy $martK initiatives between 2001 to 2006. Programefforts will focus on supporting and continuing to build the end-use and wholesalemarkets for renewable technologies. The end-use aspect will focus on performance-based installer/customer activities for residential, municipal, and commercial customersto encourage the use of photovoltaic systems, and small-scale wind and biomassapplications. The wholesale market effort will support renewable-based distributedgeneration (i.e., large wind, bioenergy, low-impact hydropower) through risk-sharing ofdeployment and resource cultivation. Program funding will be spent on:
• Providing training for individuals involved in designing, installing and inspectingsystems and, long-term efforts to educate the marketplace in the use and value ofrenewable energy technologies. This may include activities to bring renewableenergy technology and curriculum to schools around New York;
2-117
• Supporting projects to evaluate the performance of systems in the field anddevelop, as necessary, tools that might increase renewable technologyeffectiveness;
• Expanding on efforts to identify viable wind sites across New York by sharingrisk with developers, and other stakeholders; and,
• Including market-pull strategies for either green power or green power attributes.
New York Energy $martK Distributed Generation and Combined Heat and PowerProgram. The purpose of the distributed generation and combined heat and power(DG/CHP) public benefits program provided through New York Energy $martK is todemonstrate and promote the use of distributed generation (DG) technologies andcombined heat and power (CHP) applications. These technologies will be demonstratedin industrial, municipal, institutional, and building applications. The demonstration ofsystem/application viability, cost-effectiveness, reliability, and replicability will beemphasized by the program.
Over the past decade NYSERDA’s statutory research program has sponsored micro-generation technology development in the areas of fuel cells and micro-turbines. Over 60field tests and demonstrations are being undertaken to validate various DG technologies.In 2000, NYSERDA’s first ever SBC CHP solicitation attracted thirty-five proposalsoffering to reduce peak electricity demand by 11 MW by year 2002. These proposalsresulted in the offering of sixteen projects to reduce demand by nearly 2 MW in 2001 andan additional 2.8 MW in 2002, with $4 million in funding. Projects are expected to resultin economic and environmental benefits associated with improved fuel-use efficiency. Projects such as these also provide greater energy security for project-customers, and forthe State.
Approximately $67 million has been allocated to support the DG/CHP public benefitsprogram provided through New York Energy $martK between 2001 to 2006. DG/CHP generating options through the program include turbines (steam, combustion,micro), reciprocating engines (diesel, natural gas), and fuel cells (phosphoric acid, moltencarbonate, solid oxide, alkaline, proton exchange membrane). These systems offer awide range of capacity, from 2kW for a PEM fuel cell to 25 MW gas turbine. Programefforts will focus on:
• Demonstrating and promoting DG and CHP technologies and applications inindustrial, agricultural, municipal, institutional, and building applications;
• Developing and testing advanced DG and CHP systems;
2-118
• Developing equipment and installation codes and standards for emerging micro-generation products and inspector and installer training;
• Testing small fuel cell, micro-turbine and other clean micro-generation andenergy storage products for different end-use applications such as load peaking,load following, and base load and power quality functions; and,
• Demonstrating and evaluating opportunities for system aggregation os systemsand impacts on utility interface, regulatory issues, distribution system reliabilityand power quality.
Other NYSERDA Administered Public Benefit Programs. The New York Energy$martK programs already identified specifically target residential or economicallydisadvantaged energy customers, or the environmentally-related benefits that affect thesecustomers, and have budgets allocated for this purpose. There exists, however, otherNYSERDA administered public benefits programs that serve these energy customers. Table 5 displays these additional public benefits programs.
Table 5. NYSERDA Administered Public Benefits Programs to EnergyCustomers (Both SBC and Non-SBC Funded)
Residential Customer Program
Communities Program* This program is building upon the existing community structure to perform outreach,education and coordination on broad program objectives, community-wide initiatives, andsegments of the community special needs, by other programs.
Residential Photovoltaic(PV) Program*
This program is building the infrastructure for PV system installers and provides incentivesfor the installation of PV systems in new construction.
Residential Oil HeatResearch
Nearly 3 million households and 40% of the State’s population use oil heat which represents25% of the national market for heating oil. The Buildings R&D program, administered byNYSERDA, is preserving the State’s fuel diversity by improving efficiency, reducingemissions, and eliminating competitive barriers through its collaboration with the BrookhavenNational Laboratory Oil Heat Research program and the New York affiliates of the NationalAssociation for Oil Heat Research and Education. The program is:• Demonstrating and assessing the impact on maintenance and energy cost savings through
the use of low-sulfur fuels rather than conventional quality fuel oil; and,• Developing variable output oil burners and ancillary equipment (e.g., pumps, blowers)
with ultra-low electric load requirements.
Small Business Customer Programs
New York Energy$martK ChoicesProgram*
This program is expanding the pre-qualified equipment replacement incentives offered throughthe New Construction Program. The program is an equipment replacement program specificallyfor smaller end-users and smaller scale renovation projects. Eligible market sectors includecommercial, industrial, agriculture, educational, government, and multifamily. Incentivesprovide 50% of the incremental costs of the higher efficiency upgrades, and are expected toyield 1 kW of demand savings for every $1,000 of incentives.
Municipal and Institutional Customer Programs
Table 5. NYSERDA Administered Public Benefits Programs to EnergyCustomers (Both SBC and Non-SBC Funded)
2-119
State En Vest Program This program is using energy service contractors to design and install efficiency measures andenergy-related capital improvements. This program is funded by third-party financing in theform of tax-exempt municipal leases. Through 2004, the State En Vest Program is expectedto result in $200 million in projects with an estimated $30 million in annual energy savings.
Energy Conservationfor HealthcareOrganizations
This program delivers technical assistance to the healthcare sector to assess the feasibility ofimplementing energy efficiency measures or developing energy performance contracts. Thisprogram is coordinated between NYSERDA and the New York State Dormitory Authority toassist in providing tax-exempt financing for energy efficiency projects.
New York SchoolAssistance Program
This program provides assistance to staff and design teams working in K-12 schools. Thisprogram leverages its funding with the New York Energy $martK Standard PerformanceContract, New Construction, and Buildings R&D programs.
High-Efficiency PublicStreet Lighting Project
This project provides resources and information on the benefits of energy-efficient streetlighting to local government officials, street lighting designers, engineering professionals, andplanning officials. The objective of the project is to ensure that key decision makers areinformed of the technologies and design considerations that can deliver energy cost savings.
LED Traffic SignalProject
This project is transforming the market for traffic signals by providing purchasers, equipmentspecifiers, and installers with information and tools that will enable them to assess theavailability, cost-effectiveness, and other benefits of LED traffic signals. The project is:• Working with electric utilities and ESCOs in New York to overcome both informational
and cost barriers experienced by end-users;• Pursuing opportunities for promoting the adoption of LEDs through manufacturers.
Energy-EfficientProduct ProcurementProject
This project provides information on the benefits of ENERGY STAR® office equipment to thelocal government sector. The project is:• Creating a centralized website for purchasers, a procurement guidebook, and workshops
for county officials to increase the purchase of qualified equipment by 15% over the nexttwo years (2001 to 2003) with a goal to yield annual savings of $1.5 million;
• Providing training and resources to procurement officials on available equipment andproper operation; and,
• Expanding the number of energy-efficient products promoted to include additional
Appliance andEquipment Efficiencyfor State PurchasingProgram
NYSERDA is working with the New York State Office of General Services to establishminimum energy efficiency standards for equipment purchased by or for the State. Thisprogram is changing State purchasing practices, and result in lower energy use andreduced air emissions, while building market share for energy-efficient equipment. Between 2001-2004 the program will:• Establish minimum efficiency standards for 18 products and equipment including
lighting, HVAC, motors, refrigerators, freezers, and other appliances; and,• Evaluate and set standards appropriate for additional products including exit signs,
traffic signals, and office equipment.
* Signifies that the Program is Funded Through the System Benefit Charge.Source: New York State Energy Research and Development Authority. NYSERDA, Envisioning the Future: A Three-Year Plan forNew York State’s Energy, Economic, and Environmental Future (2001-2004).
24 The 911,200 pounds of air emission reductions constitute: 576,000 pounds of SO2; 106,400 pounds ofNOX; 225,800 pounds of particulate matter (PM) and 3,000 pounds of volatile organic compound (VOC).
2-120
New York Power Authority (NYPA). The New York Power Authority (NYPA),created in 1931, serves New York as a non-profit, public benefit energy corporation. Itprovides low-cost electricity to government agencies; municipally owned electricsystems and rural electric cooperatives; job-producing companies and non-profitinstitutions; private utilities for resale without profit to their customers; and, neighboringstates under federal requirements. In 2000, NYPA supplied 22% of New York’selectricity. NYPA does not use tax revenues or State credits. It finances it projectsthrough bond sales to private investors.
NYPA’s public benefit programs include energy services that assist consumers toenhance their energy efficiency. NYPA’s Energy Services Programs (ESP) began adecade ago. By 2001, NYPA had completed more than 1,000 energy efficiency projectsin public schools, colleges and universities, and governmental facilities across the State.These projects produce annual energy bill savings of more than $70 million. Theyreduce electricity consumption by nearly 720,000 MWh each year and lower peak loaddemand by 166 MW. NYPA’s energy services projects also help to avoid theproduction of nearly 500,000 tons of greenhouse gas emissions annually.
Among NYPA’s energy efficiency projects is its Refrigerator Replacement Initiativepartnership with the New York City Housing Authority (NYCHA), cofunded byNYSERDA, U.S. DOE, and the Consortium for Energy Efficiency (CEE). The programhas annually replaced 25,000 refrigerators with models that use half the electricity.NYPA estimates that by 2002, the program will replace 181,000 old refrigerators withnew energy-efficient models.
NYPA also administered the Clean Air for Schools Program, funded with $125 millionfrom the Clean Water/Clean Air Bond Act of 1996 and $12.5 million in NYPA funds.The program replaced coal-burning furnaces in New York City public schools withcleaner natural gas and oil-fueled boilers, resulting in the elimination of over 911,200pounds of emissions annually.24
Long Island Power Authority (LIPA). The Long Island Power Authority (LIPA) wascreated in 1986 as a corporate municipal instrumentality of the State. It was establishedto provide lower utility rates on Long Island and to assume decommissioningresponsibility for the Shoreham Nuclear Power Plant. LIPA provides a portfolio ofenergy efficiency programs to electricity customers on Long Island through its Clean
25 Long Island Power Authority. Clean Energy Initiative: As Approved by the LIPA Board of Trustees. May 3, 1999.26 These results are based upon an Clean Energy Initiative program expenditure of $29.8 million throughDecember 2000.27 The $2.25 million average annual budget for LIPA is based upon an average for their 1999 and 2000annual budgets. In 1999 LIPA afforded $1.37 million to their REAP program, and in 2000 $3.12 millionwas allocated.28 Long Island Power Authority. Clean Energy Initiative, Draft Biennial Report. June 2001.
2-121
Energy Initiative (CEI).25 The CEI began in 1999 and is a five-year, $170 million efforttargeted at achieving energy and capacity savings for LIPA, delivering electric billsavings to customers, and providing environmental benefits to society. The CEI programfunds residential and non-residential programs geared toward addressing energyefficiency, peak load reduction, clean distributed generation, and renewable energytechnologies. In 2000, the CEI program achieved: 51,781 MWh in total energy savings,a 70 MW reduction in peak energy needs; $5.5 million in energy bill savings for 145,000program participants; and emission reductions of: 184.7 tons of NOx; 46.5 tons of SO2;and 54,179.8 tons of CO2.26
LIPA administers a Residential Energy Affordability Partnership (REAP) programthrough the CEI program. LIPA’s REAP program is dedicated to improving energyaffordability for low-income households through the direct installation of acomprehensive set of cost-effective energy efficiency measures, extensive energyeducation and counseling, and an energy bill arrearage reduction plan. LIPA’s REAPprogram funding averages $2.25 million annually.27 In 2000 the REAP program achieved232 kW of coincident peak reduction and achieved 2,414 MW in annual energy savings.28
Refer to Section 3.2, Energy Efficiency Assessment, for further detail on LIPA’s CEIprogram.
Weatherization Assistance Program (WAP). The WAP program is federallyauthorized and funded through the DOE. Funding is used to assist low-income persons,particularly the elderly, handicapped, and families with young children and to reduceenergy consumption, while minimizing the impact of higher fuel cost on low-incomefamilies. In New York, the Office of Temporary and Disability Assistance (OTDA)receives an allocation from the U.S. Department of Health and Human Services to fundthe WAP program statewide. The WAP program is administered by the NYSDepartment of Housing and Community Renewal (DHCR). Weatherization servicesprovided through the WAP program are identified by on-site energy audits that includes alife-saving health and safety test and an analysis of fuel consumption and lifestyle.
29 These 2000 and 2001 WAP Program figures include carry-over funds from prior years.
2-122
Since its inception in 1977, the WAP program has weatherized more than 400,000dwellings or 26.7% of the estimated eligible units. It has been estimated that 1.5 milliondwelling units are eligible for the WAP program. Servicing these could result in vastenergy savings and environmental benefits, plus more affordable energy to those whooccupy the dwellings. Between 1990-2000, the WAP allocated over $429 million to sub-grantees of the program. Over this time period, the WAP achieved 40 TBtu ofcumulative annual energy savings in one-to-four family and multi-family dwellings.
For the 2001 program year, an estimated $45.4 million29 will be available for the NewYork WAP Program. Estimated energy savings for the 2001 WAP program year havebeen estimated to be 29.4 MMBtu (average annual energy savings per unit in multi-family buildings). One-to-four family buildings have been projected to achieve anaverage annual energy savings of 45.5 MMBtu per unit. Table 6 presents an estimatedsavings summary for WAP housing in NYS for the 2001 program year.
Table 6. WAP Savings Summary, 2001 Program Year
Savings SummaryHousing Type
TotalMulti (>4 Units) 1-4 Units
average savings / unit heating 29.4 MMBtu 45.5 MMBtu
average savings / unit electric 615 kWh 1230 kWh
units to be weatherized in 2001 program year 2,718 3,323 6,041
average savings / unita heating and electric $1.14 million $2.29 million $3.43 million
savingsb after 15 years heating and electric $17.1 million $34.35 million $51.45 million
average WAP cost per unit $2,000 $2,250 $2,125
savings per unit of life of installed measuresc $6,300 $10,320
benefit/cost savings to investment ratio 3.15 4.59
a Based on an estimate of $11.50/MMBtu average for the fuel mix in NYS; and $0.134/kWh average electric rate.b In 2000 dollars.c Actual life of individual measures varies from two to twenty-five years.
Source: NYS Division of Housing and Community Renewal, Energy Services Bureau. Weatherization Assistance Program; StatePlan: 2001 Program Year, April 1, 2001 - March 31, 2002.
State Regulation and Consumer Protections
New York State residential and low-income customers are also protected frommonopolistic and anti-competitive market behavior through regulatory protections.
30 Home Energy Fair Practices Act, Rules. Part 11. Public Service Law, art. 2 §§§§4(1), 30-51, 66, 80(1)).
2-123
These protections perform a different function than the more intimate actions of energyefficiency public benefits programs, which protect consumers from unfair businesspractices and ensure that customers have access to adequate electricity and energyresources so that health and safety are not jeopardized. As energy competition in theState advances, and as the State furthers deregulation activities, ongoing preservation andevaluation of existing consumer protection laws and regulations will be required. TheHome Energy Fair Practices Act is one example of how consumers may continue to beprotected.
Home Energy Fair Practices Act (HEFPA). The HEFPA provisions of the New YorkState Public Service Law are designed to provide protections to energy customers in theirrelationships with utilities, which until recently were the sole providers of electricity andgas services. The Act “...establishes as State policy that the continued provision of gas,electric and steam service to residential customers without unreasonable qualifications orlengthy delays is necessary for the preservation of the health and general welfare and isin the public interest.”30 The Act was signed into law in 1981 and was permanentlyapproved by the PSC in 1982. The HEFPA affords consumer protections through itsprovisions regarding termination and restoration of utility service, as well as on paymentagreements between an energy customer and utility. The Act specifies the circumstancesin which protections shall be provided by utilities to energy customers.
The emergence of a competitive energy market, including the entrance and influence ofnew market participants such as ESCOs, warrant a review of the language and provisionsof HEFPA. As energy service providers, ESCOs operate under the rules of a competitiveenergy market and may replace the traditional roles of incumbent utilities. This coupledwith their role as providers of last resort (POLR) under the rules and regulations ofHEFPA, also warrants review.
FINDINGS AND CONCLUSIONS
The issues and public benefits programs addressed by this report lead to the followinggeneral conclusions:
• Government interventions to assist in energy market development are necessaryto align public and private interests, particularly in situations where markets arenot allocating resources efficiently or fairly.
2-124
• Energy customer protections must be continued with the same vigor as they havebeen afforded in the past. This becomes increasingly important as energy marketsbecome more competitive and customer choice in service providers increases.
• Public benefits programs have contributed to energy and cost savings forresidential, low-income, small business, and municipal and institutionalcustomers. These programs also provide environmental benefits includingcleaner air and water, for all of New York’s energy customers.
• Opportunities to further coordination among State agencies that have roles insponsoring and providing low-income energy assistance and other public benefitsprograms are beneficial to program participants, and should be fostered.
• Public benefits programs directed toward research and development havesignificantly contributed to developing, demonstrating, and providing strategicenergy technologies, including the advancement of renewable energytechnologies, while encouraging and promoting environmental safeguards andprotection.
Section 3
ENERGY RESOURCE ASSESSMENTS
Section 3.1 Forecast Summary
Section 3.2 Energy Efficiency Assessment
Section 3.3 Renewable Energy Assessment
Section 3.4 Electricity Assessment
Section 3.5 Natural Gas Assessment
Section 3.6 Petroleum Assessment
Section 3.7 Coal Assessment
1 The Mid-Atlantic Region includes New York, New Jersey, and Pennsylvania.
2 NEMS is a computer-based, energy-economy modeling system for U.S. energy markets, using an integrated modularapproach to represent macroeconomic activity, international energy supply availability, and end-use consumptionsectors. For each fuel and consuming sector, the model balances energy supply and demand while accounting forcompetition among various energy fuels and sources. NEMS projects the production, importation, conversion,consumption, and consumer prices of energy based on macroeconomic and financial factors, world energy markets,resource availability and costs, market behavior, cost and performance of technologies, and demographic assumptions. 3 Of the many scenarios simulated by NEMS, three forecasts, each featuring a different rate of economic growth, werechosen. These scenarios included the EIA Outlook Case forecast and projections based on high and low economicgrowth to reflect the uncertainties inherent in forecasting future economic activity.
3-1
SECTION 3.1
FORECAST SUMMARY
INTRODUCTION
Forecasts of energy demand and prices for electricity, natural gas, petroleum, and coalwere developed for the Draft 2002 State Energy Plan (Draft Energy Plan) over the 2000to 2021 time period. The base year for forecasting is 1999. Actual 2000 data are used,where available. Forecasts include: (1) an Outlook Case bounded by (2) a HighEconomic Growth Case and (3) a Low Economic Growth Case for a total of threeforecast scenarios. Forecasting methodologies and more detailed forecast information areprovided in the Draft Energy Plan Appendix.
The Draft Energy Plan forecasts are consistent with and derived from the EnergyInformation Administration’s (EIA) Annual Energy Outlook (AEO) 2001. The Mid-Atlantic AEO 2001 forecast, which includes the states of New York, Pennsylvania, andNew Jersey, serves as the basis for the Draft Energy Plan.
FORECAST METHODOLOGY
New York projections were derived from the EIA Mid-Atlantic1 Region all fuels demandand price forecasts. EIA produces regional forecasts under various economic and pricescenarios. EIA uses the National Energy Modeling System (NEMS)2 energy marketprojections of the Annual Energy Outlook 2001.
The purpose of the Draft Energy Plan forecast is to generate a reasonable range ofpossible future energy demand and prices as a basis for assessing energy markets andmarket needs.3 Macroeconomic variables, used by EIA for its Outlook, High, and Low
4 EIA/ Assumptions to the Annual Energy Outlook 2001, pg 14
3-2
Productivity 2.3% 2.1% 1.8%
Labor Force 1.2% 0.9% 0.7%
GDP 3.5% 3.0% 2.5%
World Oil Price 2.3% 1.2% -0.6%
Economic Growth Cases, influence capital investment, productivity gains, andtechnology and market development. Growth rates for key economic variables determineenergy demand growth in both the EIA national and New York’s forecasts. They areprovided in Table 1. Table 1.Annual Average U.S. EIA Growth Rates (1999-2021) of Economic Variables
High Case Outlook Case Low Case
The national economic variables were estimated by EIA for each of the ten censusdivisions of the United States. The High Economic Growth Case incorporatespopulation, labor force, and productivity growth rates that are higher than the OutlookCase. Productivity gains result in lower inflation and interest rates. The Low EconomicGrowth Case assumes lower population, labor force, and productivity gains than theOutlook Case, with higher interest and inflation rates.4
Method Overview
The New York forecasts were derived from EIA’s regional fuel demand and priceforecasts, by determining the historic relationships between fuel demand and prices inNew York and those of the Mid-Atlantic region. Few changes in the relationshipsbetween New York and the Mid-Atlantic region were found, i.e., New York’s energy useas a percentage of Mid-Atlantic energy use has remained fairly stable over time. Twenty-eight years (1970-1997) of New York fuel use, expressed as a percentage of theMid-Atlantic region’s fuel use, defines the historic relationship between the two, by end-use sector. The demand and price relationships were projected into the future using a
5ARIMA models use either past values (the autoregressive model), past errors (the moving average model), orcombinations of past values and past errors to create an accurate projection. A Box-Jenkins univariate time seriesmodel is the specific ARIMA model used. The Box-Jenkins ARIMA modeling process occurs in three stages:Identification, Estimation, and Diagnosis. With SYSTAT®, models are identified with Transform, Case series plot,ACF –Autocorrelation plot, and PACF Partial Autocorrelation plot functions, differenced to create a stationary dataseries, estimated with ARIMA and diagnosed to determine their adequacy with more plots.
6The autoregressive (AR) model addresses serial correlation of errors. For example, a residual from our model revealsan autocorrelation statistic of .953. Correlation coefficients can be squared to reveal the proportion of variance, or inthis case, the variation in error terms. This means that over 89% of the variation in error from predicting New York’spercentage of Mid-Atlantic in one year can be accounted for by the error in predicting the previous year’s percentage.Where serial correlation was found in plotted residuals, the appropriate number of AR parameters were added toeliminate their influence on the forecast.
3-3
univariate time series forecast. The forecasted percentages were then applied to the baseyear, 1999, of the EIA Mid-Atlantic regional forecasts to obtain a New York base year.
The 1999 New York forecasted data were then compared to actual data reported inNYSERDA’s Patterns and Trends 1999. The Mid-Atlantic regional forecasted growthrates were then applied to the actual 1999 data where the 1999 data were typical ofhistorical data. Where 1999 data did not fit, the forecast was based on the 1999 NewYork forecasted base year determined with historical data in the SYSTAT® 9.0 program. New York fuel demand and price forecasts were derived using this analytical process.SYSTAT® 9.0 for Windows® was used to generate the parameters of the univariate time-series model used to describe historic relationships between Mid-Atlantic regional andNew York variables. The SYSTAT® program ran a projection using an Auto RegressiveIntegrated Moving Average (ARIMA) model5 to determine New York’s growth trend inrelation to that of the Mid-Atlantic region. The historical data series used to generateNew York demand and price forecasts for electricity, natural gas, petroleum, and coalsatisfied standard statistical tests, and were deemed to sufficiently capture therelationship between New York energy demand and prices and those of the Mid-Atlanticregion.6
Table 2 shows New York forecasts by sector and fuel. Forecasts for each of the listedfuel sectors can be found in the Draft Energy Plan Appendix.
3-4
Table 3. Energy Demand in New York State
Actual* Outlook Outlook Average Annual Growth Total Growth2000 2006 2021 2000-2006 2006-2021 2000-2021 2000-2021
A summary of Statewide energy demand forecasts is shown in Table 3.
7 Downstate comprises these utility areas: Central Hudson Gas & Electric Corp., Consolidated Edison Co. of N.Y.,Inc., Keyspan New York, Keyspan Long Island, and Orange & Rockland Utilities, Inc.
8 Upstate comprises these utility areas: Corning Natural Gas Corp., National Fuel Distribution Corp., New York StateElectric and Gas Corp., Niagara Mohawk Power Corp., Rochester Gas & Electric Corp., and St. Lawrence GasCompany, Inc.
3-5
The forecasts highlight the demand for electricity, total and residential natural gas, totalpetroleum, home heating oil, gasoline, and coal over the forecast period for the OutlookCase. The Outlook Case features 3.0% average annual economic growth.
The electricity forecasts represent the electricity requirements for retail customers. Usinga weather-adjusted base, an average annual growth rate of 0.73% for total electricityrequirements, measured in gigawatt-hours (GWh), is predicted during the forecast period. The Outlook Case is bounded by Low and High Economic Growth Case forecast ratesranging from 0.4% to 1.1% per year. Peak demand growth, measured in megawatts(MW), lags behind projected growth in total electricity requirements. A variety ofdemand-side management programs reduces peak demand on extreme-weather days. Peak electricity demand is expected to grow at an average annual rate of 0.68%. TheLow and High peak demand forecasted growth rates are 0.3% and 1.1% per year,respectively, over the forecast period.
Total natural gas demand is expected to increase at an average annual rate of 2.67% inthe Outlook Case, over the forecast period. The Low and High Economic Growth Caseforecasted rates for total natural gas are 2.2% and 2.7% per year, respectively. Allsectors, electric generation, residential, commercial, and industrial, exhibit projectedincreases in demand for natural gas. Despite a recent trend of contracting demand,downstate7 demand for natural gas has historically been stronger than upstate8 demand,particularly for the residential sector. Forecasted downstate growth may be furtherslowed due to the World Trade Center disaster. The increases in total gas demand for theHigh and Outlook Economic Growth Cases, 2.71% and 2.66%, respectively, are largelyattributable to projected fuel requirements for electricity generation.
The predicted slowing of growth in demand for petroleum (1.0% average annual growthfrom 2001-2006 and 0.59% average annual growth from 2006 to 2021) is largely drivenby declining use of distillate and residual oil for electric generation. In the Outlook Case,residual oil-fired generation decreases by 95.6% and distillate oil-fired generationdeclines by 78.2% over the forecast period. Home heating oil use decreases approximately 29% over the forecast period. Average annual declines range from 1.57%
9 EIA Annual Energy Outlook 2001, pg. 95
3-6
per year in the Low Economic Growth Case to approximately 1.6% per year in theOutlook and High Economic Growth Cases. The Draft Energy Plan forecast resultsindicate robust growth in distillate requirements for the industrial and transportationsectors, increasing an average of 1.6% and 2.1% per year over the forecast period,respectively. Average annual distillate use is projected to decrease in the residential,commercial, and electric generation sectors, by 1.6%, 0.4%, and 7.0% per year,respectively, during the forecast period. Average annual residual oil requirements areforecasted to decline 0.9% in the commercial sector, 0.0% in the industrial sector, and14% in the electric generation sector over the forecast period. Demand for motorgasoline is expected to increase 21.1% during the 2000-2021 forecast period. Demandfor motor gasoline in the transportation sector is expected to grow between 0.6% and1.2% per year, with most of the growth projected over the first ten years of the forecast.
Total coal use in New York is expected to grow moderately over the forecast period.Average annual growth in the Outlook Case is forecasted at 1.0% and total growth isprojected at 24.1% over the forecast period. A decrease in coal use is forecasted from2005 to 2010. After this slowdown, growth is predicted to rebound as rising natural gaswellhead prices and nuclear power plant retirements are projected to cause increasingdemand for coal-fired baseload capacity in the electric generation sector.9 Coal demandis forecasted to grow between 0.9% and 1.6% annually in the Low and High EconomicGrowth Cases, respectively. The High Economic Growth Case favors coal burning in theelectric generation sector. In that case, total coal use is projected to grow by 38.5% overthe forecast period.
NEW YORK STATE ENERGY PRICES
Statewide average end-use electricity prices (including those of the New York PowerAuthority) are projected to decrease at an average annual rate of approximately 1.4% inconstant 2000 dollars over the forecast period. The Low and High Economic GrowthCase price forecast projects that electricity prices will decrease an average of 1.7% and1.4% per year, respectively, over the forecast period.
In the Outlook Case, Statewide average natural gas prices for the residential sector areprojected to decrease at an average annual rate of approximately 1.0% from 2000 to2021.
In the Low Economic Growth Case, the average prices are projected to decrease at an
3-7
Table 4. Energy Prices in New York State
Actual Outlook Outlook Average Annual Growth Total Growth2000 2006 2021 2000-2006 2006-2021 2000-2021 2000-2021
Coal, $/ ton 39.11 36.34 33.45 -1.22% -0.55% -0.74% -14.47%All prices are expressed in constant 2000 dollars. Average petroleum price based on average of all fuels Btu
annual rate of 1.3%, while in the High Economic Growth Case, an average annual pricedecrease of 0.6% is projected.
Home heating oil prices Statewide are projected to decrease for the residential sector by16.1% over the forecast period. The Outlook Case, which projects moderate demand,predicts the smallest average price decline, about 0.8% per year. This is higher than theHigh Economic Growth Case, which predicts abundant supply and slackened residentialdemand, resulting in a 1.3% annual decrease in prices.
The Statewide coal price is projected to decline at an average annual rate ofapproximately 0.7%, or a total of 14.5% over the forecast period. Both the Low andHigh Economic Growth Cases predict an average decline in coal price over the forecastperiod of 0.8% per year.
Projected Statewide energy prices are shown in Table 4 in constant 2000 dollars. Average prices for each fuel (shaded) are weighted by demand within their respectivecustomer sectors.
10 The loss of load in New York City resulting from the terrorist attack on the World Trade Center is not factored into theforecast. This load is expected to be restored gradually during rebuilding efforts and completely restored once rebuilding isfinished. Load is expected to be fully restored sometime in the early half of the forecast period.
3-8
FINDINGS AND CONCLUSIONS
• Demand and nominal prices for all fuels are forecast to increase at different ratesover the forecast period; however, real prices (accounting for inflation) declinefor all fuels over the forecast period.
• New York’s aggregate demand for petroleum products is projected to risemoderately over the forecast period, with increases projected for motor gasolineand decreases for residential heating oil. Increased world demand is expected toexert upward pressure on prices, even given stable supplies. Over the forecastperiod, demand for motor gasoline is projected to increase 21.1%. Year 2000prices were unusually high, 158.8 cents per gallon, so real prices are expected todrop 8.0% from this level, to 146.1 cents per gallon in 2021.
• Natural gas supply availability, being predominately domestic, is expected to befairly stable. Natural gas prices rose sharply in 2000. This increase was due totight natural gas supplies, both in production and storage. A result of this priceincrease was greater U.S. exploration and drilling, increases in inventory levels,and hence, lower real prices over the forecast period. Demand growth will bestrong in New York, with 73.4% growth over the forecast period. This isprimarily due to a 172.5% increase in natural gas demand for electric powergeneration. Real natural gas prices are expected to decrease an average of 0.26%annually, from $5.61 per dekatherm in 2001 to $5.31 per dekatherm in 2020.
• Total electricity use in New York is expected to grow 16.5% over the forecastperiod, while prices in real terms decline. Real electricity prices are forecast todecline 25.0% over the forecast period due to increased competition amongsuppliers and lower fuel prices. Peak megawatt demand is forecast to grow at aslightly slower rate than total electricity requirements (15.4% versus 16.5%) overthe forecast period.10
• Coal demand is expected to rise moderately, by a total of 24.1% over the forecastperiod. Customer coal prices decline over the forecast period along with mine-mouth coal prices. Productivity increases continue to result from technologyenhancements, economies of scale, and better mine design. As a result, real coalprices are forecast to decline 14.5% over the forecast period.
1 Discussion of energy efficiency does not include temporary load curtailment or price responsive loadmanagement activities, which are discussed in the Electricity Assessment.
2 Department of Energy, Energy Information Administration, State Energy Data Report, 1999.
3 Department of Energy, Energy Information Administration, State Energy Data Report, 1999 and U.S.Bureau of Economic Analysis, Survey of Current Business, June 2000.
4 Department of Energy, Energy Information Administration, State Energy Data Report, 1999 and U.S.Bureau of Economic Analysis, Survey of Current Business, June 2000.
5 Primary energy is energy used by the four major sectors (transportation, industrial, commercial andresidential) and includes all fuels used to generate electricity.
3-9
SECTION 3.2
ENERGY EFFICIENCY ASSESSMENT
INTRODUCTION
This Energy Efficiency Assessment provides information on New York’s energy use andits efficiency of energy use, a history of the State’s energy efficiency initiatives, anddescriptions of current program offerings with funding levels and achievements to date. This report also discusses the benefits of energy efficiency, as well as the potential for,and the barriers to, further improvements in energy efficiency. For the purposes of thisassessment, energy efficiency is defined as providing permanent reductions in energy usewhile maintaining equal or greater quality of services.1
OVERVIEW OF ENERGY USE TRENDS IN NEW YORK STATE
With 7% of the nation’s population, New York is the most energy-efficient state in thecontinental United States on a per-capita basis, accounting for less than 5% of thenation’s primary energy use.2 New York State has the third lowest energy intensity(defined as British thermal units [Btus] used to produce one dollar of Gross State Product[GSP]), below only Connecticut and Hawaii, despite being the fourth largest energy user among the fifty United States.3 Lower energy intensity generally indicates higher energyefficiency. In 1999, New York used 7,388 million Btus per dollar of GSP, a figure that is44% below the national average.4 Figure 1 shows the 20-year trend in New York’sprimary energy use per dollar of GSP.5 The significant decline in energy intensity in theState, shown in Figure 1, is due to a general shift from a manufacturing economy to aservice-based economy, as well as energy efficiency improvements resulting from a
3-10
1980 1982 1984 1986 1988 1990 1992 1994 1996 1998
350
400
450
500
550
600
650
Bill
ion
92$
2500
3000
3500
4000
4500
5000
5500TB
tu
Gross State Product Primary Energy Use
Source: NYSERDA, Patterns and Trends.
NEW YORK STATEPrimary Energy Use and Gross State Product
1980 - 1999
Figure 2
1980 1982 1984 1986 1988 1990 1992 1994 1996 1998
6
7
8
9
10
MB
tu/9
2$
Source: NYSERDA, Patterns and Trends.
NEW YORK STATEPrimary Energy Use per Unit of Gross State Product
1980 - 1999
Figure 1
range of programs and price-induced activities.
Primary energy use as compared to GSP over the same 20-year period is shown in Figure2. This figure shows that GSP has risen despite relative stability in primary energy use.
6 According to the U.S. Environmental Protection Agency, Office of Air and Radiation, Fuel EconomyProgram Fact Sheet, the 1996 - 2003 CAFE standards are 27.5 miles per gallon (mpg) for domestic andimported passenger cars, and 20.7 mpg for light-duty trucks.
7 U.S. Environmental Protection Agency, Light Duty Automotive Technology and Fuel Economy Trends,1975 Through 2001, September 2001.
3-11
Over this period, GSP grew by 55.7%, while energy use increased by only 7.6%. NewYork’s total primary energy use in 1999 was 4,207 trillion Btus (TBtus), compared to3,909 TBtus in 1980.
Over the past 20 years, energy use in New York State has declined significantly amongall of the major end-use sectors. Average annual energy use by sector and the percentchange over the 20-year period is shown in Table 1. The most significant improvementsin energy usage have occurred in the industrial and transportation sectors, respectively.
Table 1: New York State Average Energy Use by Sector: 1980 and 1999
Sector 1980 1999 % Change
Residential (MMBtu per household) 123.8 107.4 -13.2%
Commercial (MMBtu per capita non-manufacturingemployment) 93.4 76.4 -18.2%
Industrial (MBtu per total GSP) 1.5 0.6 -60.0%
Transportation (Btu per Vehicle Mile Traveled) 13,353 9,204 -31.1%
MMBtu = million BtusMBtu = thousand Btus
Improvements in energy use per unit of GSP in the industrial sector are largely due to adecrease in heavy manufacturing in New York. Industrial sector efficiencyimprovements can also be credited, to some extent, to programs designed to improveproduction efficiency. Transportation sector improvements, as measured in Btus pervehicle mile traveled (VMT), are largely due to federally-mandated improvements in fueleconomy, as well as the use of lighter materials on passenger vehicles. The CorporateAverage Fuel Economy (CAFE) standards, established by the Energy Policy Act of 1975,dictate the average miles per gallon that passenger cars and light-duty trucks sold in theUnites States must attain.6 New light vehicle fuel economy improved fleet-wide from themid-1970s through the late-1980s.7 Transportation sector improvements are also due, tosome extent, to programs promoting more efficient alternatively-fueled vehicles, such asthose that are electric or hybrid-electric powered. The residential and commercial sectors
8 Cases 94-E-0952 et al., In the Matter of Competitive Opportunities Regarding Electric Service, OpinionNo. 96-12, Opinion and Order Regarding Competitive Opportunities for Electric Service (issued andeffective 20 May 1996).
3-12
have experienced the smallest declines in energy use. The improvements that haveoccurred are largely the result of enhancements in building design and construction,advances in energy-using appliances, products and equipment, and energy efficiencyprograms offered to these sectors.
ENERGY EFFICIENCY IN NEW YORK STATE
This section describes the evolution of energy efficiency programs in New York,including funding levels for major efficiency initiatives over the past ten years.
Evolution of Energy Efficiency Programs
The nature of the State’s energy efficiency programs has changed substantially over thepast twenty years. The most significant early investments in energy efficiency programsoccurred under the demand-side management (DSM) programs offered by the State’sinvestor-owned utilities. In 1984, the Public Service Commission (PSC) requiredinvestor-owned utilities (IOUs) to develop pilot DSM programs to improve energyefficiency and load management. At the PSC’s direction, funding for these programs wasinitially set at about $25 million per year.
After a three-year period, the PSC determined that DSM programs represented a viableoption for helping to meet future electricity needs in the State, and the IOUs weredirected to develop annual and long-range plans for continuing and expanding suchprograms. During the period from 1987-1989, utility DSM programs were largelyfocused on load management. Then, regulatory actions in the early 1990s causedprograms to shift toward energy efficiency. In 1992, IOU expenditures on DSMprograms reached a peak of $286 million. At this point, program offerings were quitediverse, ranging from rebates for residential customers to financial incentives forinstalling high-efficiency measures in industrial facilities. In 1994, DSM expendituresbegan to decline in part due to the escalating effect of DSM spending on electricity rates,coupled with low prevailing energy prices. Large reserve margins and the economicrecession were also factors. DSM expenditures continued to decline through 1996 untilthe PSC established New York’s System Benefits Charge (SBC).
New York’s SBC was established in May 1996 by PSC Opinion No. 96-128 to fundpublic benefit programs during the State’s transition to a competitive retail electricity
9 Cases 94-E-0952 et al., In the Matter of Competitive Opportunities Regarding Electric Service, OpinionNo. 98-3, Opinion and Order Concerning System Benefits Charge Issues (issued and effective 30 January1998).
10 A mill is one tenth of a cent.
11 New York State Public Service Commission. Opinion and Order Concerning System Benefits ChargeIssues. Issued and effective, January 30, 1998.
12 New York State Public Service Commission. Order Continuing and Expanding the System BenefitsCharge for Public Benefits Charge for Public Benefits Programs. Issued and effective, January 26, 2001.
3-13
market. The SBC is designed to fund public policy initiatives in areas not expected to beadequately addressed by competitive markets: energy efficiency (including loadreduction efforts), low-income energy affordability, research and development (R&D),and environmental monitoring and mitigation. SBC funding levels were originallyestablished in individual electric utility settlement agreements9 and funds are collectedthrough a non-bypassable charge on electric utility transmission and distribution systems. The PSC capped SBC funding at one mill10 per kilowatt-hour (kWh) during the initialphase of transition, based upon 1995 utility expenditures for demand-side managementprograms. Total funding for the three-year SBC program was $234.3 million. The NewYork State Energy Research and Development Authority (NYSERDA) was designated asthe administrator of the Statewide public benefits program, pursuant to a January 30,1998 order by the PSC.11 The SBC program began operation on July 1, 1998. The PSCallocated $172 million of SBC funds to NYSERDA, and the IOUs retained the remainderof this funding to meet existing obligations and to continue some low-income programs.
With the advent of the SBC, energy efficiency programs in New York made a transitionfrom rebate-driven offerings to market development initiatives. The New York Energy$martK public benefits program, offered by NYSERDA, combines infrastructuredevelopment, awareness activities, and targeted incentive offerings in order to transformmarkets. Whereas the DSM programs were primarily based on one-time transactions orrebates to end-users, the SBC market development programs establish long-termrelationships with participants and networks of trade allies in order to support sustainedchanges in markets and consumer behavior.
After two and one-half years of SBC program implementation and evaluation, the PSCdirected that these programs should be extended with increased funding. In its January26, 2001 Order12, the PSC extended SBC programs through June 30, 2006 and increasedfunding from $78.1 million to $150 million annually. Continuing the SBC programs isintended to help sustain momentum for the State’s efforts to promote competitivemarkets for energy efficiency, offer low-income services, conduct research and
3-14
development, protect the environment, and provide direct economic and environmentalbenefits to New Yorkers. Energy efficiency programs are also being recognized for theirrole in helping ensure system reliability and securing adequate power to meet summerpeak conditions.
The collective energy efficiency expenditures, including utility DSM, SBC, and other government programs, over the past ten years is shown in Table 2. The totalinvestment of these programs over the ten-year period is more than $2.7 billion. Spending declined after DSM investments reached a high in 1992. The low reached in1998 reflects the transition from the utility-sponsored programs to the SBC program. From 1998 through 2000, spending was on an upward trend as SBC programs and otherenergy efficiency programs (e.g., the Long Island Power Authority’s [LIPA] CleanEnergy Initiative) began. The following section of this assessment provides moredetailed summaries of key energy efficiency programs and their individual achievements.
3-15
Table 2: Energy Efficiency Spending in New York State: 1990-2000 ($Millions)
Spending, in many cases, is less than actual contracted or encumbered funds. Spending includesadministration and overhead.(1) Source: Department of Public Service. (2) Home Insulation and Energy Conservation Act. Source: DPS. (3) Includes energy efficiency and select low-income and research and development (R&D) SBC programs,federally-funded State Energy Programs, and statutory R&D initiatives in the energy efficiency area. Source:NYSERDA.(4) Long Island Power Authority. Excludes Clean Energy Initiative peak load management and renewableprograms. Source: LIPA. (5) New York Power Authority. Source: NYPA.(6) Includes the federally-funded Weatherization Assistance Program (Source: New York State Division ofHousing and Community Renewal), and the portion of Petroleum Overcharge Restitution Act funds forenergy efficiency programs not administered by NYPA (Source: NYSERDA).(7) Totals may not sum due to rounding.
DESCRIPTION OF MAJOR ENERGY EFFICIENCY PROGRAMS
This section describes the achievements of several major energy efficiency programsdelivered over the past ten years and major energy efficiency programs currently offered.
Utility Demand Side Management and Public Benefit Programs
In response to industry restructuring in the late 1990s, utilities redirected their effortsfrom DSM programs to market development activities. Starting in 1998, continuing
13 Some utilities retained SBC funding for low-income programs. These programs generally focus onarrearage reduction, and are not included in this discussion.
14 Cumulative annual savings associated with pre-1990 spending are 157 GWh and 246 MW.
3-16
utility DSM efficiency programs were funded by the SBC.13 Energy efficiencyexpenditures for utility DSM and SBC programs are shown in Table 3 along with actualand projected electricity and summer peak demand reductions achieved between 1990and 2006.14 The italics in Table 3 signify projected spending and achievements. Selectutility energy efficiency activities are described in Table 4.
Table 3: Utility DSM/SBC Spending with Actual and Projected Achievements(1990-2006)
Year Annual Spending (Millions)
Cumulative AnnualElectric Reductions
(GWh)
Cumulative Annual Peak Demand Reductions
(Summer MW)
1990 $99.0 325 85
1991 $198.0 1,082 264
1992 $286.0 2,289 537
1993 $280.0 3,620 853
1994 $188.0 4,632 1,105
1995 $106.0 5,349 1,269
1996 $73.0 5,796 1,377
1997 $48.0 5,796(1) 1,377(1)
1998 $12.4 5,817(1) 1,382(1)
1999 $9.5 5,824(1) 1,382(1)
2000 $12.7 5,834(1) 1,382(1)
2001 $11.7 5,519(2) 1,297(2)
2002 $10.3 4,772(2) 1,118(2)
2003 $10.2 3,575(2) 845(2)
2004 $10.3 2,254(2) 529(2)
2005 $10.3 1,243(2) 277(2)
Jan/June 2006 $5.2 536(2) 113(2)
Total $1,370.6 64,263 ----
(1) A large portion of spending from 1997 through 2000 went toward existing DSM bidding projects. Savings for these projects were counted in prior years. Additional savings from utilities with the mostsignificant achievements (Consolidated Edison Company of New York, Inc., New York State Electricand Gas Corporation and Niagara Mohawk Power Corporation) are included.(2) Declining cumulative values shown in projections are due to an assumed 10-year measure lifetime.
3-17
Table 4: Current Utility Energy Efficiency Activities
Company Name Program Name Program Description
Central Hudson Gas & ElectricCorporation
Residential EnergySolutions
Information on electric technologies, rebateprogram for high-efficiency heat pumps andcentral air conditioning, and leasing of high-efficiency electric water heaters.
Commercial/Industrial (C/I)Energy Solutions
Services to assist C/I customers in using energymore efficiently (e.g., low-cost financing, freeon-site energy audits).
Consolidated EdisonCompany of NewYork, Inc.
Energy Saving Tips Information for residential customers and tips onsaving energy.
KeySpanCorporation
Home Energy Services Heating and air conditioning services forresidential customers.
Energy ConservationInformation
Includes Consumer Update newsletters with tipson saving energy in the home.
C/I Services Energy management for C/I customers.
RD&D
Projects test combined heat and power systemsthat reduce electric load and provide waste heatto power applications such as refrigerationsystem absorption chillers.
New York State Electric & GasCorporation
Appliance Calculator Residential customers can calculate annualenergy use of different appliances on-line.
Energy Profiler Online™ On-line C/I customer information on energyusage, including benchmarking information.
Niagara MohawkPower Corporation
Energy & Your HomeHome Energy Analysis
On-line energy analysis and energy savingpractices for the home.
Business Energy AnalysisBusiness TechnologiesFacility Energy Information
On-line energy analysis and information onadvanced end-use technologies.
Orange & RocklandUtilities, Inc.
Household Energy-SavingTips Tips for residential customers on saving energy.
Adapted from: Edison Electric Institute. New York State EEI Member and Non-MemberResidential/Commercial/Industrial Efficiency and Demand Response Programs for the Summer of 2001. UpdatedMay 30, 2001.
3-18
NYSERDA-Administered SBC Programs
The NYSERDA-administered New York Energy $martK SBC program commenced byorder of the PSC on July 1, 1998, and will run through June 30, 2006. Table 5 showsspending and achievements from the first three years of the New York Energy $martKprogram (SBCI) along with projected spending and achievements for the remaining fiveyears (SBCII). The italics in Table 5 signify projected spending and achievements. Themajor New York Energy $martK commercial/industrial and residential energy efficiencyprograms are described in Tables 6 and 7, respectively. Results provided in Tables 6 and7 are associated with funds awarded through March 2001, unless otherwise noted. Inaddition to the programs listed in Tables 6 and 7, New York Energy $martK also includesenergy efficiency R&D projects focusing on innovative end-use energy-efficient andenergy-saving technologies and systems applicable to New York markets.
Table 5: NYSERDA-Administered SBC Energy Efficiency Spending with Projectedand Actual Achievements (1998-2006)
Year Annual Spending (Millions)
Cumulative AnnualElectric Reductions
(GWh) (3)
Cumulative Annual Peak Demand Reductions
(Summer MW) (3)
1998 $1.2(1) 0 0
1999 $2.6(1) 81 17
2000 $26.3(1) 243 52
2001 $134.5(2) 486 104
2002 $185.1(2) 1,183 348
2003 $112 1,772 440
2004 $112 2,198 481
2005 $112 2,623 622
2006 $56 3,069 858
Total $741.7 11,655 -----
Sources: New York Energy $martK evaluation and financial reports and the System Benefits ChargeProposed Operating Plan for New York Energy $martK Programs (2001 - 2006), February 15, 2001.
Spending and achievements include Energy Efficiency (exclusive of peak load management activities),Low-Income, and energy efficiency and strategic R&D. Total spending for SBCI programs isapproximately $157.7 million and total spending for SBCII is approximately $584 million.
(1) Due to the ramping up of the SBC programs, spending is significantly less than funds encumbered(contracted). Encumbered funds were $1.9 million in 1998, $30.8 million in 1999, and $39.6 million in2000. Cumulative encumbered funding by December 31, 2000 was $72.3 million.(2) SBCI and SBCII expenditures are projected to occur in these years.(3) Reductions reported here are for completed work under the identified subset of New York Energy$martK programs, and therefore, will differ from total reductions reported in the sources cited above.
3-19
Table 6: Major New York Energy $martK Commercial and Industrial EnergyEfficiency Programs
ProgramName
SBCBudget(1)
(Millions)Program Description
SelectResults/Status
(based onawarded funding)
Commercialand IndustrialPerformance $40.0
Fosters growth of the energy services industrythrough performance-based incentives to energyefficiency service providers. Leverages privatecapital investments in electric efficiency anddemand saving measures.
$40 million awardedfor 140 projects. Expected savings of247 million kWh and54 MW.
NewConstruction $17.1
Provides financial incentives to building ownersand technical assistance to building designers inan effort to change standard building design andconstruction practices.
$20 million awardedfor 380 projectssaving 60 millionkWh and 22 MW.
SmartEquipmentChoices
N/AProvides financial incentives for the purchaseand installation of cost-effective, high efficiencyequipment (i.e., lighting, motors, and HVAC).
Until 2001, this offerwas part of NewConstruction.
TechnicalAssistance $9.9
Provides cost-sharing of studies conducted byqualified professionals to help end users identifyefficiency improvements in their facilities. Services include energy audits, energyoperations management, rate analysis andaggregation, and other services.
$9.1 million awardedto 730 projects. Expected savings are227 million kWh, 60MW and 3 TBtus ofgas and oil.
PremiumEfficiencyMotors
$1.5
Designed to induce lasting structural change inthe motors market. Offers incentives toparticipating vendors for the sale of Consortiumfor Energy Efficiency-qualified premiumefficiency motors.
$1 million in totalawards for 1,364motors, with savingsof 1.1 million kWhand 0.2 MW.
CommercialHVAC $1.7
Designed to increase availability, promotion andsale of energy-efficient HVAC products andservices. Projects promote commissioning andpurchase of high efficiency unitary HVAC.
The program recentlybegan. The goal forelectricity savings is6,000 MWh.
SmallCommercialLighting
$3.8
Promotes effective, energy efficient lighting insmall commercial spaces by offering incentivesto contractors and multi-site end users. Alsooffers contractor training incentives.
Contractor training isin progress and thefirst lighting projectis expected soon.
Loan Fund $6.0
Through more than 50 participating lenders, theLoan Fund offers a 4.5% reduction fromparticipating lenders rates for energy efficiencyimprovements and renewable technologyprojects up to $500,000.
$0.9 million awardedfor 47 loans withsavings of 3.5 millionkWh and 1.2 MW.
Source: NYSERDA.(1) Budgets are for the first three-years.
3-20
Table 7: Major New York Energy $martK Residential and Low-Income EnergyEfficiency Programs
ProgramName
SBCBudget(1)
(Millions)Program Description
SelectResults/Status
(based onawarded funding)
ResidentialAppliances& Lighting and ENERGYSTAR®
Awareness
$19.0
Designed to increase awareness of ENERGYSTAR® and sale of these products. TheResidential Appliances & Lighting programworks with retailers to improve promotion andsales while the ENERGY STAR® Awareness effortprovides a multi-media campaign to increaseconsumer awareness, understanding, andpurchases.
Increased consumerawareness (34% to43%). Market shareincreases for ENERGYSTAR® appliances (up119%), lighting (up114%), and homeelectronics (up 7%).
Keep Cool $4.1
Designed to reduce peak demand. Residents andbuilding owners turn in old room air conditioners(RACs) and receive $75 upon purchase of a newENERGY STAR® RAC. Old RACs are recycled. In 2001, the Long Island Power Authority(LIPA) and New York Power Authority (NYPA)joined NYSERDA to offer an expanded program.
About 39,000 RACsturned in fromNYSERDA, LIPA,and NYPA areas. Estimated savings are8.5 million kWh and11.7 MW.
ENERGYSTAR®
Homes $2.4
Provides technical assistance and financialincentives encouraging participating builders toconstruct ENERGY STAR® Homes that use 30%less energy than the Model Energy Code.
The program beganin June 2001.
HomePerformancewithENERGYSTAR®
$7.0
Designed to enhance the existing capacity fordelivering energy efficiency services to one- tofour-family residences. Consumer protection isfostered by training and qualifying buildingperformance contractors, home energy raters, andcontractors providing energy efficiency services.
The program is in itsearly stages. Eightcontractors have beencertified and 16homes have receivedassessments.
Low IncomeDirectInstallationProgram
$9.9
Builds on the federal Weatherization AssistanceProgram to reduce low-income energy burdens. Offers energy efficiency measures (i.e., lighting,refrigerators) and information on energy use andefficiency.
Increase affordability of public housing for low-income residents by incorporating energyefficiency into the design, selection, andinstallation of equipment in the State’s portfolioof publicly-assisted housing. Incentives writedown the cost of high efficiency measures.
60 buildings haveentered the programand three audits arecomplete. Incentiveswill range from 5-50% of total costs.
Source: NYSERDA.(1) Budgets are for the first three-years.
3-21
Public Power Energy Efficiency Programs
The Long Island Power Authority’s Clean Energy Initiative. In May 1999, LIPA’s Boardof Trustees approved a five-year, $170 million Clean Energy Initiative. This initiativeincludes energy efficiency programs and research and development efforts. Table 8depicts the spending and achievements of LIPA’s key energy efficiency programs for1999 and 2000, as well as projected spending and achievements for the remaining yearsof the initiative. The italics in Table 8 signify projected spending and achievements. These key energy efficiency programs are then summarized in Table 9.
Table 8: LIPA Clean Energy Initiative Actual and Projected Spending andAchievements for Energy Efficiency Programs (1999-2004)
Year Annual Spending(1)
(Millions)Cumulative AnnualElectric Reductions
(GWh)
Cumulative Annual Peak Demand Reductions
(Summer MW)
1999 $2.9 6.8 3.5
2000 $14.6 51.0 15.0
2001 $20.2(2) 112.4 32.7
2002 $21.5(2) 183.5 54.7
2003 $22.3(2) 261.9 79.2
2004 $12.5(2) 307.5 92.0
TOTAL $94(2) 923.1 -----
Source: LIPA, Clean Energy Initiative Draft Biennial Report, June 2001.
(1) Spending on energy efficiency is only a portion of the total Clean Energy Initiative spending. Remaining funds earmarked for renewables and peak load management programs are not included. (2) Projected spending is subject to change based on program evaluations and customer needs.
3-22
Table 9: Major LIPA Clean Energy Initiative Energy Efficiency Programs
ProgramName
Yr. 2000Spending(Millions)
Program Description Yr. 2000Select Results
ResidentialLighting andAppliances
$5.8
Aims to increase ENERGY STAR® lighting andappliance sales through more than 200participating retailers. Offers rebates andreduced costs for high efficiency measures.
More than 450,000participants achievingsavings of 32,283MWh and 3.7 MW.
ResidentialHVACEfficiency
$3.3
Customer incentives offset the incrementalcost of high efficiency HVAC. Contractorincentives are provided for proper equipmentsizing. Contractors are also trained in homesafety, health, and comfort issues.
More than 8,000participants, withelectricity and demandsavings of 3,740 MWhand 5.6 MW.
ResidentialEnergyAffordabilityPartnership
$1.7
Works with federal WAP to provide freeinstallation of cost-effective air sealing,insulation, HVAC repairs, lighting, and othermeasures to low-income customers.
Visited more than2,800 dwellings withsavings of 2,400MWh and 0.2 MW.
ResidentialInformationand Education
$0.4Provides efficiency information throughadvertising, the LIPA website, energy audits,and other methods.
Savings of 2,568MWh and 0.9 MW.
CommercialConstruction $1.0
Promotes the application of a broad range ofenergy-efficient electric technologies anddesign assistance. The program offersprescriptive, custom and whole-buildingcomponents.
The 36 projectsinvolved to datecontribute 1,389 MWhand 0.2 MW ofsavings.
RegionalPremiumEfficiencyMotors
$0.1
Offers customer incentives and informationand technical assistance for customers,manufacturers, vendors, designers, andengineerings. Uses the Northeast EnergyEfficiency Alliance’s MotorUp program.
75 participants withsavings of 133 MWhand 0.027 MW.
High-EfficiencyUnitaryHVAC
$0.2Offers incentives for commercial central airconditioners and air and water source heatpumps. Uses the NEEP program concept.
Rebates for 110 units,with savings of 273MWh and 0.18 MW.
ResourceConservationManagerProgram
$0.1
Underwrites the salaries of resourceconservation managers employed by schoolsand municipalities. With proper training, it isexpected that these individuals will help end-users reduce resource use and costs.
Three RCM projectsare underway.
Customer-DrivenEfficiency
$0.4Offers residential and commercial incentives,audits, and assistance for efficiency measuresnot covered by LIPA’s other programs.
855 participants withsavings of 1,430 MWhand 0.63 MW.
Sources: LIPA, Clean Energy Initiative Draft Biennial Report, June 2001 and LIPA, Clean EnergyInitiative Annual Report 2000.
3-23
New York Power Authority Energy Efficiency Programs. The New York PowerAuthority’s (NYPA) Energy Services program began in 1990 as a service to NYPA’sgovernment customers in New York City and Westchester County. Since its inception,Energy Services has been expanded to serve State-operated facilities, public schools,community colleges, and county and municipal governments across the State. In mostcases, NYPA finances the identification, design, and installation costs for upgrades toenergy-using equipment and recovers these costs by sharing in the resulting electric billsavings. The participants retain all the energy savings once NYPA’s loan is repaid,usually within ten years or less. Table 10 shows actual and projected investments andresults for NYPA’s major energy efficiency programs. The italics in Table 10 signifyprojections. NYPA’s major energy efficiency programs are described in Table 11. Inaddition to the efficiency programs listed in Table 11, NYPA is preparing to begin acombined heat and power program in 2002.
Table 10: NYPA Energy Efficiency Programs Actual and Projected Investment andResults (1990 - 2004)
Year Annual Spending(Millions)
Cumulative AnnualElectric Reductions
(GWh)
Cumulative Annual Peak Demand Reductions
(Summer MW)
1990 $2 1 0.6
1991 $12 22 5.6
1992 $22 66 18.6
1993 $50 152 37.6
1994 $38 233 56.6
1995 $54 286 69.6
1996 $76.0 360 86.6
1997 $72.0 465 111.6
1998 $73.0 556 130.6
1999 $92.0 607 139.6
2000 $98.0 667 149.6
2001 $100 723 162.6
2002 $100 779 175.6
2003 $100 835 188.6
2004 $100 891 201.6
TOTAL $989 6,643 -----
Source: NYPA.
3-24
Table 11: Major NYPA Energy Efficiency Programs
Program Name Spending(Millions)
Program Description SelectResults/Status
High EfficiencyLighting Program(1) $312.2 Finances installation of efficient lighting, as well as
motors, energy management systems, and sensors.573,117 MWhand 118 MW.
Watt Busters(2) $5.4Provided home energy audits and weatherization toresidential customers served by NYPA’s municipaland cooperative system customers.
37,692 MWhand 15.4 MW.
Public Housing $47.1
Replaces old refrigerators in New York City HousingAuthority buildings with new units using half theenergy and a more environmentally-benign refrigerant. The project has served as a model for more than 100other public housing authorities and utilities.
69,986 MWhand 8.7 MW.NYPA projects180,000 replace-ments by 2003.
New Construction(2) $2.9Provided rebates to public entities purchasing NYPApower for installation of high-efficiency lighting andmotors in new facilities.
23,611 MWhand 4.3 MW.
Energy Services $20.2 Provides audits and efficiency measures, includinglighting, boilers, and motors, to public entities.
15,032 MWhand 4.3 MW.
Electro-technologies $49.9Provides NYPA customers with financing, technicalservices, and installation for energy-efficient electrictechnologies, such as chillers and water purification.
2,902 MWh and 3.1 MW.
Industrials Program $6.8Provides financing to NYPA’s industrial customers forinstallation of energy efficiency improvementsincluding lighting, HVAC, and motors.
6,688 MWhand 1 MW.
Energy Plus Oil HeatRebate Program(2) $6.9(4)
Provided nearly 38,300 rebates for the installation ofnew, high-efficiency residential oil-fired boilers, andwarm-air furnaces.
4.4 milliongallons of oil(4)
Non-Electric EndUses $19.0
Assists public entities that purchase NYPA power inimproving the efficiency of non-electric measures suchas domestic water systems and boilers.
Reduced totalenergy budgets.
Clean Air forSchools $74.1
Replaced coal-fired heating in public schools with newsystems fired by oil or gas. This program was fundedby the 1996 Clean Water/Clean Air Bond Act.
20 tons green-house gases
Climate Controls $5.3Through funding from the New York City Board ofEducation, NYPA helps to improve air compressors,steam distribution, and thermostat controls in schools.
The programbegan in 1999.
Coal Pilots(3) $14.0 Provided funds to replace New York City publicschool coal boilers with cleaner gas-fired equipment.
Assisted 12schools.
Source: Data provided by NYPA with the exception of the Energy Plus Oil Heat Rebate Program.All spending and results are to date since program inception.(1) Includes County and Municipal, Long Island, Public Schools, Southeastern New York, and Statewide HighEfficiency Lighting Programs.(2) Program has concluded.(3) Includes $5.5 million in Petroleum Overcharge Restitution (POCR) funding for two rounds prior to NYPAadministration. NYPA received approximately $1.4 million to offer the third and final round of the program.(4) Results include NYPA’s program plus the two prior rounds.
15 Report on 1994 State Agency Energy Plans. March 1995.
3-25
Other Energy Efficiency Programs
This section discusses other energy efficiency initiatives including executive andlegislative programs, federally-supported programs, such as the WeatherizationAssistance Programs (WAP) and State Energy Programs (SEP), as well as statutoryprograms currently being administered by NYSERDA.
Governor Pataki’s Executive Order 111. In June 2001, Governor Pataki signedExecutive Order 111 aimed at improving the energy efficiency of all State agencies,departments, public benefit corporations, and public authorities. As required in theOrder, all affected entities shall seek to achieve a reduction in energy use in leased,operated, or owned buildings of 35% by 2010, relative to 1990 levels. Annual Stateenergy use for 1989-1990 was about 35 TBtus.15
Affected entities are directed to establish agency-wide reduction targets and schedules forreaching the targets. They must also establish peak electric demand reduction targets for2005 and 2010. NYSERDA has already established a task force and will work withNYPA and LIPA to ensure that all agencies have access to the resources they need toestablish energy use baselines and develop cost-effective strategies for reducing energyuse.
The Executive Order specifies the following practices for existing and new buildings,renovations, and procurement of products and vehicles:
• Existing buildings are required to implement energy efficiency practices withrespect to operation and maintenance. Practices could include inspecting andrecommissioning, re-tuning heating, ventilation, and air conditioning (HVAC)equipment, and striving to meet the ENERGY STAR® building criteria for energyperformance and indoor air quality to the maximum extent practicable.
• New buildings or substantial renovations of existing buildings are required, to themaximum extent practicable, to follow guidelines for the construction of “GreenBuildings” including guidelines set forth in Tax Law §19, which created theGreen Buildings Tax Credit and the U.S. Green Buildings Council’s LEEDTM
rating system. State agencies engaged in new construction shall achieve at least a20% improvement in energy efficiency performance relative to levels required bythe State’s Energy Conservation Code (as amended). For substantial renovation,agencies shall achieve at least a 10% improvement.
16 NYSERDA uses 5% above Energy Code as the standard practice, or baseline, for New Construction and otherprograms. This reflects improvements in equipment since the current Energy Code standards were adopted.
3-26
• When procuring new products, State agencies are required to select ENERGYSTAR® products. NYSERDA will adopt guidelines designating target energyefficiency levels for those products not included in the federal government’sprogram.
• When procuring new vehicles, State agencies must obtain increasing percentagesof alternative-fuel vehicles. By 2005, at least 50% of new light-duty vehiclesacquired by each agency shall be alternatively fueled. By 2010, 100% must bealternatively fueled. For medium and heavy duty vehicles, State agencies mustimplement strategies to reduce petroleum use and emissions, using alternative fuelvehicles wherever possible.
New York State Energy Conservation Construction Code. The New York State EnergyConservation Construction Code (Energy Code), which became effective in 1979, setsminimum standards for the design and construction of all new buildings and thesubstantial renovation of existing buildings in New York. The Energy Code has not beensubstantially revised since 1989, and it is generally recognized that much newconstruction and substantial renovation of buildings exceeds current Code requirementsin terms of energy efficiency.16 Therefore, the Energy Code is no longer stimulating thesignificant energy savings that it had in the past.
Since a great deal of the building equipment covered by the Energy Code can last 20 to30 years (e.g., HVAC equipment, lighting systems, windows, and insulation materials),there is great opportunity to achieve lasting improvements in buildings through theEnergy Code mechanism. New York State is currently in the process of amending theEnergy Code, and is considering several enhancements including adopting standards forNational Electrical Manufacturers Association (NEMA) Standard ENERGY STAR®/TP-1transformers, adopting recommendations on building commissioning, and retaininghigher building envelope requirements for electrically-heated homes. The Energy Codeamendments currently under consideration are expected to lead to significant energy andcost savings, as well as environmental benefits. If these amendments are adopted, NewYork’s building energy codes will be among the most progressive in the country. Thelow- and high-end estimates for energy savings and emission reductions are provided inTable 12.
3-27
Table 12: Expected Annual Energy Savings and Air Emission Reductions fromEnergy Code Amendments
Low Estimate High Estimate
End-user electricity savings 276 million kWh 444 million kWh
Other fuel savings (including oil and natural gas) 1.1 TBtus 1.7 TBtus
Cost savings to building owners, operators and tenants(from reduced electricity and other fuels)
Clean Water/Clean Air Bond Act. The 1996 Clean Water/Clean Air Bond Act included$55 million for clean-fueled buses. The Clean-Fueled Bus Program, administered byNYSERDA, provides funds to State and local transit agencies, municipalities, andschools for up to 100% of the incremental cost of new alternative fuel buses andsupporting infrastructure. A total of $20.8 million has been awarded in four rounds of theprogram. This funding will support the purchase of 378 buses including compressednatural gas (300), battery electric (11), and diesel hybrid-electric technology (67).
The hybrid-electric bus, promoted through the Clean-Fueled Bus Program, wasdeveloped under a NYSERDA Research and Development initiative. Electric andhybrid-electric technologies offer many benefits including significant fuel efficiencygains and the resultant reduction in emissions and dependence on imported oil. Efficiency improvements on the order of 25-30% have been achieved in New York Cityby switching to electric or hybrid-electric buses. These efficiency improvements arelargely the result of the regenerative braking system and the significant decrease inenergy use during idling, especially in city traffic. The 10 diesel hybrid-electric buseswhich are currently on routes in New York City are expected to save approximately35,630 gallons of diesel fuel (representing approximately 4,900 MMBtu) per year inregular use. Monitoring of these vehicles will be required to measure the level ofperformance in future years. For more information on clean fuels and technologies, referto the Energy and Transportation issue report (Section 2.3).
New York State Alternative Fuel (Clean Fuel) Vehicle Tax Incentive. New Yorkrecently enacted tax incentive legislation for electric vehicles, clean-fuel vehicles, andclean-fuel vehicle refueling properties. Federal tax credits also exist for these
17 The incentive does not cover hybrid electric/gasoline powered vehicles.
18 New York State Energy Law Article 5, Section 5-108-a.
3-28
technologies. The State tax incentive program applies to vehicles and refuelingproperties placed into service after January 1, 1998. The incentive period is set to expireon February 28, 2003. Eligible clean fuels include: natural gas, liquefied petroleum gas,hydrogen, and electricity.17 The New York State tax credit for electric vehicles is equalto 50% of the incremental cost (up to a maximum of $5,000 per vehicle) of acomparably-sized and styled gasoline vehicle. For more information on clean fuels, referto the Energy and Transportation issue report (Section 2.3).
New York State Green Building Tax Credit. In an effort to promote green buildinginitiatives in New York, the State approved a $25 million tax credit as part of the fiscalyear 2000-2001 budget. The credit offered under this legislation is intended to encouragebuilding owners and developers to use advanced materials and technologies inconstruction and renovation projects. These financial incentives will help to increase thenumber of energy-efficient commercial and residential buildings in the State. Specificenergy efficiency requirements stipulate that:
• Buildings being newly constructed may use no more than 65% of the energyallowed under the Energy Code; and
• Buildings being rehabilitated may use no more than 75% of the energy allowedunder the Energy Code.
Eligible taxpayers include corporations, utilities, banks, insurance companies, andindividuals. Eligible buildings include certain hotels, office buildings, and residentialmultifamily buildings.
Energy Efficiency Standards for State Purchasing. Legislation enacted in 200018 calls forminimum energy-efficiency standards for appliances and other products purchased by orfor the State or any of its agencies. The law requires NYSERDA to design thesestandards, in consultation with the Office of General Services, to optimize cost-effectivesavings, while taking into account market availability. A minimum of 18 products andappliances have already been identified and regulations must be promulgated betweenApril 2002 and April 2003. NYSERDA has issued a competitive solicitation and hired acontractor to assist with developing these standards.
3-29
Weatherization Assistance Program. The federally-funded Weatherization AssistanceProgram (WAP), administered by the New York State Division of Housing andCommunity Renewal (DHCR), weatherizes low-income residences in an effort to reduceenergy consumption and minimize energy costs. Services provided are determined by anon-site energy audit that includes health and safety considerations. Between 1990 and2000, more than $429 million was spent on weatherization measures. Cumulative annualenergy savings in 2000 was approximately six TBtus. Cumulative energy savings from1990 through 2000 amount to approximately 40 TBtus. The WAP is discussed in moredetail in the issue report entitled New York’s Public Benefit Programs.
NYSERDA-Administered State Energy Program. NYSERDA receives Federal grantfunding from the United States Department of Energy to administer the State EnergyProgram (SEP). This program includes, but is not limited to, the following energyefficiency initiatives:
• Residential Technical Assistance (RESTECH) helps improve the operation ofmultifamily buildings in New York by identifying and encouraging theimplementation of cost-effective energy-efficiency measures. A variety oftechnical assistance services are provided, including computer-assisted buildingmodeling, commissioning and implementation assistance. The first ten studiescompleted by RESTECH will achieve average energy savings of approximately 154MMBtus per year if all of the recommended measures are implemented.
• State EnVest enables energy-efficiency upgrades to State facilities using energyservice contractors to design and install efficiency measures and energy-relatedcapital improvements, and to develop performance contracts on behalf of thecustomer. The program is supported by third-party financing in the form of tax-exempt municipal leases, and project financing is arranged such that the annualcosts will be less than the energy savings realized from the project. Through2004, State EnVest is expected to result in $200 million in projects with $30million in annual energy savings.
NYSERDA Statutory Energy Efficiency Research and Development. NYSERDAadministers statutory funding for energy efficiency Research and Development in thefollowing program areas:
• Buildings programs work with developers, designers, contractors, and buildingequipment manufacturers to develop and demonstrate innovative, energy-efficientproducts in the areas of lighting, heating, ventilation, air conditioning, andbuilding controls.
3-30
• Industry programs assist businesses in developing, demonstrating, andcommercializing energy-efficient technologies and long-term solutions toreducing energy costs. Examples of technologies targeted under this programinclude superconducting transformers, advanced cooling equipment, furnaces, andboilers.
• Transportation programs provide support to New York State firms for developingand commercializing advanced technologies. Examples include developing anelectric postal van for the U.S. Postal Service, electric light-duty carrier routevehicles, and hybrid-electric city buses.
New York State Involvement in Regional and National Collaboratives
Many New York organizations involved in the energy field are members of regional ornational collaboratives that promote energy efficiency. Getting involved in thesecollaborative efforts allows New York to leverage other member activities andbenchmark their best practices against others in the nation. Examples of New York’sinvolvement in these regional and national collaboratives include:
Consortium for Energy Efficiency. The Consortium for Energy Efficiency (CEE) hasmore than 50 member organizations that support its mission to promote the manufactureand purchase of energy-efficient products and services. CEE is a national, not-for-profitpublic benefit corporation with the goal of inducing lasting structural and behavioralchange in the marketplace and increased adoption of energy efficient technologies. Intoday’s restructured utility markets, CEE provides a forum for the exhange ofinformation and ideas. CEE also partners with manufacturers, retailers, and governmentagencies including the U.S. Environmental Protection Agency. New York members ofCEE include LIPA, NYPA, and NYSERDA.
Northeast Energy Efficiency Partnerships. Northeast Energy Efficiency Partnerships,Inc. (NEEP) is a not-for-profit regional organization founded in 1996. NEEP aims tosteadily increase energy efficiency levels in homes, buildings, and industries throughoutthe Northeast region of the United States. New York members of NEEP include the NewYork State Department of State (Codes Division) and NYSERDA. Both LIPA andNYSERDA coordinate their residential appliances, lighting, and HVAC programs andcommercial motors program with NEEP.
19 Over a five-month period, actual sales in one store exceeded expected sales by 35%. Cuttle, C. andBrandston, H. Evaluation of Retail Lighting, Journal of the Illuminating Engineering Society. Summer1995.
20 The bill reduction estimate assumes an average Statewide electricity rate of $0.12 per kWh for residentialcustomers.
3-31
ENERGY EFFICIENCY BENEFITS AND BARRIERS
Product and Service End-User Benefits
Benefits to the Commercial/Industrial Sector. In a time of increased business competitionand tightening environmental regulations, energy efficiency can help the commercial andindustrial sectors to reduce costs and emissions. Energy efficiency improvements oftenprovide ancillary benefits including productivity improvements, increased production,better workplace conditions, and reduced maintenance and other costs. For example, anevaluation of energy-efficient lighting in retail applications found that new lightingstimulated significantly increased sales.19
Benefits to the Residential Sector. Residential customers throughout the State have theopportunity to implement energy efficiency improvements that reduce the amount ofelectricity, natural gas, and fuel oil consumed within single-family and multifamilyresidences. Significant reductions can often be achieved by implementing efficiencyimprovements to cooling systems and water and space heaters. However, savings canalso accrue from upgrading to higher-efficiency appliances, lighting, and homeelectronics. The New York Energy $martK Home Performance with ENERGY STAR®
program and other residential financing programs offer home energy assessments andreduced-rate loans to consumers in an effort to help identify and implement energyefficiency improvements that can be made in all of these areas. The Home Performancewith ENERGY STAR® program is expected to result in average electricity savings of morethan 700 kWh per year for participating single-family homes. The electricity savingswill lead to bill reductions of more than $80 per household each year.20 Over the nextfive years, this program is expected to serve approximately 265,000 households. Thisequates to electricity savings of nearly 200 million kWh annually and $22 million in billreductions per year. Additional natural gas and oil savings are also expected to accruefrom the Home Performance with ENERGY STAR® program, leading to further energy billreductions for participants.
21 NYSERDA. New York Energy $martK Program Evaluation and Status Report. Quarterly Report. June2001. These savings are expected from funds awarded through March 2001 and, therefore, do not match thesavings presented earlier for installed and completed measures.
3-32
Benefits to the Low Income Sector. Most of the energy-efficiency programs that areoffered to low-income customers in the State have as the primary goal improving theaffordability of energy. Improvements in energy efficiency are a proven and effectivemeans to increase affordability. Providing more affordable energy can reduce paymentproblems and the need for other assistance programs.
Overarching Societal Benefits
Energy efficiency improvements deliver direct benefits to the businesses and homes that implement them. Energy efficiency improvements also the have more far-reachingsocietal benefits described in the following section.
Cost Savings. The most obvious cost savings from energy efficiency improvementsaccrue directly to the facilities or households that implement them. Beyond this,however, there are also benefits to energy users in general. Benefits to energy users willaccrue if energy providers are able to invest in energy efficiency and thus avoid morecostly capital investments in new facilities. Energy efficiency is a proven component of abalanced approach to supply alternatives. When efficiency is less costly thanconstructing a new electric generation facility, it should be implemented. The cost andrelative value of energy efficiency and new facilities must be considered in the context ofthe retail price of electricity of a given geographic area. Where prices are higher, such asin Downstate New York, the payback period for energy efficiency measures is shorterand the resulting cost savings are greater in the long run. Therefore, the relative value ofenergy efficiency varies by geographic area. An upcoming study by NYSERDA on thepotential of energy efficiency will help to identify the value of various energy efficiencymeasures by geographic area. NYSERDA plans to complete this study in Spring 2002.
Economic Development. Aside from the direct energy cost savings that result fromefficiency improvements and reduced energy use, there are additional economicdevelopment benefits of energy efficiency. One of the most significant economicdevelopment benefits is creating jobs. Every dollar that is saved when businesses orhouseholds operate more efficiently is funneled into other investments, such as productsor services that might not have been purchased otherwise. For example, energy savingsof 730 million kWh and 3.2 TBtus of gas and oil under the New York Energy $martKprogram21 are estimated to lead, both directly and indirectly, to the creation of more than
22 NYSERDA. New York Energy $martK Program Evaluation and Status Report. Quarterly Report. June 2001. These savings are expected from funds awarded through March 2001 and, therefore, do notmatch the savings presented earlier for installed and completed measures.
3-33
2,100 jobs in New York’s service and retail trade sectors. These jobs will be supportedannually for as long as the implemented energy efficiency measures remain in effect. Energy efficiency goods and services sectors will also continue to grow in New YorkState as a result of higher demand for energy efficiency products and services (e.g.energy services companies, appliance retailers, contractors, manufacturers, and lenders). Existing businesses can become more profitable by offering energy efficiency as a value-added service to their clientele. Environmental. Improvements in electric energy efficiency will ultimately reduce theamount of electricity that is required from generating facilities, including fossil-fuelplants. Reducing generation from such facilities leads to a concurrent reduction inenvironmental emissions, such as nitrogen oxides (NOX), sulfur dioxide (SO2), andcarbon dioxide (CO2), from those plants. Efficiency improvements in the use of naturalgas and oil have similar effects. For instance, savings of 730 million kWh and 3.2 TBtusof natural gas and oil from the SBC programs administered by NYSERDA22 are expectedto result in emission reductions of 714 of tons of NOx, 1,189 tons of SO2, and more than523,700 tons of CO2. The CO2 reductions alone are equivalent to removing more than100,000 automobiles from New York’s roadways for one year. By early 2002, electricitycustomers in New York State will receive in their electric bills a statement on theenvironmental attributes of the electricity they use. These environmental statements arethe result of the New York Environmental Disclosure program established by the PublicService Commission and funded by the SBC. Efficiency improvements to gas and oilcombustion equipment and appliances will also lead to a decrease in harmful gasesreleased into the environment. Energy efficiency in the transportation sector, forinstance, has the potential to decrease Btu use per vehicle mile traveled. This has theenvironmental benefit of decreasing the amount of greenhouse gases, particularly CO2,entering the atmosphere.
Fuel Diversity and Energy Security. Efficiency improvements can also be viewed as analternative means to meet the growing demand for energy in New York. Increasedenergy efficiency, in effect, reduces the State’s need for energy generated from coal, oil,natural gas, and other energy sources. By helping to reduce the State’s need for foreignfuels, energy efficiency also has a role in increasing New York’s self-sufficiency andimproving energy security.
23 Demand response programs are discussed in the Electricity Assessment, Section 3.4.
24 A recent study found that many market transformation programs cost the sponsors less than $0.01/kWhsaved. (Nadel, and Latham. 1998. The Role of Market Transformation Strategies in Achieving a MoreSustainable Energy Future. Washington, DC: American Council for an Energy-Efficient Economy).
3-34
Energy Generation Facility Siting and Electric System Reliability. Energy efficiencyimprovements can also help ameliorate the immediate need to site new power generation,transmission and distribution facilities. Energy efficiency and peak load reduction can betargeted geographically to address pressing supply and transmission constraints. Reliability initiatives in New York consider efficiency, demand reduction23, and newfacility siting alternatives, and ultimately select the balance which will result in lowercosts to ratepayers.24
Barriers to Energy Efficiency
Through years of implementing DSM and SBC programs in New York, a wealth ofknowledge has been amassed with respect to barriers preventing more widespreadadoption of energy efficiency improvements by various sectors. Barriers are bothmonetary and non-monetary in nature. Table 13 summarizes barriers found to beimportant through recent market research.
The barriers listed in Table 13 generally apply to the commercial, industrial, andresidential sectors. Several of these barriers also apply to the low-income sector.Although programs exist to help this under-served population, there are still barriers totheir participation including income level (the working poor may have higher incomesand not be eligible), and lack of awareness of programs offered. Barriers faced by thelow-income and under-served populations are discussed in more detail in the PublicBenefits issue report.
25 American Council for an Energy Efficient Economy. The Potential for Electricity Conservation in NewYork State, September 1989. Prepared for the New York State Energy Research and DevelopmentAuthority, Niagara Mohawk Power Corporation, and the New York State Energy Office.
26 Since the cost effectiveness analysis is based only on technical costs (equipment and installation) of theenergy efficiency measures, the total savings potential which falls below the cost effectiveness threshold isreferred to as the technology cost potential savings.
27 Cost effectiveness was evaluated from the consumer, utility, and societal perspectives by varying theexplicit discount rate that is used to calculate the cost of saved energy and the cost of reduced peak demand.
3-35
Table 13: List of Key Barriers to Energy Efficiency
Low awareness and understanding of energy efficiency products and services among end-users andproduct and service providers
Higher initial cost to purchase energy efficiency products and services
Perceived or actual higher costs for maintaining energy efficient products or equipment
Lack of infrastructure of qualified energy efficiency service professionals
Low stocking, promotion, and availability of energy efficiency products and services
Lack of credible information on energy savings that can accrue from energy efficiency products andservices
Reluctance to try new technologies
Perception of poor performance of energy efficient products
Perceived or actual risk associated with new energy efficiency products and services
Energy efficiency conflicts with other important product design criteria
ENERGY EFFICIENCY POTENTIAL AND STATEWIDE ACHIEVEMENTS
1989 Energy Efficiency Potential Study
New York’s energy conservation potential was last examined in 1989.25 This analysisincluded the potential for electricity savings and peak demand reductions in the then-current equipment and building stock in the State. The study provided estimates of thetechnology-cost potential savings26 for electricity and peak demand, which fell below thecost-effectiveness threshold from the consumer, utility, and societal perspectives.27 Foreach of these perspectives, results were provided with respect to the residential,commercial, and industrial sectors.
3-36
Measures that offered particularly large potential for cost-effective electricity savingsincluded:
• High-efficiency residential refrigerators and freezers; • Reflectors in fluorescent light fixtures; and
• Variable-speed drives on fan and pump motors in commercial buildings.
Measures that offered the largest potential for cost-effective reductions in summer peakdemand included:
• Reflectors in fluorescent light fixtures;
• High-efficiency residential refrigerators and freezers; and
• Variable air volume systems in commercial buildings.
The findings of the 1989 study indicated that there was significant potential for electricitysavings and peak demand reductions in New York’s existing building stock andequipment. Many of the higher-potential opportunities have been at least partiallyaddressed by utility, SBC, and other energy efficiency programs offered in New York.
Statewide Achievements Since 1990
Between 1990 and 2000, cumulative savings of 50,160 GWh of electricity and 1,598 MWof summer peak demand have been achieved by all the major programs discussed in thisassessment. Cumulative annual savings in 1999 were 6,519 GWh, or about 5.1% of the127,998 GWh of electricity sales to ultimate consumers during that year. Table 14provides a compilation of these savings as presented in earlier tables of this assessment. Additional natural gas and oil savings have also resulted from these programs. Forexample, the Weatherization Assistance Program reports about 40 TBtus of cumulativesavings from 1990 through 2000. However, there are significant remaining opportunitiesto improve energy efficiency in the State.
The electricity, natural gas, and oil saved over the past ten years has produced significantenvironmental and economic benefits. Table 15 shows the estimated emission reductionsand job creation resulting from these savings.
3-37
Table 14: Statewide Cumulative Electric and Summer Peak Demand Reductions(1990 - 2000)
(1) Totals may not sum due to rounding.(2) A large portion of utility spending from 1997 through 2000 went to meet obligations on existingDSM bidding projects. The savings for these projects were counted in prior years. Additional savings,which are expected to accrue from utility SBC programs, are included for Consolidated Edison, NewYork State Electric and Gas and Niagara Mohawk Power Corporation, as these utilities have the mostsignificant achievements for those years.
3-38
Table 15: Cumulative Air Quality and Economic Benefits from Statewide EnergySavings (1990 - 2000)
Estimated Emission Reductions (from electric savings)
37,600 tons NOX
75,700 tons SO2
22 million tons CO2
Estimated Emission Reductions (from gas and oil savings)
2,000 tons NOX
840 tons SO2
2.5 million tons CO2
Total Estimated Emission Reductions (from electric, gas and oil savings)
39,600 tons NOX
76,540 tons SO2
24.5 million tons CO2
Cars Equivalent for CO2 Emission Reductions 4.9 million cars removed from the road for one year
Estimated Jobs 14,500
Source: NYSERDA.
Future Energy Efficiency Potential
In the 12 years since the last energy efficiency potential study, a great deal has changedin terms of available energy efficiency equipment and the base-case electricity use in theState’s building stock. Therefore, there is an immediate need to update the 1989assessment. In October 2001, NYSERDA issued a Request for Proposals (RFP 628-01)to procure contractor assistance in evaluating the status of, and potential for, energyefficiency in New York State. This study is expected to be completed in Spring 2002,and any available data will be considered in the final State Energy Plan. Major tasks forthis study include:
• Determining the list of individual and bundled measures to be analyzed;
• Establishing the base case level of technology and associated electricity use in theState’s current building stock;
• Evaluating potential savings in electricity use and peak demand resulting fromimplementing the efficiency measures;
• Determining the technical, economic, and market potential of these technologies;
3-39
• Determining the cost of saved energy and the benefit/cost ratio for each measure;and
• Ranking energy efficiency measures based on the above analysis, along with thetechnical, institutional, policy, and market barriers.
Another initiative currently underway will evaluate and quantify the aggregate energyand economic potential for a wide range of combined heat and power (CHP) technologiesin New York’s commercial, institutional, and industrial sectors. The project will includeanalysis of the regulatory, legal, and institutional barriers to CHP, and will developpolicy options and market strategies that could be implemented to accelerate marketadoption of CHP. The study is being conducted by Energy Nexus Group and the PaceEnergy Project. Any available data will be considered in the final State Energy Plan.
FINDINGS AND CONCLUSIONS
This information and analysis presented in this assessment leads to the following findingsand conclusions:
• New York is the most energy-efficient state in the continental U.S., on a per-capita basis, with 7% of the nation’s population and accounting for only 5% ofthe nation’s primary energy use. New York is the third most energy-efficientstate in the U.S. on an energy intensity basis, measured in British thermal unitsper dollar of Gross State Product.
• Over the past decade, energy efficiency programs in New York have evolved interms of their depth, breadth, and focus. The State now offers a diverse portfolioof programs that is designed to better capture available energy efficiency potentialwhere past efforts could not.
• Over the past decade, the State has spent nearly $2.8 billion on energy efficiency
programs, even while total annual spending declined between 1990 and 2000from a high in the early 1990s of more than $400 million per year. Annual energyefficiency spending has been increased through 2006 due to the continuation andexpansion of the State’s System Benefits Charge (SBC) program, and theanticipated spending of NYPA and LIPA on public benefits programs.
• Between 1990 and 2000, the State’s major energy efficiency programs have saved50,160 GWh of electricity and have reduced summer peak demand by nearly1,600 MW. Cumulative annual savings in 1999 were 6,519 GWh, or about 5.1%
3-40
of the 127,998 GWh of electricity sales to ultimate consumers in that year. Natural gas and oil savings of approximately 40 TBtus have also been achievedover this period.
• The cumulative total electricity savings over the period from 1990 to 2000 areestimated to have led to emission reductions of about 37,600 tons of NOX, 75,700tons of SO2, and 22 million tons of CO2. Cumulative natural gas and oil savingsadd an additional 2,000 tons of NOX, 840 tons of SO2, and 2.5 million tons ofCO2 reductions. Approximately 14,500 jobs were created or sustained as a resultof these programs. These jobs will be sustained for the life of the energyefficiency equipment installed.
1 Characterizations of specific renewable energy resources and technologies are presented as part of thetechnology assessment at the end of this chapter.
3-41
SECTION 3.3
RENEWABLE ENERGY ASSESSMENT
INTRODUCTION
Renewable energy is defined as energy from resources that are not depletable or arenaturally replenished when used at sustainable levels. This definition excludes fossilfuels and nuclear fission. Renewable energy resources included in this assessment arehydropower, solar, wind, biomass, geothermal, ocean, and landfill gas. In addition tothese renewable resources, fuel cell technology is included in this assessment due to itspotential for using renewable energy such as hydrogen and bio-gas. Moreover, likerenewables, fuel cells provide potentially significant, long-run environmental andeconomic benefits to the region, need support for commercialization, and face similarmarket barriers.1
BENEFITS OF RENEWABLE ENERGY
Use of renewable energy provides a number of benefits. These can be broadly definedas:
• Increased energy diversity and security;
• Reduction in air emissions;
• Greenhouse gas reduction;
• Economic development opportunities; and
• Onsite power generation.
Dependence on a limited number of energy resources creates reduced energy securityarising from fuel supply interruptions and greater price volatility. Energy fromrenewable resources such as wind and solar is not fuel-dependent, and therefore is notsubject to the effects of natural and artificial fuel supply constraints.
Power plant air emissions are responsible for approximately one-third of nitrogen oxide
2 No energy source is completely environmentally benign. For example, potential wind energy impacts areland use, aesthetics, bird collisions, noise, and communication interference.
3 Burning of biomass results in CO2 emissions that are offset by CO2 consumption during plant growth.
3-42
(NOx) emissions, two-thirds of sulfur dioxide (SO2) emissions, and one-quarter of carbondioxide (CO2) emissions, nationally. In New York State, each MWh of electricitygeneration, given the State’s mix of generation sources, produces 1.5 pounds of NOxemissions, 3 pounds of SO2 emissions, and 882 pounds of CO2 emissions, annually. Power generation using renewable energy resources, such as wind, results in no air,water, or waste impacts.2
Combustion of fossil fuels results in the release of CO2, a significant contributor to globalwarming. Power from renewable resources avoids CO2 emissions.3 Methane, the mainenergy component of landfill gas, is a particularly potent "greenhouse" gas, havingroughly 21 times the global warming effects of carbon dioxide. In many parts of thecountry, cities and counties are using landfill gas to produce electricity, heat, or steam forindustrial use. These projects consume gases that, if not collected, pose serious odor,safety, and environmental hazards.
In-state manufacturing of renewable energy equipment, such as PV modules, could leadto new industries with high export potential, leading to job creation. Deployment ofrenewable energy technologies can also lead to new jobs. For example, biomass plantsrequire labor to maintain the equipment and to grow, harvest, and transport the fuel. From the point of view of the State economy, much of the revenue for manufacturing,installing, fueling, and operating renewable power equipment can be retained instead ofleaving the State to pay for imported fuels.
A number of benefits result from onsite power generation using renewable technologies. These include:
• Reduction in customer electricity load and demand charges;
• Customer avoidance of distribution charges;
• Increased electricity system reliability;
• Avoidance of investments in transmission and distribution infrastructure;
• Waste heat recovery and avoided transmission losses; and
• Availability of power in remote locations.
3-43
The following benefits are specific to individual technologies:
• Fuel cells improve power quality for industrial processes.
• Electricity from small-scale wind can help meet winter electricity demand peaks.
• PV can be used to meed demand peaks during hot sunny days by generatingpower to meet air conditioning loads.
BARRIERS TO RENEWABLE ENERGY DEVELOPMENT
The more common barriers to the development and widespread use of renewable energytechnologies can be broadly categorized as:
• Price-related (premium);
• Infrastructure-related (lack of infrastructure for the manufacture, sales, andservice);
• Value-related (not fully understanding or quantifying the true value of renewableenergy resources based on the fuels they displace); and
• Educational (lack of customer familiarity with, and acceptance of, renewableenergy alternatives).
Currently, using renewable energy technologies to produce power is typically moreexpensive than producing power from fossil fuels. For bulk power producers, the highcost results in increased project risk and raises the cost of financing. For onsitegeneration, the low cost of grid-connected power results in long payback periods. However, the impact of the premium is less for equipment located at the customer side ofthe meter because of other costs, such as distribution, included in electricity rates. Oncedemand for renewable energy reaches significant levels, research and greatermanufacturing economies of scale are expected to significantly decrease the cost ofrenewable energy technologies. Until that time, renewable energy technologies will needcontinued public support.
Development of renewable resources in New York State will require new industryinfrastructures that include a workforce skilled in renewable technologies, renewableenergy suppliers, and customer demand for renewable energy. In addition, less costly access to the electricity grid and more streamlined environmental and local permittingprocedures are likely to improve both the supply and demand for onsite generation usingrenewable resources.
3-44
The value of public benefits are difficult to quantify and therefore are often ignored. Forexample, currently, the impact of distributed generation on electricity system reliability isnot valued, resulting in high stand-by power charges that limit the deployment ofdistributed generation technologies. Also, when making comparisons between energyalternatives, economic and environmental costs associated with the entire fuel cycle,from fuel extraction to energy generation to waste disposal, are currently not considered.
The public has limited knowledge and understanding of renewable technologies. Customer education and successful demonstration of renewable energy systems will beimportant to reduce perceived risks and increase public acceptance.
RENEWABLE ENERGY USE IN NEW YORK STATE
New York State’s primary energy use is presented in Table 1. Primary use includesenergy used in all sectors including electricity generation, transportation, residential, andindustrial and commercial uses. Compared to the Unites States as a whole, New Yorkuses relatively more hydroelectric power compared to the U.S. as a whole.
Table 1: Primary Energy Use (Trillion Btu) in 1999 in New York State and in the U.S.
New York State United States
Petroleum 1,653(38.6%)
37,960(39.7%)
Natural Gas 1,251(29.2%)
22,294(23.3%)
Coal 188(4.4%)
20,498(21.4%)
Nuclear 393(9.2%)
7,736(8.1%)
Hydroelectric Power 265(6.2%)
3,449(3.6%)
Wood and Waste 174(4.1%)
3,101(3.2%)
Other (includes electricitygenerated from geothermal,wind, photovoltaic, and solarthermal energy)
1(0%)
493(0.5%)
Source: U.S. DOE. State Energy Data Report. 1999.
4 New York State Independent System Operator. 2001 Load and Capacity Data. 2001.
5 National Renewable Energy Laboratory. REPiS: The Renewable Electric Plant Information System. 1999.
6 NYSERDA Internal Working Survey of Landfill Gas-to-Energy Projects in New York State. 2001.
3-45
The current grid-connected electricity generation capacity using renewable energysources is shown in Table 2. New York State’s renewable energy electricity generationcapacity, based on currently operating and planned sites, was estimated to beapproximately 4,788 MW.
Table 2: Contribution of Renewable Energy Sources to New York State ElectricitySupply (2001)
Size Range(kW per
Site)
No. ofInstallations
MedianSize(kW)
Capacity(MW)
% oftotal
Hydroelectricity (excludingpumped storage)4
10 to2,550,000
347 1,236 4,442.7 91.7%
Biomass
Municipal Solid Waste4
(MSW)200 to69,600
13 14,850 265.9 5.5%
Wood and Wood4
Waste300 to19,800
4 9,625 38.5 0.8%
Agricultural Residue5 3 to 150 4 65 0.3 0.0%
Landfill Gas6 1,000 to5,500
19 2,000 46.0 0.9%
PV5 .3 to 300 47 7.7 1.2 0.0%
Wind4 1 - 11,000 27 4.5 48.3 1.0%
Total 461 4,788.3 100.0%
Note: The estimated capacity for wind includes the planned 30 MW Fenner Wind Project in MadisonCounty.
Conventional hydroelectricity capacity of 4,442 MW represents almost 92% of therenewable energy capacity. The total conventional hydroelectricity includes the 2,550MW Niagara Power Project and the 780 MW St. Lawrence-FDR Power Project. It alsoincludes over 340 small hydro projects throughout the State with a median size of 1.2MW. The next highest category is municipal solid waste (MSW) which represents 5.5%
7 Grace, Robert C. Cost Estimate of N.Y. Executive Order 111 Renewable Energy Purchase Provisions. Sustainable Energy Advantage, LLC. October 19, 2001.
8 Under current law, the Federal Energy Regulatory Commission is required—when issuing a newlicense—to balance power generation needs with environmental and other factors, leading to mandates tocurtail hydro production as a condition of relicensing. Approximately two-thirds of all hydro projectsrelicensed since 1986 lost generation capacity.
3-46
of all renewable energy sources, followed by landfill gas (0.9%), wood and wood waste(0.8%), and wind (1.0%).
According to a recent study conducted for NYSERDA by Sustainable EnergyAssociates,7 the New York State generation of electricity from renewable sources isexpected to increase from 407 GWh in 2002 to 1,421 GWh in 2011, an increase of 350%. The basis of this forecast includes (1) the expected increase in demand for clean energyresulting from Governor Pataki’s Executive Order No. 111; (2) renewable power demandarising from renewable portfolio requirements in New Jersey and Connecticut, and (3)demand for green power resulting from System Benefits Charge (SBC) funded initiatives.
U.S. DEPARTMENT OF ENERGY FORECASTS
Grid-Connected Electricity Generation From Renewables
For the period 2000 to 2020, the U.S. Department of Energy’s (U.S. DOE) projections forrenewable energy use in central station grid-connected U.S. electricity supply are mixed. During the 20-year forecast:
• Total U.S. grid-connected electricity generation from conventional hydropower isexpected to remain stable over the next 20 years (see Figure 1);
• The expected net addition of 600 MW of new hydro-power capacity is notexpected to offset the projected decline in generation from existing hydroelectricfacilities;8
• Grid-connected electricity generation from non-hydro resources is projected toincrease from 77 billion kWh in 1999 to 146 billion kWh in 2020, representing a90% increase (see Figure 1).
Most of the projected growth in non-hydro renewable electricity generation is frombiomass, landfill gas, geothermal energy, and wind power. As shown in Figure 2:
3-47
Figure 1
Electricity from biomass is projected to grow from 36 billion kWh in 1999 to 65 billionkWh in 2020 (80% increase). Combined heat and power facilities account for more thanone-half of the expected growth in biomass-based generation. Dedicated biomass plantsand co-firing in coal plants account for the remainder. • Electricity from municipal solid waste, which includes direct firing and landfill
gas, is projected to increase by 15.9 billion kWh between 1999 and 2020. Nonew capacity additions are projected for direct firing but landfill gas capacity isprojected to grow by 2.1 GW.
• Electricity capacity from geothermal energy is projected to increase by 1.5 GW inthe forecast, adding 12.8 billion kWh of baseload generation by 2020.Total windcapacity is projected to grow 36% by 2001 and to more than double by 2010. Capacity additions are expected to decline after 2010 unless additional incentivesare made available. As installed wind capacity increases, intermittent availabilityand lower output per kW at marginal sites and are expected to disadvantage windpower relative to conventional generating technologies.
• Grid-connected PV is projected to add nearly 900 MW but remain smallcontributors to overall electric power supply. Off-grid PV, which is not includedin the projections, is expected to continue to increase rapidly.
3-48
Projected Non-Hydro Renewable Electricity Generation By Source
020406080
100120140160
1999 2010 2020
Bill
ion
kWh
SolarWindMSWGeothermalBiomass
Source: U.S. DOE Annual Energy Outlook 2001.
Figure 2
The U.S. DOE’s Annual Energy Outlook 2001(AEO 2001) assumes rapidly increasingstate requirements for investments in renewable energy technologies. Requirementsdiffer from state to state, reflecting varying renewable resource potential, supportingindustries, and supply alternatives. For AEO 2001, it was assumed that state mandateswill require total additions of 5,065 MW of central station renewable generating capacitybetween the years 2000 and 2020. Mandated additions are expected to result in:
• 2,900 MW of wind capacity,
• 1,145 MW of landfill gas capacity,
• 840 MW of biomass capacity,
• 117 MW of geothermal capacity, and
• 64 MW of central station solar (photovoltaic and thermal) capacity.
9 U.S. Senate action is anticipated.
3-49
RENEWABLE ENERGY PROGRAMS
National Initiatives
Hydropower is the most significant source of renewable energy. After the 1973 oil crisis,changes in federal policy spurred the development of renewable technologies other thanhydropower. In 1978, Congress passed the Public Utility Regulatory Policies Act(PURPA), which required utilities to purchase electricity from renewable generators andfrom co-generators (using combined heat and power). Some states, particularlyCalifornia and those in the Northeast, required utilities to sign contracts for purchase ofelectricity from renewable sources whenever electricity from those sources was expectedto be less expensive over the long term than electricity from traditional sources. Over12,000 MW of non-hydro renewable generation capacity came on line under PURPA. This development enabled renewable technologies to develop commercially. Windturbine costs, for example, decreased by more than 80%.
Federal financial incentives for renewable energy include tax credits and productionincentive payments. The Energy Policy Act of 1991 established a permanent 10%business energy tax credit for investments in solar and geothermal equipment. As of1999, new electricity generating facilities that use wind, biomass crops grown for energy,or poultry litter were eligible to receive a tax credit of 1.7¢ per kWh for 10 years. Thiscredit, which will otherwise expire on January 1, 2002, is the focus of a bill passed by theU.S. House of Representatives that extends the tax credit through 2006.9 The bill alsoexpands eligibility to include facilities that use landfill gas and additional forms ofbiomass including organic wastes.
As shown in Figure 3, the U.S. DOE has consistently provided more financing for solar(including solar thermal, passive solar, and photovoltaic) R&D efforts than for otherrenewable energy resources. However, compared to 1997, funding for 1999 R&Dspending for biomass energy systems (including both electric and transportationapplications) increased by 64%. In 1999, more than 35% of biomass energy systemR&D was used for ethanol-related projects.
U.S. DOE’s interest in ethanol can be traced to the Clean Air Act Amendments (CAAA)of 1990, which directed regions in severe non-attainment status for ground-level ozone touse oxygenated gasoline. Currently, there are two primary options for meeting the
10 www.dsireusa.org
3-50
Figure 3
oxygen requirement. Ethanol, widely used by fuel manufactures in the Midwest, is madefrom corn and other biomass. The second option, methyl tertiary butyl ether (MTBE), isa petroleum-derived oxygenate. Approximately 25% of the gasoline sold today containsMTBE. However, as a result of surface and groundwater contamination, 13 states,including New York, have moved to discontinue the use of MTBE. The replacement ofMTBE by ethanol will substantially increase demand for ethanol.
State Initiatives
The Database of State Incentives for Renewable Energy (DSIRE), established in 1995, isan ongoing project to summarize state incentives, programs, and policies regarding renewable energy.10 The project is funded by the U.S. DOE’s Office of PowerTechnologies and is managed by the North Carolina Solar Center on behalf of the
3-51
������������������������������
�����������������������������������
����������������������������������������
���������������������������������������������
���������������������������������������������
���������������������������������������������
���������������������������������������������
���������������������������������������������
���������������������������������������������
���������������������������������������������
����������������������������������������
����������������������������������������
����������������������������������������
������������������������������������������������
����������������������������������������
0
50
100
150
200
250
300
350
400
1998
1999
2000
2001
2002
2003
2004
2005
2006
2007
2008
2009
2010
2011
2012
Milli
on U
S$
0.0
0.5
1.0
1.5
2.0
2.5
3.0
3.5
4.0
Billi
on U
S$
��������Annual, all states (left scale)
Cumulative (right scale)
Figure 4
Source: Lawrence Berkeley National Laboratory. Clean Energy Funds: An Overview of State Support for RenewableEnergy. 2001.
Interstate Renewable Energy Council. Selected DSIRE programs and policies arepresented in Appendix A at the end of this chapter. As of October 2001, the databaseshowed that many states have adopted laws in support of renewable energy. Forexample, 35 states have adopted net metering regulation, 15 states provide corporate taxincentives, and 13 states provide personal income tax incentives. EnvironmentalDisclosure Rules, requiring load serving entities (LSE) to provide their customers withinformation on the fuel mix and the resulting emissions from the electricity supplied bythe LSE, have been adopted by 18 states.
Between 1998 and 2012, approximately $3.5 billion will be collected for renewableenergy development by 14 states with SBC funds (See Figure 4). The average annualfunding is $233 million over the next decade. In comparison, the federal fiscal year 2001renewable energy budget was $376 million. Except for California, Connecticut, Illinois,Montana, New York, Pennsylvania, Rhode Island, and Wisconsin, states still are in theearly stages of obligating SBC funds allocated for renewable energy. The most popularprogrammatic elements to date are financial incentives for large-scale renewablegeneration projects, customer-sited distributed generation programs, and renewableenergy marketing (i.e., efforts to develop a market with multiple energy suppliersproviding energy generated from renewable sources).
3-52
Fundsallocated
Goals
End-use renewable marketdevelopment (PV, smallwind, small biomass)
$24 million • Provide training for individuals involved indesigning, installing, and inspecting renewabletechnology systems• Educate the marketplace on use and value ofrenewable energy• Ensure reliability of renewable technologysystem installations
Wholesale renewablemarket development (largewind, biomass, low-impacthydro)
$46 million Develop wholesale market through:• Green marketing incentives• Renewable energy credit trading program• Green power auctions
Various uses $7.5 million
Total $77.5 million
Table 3: 2001-2006 New York System Benefits Charge Funding for RenewableEnergy
RENEWABLE ENERGY SUPPORT ACTIVITIES IN NEW YORK STATE
New York State Energy Research & Development Authority
Between July 1998 and June 2001, NYSERDA, the administrator of New York’s publicbenefits program, invested over $14 million in renewable energy programs. Theprograms provided financial incentives for wind, PV, and biomass. For the period July2001 to July 2006, NYSERDA will invest over $77.5 million of SBC funds to developrenewable energy in the State. Funding allocations and goals of the renewable programare shown in Table 3. The program will target both end-users and wholesale marketdevelopment.
To date, NYSERDA has funded a number of renewable energy projects. The followingare some highlights:
Wind. NYSERDA-sponsored efforts to promote wind power in New York State include:
• Site Development: NYSERDA is speeding up wind development in the State bysharing the cost of site development. These costs include those associated withlocating desirable sites, collecting site-specific wind data, and conductingpreliminary environmental impact reviews.
11 Another 6.6 MW wind facility, constructed by the Niagara Mohawk Power Company using SBC funds,is located in Wethersfield, Wyoming County.
3-53
• Wind Map: NYSERDA has developed wind maps to provide preliminaryinformation to developers interested in wind power. These maps show historicallong-term wind conditions for each season and year, display wind resourcecharacteristics at three representative heights above ground, along withadministrative boundaries, major roads, and other reference information.
• Wind Forecasting: With NYSERDA's assistance, a New York State company iscreating a wind forecasting model with the ability to predict wind speeds withuseful accuracy at any location up to 48 hours in advance. Forecasting abilitymay increase the value of the energy produced by wind power plants.
• Wind Farms: By the end of 2001, NYSERDA will have supported theconstruction and operation of 41.5 MW of in-State wind energy generation.11 NYSERDA provided $2 million in funding to the Madison Wind Power Project,located in Madison County, which became operational in October 2000. NYSERDA provided $5 million in funding to another Madison County windproject in Fenner, about 25 miles east of Syracuse. This 30-MW project will beoperational by November 2001. NYSERDA expects to provide support forupwards of 210 MW of installed wind capacity by 2006.
• Small Wind: NYSERDA is supporting small wind installations under 100 kW forthe agriculture, municipal, and commercial sectors.
• Transmission Access Study: NYSERDA is co-funding a study to investigate andevaluate transmission solutions for interconnecting wind power plants. The studywill address permits required for installing transmission lines, interconnectionprocedures, contractual arrangements with transmission owners, and transmissionand capacity pricing options.
Building-Integrated PV Program. Widespread acceptance of PV will requiredissemination of information to potential end-users and other market participants such asarchitects, builders, developers, building code inspectors, as well as officials in theinsurance industry. To foster installation of PV on commercial, industrial, andinstitutional buildings, NYSERDA is supporting projects that demonstrate innovative PVtechnologies and applications. The objectives of the program are to:
• Familiarize mainstream architects, builders, and developers with PV-integrated building design;
12 Although some fuel cells use fossil fuel as energy, fuel cell technology has been included in thisassessmement due to its environmental benefits and potential to use hydrogen and bio-gas as a fuel source.
3-54
• Demonstrate the long-term performance and reliability of building-integrated PVsystems;
• Document installation and operating costs of building-integrated PV systems;
• Lower customer’s net cost; and
• Reduce other barriers to the installation of building-integrated PV systems.
Residential PV Program. The goal of the residential PV program is to stimulate theresidential PV market in New York State. Near-term objectives of the program are: (1)to demonstrate the safety and reliability of grid-connected residential PV systems; (2) toreduce barriers to installing PV systems; and (3) to build market demand for residentialPV.
Solar Energy Center at SUNY Farmingdale. This Nassau County campus is the site ofone of the largest PV systems on Long Island. Over the past decade, NYSERDA hasprovided over $1 million in funding and technical assistance to install and maintain the92-kW system.
Solar Electric and Wind Product Development. This program aims to develop in-statemanufacturing capabilities for solar-electric and wind products to meet the growing Stateand worldwide demand for renewable energy. The program solicits proposals for solarelectric and wind devices, components, products, and improved manufacturing methodsfor equipment that will be manufactured in New York State and targets technologies thatwill be commercialized within five years. Between 1996 and 1999, NYSERDA awarded$4.2 million to 14 companies to develop 18 products.
Fuel Cells.12 Beginning in 1992, NYSERDA began partnering in proton exchangemembrane (PEM) fuel cell technology development with several New York Statecompanies including Mechanical Technology Incorporated (predecessor of Plug Power,LLC). Between 1992 and 1997, NYSERDA invested over $3 million in fuel celldevelopment and demonstration including projects that developed a 50-kW PEM fuel cellfor passenger cars fueled by hydrogen. Cooperating with the New York PowerAuthority, NYSERDA also helped demonstrate a 200-kW phosphoric acid fuel celloperating on bio-gas from a wastewater treatment plant in Yonkers, Westchester County. These early projects helped document the environmental benefits of fuel cells.
13 Total project cost is $8.8 million.
14 Total project cost is $14.8 million.
15 The total project cost is $2.3 million.
3-55
Currently, NYSERDA is administering a $6-million project, funded by the CleanAir/Clean Water Bond Act and Plug Power, LLC, to demonstrate 50 7-kW PEM fuelcells at 10 New York State-owned sites. Other anticipated NYSERDA projects include:
• Installation and demonstration of a 250-kW fuel cell at Brookhaven NationalLaboratory on Long Island;
• Implementation of test fuel cells at a remote telecommunications site with a 5-kWload;
• A project to identify process and issues surrounding installation of fuel cells forresidential applications, including grid interconnection approval, site selection,site preparation, and operation and maintenance; and
• A project to develop a process for low cost, integrated manufacturing of fuel cells.
Biomass. NYSERDA has historically supported biomass as a fuel supply and is currentlyinvolved in the following areas:
• Agricultural Sector: NYSERDA has current commitments for over $3.1 million13
to fund 18 projects that will use anaerobic digester gas from farm wastes for co-generated electricity and heat. The total capacity from these projects will beapproximately 1.6 MW.
• Willow Development: Since 1996, NYSERDA has been partnering with the SalixConsortium to spur the commercial harvesting of willows to be used as asustainably managed fuel source. NYSERDA has invested $1.4 million14 to thisproject. Approximately 500 acres of willow have been planted to date, enoughmaterial to generate about .75 MW of electricity. The first commerciallyharvested willow, expected to be available in the winter of 2001-2002, is plannedto be co-fired with coal at the Dunkirk power plant in Western New York.
• Since 1999, NYSERDA has invested $850,00015 in projects that seek to reducedependence on petroleum by substituting bioresources for petroleum-basedproducts, components, or processes. Examples of projects include improvedenzyme production technology, bio-pesticides, polymers, and gasification ofwillow feedstock.
16 Assuming 1998 natural gas and oil prices.
3-56
Geothermal Technology. NYSERDA is supporting 32 different businesses andorganizations in implementing geothermal technology for heating and cooling. Theanticipated annual energy savings from these projects are 129,000 mmBTU of natural gasand 3,000 mmBtu of oil, leading to energy cost savings of $780,000 annually.16
Other Incentives. Several of NYSERDA’s program, funded by the SBC, provideincentives to end-users for renewable technologies:
• Commercial/Industrial New Construction Program: The program providesincentives of up to $300,000 per project for design and installation of building-integrated PV and advanced solar and daylighting technologies. Advanced solartechnologies include thermal storage systems, solar preheating systems, and flatplat solar collectors. Incentives are capped at 70% of the incremental cost of thedesign and installation.
• Peak-Load Reduction Program: The program provides incentives for PV systemsthat reduce summer peak demand. In 2001, incentives ranged from $4 to $6 perWatt AC for systems in the Consolidated Edison Service Territory and $3 to $5per Watt AC for systems outside of Consolidated Edison service territory.
• Loan Fund Program: This program provides loans with interest rates reduced by4.5% below the lender’s usual rate.
Long Island Power Authority
LIPA is providing support for various renewable technologies through its Clean EnergyInitiative. The implementation status of the renewable energy marketing and researchand development programs was released in June 2001. The following are a fewhighlights:
Solar/Photovoltaics
• Through the Solar Pioneer Program, LIPA is offering residential homeowners andsmall commercial customers a $3.00/watt rebate for grid-connected systems, witha maximum rebate of $15,000 per installation. The program also provides aLIPA-subsidized 6% loan to finance PV systems. During 1999 and 2000, 32 PVsystems, 0.5 kW each, were installed.
3-57
• LIPA is participating in the Million Solar Roofs Initiative and has committed toinstall 10,000 solar roofs on Long Island by the year 2010. To support this goal,LIPA is working to develop a certification process for PV installers.
• LIPA helped establish the Farmingdale Solar Energy Center at SUNYFarmingdale and is providing 70% co-funding for public information seminarsand three-day workshops for electricians interested in installing photovoltaicsystems.
• LIPA installed a 20-kW Atlantis Energy Sunslate photovoltaic grid parallelsystem (consisting of individual roof tiles each having a photovoltaic cell) and ageothermal heat pump system at the newly renovated New York State NatureCenter located at Jones Beach State Park.
• LIPA installed a 15.5-kW photovoltaic system installation at the New YorkInstitute of Technology. The 48 roof-top mounted solar panels use Omnioninverters to convert the DC power they produce to AC power. Extensivemonitoring equipment provides information on environmental conditions (windspeed and temperature), thereby allowing the correlation of this information withthe amount of electricity produced.
Wind Energy
• A feasibility study was conducted to site three 50-kW wind turbines in Montauk. However, due to deed restrictions at the proposed Camp Hero site, the project waslater canceled.
• Wind feasibility studies were also proposed and/or conducted in the Towns ofBabylon, Hempstead, and Brookhaven: (1) In Babylon, a contractor was engagedto conduct meteorological studies as well as the environmental and economicfeasibility of siting wind turbines at the former Babylon landfill; (2) InHempstead, the Phase I analysis examined four potential sites for wind generationwithin the Town, including the former Oceanside and Merrick landfills, and twosites in the Point Lookout area; and (3) In Brookhaven, a site inspection wasconducted at the landfill in preparation of a written proposal for a feasibility studyon the installation of wind turbines and/or solar panels at the closed portion of thelandfill site.
3-58
Other
• An advanced technology geothermal heat pump will be developed for facilitatinggrowth of the geothermal market on Long Island and elsewhere. Specifically, anadvanced direct exchange geocolumn heat exchanger will be developed, designed,installed, monitored and analyzed at one or more Long Island customer sites.
New York Power Authority
In addition to hydroelectricity provided by the Niagara River Power Project, the St.Lawrence-FDR Power Project, and five small hydropower projects across the State,NYPA is supporting a wide range of renewable energy technologies. As of 2001, NYPAhad installed over 576 kW of PV at various municipalities at a cost of about $4.9 million. It had also completed four fuel cell projects totaling 800 kW at a cost of $3.2 million. NYPA is currently working on a project to install eight more 200-kW fuel cells atwastewater facilities in New York City at a cost of $14 million. These fuel cells are partof an effort to offset the emissions from the Authority’s PowerNow! gas turbine plantsconstructed in 2000 - 2001.
NYPA's plans for 2002 to 2004 include the following renewable energy technologies:
• Anaerobic digester gas fuel cells;
• Other fuel cells/microturbines;
• Landfill gasses;
• PV; and
• Wind power.
NYPA is actively engaged in efforts to preserve and protect the renewable powergenerated by New York State's two largest hydroelectric projects. The 800 MW St.Lawrence-FDR project has been operating with original equipment in the projectpowerhouse since 1958. The turbines will reach the end of their design life within thenext 15 years and other equipment will require renovation or replacement in that timeperiod. To address these concerns, NYPA, in1998, initiated a $254 million program toextend the life and modernize the generation equipment at St. Lawrence-FDR.Modernization of the first of the sixteen turbines has been completed and work on all theturbines is planned to be completed by 2013. The federal license for St. Lawrence-FDR
3-59
expires in 2003. NYPA submitted an application for a new 50-year license to FERC inOctober 2001, employing a collaborative alternative licensing process.
The 2,400 MW Niagara Power Project, which first generated power in 1961, includes theRobert Moses Niagara Power Plant and the Lewiston Pump-Generating Plant. NYPA isupgrading and modernizing the thirteen turbines at the Moses plant. The upgrade of eightunits has been completed. The $293 million program, scheduled to be completed by2006, will permit increased power production during periods of peak demand, but willnot increase the project's overall output. The federal license for the Niagara projectexpires in 2007. Preliminary work on relicensing has begun.
Legislative and Regulatory Initiatives
Executive Order No. 111. Governor Pataki’s Executive Order No. 111, issued in 2001, directs State agencies and other affected entities to seek to increase their purchase ofenergy generated from specific renewable technologies to meet 10% of their energyrequirements by 2005, and to increase that share to 20% by 2010. The specifiedrenewable technologies are: wind, solar thermal, PV, sustainably-managed biomass, tidal,geothermal, methane waste, and fuel cells. Currently, State agency representatives aredeveloping the necessary procedures to implement the Executive Order.
Net Metering Law. New York's net metering law (The Solar Choice Act of 1997, L.1997, Ch. 339), allows residential electricity customers to offset their electricity use withpower they send into the grid using PV equipment owned by the customer. New York’snet metering legislation includes a 25% tax credit for the purchase and installation cost ofa qualifying PV system, not to exceed $3,750. The maximum capacity allowed percustomer is 10 kW. The law requires each utility to connect residentially-operated PVfacilities until such connected power equals at least 0.1% of that utility's 1996 peakdemand. Based on the 1997 filings made by the New York investor-owned utilities, totalnet metering capacity allowed under the law will be 23.4 MW. The capacity limit will bereviewed by the New York State Public Service Commission (PSC) in 2005 to determinewhether it should be increased.
The PSC has developed uniform interconnection rules for net metered systems. Systemsmust use type-tested inverters to be approved for interconnection. As of 2001, 17.3 kWof PV systems had been installed under the net metering regulation; 16 kW throughLIPA’s lottery program in Long Island. An additional 20 kW are underway.
17 http://www.dec.state.ny.us.
3-60
New York Environmental Disclosure Program. In 1998, the PSC adopted a plan toimplement an environmental disclosure program to encourage demand forenvironmentally clean electricity. The program requires LSEs in the State to providecustomers with data on the fuel mix and average emission rates for the fuel sources usedto meet the LSE’s electricity supply requirements. The information will be derived fromgeneration and consumption data provided by the NYISO and by environmental emissiondata provided by the U.S. Environmental Protection Agency (EPA), the New York StateDepartment of Environmental Conservation (DEC), and other sources. The program isfunded at $3.5 million from the SBC.
Solar Easements. New York’s real property law provides property owners the ability tocreate an easement for the purpose of preserving the exposure of a solar energy device. Any easement obtained in writing is subject to the same conveyance and instrumentrecording requirements as any other easements. New York General City codes allowlocal zoning boards to create rules regarding solar access.
Green Buildings Tax Credit. The Green Buildings Tax Credit Law, enacted in May2000, contains provision for fuel cells and PV arrays.17 The law applies to propertyplaced in service or that has received a final certificate of occupancy in taxable yearsbeginning on or after January 1, 2001. An eligibility certificate from an architect orprofessional engineer, certifying that the building space remains green and that any fuelcells and PV modules for which a credit is being claimed also remain qualified, isrequired annually.
The fuel cell component provides a 30% credit (6% per year over 5 years) for thecapitalized cost of each fuel cell. The fuel cell must be serving green space and must usea qualifying alternative energy source. There is a cap of $1,000/kW multiplied by thedirect-current (DC) rated capacity.
The PV component provides a 100% credit (20% per year over 5 years) for theincremental cost of building-integrated PV modules and a 25% credit (5% per year over 5years) for the incremental cost of non-building-integrated PV modules. The system mustbe serving green space to qualify. There is a cap of $3/Watt multiplied by DC-ratedcapacity.
18 DOE. Annual Energy Outlook 2001.
19 Potential for off-shore wind projects exists on Long Island.
3-61
Figure 5
TECHNOLOGY AND RESOURCE ASSESSMENT
In October 2001, NYSERDA undertook a renewable technology and resourceassessment. The primary purpose of this assessment is to address the potential role ofrenewable energy resources in the State’s energy future. This assessment will comparethe cost/kWh of renewables with conventional energy for the next 3, 5, 10, and 20 years. Preliminary estimates of the technical, economic, and market potential for renewableenergy is scheduled to be available at the end of January 2002. A final report isscheduled to be released in April 2002. Technology characterization and some costinformation is presented here at this time but information from the assessment will beused to provide a comprehensive analysis.
Wind
The installed wind capacity in the U.S.as of 2000 was 2,760 MW.18 Windenergy is one of the mostcost-competitive renewable energytechnologies. Due to the efforts of thewind industry and the U.S. DOE’sWind Energy Program, the cost ofelectricity from wind power plants hasdropped from 35¢/kWh in 1980 to lessthan 5¢/kWh today at high wind sites(see Figure 5). The cost of wind inNew York State is higher than 5¢/kWhdue to lower average wind speeds andsmaller project sizes. Currently in NewYork State, the largest wind farm issized at 30 MW. However, at a limitednumber of site areas in New York State,project size could approach 50 to 100MW. Off-shore wind19 projects are expected to be in the 100 to 300 MW range.
20 Department of Energy, Energy Information Administration, State Energy Data Report. 1999.
3-62
Several initiatives adopted by the New York State Independent System Operator(NYISO) promote wind development, as well as other renewable technologies. Theseinclude the following rule changes specifically adopted for intermittent electricitygeneration:
• Increased the total amount of intermittent capacity allowed to participate in thestatewide installed capacity (ICAP) market from 50 MW to 500 MW;
• Waived financial penalties for intermittent generators. Intermittent generators can
participate in the Hour-Ahead market, selling electricity at the real-time clearingprice without paying for regulation service charges.
In addition, the NYISO waived its requirement for a System Reliability Impact Study forgeneration projects of 10 MW or less, or for projects less than 80 MW if connected to theelectricity system at voltage levels at or below 115 kV. This waiver applies to mostrenewable energy generation facilities, easing some of the financial impact associatedwith development costs.
Hydropower
Before the 1980s, the only widely-used renewable electricity technology washydropower. Hydropower is still the most significant source of renewable energy,producing 20% of the world's electricity and 10% of that of the United States.20 In 1999,hydropower represented 13.7% of the State’s electricity generation.
The main advantages of hydropower are:
• Power is usually continuously available on demand;
• No fuel requirements or fuel-related environmental impacts;
• Limited maintenance; and
• Long-lasting and robust technology; systems can last for 50 years or more withoutmajor new investments.
The main disadvantages are:
• It is a site-specific technology. Sites that are well-suited to the harnessing ofwater power are not likely to be close to locations where the power can beeconomically exploited.
21 Idaho National Engineering and Environmental Laboratory. U.S. Hydropower Resource Assessment for NewYork. August 1998. Available at http://hydropower.inel.gov.
3-63
• There is a maximum useful power output available from a given hydropower site,limiting the expansion of activities which make use of the power.
• River flows often vary considerably with the seasons, limiting the firm poweroutput to a small fraction of the possible output.
• The current technology poses potential aquatic ecology and aesthetics/water useimpacts.
Nationally, the average cost for hydropower is 2.4¢ per kWh. Other cost characteristicsare shown in Table 4.
The Hydropower Evaluation Software (HES), developed by the U.S. DOE and the IdahoNational Engineering and Environmental Laboratory, has been used to perform aresource assessment of conventional hydropower potential in over 40 states. Thesoftware uses environmental attribute data to generate an overall project environmentalsuitability factor (PESF) between 0.1 and 0.9, where 0.9 indicates the highest likelihoodof development. The estimated hydropower potential capacity for New York State ispresented in Table 5. Potential is provided for three categories: (1) additional potentialat developed sites with current power generation; (2) potential at developed sites withoutcurrent power generation; and (3) potential at undeveloped sites. As of 1998, theprojected additional potential totaled over 1,300 MW consisting of 162 MW at currentlyoperational sites, 496 MW at developed sites without power, and 652 MW atundeveloped sites.21
Table 4: Hydroelectric Plant and Operating Costs Capital cost $1,700-2,300/kW
Operation cost/kWh 3.88 mills (0.4¢)
Maintenance cost/kWh 2.89 mills(0.3¢)
Total cost/kWh 23.67 mills (2.4¢)
Operating life 50+ years
Capacity factor 40-50%
Average size: 31 MWSource: http://hydropower.inel.gov
3-64
Table 5: New York Hydropower Capacity SummaryCategory Number of
ProjectsName-Plate
Capacity (MW)HES-AdjustedCapacity (MW)
Potential at Developed Siteswith Power 44 286 162
Potential at Developed SitesW/O Power 212 754 495
Potential at Undeveloped Sites 96 1,079 652
Total 352 2,119 1,309
Biomass
Next to hydropower, more electricity is generated from biomass than any other renewableenergy resource in the United States. Biomass used for energy purposes includes:
• Leftover materials from the wood products industry;
• Wood residues from municipalities and industry;
• Forest debris and thinnings;
• Agricultural residues (including animal manures); and
• Fast-growing trees and crops.
Benefits of power generation from biomass include:
• Fewer air emissions compared to power generated from conventional fossil fuels;
• Creation of new processing, distribution, and service industries in ruralcommunities, providing employment for farmers and foresters;
• Dispatchable power (like fossil fuels, the energy has been stored by nature in thebiomass until it is needed);
• Technologies that can generate electricity at scales small enough to be used onfarms or large enough to power small cities;
• Biomass gasification broadens the range of biomass fuels and also allows biomassto be used in efficient combined-cycle power generation systems. Biomassgasifiers breaks down biomass to form a bio-gas, generally hydrogen or methane,
22 NYSERDA. Wood Energy Technology Assessment. 1991.
23 National Renewable Energy Laboratory. REPiS: The Renewable Electric Plant Information System. 1999.
3-65
that can be cleaned and filtered to remove problematic chemical compoundsbefore it is burned, providing environmental benefits.
Approximately 80% of the biomass power in the United States is generated in theindustrial sector, primarily in the pulp and paper industry. The biomass power industry isprimarily located in the Northeast, Southeast, and West Coast regions, representing a $15billion investment and 66,000 jobs. In the future, the continued need for onsite industrialpower, waste reduction, stricter environmental regulations, and rising consumer demandfor renewable energy will provide the main impetus for the industry's growth.
The cost to generate electricity from biomass varies depending on the type of technologyused, the size of the power plant, and the cost of the biomass fuel supply. In the year2000, the most economically attractive technology for biomass is co-firing at powergeneration facilities using coal. These projects require small capital investments per unitof power generation capacity. Co-firing systems range in size from 1 MW to 30 MW ofbiomass power capacity. When low-cost biomass fuels are used, co-firing systems canresult in payback periods as low as two years.
In today's direct-fired biomass power plants, generation costs are about 9¢/kWh. In thefuture, advanced technologies such as gasification-based systems could generate powerfor as little as 5¢/kWh. For comparison, a new combined-cycle power plant using naturalgas can generate electricity for about 4¢ -5¢/kWh at Fall 2000 gas prices.
A July 1991 report by NYSERDA22 concluded that New York State has enough woodresources to produce 400 to 800 MW of electricity. With the use of conventional forestmaterials and clean waste wood, enough resources may be available to generate 2,800MW of electric power. The NYISO’s 2001 Load & Capacity Report lists four wood andwood waste facilities: Chateaugay Power, Cowee, Burrows-Lyonsdale, and HardenFurniture. The total capacity of these plants is 38.5 MW. In addition, two New YorkState paper mills, Finch Pruyn and International Paper, have electricity generationcapacity totaling 68 MW.23
24 NYSERDA. Internal Working Survey of Landfill Gas-to-Energy Projects in New York State. 2001.
3-66
Landfill Gas
The U.S. EPA regulations require landfills to control gas emissions resulting fromdecomposing garbage. Conversion of landfill gas to energy not only meets regulationsbut also creates energy and revenue for local governments.
Landfill gas has a medium-Btu rating, approaching that of natural gas, and with minimalcleaning, can be used directly in boilers to create steam for industrial uses. Thisapplication reduces dependency on fuel oil, which is a standard fuel for boilers. Directuse does not require large capital investments for equipment, such as generators, and isprobably the most cost-effective application of landfill gas.
NYSERDA is currently conducting a study to determine ways to maximize the use oflandfill gas to generate electricity and for direct-use applications. Objectives of the studyare to:
• Quantify the energy potential of current landfill gas-to-energy projects;
• Estimate the energy potential of landfills that do not have existing landfill gas-to-energy projects but are economically viable; and
• Identify landfills that are potentially economically viable for a gas-to energyproject with assistance.
To date, the study has identified 16 currently operational sites. Two of these sites use themethane from the landfill for direct use applications such as heating. The electricitygeneration capacity at the remaining 14 sites total 46 MW. The study also showedsuggested that an additional 18 MW may be economically developed at this time.24
Photovoltaics
Currently, the largest world-wide market for PV is the off-grid market, which takesadvantage of PV's ability to function as a complete stand-alone electrical system. Telecommunications and transportation construction signage are the two largestsegments of the off-grid market. PV modules that take the place of building material,called building-integrated PV, are being successfully deployed in New York State, aswell as a number of residential PV systems.
25 Personal correspondence with Richard Perez, Associate Editor for Solar Radiation in Journal of SolarEnergy.
3-67
PV requires capital investment in the range of $5 to $12 per Watt, but initial costs areoffset by low operating costs. The 20-year life-cycle cost range from 20¢ to 50¢ perkWh. A home installation may need 2 to 5 kilowatts of power, and at $12 per watt, thecost ranges from $24,000 to $60,000. However, combined with the high cost of a ruraldistribution line and lower land costs in remote areas, PV may be an economic alternativeto grid-connected power.
According to one source, placing PV on even 1% of New York State's real estate wouldadd significantly to the State’s electricity supply.25 The land area of the State isapproximately 125,000 square kilometers. The amount of "raw" solar power received by1% of this area on a clear summer day at noon is 1,250 GW. After accounting for the10% solar-to-electric conversion efficiency, 1% of the state would provide a peak PVpower production of 125 GW, which represents an yearly energy output of 150,000GWh. This figure is comparable to the 1999 annual electricity usage in New York State. New York City, with its high air-conditioning load, is likely to benefit greatly fromwidespread adoption of PV.
Solar Heating
Solar energy can be used to heat water and air in commercial and residential buildings. Unlike photovoltaic cells, these technologies do not produce electricity.
Heating Water. Solar energy can be used in most climates to heat water. A typicalresidential system will reduce the need for conventional water heating by abouttwo-thirds. In colder climates, more energy is required to heat incoming ground water,so using solar energy in these conditions can have a dramatic effect on utility bills. Installed costs vary widely, from $1500 to more than $3000.
Solar Pool Heaters. Approximately 25,000 solar pool-heating systems were sold in theUnited States in 1999. This number represents about one-fifth of all pool heaters soldannually. Prices of solar pool heating systems range from $2,500 to more than $5,000. When systems are installed to replace a conventional gas or electric swimming poolheater, the initial investment can usually be recovered in approximately 3 years.
3-68
Heating Air. Transpired air collectors are used to heat building spaces that require largequantities of heated ventilation air such as warehouses and apartment buildings. Theprice of these systems for new construction is about $6-$10 per square foot. By reducingenergy costs, they could pay for themselves in 3 to 12 years. A New York State firm,Conserval Systems, Inc., manufactures a product called Solarwall which pre-heatsventilated air using solar energy. In 1997, NYSERDA helped the firm obtain U.S. DOEfunding to establish its manufacturing facilities in Buffalo, New York.
Passive Solar
Passive solar refers to the use of the sun’s energy without installing mechanical devices.Buildings designed for passive solar incorporate design features such as largesouth-facing windows and building materials that absorb and slowly release the sun'sheat. The three type of passive applications are:
Passive Solar Heating. The simplest passive design is the direct gain system in which thesun shines directly into a building, thereby providing heat. The sun's heat is stored by thebuilding's inherent thermal mass in materials such as concrete, stone floor slabs, ormasonry partitions that hold and slowly release heat. Incorporating passive solar designscan reduce heating bills as much as 50%.
Passive Solar Cooling. Many passive solar designs include natural ventilation forcooling. By installing casement or other operable windows for passive solar gain andadding vertical panels, called “wing walls,” perpendicular to the wall on the windwardside of the house, the natural breeze in the interior is accelerated. Another passive solarcooling device is the thermal chimney, which can be designed like a smoke chimney tovent hot air from the house through the roof.
Daylighting. Daylighting is using natural sunlight to light a building interior. In additionto south-facing windows and skylights, clerestory windows, which are rows of windowsnear the roofline, can let light into north-facing rooms and upper levels. An open floorplan allows the light to reach throughout the building. Daylighting in businesses andcommercial buildings can result in substantial savings on electric bills. Furthermore,natural light provides high-quality lighting that can improve productivity and health. Studies have shown that daylighting in schools can improve student grades andattendance.
26 Life-cycle cost is the total cost of the equipment plus operating and maintenance costs, spread over theuseful life of the equipment.
3-69
Geothermal Heat Pumps
Two applications of geothermal energy are: (1) generation of electricity usinghydrothermal fluids and (2) geothermal heat pumps that use heat contained in soil androcks at shallow depths to heat and cool buildings. New York State does not possesshydrothermal resources capable of generating electricity. However, heat necessary forgeothermal heat pumps is available throughout the State. NYSERDA is currentlyfunding geothermal applications at 35 commercial and institutional facilities.
Nationally, about 500,000 geothermal heat pumps, also called ground-source heat pumps,are being used for heating and cooling in residential, commercial, and governmentbuildings, including more than 500 schools. This equates to about 4,000 MW-thermal ofcontribution to the nation's energy needs. Geothermal heat pumps have low operatingand maintenance costs, and usually, low life-cycle costs.26 Consumption of electricity is30% to 60% less than traditional heating and cooling systems, allowing a payback ofsystem installation in 2 to 10 years.
Ocean
Ocean energy is available from tides, waves, and surface heat. Tides are the product ofthe gravitational attraction of the sun and moon together with the rotation of the earth. Areas with dramatic tidal changes within a bay offer the best potential for tidal power(such as the Bay of Funday, Canada and Britain's Severn Estuary). Despite a relativelysmall ocean shore line, Long Island may possess the potential for ocean power. Themerit of investigating wave energy is that in New England, it is a much more energy-dense resource than either solar or wind energy. Seawater has a higher density than airso that currents of 5-8 knots can generate as much energy as winds of much highervelocity.
Fuel Cells
A fuel cell generates electricity by a chemical reaction using hydrogen which reacts withoxygen in the air. Fuel cells are used in automobiles, buses, commercial and residentialpower generation, and for portable power such as in a laptop computer. Scientists andinventors have designed many different types and sizes of fuel cells in the search for
3-70
greater efficiency, and the technical details of each kind vary. Each type of fuel cell hasadvantages and drawbacks compared to the others, and none is yet cheap and efficientenough to widely replace traditional power generation.
At the moment, there are four promising fuel cell technologies:
• Phosphoric acid fuel cells (PAFC);
• Proton exchange membrane (PEM);
• Molten carbonate fuel cells (MCFC); and
• Solid oxide fuel cells (SOFC).
PAFC represents the most mature of the technologies. They were first developed in thelate 1970s and have been on the market since 1991. Since then, more than 220 200-kWphosphoric acid fuel systems have been sold by International Fuel Cells, South Windsor,Connecticut. PEM fuel cells use a relatively new technology, but they have receivedattention from many vendors, including Plug Power in Latham, New York. One of thebenefits of PEM fuel cells is a low operating temperature which makes it easier toinstantly turn them on without having to wait for the unit to heat up.
In the long run, SOFC technologies may hold the most promise. The U.S. DOE recentlyannounced the Solid State Energy Conversion Alliance (SECA), a $500-milliongovernment and industry initiative to achieve mass production of low-cost solid oxidefuel cells within 10 years. Solid oxide technology was chosen because it has the highestprojected power density, leading to the creation of the smallest and lightest fuel cells. TheU.S. DOE has already selected four projects for the first stage of this program. If allprojects proceed as planned, the department will provide about $271million over the next10 years. The project team members will finance approximately $226 million. Eachproject will be divided into three phases. In the first phase, lasting four years, the teamswill aim toward an $800/kW cost goal; in the next two phases, each lasting three years,the teams hope to trim costs to $600 and then to $400/kW or less. Additional informationon the different types of fuel cells are presented in Table 6.
Fuel cells will also play a role in the U.S. DOE Vision 21 concept for future power whichincludes power plants that can use coal, gas, biomass, petroleum, or municipal waste,depending on the fuel cell modules installed. As part of its Vision 21 Program, the DOEhas funded five fuel cell/turbine hybrid research projects with various fuel cell
3-71
manufacturers. The goal of these projects is to develop hybrid systems with an electricalefficiency of 70% by 2010. The DOE believes that fuel cell/turbine hybrids could realizea 25% increase in efficiency and 25% reduction in cost for a comparably sized fuel cell.
Table 6: Different Types of Fuel CellsType Efficiency, % Power output, kW Vendors
PEM 38 3-250 H Power, Plug Power
Phosphoric acid 40 200-1000 International Fuel Cell
Molten carbonate 48-55 250-3000 FuelCell Energy
Solid oxide 48-55 1-3000 Siemens-Westinghouse
Source: Electric Power Research Institute
The projected conversion efficiencies for fuel cell technology is expected to approach50% by 2015 (Figure 6). Furthermore, the projected installed cost for fuel cells isexpected to approach that of traditional distributed generation technologies in 2015(Figure 7).
Advantages of fuel cells include:
• Fuel cells could provide a cost-effective alternative to upgrading or expanding thedistribution network. Instead of laying new wires, fuel cell powerplants could belocated within electricity-constrained areas, increasing electricity systemreliability.
• Fuel cells are quiet and have very low air emissions due to the fact that power isgenerated through an electrochemical reaction, instead of combustion.
• As development continues, electrical efficiency could reach reach 80% bycapturing the waste heat.
• Fuels cells are small in size and modular, allowing flexibility of use.
• Fuel cells enhance power quality and reliability.
The major drawbacks to fuel cells at this time include:
• High capital costs due to low production volumes;
3-72
Projected Conversion Efficiencies for Distributed Generation Technologies, 2000-2020
0
5
10
15
20
25
30
35
40
45
50
2000-2004 2005-2009 2010-2014 2015-2020
Year of Introduction
Perc
ent E
ffic
ienc
y
Fuel Cell
Gas Engine
Gas M icroturbine
Gas Turbine
Photovoltaics
Source: U.S. DOE. Annual Energy Outlook 2001 .
Figure 6
Projected Installed Costs (1999 dollars per kilowatt) for Distributed Generation Technologies, 2000-2020
• Lack of infrastructure needed to support coordinated installation and operation of
fuel cells;
• Limited operating track record in a real world situation to confirm thetechnology's reliability and durability; and
• Issues surrounding interconnection, local permitting, insurance, and building code
compliance.
3-73
FINDINGS AND CONCLUSIONS
• The State has abundant untapped renewable energy resource potential foradditional wind, photovoltaic (PV), and biomass, as well as more efficienthydropower at existing dams, passive solar, solar heating, and geothermal energydevelopment.
• Higher prices for renewable energy will continue to be a barrier to widespread
adoption of renewable energy technologies. To foster greater investment inrenewable energy-based distributed generation technologies, interconnection rulesneed to be monitored and periodically reevaluated with the goal of easinginterconnections without compromising reliability and system protection, andstand-by rates need to be fair and equitable.
• The cost of renewable energy technologies will continue to be dependent onnational and global renewable market development activities. Commercializationefforts, and hence, product prices are currently driven by national and worldwidedemand for renewable energy. As a consequence, it is important for the State tocollaborate with other states and the Federal government to develop policies thatsupport renewable energy technology and industry development.
• The State is making significant progress compared to other states in thepromotion of renewable energy. By November 2001, New York will have 48megawatts of installed wind capacity, the highest capacity in any Northeasternstate. The State is continuing to build a sustainable renewable energy industry bypromoting growth in consumer demand, supporting consumer education,constructing and operating renewable energy facilities, and reducing regulatorybarriers that might hinder greater development of renewable energy resources inthe State.
• The State’s continued support for renewable energy is necessary to increaseconsumer interest, advance the development of renewable energy technologies,and achieve widespread commercialization and use.
3-74
Appendix A: Summary of Selected State-Level Initiatives
Initiative DescriptionNumber of
States ProvidingIncentive
Available inNew York State
Corporate Tax Incentives Allow corporations to receive credits or deductions ranging from 10% to35% against the cost of renewable energy equipment.
15 Yes
Personal Income Tax Incentives Tax credits or deductions to cover the expense of purchasing andinstalling renewable energy equipment.
13 Yes
Property Tax Provisions Provides that the added-value of the renewable device to be excludedfrom the valuation of the property for taxation purposes.
15 No
Sales Tax Incentives Exemption from the state sales tax for the cost of renewable energyequipment.
14 Yes
Contractor Licensing Licensing of renewable energy contractors 12 No
Equipment Certifications Statutes requiring renewable energy equipment to meet certain standards 12 No
Environmental Disclosure Rules Requirement that utilities provide their customers with information onfuel mix and emissions statistics.
18 Yes, as of Dec.2001
Line Extension Analysis Requires utilities to provide their customers with information on on-siterenewable options when a line-extension is requested.
5 Yes
Net Metering Rules For those consumers who have their own electricity generating units, netmetering allows customer to use the excess generation to offset electricitythat would have been purchased at the retail rate.
35 Yes
Solar and Wind Access Laws Statutes providing for solar or wind easement rights. 33 Yes
Source: Database of State Incentives for Renewable Energy (DSIRE).
1 Other states ranked high by the Center include Pennsylvania, Texas, and Maine, while California isranked relatively low among those states that have attempted electric industry deregulation.
3-75
SECTION 3.4
ELECTRICITY RESOURCE ASSESSMENT
INTRODUCTION
This Electricity Resource Assessment evaluates the electric system infrastructure in NewYork State within the context of changes occurring in the structure of the industry. TheAssessment begins with a review of the status of retail and wholesale competition in theState. It then later assesses the current electricity system infrastructure and how thesystem might change during the planning period. Finally, this Assessment concludeswith a description of how prices and loads might change over the planning period.
STATUS OF COMPETITIVE ELECTRIC MARKETS
New York State Retail Market
Customer Choice Programs. The State’s retail electric industry is open to increasinglygreater customer choice of energy service providers. Changes in the electric marketallow customers in most areas of the State to choose their supplier of electricity, whilethe delivery of electricity to homes and businesses remains the function of the localutility. The transition toward retail competition has been evolving for several years, andfurther evolution will occur. Most experts in energy policy agree that competition canproduce innovations and bring forth technologies and new services that will result incustomer benefits.
According to the Center for the Advancement of Energy Markets (CAEM), anindependent, nonprofit group in Washington, DC, New York State has consistentlyranked among the top states in its efforts to deregulate the electric industry.1 Among the22 attributes where New York scored high are the following: overall deregulation plan,percentage of customers eligible, safeguards to prevent utility/affiliate favoritism,competitive metering and billing choices, generation market structure, treatment ofstranded costs, customer education programs, appropriateness of default rates, anddistributed generation interconnection policies. The percentage of load switched so far tocompetitive suppliers is about 15%, which is relatively high compared to other states(currently, the third highest).
3-76
Customer Participation. Based on customer awareness surveys conducted annually bythe New York State Public Service Commission (PSC), about 60% of the State’s electricconsumers are now aware of electric competition. Overall, 4% of customers,representing over 15% of load, had switched from their local utilities to retail serviceproviders as of the beginning of November 2001. Significantly, however, almost 22% ofthe load in the non-residential sector, but only 4.5% of the residential load, had switchedas of that date, as shown in Table 1.
TABLE 1
RETAIL ACCESS PENETRATION IN NEW YORK STATE, NOVEMBER 1, 2001
Three utility retail access programs have had substantially better participation than theothers: Orange and Rockland (O&R) (25% of the load and 20% of customers haveswitched); Rochester Gas & Electric Corporation (RG&E) (28% of the load and 12% ofcustomers have switched); and Con Edison (23% of the load and about 4% of thecustomers have switched). The switches in the RG&E and Con Edison territories wereprimarily among nonresidential customers, where customer savings would be expected tobe greater and costs for energy service companies (ESCOs) to serve them might be less. The O&R program, in contrast, has been highly successful with regard to switches of
3-77
residential customers (20% of residential load has switched). The success for O&Rmight be particularly attributable to its consolidated billing for ESCOs. O&R has alsoreduced barriers to customer switching through its “Switch n’ Save Program” whereretail access customers that contact O&R are provided opportunities to switch to ESCOsand are guaranteed 7% savings for two months. Another important element might be thatESCOs in O&R’s territory have conducted aggressive marketing campaigns, includingtelemarketing campaigns, direct mailings to customers, and door-to-door marketing.
Con Edison also has historically offered a consolidated billing option for ESCOs to use,albeit one in which the ESCO instead of the utility issues the consolidated bills. ConEdison’s version of consolidated billing, however, has proved to be somewhat moredifficult and costly to implement than most ESCOs have been willing to accept. Whilethere are significantly more residential customers enrolled in Con Edison’s program thanin any of the other utility programs, they represent only 3.5% of the company’sresidential customers, in contrast to the 20% of residential customers switched in O&R’sprogram.
Marketer Participation. There are 22 ESCOs currently selling electricity to retailcustomers in New York State, including five that are affiliates of incumbent utilities (15of the 22 provide service in Con Edison’s service area). Several of the ESCOs tend todominate in some service areas, while only one ESCO currently serves customers inRochester Gas and Electric Company’s area, and only two serve customers in CentralHudson Gas and Electric’s (Central Hudson) territory. Further, some of the ESCOs limittheir services to specific customer classes, with some providing no service for residentialconsumers. Clearly, the ESCO interest and activity in the State is not evenly dispersed.
Improvement Opportunities. Retail competition stakeholders report that obstacles toswitching to retail access for customers (especially residential and small businesscustomers) and obstacles to ESCO participation are numerous. Specifically, theseperceived obstacles include: utility rates that are not fully or properly unbundled; the lackof consolidated billing availability throughout the State; high financial securityrequirements; the volatility of the wholesale market; the continuation of utilities in somecompetitive functions; and the small size of the available profit margins. Many of thesebarriers are being encountered in other states. Discussed below are initiatives underwayin New York to address each of these concerns.
2 The discussion in this section relates primarily to policies and programs authorized by the PSC for theregulated utilities. The Long Island Power Authority is also considering initiatives to enhance its retailaccess program. 3 Case 00-M-0504, Proceeding on Motion of Commission Regarding Providing Last ResortResponsibilities, the Role of Utilities in Competitive Markets, and Fostering the Development of RetailCompetition Opportunities.
3-78
State Policies and Programs to Enhance Retail Electricity Competition2. The Statehas taken a number of actions to promote competition in retail electricity markets. ThePSC has opened electric metering in the regulated utility service areas to competition byESCOs and competitive meter service providers (MSPs) and meter data service providers(MDSP). Moreover, billing will be open fully to competition as soon as the PSCcompletes work on Electronic Data Interchange (EDI) standards. Uniform BusinessPractices have been adopted to govern interactions between utilities and competitivesuppliers, and modifications are being considered as the need arises. One of the moreimportant barriers to retail competition has been the fixed backout credits for commodityservice provided by competitors that were incorporated into the rate and restructuringagreements of several utilities. The PSC has since directed that the fixed credits bereplaced by market-based credits. Identified below are some of the other initiatives andprograms that are now underway to enhance retail electricity competition.
• Competitive Retail Electric Markets Case3. On March 21, 2000, the PSCinstituted a proceeding to consider the next steps that should be taken to developretail energy competition further, including the future role of regulated utilities inproviding the energy commodity and other competitive or potentially competitiveservices. Also being examined are the utilities’ future role with respect to variouspublic benefit programs (e.g., low-income assistance, energy efficiency, researchand development) and the utilities’ responsibilities as providers of last resort(POLR). The PSC directed that a collaborative process be undertaken to examinethese issues, that comprehensive public input be sought, and that a complete rangeof policy options be delivered in either a consensus report by the parties or arecommended decision.
On July 13, 2001, the Administrative Law Judges issued a recommended decision(RD). At issue are the future role of the regulated energy utilities in the end-statecompetitive markets, the actions needed during the transition to foster thedevelopment of such markets, and the future of system benefits programs. TheRD recommends that the Commission first adopt three overarching goals orprinciples to be used in guiding the development of competitive markets and as abasis for determining an appropriate end-state competitive model. Those goalsare as follows:
4 Case 00-M-0504, SUPRA, Order Directing Expedited Consideration of Rate Unbundling. 5 Unbundling is the breaking apart of the utility rate into its components.6 Case 00-M-0504, SUPRA, Order Directing Filing of Embedded Cost Studies.7 Case 98-M-0667, In the Matter of Electronic Data Exchange.
3-79
1. The provision of safe, adequate, and reliable gas and electric service atjust and reasonable rates should be the primary goal, having priority aboveall others.
2. Where possible all services and products should be provided bycompetitive markets and not by regulated utilities.
3. The regulation of rates, services, and competitive market activities shouldbe appropriate for the status of the transition (with greater scrutiny beingexercised at the outset, and less as the dominant players lose the ability toexercise market power) and for the status of the service provider (withgreater scrutiny being exercised over those with greater market power).
Based on these principles, the RD recommends that the PSC adopt as its end-statevision of the competitive markets one in which the utilities no longer provide gasand electric commodity service and are removed from any other market thatbecomes workably competitive. Before any utility is removed from any market,however, certain preconditions should be met, including a determination that thewholesale and retail markets are operating without the exercise of market power. As a general matter, the judges recommended that a utility not be removed fromany market until multiple suppliers offering a variety of products are available forthe entire customer class throughout the utility’s service territory. The PSC is nowconsidering the case. The Final Energy Plan will reflect the PSC’s decision.
• Unbundling4. For retail competition to proceed effectively, utility rates must beunbundled5 appropriately to identify costs that can be avoided through the transferof functions to competitive suppliers. By order issued March 29, 2001, the PSCinstituted a formal “unbundling track” as an extension of the Competitive MarketsCase for the explicit purpose of establishing guidelines and principles for theutilities to follow in conducting updated cost of service studies that willeventually result in the establishment of fully unbundled, cost-based rates forelectricity and gas services. On November 11, 2001, the PSC directed thejurisdictional utilities to file embedded cost studies by March 15, 2002, andwithin 90 days thereafter to file tariff amendments that provide unbundled rates.6
• Electronic Data Interchange7. The accurate and timely interchange ofinformation is necessary for retail competition to proceed effectively. In an Orderissued April 12, 2000, the PSC required that Electronic Data Interchange (EDI)
8 EDI is the computer-to-computer exchange of routine business information in a standard form. In a retailaccess environment, examples of “routine” transactions include switching customers from one supplier toanother and the exchange of customer history, usage, and billing data. 9 Case 98-M-1343, In the Matter of Retail Access Business Practices.10 Case 99-M-0631, In the Matter of Customer Billing Arrangements.11 “Backout credits” are the amounts by which utility charges for a service are to be reduced as customersprocure that service from competitors instead of from the utility. These amounts are “backed out” of theutility charges.12 Case 94-E-0952, Competitive Opportunities Regarding Electronic Service, Order Providing forCompetitive Metering.
3-80
systems8 be implemented Statewide to facilitate the exchange of retail access databetween ESCOs and utilities.
• Uniform Business Practices9. Most of the participants in retail competition haverecognized the need for standardization of business practices among the utilityservice areas. The PSC, consequently, put in place a set of business practices thatmost of the participants in retail access in New York State must follow. During2000, utilities, ESCOs, and regulators from across the nation undertook a similareffort to create uniform business practices for the entire country. Staff of the NewYork PSC assumed a leadership role, participating in a lengthy series of meetingsheld throughout the country that culminated in a national document for retailaccess business practices and electric metering. The PSC is now in the process ofharmonizing New York’s business practices with the national consensusdocument. It has also indicated that it will revisit the practices from time-to-timeas more experience is gained.
• Competitive Billing10. Consumers have expressed a strong preference for theconvenience of a single or consolidated bill for their utility services rather thanhaving to pay separate bills for each service received. This preference, coupledwith the PSC’s commitment to push for competition wherever practicable, led thePSC on March 22, 2000, to order the major electric and gas utilities to file tariffamendments to accommodate the wishes of retail access customers who prefer toreceive single bills from either their utility company or from their ESCO. Then,on April 25, 2001, the PSC adopted a set of uniform billing and paymentprocessing practices to be incorporated into the utility tariffs, operatingprocedures, and billing service agreements of the large electric and gasdistribution utilities in the State. The practices were based on recommendationsof a national working group, as well as practices developed individually by theutilities and feedback from interested parties. The PSC also adopted individualbilling backout credits11 and billing service charges representing prices thatutilities could charge ESCOs if they were asked by ESCOs to issue theconsolidated bills.
• Competitive Metering12. Metering and metering services represent potentiallycompetitive services that historically have been performed only by utilities. OnJune 16 and September 15, 1999, the PSC issued Orders requiring that
13 Case 94-E-0952, SUPRA, Opinion and Order Adopting Environmental Disclosure Requirements andEstablishing a Tracking Mechanism.
3-81
competitive metering services be made available for about 40,000 large NewYork State customers with peak demands of at least 50 kW. It also directedutilities to unbundle metering and provide a backout credit to participatingcustomers. The tariffs have now been approved, and five competitive entitieshave so far received approval as meter data service providers (MDSP) in NewYork State.
• Environmental Labeling13. Electric ESCOs will soon be able to differentiate thecommodities or products they offer according to the sources of their generation,which will further enhance retail competition. Opinion 98-19, issued December15, 1998, approved an environmental disclosure mechanism that will providecustomers with verified data on the fuel mix sources and average emissions ratesfor the generation sources that their suppliers have used to meet their energysupply requirements. The first environmental labels are expected to be includedin customer bills by the beginning of 2002.
• Photovoltaic Law and Net Metering. In August of 1997, the New York Statelegislature amended the Public Service Law to add a new Section 66-j requiringutilities to provide for net metering of residential photovoltaic (PV) systems witha generating capacity of 10 kW or less. Subsequently, in February 1998, the PSCinstituted uniform interconnection standards for these systems and ordered theutilities to file tariffs implementing the requirements of the statute. Customerscan also obtain tax credits for a portion of the cost of installing a PV system.
• Distributed Generation. Distributed generation, including combined heat andpower (CHP) applications, offers customers the promise of increased electricreliability, power quality, efficiency, and affordability, while potentiallydownsizing supply and distribution costs. During 2001, NYSERDA, the PSC,and the U.S. Department of Energy hosted a CHP workshop in Albany for thepurpose of providing a perspective on the economic and environmental benefitsof the concurrent production of electrical and thermal energy, and identifying thebarriers the CHP industry faces. Key governmental and private sector officialsparticipated in the workshop. The PSC also extended and expanded the systembenefits charge (SBC) in 2001, providing funding of nearly $57 million over thenext five years to improve the viability of distributed generation and CHP aseconomic energy options in New York State.
The PSC’s proceeding to investigate generic principles for designing equitablestand-by service delivery rates for customers with interconnected wholesale anddistributed generation facilities has recently concluded. The decision approved aprotocol for special “standby rates.” Such rates will apply to distributedgeneration customers who remain connected to their local utility system for
3-82
backup power. The guidelines rely on a more cost-based approach to charging fordistribution service than rates that has previously applied to standby customers.
In a related proceeding, the PSC authorized a three-year distributed generationpilot program to begin in 2001. Its purpose is to provide for the objective andtimely consideration of distributed generation projects as a resource in thedistribution system planning processes. The decision establishes a process forutilities to award a set number of contracts for distributed generation projects thatcould take the place of distribution system construction.
• Interconnection Standards. In December 1999, the PSC issued StandardInterconnection Requirements to streamline and facilitate the process forinstallation of distributed generation of 300 kW or less operating in parallel withradial distribution systems. The standards were formally revised in November2000 and another revision is planned for the near future. Contained in thestandards is a “type testing” procedure to allow manufacturers to submit theirequipment for testing. This will classify equipment as utility grade and thusacceptable for use at the grid interface point. Several units have now been listedas type tested, most of which are inverters for use in photovoltaic systems. It isintended that the standards will promote an increase of on-site generation througha simple, quick, and well-defined application process and will allow applicants topurchase units from the list of “type tested” equipment.
• Public Outreach and Education. The PSC’s statewide public educationprogram, “Your Energy. . .Your Choice”, is a critical element in theCommission’s efforts to introduce retail competition. The goal of the program isto establish and maintain a high level of awareness and understanding so thatconsumers can make an affirmative decision regarding the new choices availableto them.
The program has used nearly every communications tool available and hasdelivered its message through: (1) an aggressive PSC staff-directed programintegrating a broad-based media campaign with a wide variety of grass-rootseducational initiatives; and (2) a concerted effort to encourage active utilitycustomer education programs. Particularly important to these efforts have beennumerous partnerships combining the efforts of State and local governmentagencies, utilities, energy service companies, business and consumer groups, andservice providers.
The PSC has also conducted annual surveys of residential and business customersto monitor awareness, understanding, attitudes and informational needs. Generalawareness of retail competition has remained fairly steady at approximately 60%of those surveyed, but an equal percentage imply that they do not yet have enoughinformation on which to make a choice. Despite the continuing need for moreinformation, most consumers believe they will benefit from competition.
3-83
In summary, important steps have been taken and the mechanisms have been establishedto support greater retail choice in New York State. As new supplies become available in2004 and 2005, as is now projected, and as the initiatives discussed above progress,competition should become more viable for both customers and ESCOs.
New York State Wholesale Market
The Transition. In the mid-1990s, New York State developed a framework forrestructuring the wholesale electric market. In the restructuring plans developed by theindividual utilities, the utilities agreed to divest most of their generating stations, sellingthem through an auction process. The parties also agreed to create an IndependentSystem Operator (ISO) to supersede the then-existing New York Power Pool. The ISOwould be a not-for-profit organization with responsibility for administering the State’swholesale energy markets and operating the State’s high-voltage electric transmissionsystem. The Federal Energy Regulatory Commission (FERC) eventually adopted theseproposals, with modifications, and on November 18, 1999, the New York IndependentSystem Operator (NYISO) began operations.
In 2000, Staff from the Department of Public Service (DPS) interviewed parties that dealroutinely with the NYISO, reviewed the NYISO’s operations, and subsequentlydeveloped a series of recommendations to help the NYISO operate more efficiently andeffectively. The NYISO has implemented many of the recommendations and isdeveloping solutions for other identified problems as well.
The first years of operation of the competitive wholesale market in New York State havebeen marked by sharp increases in the prices of fuel and tight supply conditions in someregions of the State, largely resulting from transmission congestion and a lack ofconstruction of new generation in the previous years, and an unanticipated increase indemand (during this time, New York’s economy was expanding rapidly). Adding newgeneration, upgrading transmission capacity, using energy more efficiently, enhancingcustomers’ ability to respond to price changes, and improving the efficiency of NYISOoperations are the keys to lowering wholesale electric prices. All of these issues arebeing addressed currently.
Controlling Market Power. Market power is the ability of a single firm, or a group offirms acting jointly, to raise prices or restrict output beyond levels likely to result in afully competitive market. To prevent the exercise of market power, the State hasencouraged ownership of generation by multiple organizations. Utilities in New YorkState have now sold most of their generating stations. A tool known as the Herschmann-Hierfandahl Index (or HHI), which measures the concentration of players in an industry,
14 Reference prices are computed based on the lower of the mean or median of the previous 90 days ofaccepted bids and are adjusted for fuel price changes. In instances where the AMP determines that a unit iseconomically withholding electricity in the day-ahead market, the unit’s bid price is subject to beingchanged to its day-ahead reference price. 15 The data presented here is for wholesale spot prices in New York State. Transition contracts and otherbilateral wholesale contracts are not presented. The intent of this section is to show trends in the spotmarket.
3-84
is one tool used to measure market power (scores over 1,000 are considered to be apotential problem; scores of over 1,800 are considered to be a potentially seriousproblem). New York’s wholesale electric market’s HHI value is less than 1,000 (for theentire State as a single theoretical market), which reflects the existence of acceptablecompetition potential. New York, however, does have pockets where concentration ofownership is an issue, either on a geographic or temporal basis. This is especially true inthe New York City area. Consequently, the NYISO has established specific in-Citymarket power mitigation rules that govern the New York City generators previouslyowned by Con Edison. These rules attempt to prevent new generation owners in NewYork City from taking advantage of the limits on transmission of outside power into themetropolitan areas to exert market power on wholesale electricity markets.
The NYISO has also developed automated procedures (Automated MitigationProcedures, or AMP) to prevent market abuse during times when day-ahead energyprices rise above $150/MWh. At such times, suppliers’ bids are automatically reviewedto determine whether they are: (1) $100 or 300% higher than an energy reference price;14
or (2) in the case of start-up cost bids, if they are 200% higher than the start-up costreference and, in addition, the “economic withholding” could cause a price impact of$100 or more. While the AMP mechanism does not eliminate price spikes due toscarcity, it does address opportunities for economic withholding in an attempt to exertundue market influence.
Wholesale Prices.15 In New York State, electricity demand is greatest during thesummer as customers rely on electrical air conditioning equipment for cooling. Whendemand is lower during other times of the year, only the most efficient, and thus cheapestto operate, generators will typically be used. As demand increases, less efficient, andthus more expensive to operate, generators will then be required. The result is that, on average, wholesale prices will typically be greatest during the summer months. On anhourly basis, the highest peak prices can be expected at certain hours in the summer.
Prior to the November 1999 start-up date for the NYISO, and the power exchangeoperated by the NYISO, the wholesale electricity market consisted generally of bilateralcontracts of varying lengths. The wholesale prices set by these contracts were not posted
3-85
in any one place, were sometimes confidential, and were not easy to interpret or compare,especially if the contracts included delivery or other services. In addition, most of thegeneration in New York State was owned by the utility companies or the New YorkPower Authority and supplied directly to customers at the utilities’ regulated rates, whichdid not necessarily represent true wholesale market costs. As such, there were noformalized wholesale clearing prices to compare with the wholesale prices now available. However, it is clear that, because of the sudden increase in 2000 in the price of naturalgas used by many generators and the unavailability of the Indian Point 2 Nuclear Plant,the wholesale spot market prices in the summer of 2000 were significantly higher thanwould have been visible if a power exchange had existed in prior years. Consequently,while the year 2000 wholesale prices may not have been typical, they are the only factualdata available to use as a starting point for an analysis of future trends. As will be shownbelow, wholesale electricity prices have decreased from the higher year 2000 levels, andthe projections of this Draft Energy Plan are that they will continue to decrease.
Wholesale spot market prices for summer 2001, on average, decreased compared with thesummer of 2000 in the New York City and Capital District areas, but increased in thewestern part of the State, as shown in Table 2 below.
TABLE 2
WHOLESALE PRICE CHANGES IN NEW YORK STATE
Region Summer 2000 Summer 2001 % Change
New York City $57.6/MWH $52.6/MWH 9% decrease
Capital District $54.0/MWH $45.2/MWH 17% decrease
Western NY $32.5/MWH $39.1/MWH 19% increase
DPS Staff have analyzed these data to determine the extent to which these changes aredue to fuel prices, changes in load level, or the availability of generation. Differencesbetween the conditions present for the two summers that caused price decreases in theNew York City and Capital District areas were: a decrease in natural gas prices (17%decrease on average); the availability of generation from Indian Point 2 nuclear plantduring the summer of 2001after being unavailable the previous summer; the addition ofabout 450 MW of gas turbines installed by the New York Power Authority (NYPA) forthe summer of 2001; an increase in the rating of LIPA’s cross-sound cable to LongIsland; and implementation and use of demand reduction programs during the summer of2001. Increases in the Western New York area were generally due to two factors:increased loads caused by hotter weather, which resulted in fewer than normal hours inwhich coal generation was on the margin to set energy prices; and more hours in 2001, as
16 NYPA’s installation of the first phase of its convertible static compensator (CSC), a flexible alternatingcurrent transmission system (FACTS) at its Clark Energy Center in Marcy, was instrumental in reducingthe constraint. Completion of the second phase in 2002 will further ease the constraint.17 The wholesale price decreases occur primarily because of the introduction of new efficient gas-firedgeneration facilities. To the extent that competitive, cost-effective and environmentally acceptable alternativesare developed and deployed, the downward price trend should continue.18 The average retail prices for electricity (commodity and delivery), presented later in this Assessment, areconsistent with this trend.
3-86
compared with 2000, in which the central-east transmission system interface was notconstrained,16 which for many hours caused the Western New York area to be pooledwith the Eastern New York area into one big market that governs the geographic areanorth of New York City. The result, as can be seen from the data above, was that thedifference in wholesale prices between Western New York and the Capital District areanarrowed between 2000 and 2001 (lowering the Capital area prices and increasing theWestern New York area prices). During the same period, coal prices also increasedsignificantly, which also may have affected Western New York prices because a highpercentage of the supply in that region is generated by coal plants.
While no one can accurately predict wholesale electricity prices over the planning period,use of a production simulation model can provide some insights. Based on the“Reference Resource Case” assumption and the “Forecast” described later in thisAssessment, this Plan forecasts that the running cost of generation statewide shouldgenerally decline in real terms over the 20-year planning period, which should similarlyinfluence wholesale prices. Table 3 provides an indication of the relative wholesaleelectricity real price changes one might expect over the planning period, relative to 2002,under the Reference Resource Case scenario.17
As Table 3 shows, the real price decreases in wholesale electricity commodity pricesoccur in all transmission zones of the New York electricity system.18 The mostsignificant decreases occur in the near term (through 2005) when significant capacityadditions are projected to occur in the southeastern portion on the State. In the later yearsof the planning period, real price declines continue, with the eastern portion of the NewYork realizing the most significant reductions. On the other hand, wholesale prices forthe Long Island area should be relatively stable over the planning period.
19 Index is based on year 2000 constant dollars with the index fixed relative to the NYISO Westtransmission zone in the year 2002. The current eleven transmission zones used in NYISO operations aredisplayed in this table.
Transmission Zone 2002 2003 2004 2005 2008 2012 2016 2020
West 1.00 0.96 0.91 0.90 0.86 0.84 0.82 0.83
Genesee 1.03 0.99 0.93 0.91 0.87 0.85 0.82 0.83
Central 1.04 1.00 0.94 0.91 0.87 0.85 0.82 0.82
Mohawk 1.06 1.02 0.96 0.92 0.87 0.85 0.82 0.82
North 1.06 1.02 0.96 0.92 0.87 0.85 0.82 0.82
Capital 1.08 1.05 0.97 0.93 0.88 0.85 0.82 0.82
Hudson 1.11 1.07 0.99 0.95 0.89 0.86 0.83 0.82
Millwood 1.12 1.08 0.97 0.94 0.89 0.86 0.83 0.82
Dunwoodie 1.15 1.10 1.10 0.99 0.91 0.87 0.85 0.83
NYC 1.13 1.08 1.03 0.96 0.89 0.86 0.83 0.82
Long Island 1.26 1.24 1.23 1.27 1.24 1.21 1.16 1.11
Market Rules and Procedures. Participants in New York’s wholesale electric markethave identified a number of inefficiencies resulting from the way rules and procedureshad been written and from less than optimal software implementation. The NYISO andother parties have been working to correct these problems. For example, the NYISObegan offering virtual bidding in November 2001. Virtual bidding gives marketers thatdo not have physical generation or load in New York the ability to buy and sell energy onthe NYISO’s day-ahead and real-time markets. This practice is expected to increasemarket liquidity and bring real-time and day-ahead market prices closer together asbuyers obtain increased ability to arbitrage differences in time and location.
Among the more intractable problems identified so far are “seams issues,” which refer toproblems created by differences in the scheduling and dispatch rules betweenneighboring ISOs. Some generators took advantage of these discrepancies to increasetheir profits. The most egregious of these problems, however, have now been corrected.
3-88
Having separate, adjoining ISO territories, as is now the case, can also lead toinefficiencies in each ISO’s internal scheduling. For example, in some cases, due to loopflows of electricity, the best solution to a congestion problem would be to start up oradjust the schedule of a generator in an adjoining ISO territory. The ISOs in theNortheast have been looking into ways to work together more cooperatively to deal withthis type of situation.
FERC has also suggested that competitive market efficiencies might be enhanced ifmarkets could be combined to eliminate the seams between them. Further centralizedscheduling of transactions, and the ability to share reserves among ISOs, have thepotential to make the electrical system operate more efficiently. Consequently, in July2001, FERC issued an Order to begin a process to develop a single Northeast RegionalTransmission Organization (RTO) that would include the New York, New England, andthe Pennsylvania- New Jersey- Maryland (PJM) ISOs . The ISOs, the states, andinterested parties are now actively evaluating options to respond to the RTO Order.
New York State supports FERC’s attempt to establish a single RTO to run the dailypower markets and oversee the flow of electricity in the Northeastern United States. While states in the Northeast have previously been working to resolve “seams” issuesthat prevent economic exchanges of power, the FERC Order should expedite that processand hasten the resolution of those issues. Over time, the RTO approach will strengthenthe reliability of the system, promote better transmission planning, and result in efficientwholesale prices for electricity.
In the process to develop a Northeast RTO, New York State proposes that certainprinciples be established. Those principles include:
• System reliability is a paramount concern for state regulators. The new systemmust be designed to incorporate local requirements and to ensure that short-termeconomic pressures do not shortchange the reliable operation of the system. Untila more optimal system is developed, the current configuration of three physicalcontrol areas should be maintained.
• Consumers must be protected through effective market monitoring and mitigationin those areas where competition does not exist.
• A body fully empowered to act by the three regions should quickly work toidentify the “best practices” of these markets so that uniform, regional rules canbe in place as quickly as possible, consistent with the need for a safe and reliabletransition.
3-89
• The on-going work to improve efficient commerce across the Northeast, whichbegan in 1999, must continue during the transition to an RTO.
• There should be a single, independent governing body that receives effectiveinput from all of the stakeholders while maintaining the independence to act inthe public interest.
• State regulators should have a meaningful role in the development and operationof an RTO that reflects their responsibilities in siting of generation andtransmission, local reliability, market monitoring, and protection of consumerinterests.
Expected Resources. As previously noted, wholesale market prices in real terms shoulddecline as new resources are added to the system. Below is a discussion of the variousoptions available for adding new resources.
• Article X Projects. Major electric generating facilities of 80 MW or greatermust be authorized by the New York State Board on Electric Generation Sitingand the Environment (Siting Board) under Article X of the Public Service Law. The first Article X proceeding began in 1998 with the filing of an application forthe Athens Generating Plant. As of November 1, 2001, 23 Article X power plantprojects have been announced formally, for a total of over 15,000 MW (see Table4).
Article X Siting Boards have approved five projects that will add a net total of3,326 MW to the New York system. Decisions on at least another five projectsthat could add about 2,700 MW should occur in 2002. The first certified projectsthat may be completed are to be located in New York City (the East RiverRepowering and the Ravenswood Cogeneration Projects). They could beoperational for the summer of 2003. The Athens project is scheduled to beoperation by September 2003. The other approved projects, and those projectscurrently under active review, if approved and carried forward, would probablybecome operational during 2004 and 2005.
The Article X power plant siting law remains in effect until January 1, 2003.
3-90
TABLE 4
ARTICLE X PROJECT STATUS(as of 11/20/01)
Projected
Project Location Capacity Earliest in Service Status
Notes: *less 164 MW replaced yields 196 MW net increase **less 400 MW replaced yields 350 MW net increase***less 1254 MW replaced yields 562 MW net increase
3-91
• Non-Article X Supply Options. In the near term (2002 and 2003), until newbase load combined-cycle generation comes into service, the State will have torely primarily on additional simple-cycle gas turbine generation under 80 MW tosatisfy incremental peak load growth in transmission constrained areas of theState. Most of the immediate need for generation capacity is on Long Island.
In September 2000, the PSC established the Pricing and Reliability Task Force(P&R Task Force) within the DPS to ensure that our State will have reliablesupplies of electricity at reasonable prices. The P&R Task Force consists of threespecialized teams – the Independent System Operator (ISO) Pricing Team, theDemand and Supply Team, and the Article X Team.
The Demand and Supply Team’s responsibility is to ensure that adequate suppliesof electricity will be available until significant new base load generation can bebuilt. The program’s focus to meet the 2001 summer peak was satisfied by newgeneration resources in New York City, including the New York PowerAuthority’s installation of approximately 450 MW of small gas turbine capability(less than 80 MW at a given site) in New York City and on Long Island. Inaddition, peak demand was reduced through the ISO’s Demand Reductionresponse programs. These programs enabled the State to operate during thesummer of 2001without blackouts or brownouts. They also helped to hold downwholesale electricity prices in the State.
A similar Demand and Supply initiative is underway to meet the State’s reliabilityrequirements for the summer of 2002. To meet 2002 summer peak demand, PSCstaff are working with LIPA, other State agencies and power developers tofacilitate the installation of small electric generation units in the State, primarilyon Long Island, and to continue to enhance demand reduction programs.
Distributed generation and renewable energy resources are also being added tothe State’s generation energy mix. As noted previously in “New York StateRetail Market” section, the State has developed initiatives and incentives toencourage the development of these technologies, has developed interconnectionstandards for distributed generation, has established guidelines for standby ratesfor on-site generators, and has required all transmission and distribution ownersto include distributed generation in their delivery system expansion evaluations. With respect to renewable technologies, Governor Pataki has required all Stateagencies to obtain at least 10% of their power requirements from renewableresources by the year 2005 and 20% by the year 2010. NYSERDA has fundedsignificant research and development work in the area of fuel cells, PV, windpower, biomass, etc. While such facilities currently make up only a small portionof New York’s generation capacity, more will certainly be installed over time.
3-92
• Demand Reduction Options. In March 2001, the PSC approved several electricdemand response programs designed to reduce demand for electricity in ConEdison’s service territory during peak times, improve the overall reliability of theelectric system, and moderate prices in New York City. The PSC also directed allof the State's investor-owned utilities to submit plans to implement a customer-incentive program to reduce peak demand, expand the available supply ofelectricity, and moderate pricing of wholesale electricity in the State. The PSCsubsequently approved the programs and tariffs to implement them. Theseactions allowed utility supply customers, in addition to ESCO customers, to takeadvantage of new demand reduction programs offered by the NYISO. By the endof August of 2001, approximately 680 MW of demand reduction had registered inthe ISO’s Emergency Demand Response Program, which provided as much as475 MW of demand reduction during system emergencies in 2001. The NYISO’sDay Ahead Demand Response Bidding Program similarly provided opportunityfor relief during the 2001 Summer, with as much as 375 MW of reductionavailable in a given hour from parties registered to participate in this program. Inaddition, the System Benefits Charge programs implemented by NYSERDAreduced demand by about 80 MW. Additional savings resulted from publicappeals, plans developed to reduce government energy usage during peak periods,and other utility programs. The PSC also required utilities to prepare detailedpublic awareness plans describing each company’s steps to raise awareness andeducate customers regarding the load and capacity situation and outlining actionconsumers can take to control their energy use. Particular emphasis was directedtoward the business community because that is where the greatest results mightbe expected in the shortest amount of time.
• Transmission Options. Transmission additions and modifications can alsoimpact the wholesale market. The installation of the flexible alternating currenttransmission system equipment at Marcy, mentioned later in this Assessment, hasalready resulted in reduction of transmission constraints. Other such installationsmight be considered in the future where justified. Installation of newtransmission lines can also impact the wholesale market. Where new generationis being installed, new lines or interconnections are needed, but new merchantlines from other areas are also being considered. Currently, only one suchproject, the Transenergie Cross-Sound Line from Connecticut to Long Island, hasbeen authorized by New York State, but several more are being considered (Seethe “Transmission” section later in this Assessment).
STATUS OF UTILITY STRUCTURES/MERGERS
Since 1994, most of the major electric and gas utility companies in New York State havebeen allowed to enter into holding company structures. This permission was granted aspart of the proceedings conducted to open the electric business to competition. These
3-93
cases also produced extended rate plans wherein rates were either frozen or decreasedover several years.
The Commission policy toward mergers and acquisitions, consistent with the controllingstatute, has long been that the merger must be determined to be in the public interestbefore it can be approved. In past mergers, this has generally meant that the ratepayermust be held harmless in the transaction and also that they should share in any synergysavings resulting from the merger.
The first merger between major electric utilities in New York since the 1940's occurredin 1997. In this transaction, Con Edison acquired Orange & Rockland. As part of theregulatory approval, the rates in the Orange & Rockland service territory were reducedand the company was required to refrain from requesting new rates for an additional twoyears beyond what it had previously accepted as part of its restructuring plans. Orange &Rockland and Con Edison’s gas rates were reduced while cost savings attributable to ConEdison’s electric and steam operation were deferred until the next rate proceeding.
Recently, two additional mergers involving New York electric and gas companies wereannounced. In September 2000, Niagara Mohawk Holdings, the parent of NiagaraMohawk Power Corporation, entered into a merger agreement with National Grid,whereby it would become a wholly owned subsidiary of National Grid. National Grid’sprincipal subsidiary, The National Grid Company, plc., owns and operates the highvoltage transmission system in England and Wales. National Grid, through anothersubsidiary, National Grid USA, also has substantial transmission and distributionoperations in the United States following its acquisitions of New England ElectricSystem and Eastern Utilities Associates in early 2000.
The combination of Niagara Mohawk and National Grid more than doubles the size ofNational Grid’s US operations with an electric customer base of approximately 3.3million. On November 28, 2001, the merger moved closer to consummation when thePSC granted its approval. The Securities and Exchange Commission must now reach aseparate decision.
The merger conditions adopted by the Commission include a reduction in NiagaraMohawk’s annual electric delivery rates of about $152 million (approximately 8%) ayear. This delivery rate reduction is distinct from the price of electricity itself (the supplycost). For a residential customer receiving both delivery and supply from NiagaraMohawk, the proposed 8% delivery rate reduction will result in an overall bill reductionof about 4.6% on average based on the current supply price of electricity. The new rates
3-94
will take effect following the completion of the merger.
Further, the lower electricity delivery rates will be stabilized under the merger plan for 10years, subject to limited re-openers and adjustments for external events such as changesin statutory, tax or accounting requirements, of extraordinary events. The supply costs ofelectricity provided by the utility to residential and small commercial customers will bestabilized through contracts that hedge the price of electricity.
Other conditions of the merger include the extension of a gas delivery rate freeze,originally approved in 1996, through December 31, 2004, and expansion of gas andelectric low-income customer services through the creation of a low-income rate discountprogram for qualifying customers. Economic development will be encouraged byproviding discounts, incentives and other programs to small commercial and industrialcustomers designed to attract, expand and retain businesses in Niagara Mohawk’s serviceterritory.
National Grid will also implement a program to encourage marketing of renewableenergy, and the rules will be modified to facilitate development of distributed generation. A comprehensive service quality assurance program will be established to ensure thatNiagara Mohawk maintains quality customer service and service reliability. The rightsof Niagara Mohawk’s union employees will be preserved under the merger and the rightsof the union to represent employees in future negotiations will be recognized. Under theJoint Proposal, all existing and legal and contractual protections of retiree’s currentpension and benefit programs remain in place.
On February 20, 2001, Energy East Corporation and RGS Energy Group, Inc. announcedthat their boards of directors have unanimously approved a merger agreement, underwhich all of the outstanding shares of RGS Energy would be exchanged for acombination of cash and Energy East stock. If approved, the combined company wouldbe one of the largest, most diversified energy providers in the Northeast, serving nearly 3million customers, including approximately 1.8 million electric customers, almost onemillion natural gas customers, and approximately 200,000 other retail energy customers.The combined company would have annual revenues of approximately $5 billion andnearly $10 billion in assets. Together, Energy East and RGS Energy, through theiroperating subsidiaries, would serve half of upstate New York.
3-95
STATUS OF ELECTRICITY INFRASTRUCTURES
Transmission
The 2001 Load & Capacity Report submitted by the NYISO indicates that there are10,805 miles of transmission facilities in New York State.
These facilities are generally adequate to provide reliable electric system operations nowand in the immediate future, but local transmission reinforcements may becomenecessary in the New York City and Long Island areas. In addition, there are systemconstraints that limit the amount of electric power that can be transmitted betweenregions within the State. In particular, there are limitations on the amount of power thatcan be moved from upstate to downstate, and into either New York City or onto LongIsland from surrounding areas. Because the system is operated in such a manner thatthese constraints are not violated, reliability is not jeopardized by these constraints, butthere are economic impacts as evidenced by the normally higher prices in downstateregions compared to upstate/western areas. New York’s existing transmission systemfacilities, delineated by voltage class and circuit miles, are shown in Table 5. Theinternal interface limits within New York State are shown in Table 6.
TABLE 5EXISTING TRANSMISSION LINE VOLTAGES (kV) AND CIRCUIT MILES
While the 2001 Load & Capacity Report mentioned only one new transmission line (adirect current line from Connecticut to Long Island) and the re-building of one 69- kVline to 138-kV operation (near Middletown), various other transmission projects are inthe planning stages. While many of them would be for the sole purpose of connecting a
20 One such project, an underwater cable from Connecticut to Long Island, has been approved by the PSC,and a formal application for another cable, from New Jersey to Manhattan, has recently been filed.
3-96
new generator to the existing transmission system, many developers are proposing tobuild new merchant transmission lines that could provide new links to New York fromNew Jersey and other areas, including locations in the Canadian Maritime Provinces.20 Studies of the impact of such facilities on the New York State and Northeast transmissiongrids are performed by power system engineers and reviewed by the NYISO foracceptability. After approvals are obtained following the NYISO procedures, developerscan apply to the PSC for approval under Article VII of the Public Service Law. Whetheror not such lines are built will depend in large part on assessments of the likely economicopportunities associated with such ventures and on the engineering and environmentalreviews necessary under Article VII. The Article VII process continues to be an effectivemechanism for ensuring that such projects are compatible with the environment and meetpublic needs.
New York State is electrically connected with surrounding states (Pennsylvania, NewJersey, Connecticut, Massachusetts, Vermont) and Canadian provinces (Ontario andQuebec). Because peak loads occur in winter in Quebec and to a lesser extent in Ontario,and in summer in New York State (and New England and PA-NJ), significant amounts ofpower frequently flow from Canada to New York in the summer and in the oppositedirection in the winter. There are frequently significant power flows between New Yorkand PA-NJ for a variety of reasons, including economic transactions (in both directions)and local area support (in both directions). Lesser amounts of power move back andforth with New England for those same purposes. Depending on the construction of newgenerating plants and new transmission lines in parts of the Northeast, changes in rulesset by the FERC, and the possible development of a Northeast RTO (under FERCorders/approvals), it is likely that New York State will see increasing amounts of powertransfers across its borders. Such increases would undoubtedly produce economicbenefits to all concerned and should maintain or increase levels of reliability throughoutthe Northeast region. Table 7 provides information from the 2001 Load & CapacityReport on transmission capabilities between New York and its neighbors.
Efforts are underway to examine ways to increase the transfer limits both within NewYork State and with its neighbors. For example, NYPA has installed the ConvertibleStatic Compensator (CSC), one of the world’s most advanced transmission controldevices, at its Clark Energy Center in Marcy (Oneida County). Completion of the firstphase of project in 2001 increased transmission capacity by 60 megawatts on the heavilyused lines between Utica and Albany and by 114 megawatts statewide. When fully
3-97
operational in the summer of 2002, the CSC is expected to permit total increases,including those already achieved, of 120 megawatts on the Utica-Albany lines and 240megawatts. NYPA is investing $35 million in the CSC, with additional funding for the$48 million project from EPRI, the electricity industry’s science and technologydevelopment organization; Siemens Transmission and Distribution and about 30 electricutilities and independent system operators in the U.S., Canada and New Zealand. TheCSC is the latest in a series of transmission control technologies known as FACTS(Flexible Alternating Current Transmission Systems) that have been developed by EPRIin cooperation with several electric utilities, including the Power Authority
Other efforts are underway to examine existing transmission lines and identify those thatare good candidates for replacement of limiting elements that could increase their ratings. Because numerous in-state transfer limits are in a linear path from upstate to downstate,reinforcement of a single transmission interface may provide only marginal benefitbecause the next interface on that path will become the next most limiting element forpower transfers. Therefore, to move more power from upstate to downstate may requirereinforcements over most of the path, not just reinforcing a single weakest link. Nevertheless, there may be some efforts that will include new transmission lineconstruction (whether overhead or underground). This would be both difficult andexpensive and would have to be weighed against the advantages of building newgenerators in Metropolitan New York City instead.
TABLE 7
INTERPOOL INTERFACES TRANSFERCAPABILITIES
OH-NYISO 2,325 MW
NYISO-OH 1,300 MW
PJM-NYISO 3,150 MW
NYISO-PJM 325 MW
NEPOOL-NYISO 1,600 MW
NYISO-NEPOOL 1,425 MW
HQ-NYISO 2,470 MW
NYISO-HQ 1,000 MW
21 The status and expectations for additional generation were presented above in the “New York StateWholesale Market” section of this Electricity Resource Assessment.22 The capability assumptions used in this section of the Electricity Resource Assessment are describedlater in the “Load and Capability Analyses” section.
3-98
Generation21
The landscape of power generation in New York State, and the country as a whole, hasshifted dramatically in recent years - from a preponderance of generation owned byinvestor-owned utilities to the present situation where most of the generation in the Stateis privately owned. Generators now compete directly with each other to supply power. Those generators with access to inexpensive fuels and low cost, efficient technology willcompete successfully. Older, inefficient technologies will likely be driven out of themarket.
New York has also gone from an energy sector that was heavily dependent on coal andoil to a sector that is becoming increasingly dependent on natural gas. Almost all of thenew generation proposed to be built in New York State is to be fired with natural gas. Inaddition, air quality requirements are reducing the operation of existing coal and oilfacilities and leading to the retirement of some coal and oil plants. Most of the newcombined-cycle gas fired power plants can achieve efficiencies of greater than 50%, ascompared to approximately 33% for existing generation. In some applications, older gasand oil steam plants may be repowered into more efficient combined-cycle plants. Whilethese higher efficiencies can mitigate, to some degree, the excessive demand for naturalgas, a significant increase in the use of natural gas for electricity generation can still beexpected.
Nuclear and hydro power generation, through license renewals, could remain available interms of installed capacity and energy production over the planning period. On average,nuclear and hydro power generation combined account for over 30% of the State’s totalelectricity requirements. The remaining 70% of the State’s electric energy requirementswould come mostly from coal, oil, and as previously noted, natural gas, with at least halfcoming from natural gas.22
The existing generation capacity mix, by fuel type, currently available in 2001 in NewYork State is shown in Table 8. As indicated, the current mix is balanced among manyresources, but generally divided somewhat equally between the major sources--naturalgas, oil, coal, and nuclear. Comparing the existing capacity fuel mix to what may exist inyear 2021, also shown in Table 8, illustrates the likelihood of a significant shift towardnatural gas. Almost all the new capacity will likely be fueled by natural gas unless
23 The figure is based on the assumptions contained in the “Reference Resource Case” described later in the“Load and Capability Analyses” section of this Electricity Resource Assessments. If additional generationbeyond the reference assumptions is built, one may assume that natural gas would be the fuel of choicebased on current technology and fuel price considerations. Consequently, the mix would be shifted evenfurther toward natural gas. These shifts toward dependency on natural gas raise significant issues that needto be addressed through the development and deployment of competitive, economic and environmentallyacceptable alternatives (see “Promoting Energy Industry Competition” issue paper).
3-99
circumstances change significantly.23 It is also important to note that most of the naturalgas/oil generating facilities rely primarily on natural gas, as can be seen in Table 9.
TABLE 8
FUEL MIX CHANGES BASED ON CAPACITY OFINSTALLED UNITS
Generation Fuel 2001 2021
Natural Gas 17% 30%
Oil 12% 10%
Natural Gas/Oil 31% 25%
Coal 10% 8%
Nuclear 14% 12%
Hydro 15% 13%
Other 1% 2%
TOTAL 100% 100%
Table 9 identifies the generation “energy mix” by fuel types. Both projected generationin gigawatt hours (GWh) and relative shares are shown in this table. It illustrates theState’s growing reliance on natural gas as new combined-cycle units are installed to meetincreased electric load demands. In 2002, 15.2% of the State’s electric energyrequirements are projected to be met by natural gas. In 2020, the use of natural gas isprojected to reach 48% under the Reference Resource Case scenario described later inthis Electricity Resource Assessment (unless competitive, economic and environmentallyacceptable alternatives are developed and deployed in the interim). That percentage willlikely increase if further gas-fired generation is installed or if additional existing non-gas-fired facilities are retired. The impact of this increasing dependence is discussed in the”Promoting Energy Industry Competition” issue paper. The Reference Resource Casealso projects that generation from coal and oil sources will drop by one-half from
3-100
projected 2002 levels due in major part to New York’s Acid Deposition Initiativeprogram.
TABLE 9
REFERENCE RESOURCE CASEGENERATION BY FUEL TYPE FOR THE NEW YORK ELECTRICITY SYSTEM
Net Imports 11.6% 11.9% 11.4% 11.6% 10.7% 9.6% 8.1% 4.5%
TOTAL 100.0% 100.0% 100.0% 100.0% 100.0% 100.0% 100.0% 100.0%
Based on these and alternative projections of future capacity, and through the use of anelectricity production simulation model, the inference is that, over time, theenvironmental impact of emissions from generation in New York State will significantly
24 The Article X and SEQRA processes for new generation proposals will examine environmental impactsto ensure that all are minimized or mitigated. To the extent that alternatives to use of natural gas and oil aredeveloped and deployed, the emissions should likewise decline, assuming the alternatives provideequivalent or better environmental characteristics.
3-101
decline.24 Table 10 presents the projected SO2, NOx, and CO2 emissions that may beexpected over the planning period, using the Reference Resource Case described later inthis Assessment.
TABLE 10
NEW YORK ELECTRICITY SYSTEMPROJECTED EMISSIONS FOR THE REFERENCE RESOURCE CASE
The projected drop in SO2 and NOX emission between 2004 and 2008 is due to the fullimplementation of the State’s Acid Deposition Initiative program, which seeks to limitsulfur emissions to one-half of levels currently authorized under the Federal Clean AirAct and also reduce NOX emissions to annual rates specified as expected five monthtargets rates under the Ozone Transport Region control program. SO2 emission targetsare substantially achieved in the Reference Resource Case. NOX is more significantlyreduced. The attainment of emission goals is very dependent upon new gas-firedcombined-cycle units being added to the New York electricity system and trading amongregional electric systems. Further, results are strongly dependent on adequate supplies ofnatural gas to fuel these new units as well as existing units that increase their use ofnatural gas as an emission compliance strategy.
Table 11 refines the Statewide emission data for the Reference Resource Case to showemission values for three ozone regions established for the Northeast Ozone TransportProgram within New York. Of particular interest in Table 11 is the change in CO2
emissions (which is a direct function of the quantity of fossil fuel consumed to produceelectricity) between 2002 to 2020, revealing the extent that generation within the Statehas shifted from the upstate to the downstate region. This emission shift reflects thecurrent preference for new generation to seek locations close to load centers in order toavoid transmission congestion associated with a more remote site.
3-102
TABLE 11
NEW YORK ELECTRICITY SYSTEMPROJECTED EMISSIONS BY OZONE REGION
The analyses presented here indicate that sufficient generation will likely be available tomeet reliability needs throughout the planning period, but additional generation and loadreduction would be beneficial. Absent a substantial change in fuel mix or technology,however, the State will likely become more and more dependent on natural gas, which isa critical issue that needs to be addressed. The next three subsections examine thedirection and magnitude of change that could occur if some elements of the ReferenceResource Case are modified. Three alternative sensitivity scenarios are presented.
Low Load Sensitivity Scenario. This sensitivity scenario alters the load input byutilizing the “Low Load” forecast rather than the “Outlook” forecast (See “ElectricityLoad and Price Forecasts” section). The “Low Load” forecast has energy requirementsthat are 1% to 4% below the “Outlook” forecast during the first half of the assessmentperiod and 4% to 6% below the “Outlook” forecast in the final ten years of theassessment period. All supply assumptions in the Reference Resource Case remainunchanged. This sensitivity is not meant to identify a specific cause of lower electricdemand, but it acknowledges the potential for lower electricity grid consumption, due to:reduced economic activity; a higher level of distributed generation penetration; and/orenhanced energy efficiency activities.
• Wholesale Prices. Relative wholesale prices (LBMPs in the NYISO lexicon) forelectricity parallel those for the Reference Resource Case in all but one zone forall years in the sensitivity analysis. In operation of the system, the NYISOchooses the most economical mix of generation to meet projected demand. Thelast MW of generation accepted is the most expensive and establishes the pricepaid per MWh (the LBMP price). As load declines, wholesale prices would be
3-103
2002 2003 2004 2005 2008 2012 2016 2020
0.80
0.90
1.00
Inde
x
Ref. CaseLow Loads
Ref. Resource Case vs. Low Loads SensitivityLBMPs for West (Indexed to Ref. Case)
Figure 1
2002 2003 2004 2005 2008 2012 2016 2020
1.00
1.10
1.20
1.30
Inde
x
Ref. CaseLow Loads
Ref. Resource Case vs. Low Loads SensitivityLBMPs for Long Island (Indexed to Ref. Case)
Figure 2
expected to decline as the NYISO is able to meet demand with less expensivegeneration resources. Figures 1 and 2 depict the differences in relative pricesbetween theReference ResourceCase and the LowerLoad Sensitivity forboth the West Zoneand the Long IslandZone. In thesefigures, the LBMPvalues for the LowerLoad Sensitivity areindexed, in constantyear 2000 dollars, tothe annual averageprice for the “West”zone established forthe ReferenceResource Case. Thegap between pricesin the Long IslandZone becomes morepronounced in lateryears as reduced on-Island loadcontributes todecreases intransmissioncongestion andprovides more accessto cheaper off-Islandelectricity sources. Lower demand forelectricity would beexpected to benefitconsumers throughlower wholesaleprices, andnegatively impactelectric generation operators through lower electric sales revenues, especiallyNew York State generation. This is because about 90% of the reduced electricconsumption is accounted for through reduced in-State electric generation.
• Generation Mix. Table 12 compares the generation mix in the New York systembetween the two cases for the years 2002, 2008, and 2020. Reductions in the use
3-104
of natural gas for electric generation accounts for the bulk of the decreased in-State generation.
Table 12Comparison of Generation Mix Between
the Reference Resource Case and the Lower Load Sensitivity
GenerationFuel
(in GWh)
2002 2008 2020
Ref. Case
Low Load
Ref. Case
Low Load
Ref. Case
Low Load
Natural Gas 24,706 23,501 63,684 60,566 88,129 80,691
Oil 24,784 24,181 6,388 5,295 4,279 2,396
Coal 29,380 29,328 17,271 17,160 16,858 16,492
Nuclear 32,563 32,563 32,657 32,657 32,649 32,649
Hydro 29,109 29,139 29,195 29,178 29,519 29,564
Other 2,866 2,866 3,429 3,429 3,430 3,430
Net Imports 18,799 18,617 18,311 18,189 8,165 6,201
Total 162,207 160,195 170,935 166,474 183,029 171,423
In % of Total
GenerationFuel
(in %)
2002 2008 2020
Ref. Case
Low Load
Ref. Case
Low Load
Ref. Case
Low Load
Natural Gas 15.2 14.7 37.3 36.4 48.2 47.1
Oil 15.3 15.1 3.7 3.2 2.3 1.4
Coal 18.1 18.3 10.1 10.3 9.2 9.6
Nuclear 20.1 20.3 19.1 19.6 17.8 19.0
Hydro 17.9 18.2 17.1 17.5 16.1 17.2
Other 1.8 1.8 2.0 2.1 1.9 2.0
Net Imports 11.6 11.6 10.7 10.9 4.5 3.6
Total 100.0 100.0 100.0 100.0 100.0 100.0
3-105
2002 2003 2004 2005 2008 2012 2016 2020100
140
180
220
260
300
340
380
420
(x00
0's
tons
)
Ref. CaseLow Load
Ref. Resourse Case vs. Lower Load SensitivityAnnual SO2 Emissions
Figure 3
2002 2003 2004 2005 2008 2012 2016 2020
48,000
52,000
56,000
60,000
64,000
68,000
72,000
(x00
0's
tons
)
Ref. CaseLow Load
Ref. Resource Case vs. Lower Load SensitivityAnnual CO2 Emissions
Figure 4
• Emissions. This decrease in New York State generation associated with theLower Load Sensitivity results in decreased in-State emissions of NOx, SO2, andCO2 as displayed in Figures 3, 4 and 5. The differences are not dramatic,although emissions reductions are more pronounced in later years.
25 Reserve margins requirements (also known as installed reserve margin or system reserve marginrequirements) are established by the New York State Reliability Council. The purpose of the reservemargin is to ensure reliability within the control system, that is, a system in which the probability of acustomer outage due to lack of supply will be no greater than once in any 10-year period. The reservemargin is determined annually on February 1st, 90 days before the capability year beginning May 1. Thereserve margin is defined as the ratio of required excess generation capacity to projected peak load demandwithin the control area. Currently, the reserve margin requirement for the New York Control Area has beenestablished at 18%.
3-106
2002 2003 2004 2005 2008 2012 2016 202030
4050
6070
8090
100110
120
(x00
0's
tons
)
Ref. CaseLow Load
Ref. Resource Case vs. Lower Load SensitivityAnnual NOx Emissions
Figure 5More GenerationSensitivity Scenario. The More Generationsensitivity scenario isused to evaluate theeffects of more newgenerating capacitybeing added to the NewYork electricity systemthan anticipated in theReference ResourceCase. Overall, thisscenario strives to addcapacity at the paceneeded to reach areasonably high reservemargin25 level (30%) forthe New York electricitysystem. The MoreGeneration sensitivity assumes 9,671 MW of new generation, which includes the 5,171MW of new Article X capacity included in the Reference Resource Case and another4,500 MW of new Article X capacity to be added at a pace that produces system reservemargins at approximately 30%.
Most of the new generating capacity (7,371 MW) is assumed to be added in the HudsonRiver region and in southeastern New York. This area is east of the current constrainingtransmission interfaces in upstate New York. The remainder (2,300 MW) is assumed tobe added in upstate New York, west of the constraining interfaces. Specifically, for theMore Generation sensitivity, one third of the additional 4,500 MW of new generation isadded in the upstate New York area, another third is added in the Mid-Hudson/NYC area,and one third is added in the Long Island area.
• Wholesale Prices. Wholesale prices for the Reference Resource Case and theMore Generation sensitivity are the same up to 2005 because total generatingcapacity is identical. Starting in 2005, the addition of new capacity causeswholesale prices to decline. By 2020, the price indexes have declined by about
3-107
2002 2003 2004 2005 2008 2012 2016 2020
0.80
0.90
1.00
Inde
x
Ref. Case More Generation
Ref. Resource Case vs. More Generation SensitivityLBMPs for West (Indexed to Ref. Case)
Figure 6
2002 2003 2004 2005 2008 2012 2016 2020
0.90
1.00
1.10
1.20
1.30
Inde
x
Ref. CaseMore Generation
Ref. Resource Case vs. More Generation SensitivityLBMPs for Long Island (Indexed to Ref. Case)
Figure 7
5% for all transmission zones other than the Long Island area. For the sameperiod, however, the Long Island area experiences a significant wholesale priceindex decrease which by 2020 is approximately 21% below Reference ResourceCase levels. These trends are displayed in Figures 6 and 7 for the Western andLong Islandtransmissions zones. Historically, LongIsland has had thehighest averagewholesale prices inNew York State. The additionalgenerating capacityfor this sensitivityscenario lowers theLong Islandwholesale pricethrough thecombined effects ofmore on-Islandsupply and reducedtransmissioncongestion to theLong Island area,which allows cheaperimports to flow intothe on-Island market.
• Generation Mix. Table 13 summarizesthe generation mixfrom 2008 - 2020 forboth the ReferenceResource Case andthe More Generationsensitivity. TheMore Generationscenario shows a greater reliance on natural gas. By 2020, for the MoreGeneration Scenario Case, 55% of New York’s generation would be from naturalgas, compared to a 48% dependency for the Reference Resource Case. Additionally, the More Generation sensitivity results in significantly reducedimports of electricity from near-by systems. In 2020, the More Generationsensitivity has lower coal and residual oil-based generation than the ReferenceCase, with a decrease of 10% and 67%, respectively.
3-108
Table 13Comparison of Generation Mix Between the
Reference Resource Case and the More Generation Sensitivity For Select Years
GenerationFuel
(in GWh)
2008 2012 2016 2020
Ref. Case
MoreGen.
Ref. Case
MoreGen.
Ref. Case
MoreGen.
Ref. Case
MoreGen.
Natural Gas 63,684 68,471 72,488 81,711 79,818 91,705 88,129 100,439
Other 3,429 3,430 3,430 3,428 3,429 3,429 3,430 3,430
Net Imports 18,311 16,142 17,018 11,941 14,723 7,263 8,165 66
Total 170,934 170,934 177,543 177,543 181,234 181,234 183,030 183,030
In % of Total
GenerationFuel
(In %)
2008 2012 2016 2020
Ref. Case
MoreGen.
Ref. Case
MoreGen.
Ref. Case
MoreGen.
Ref. Case
MoreGen.
Natural Gas 37.3 40.1 40.8 46.0 44.0 50.6 48.2 54.9
Oil 3.7 2.3 3.2 1.1 2.5 0.6 2.3 0.8
Coal 10.1 9.9 9.6 9.1 9.2 8.4 9.2 8.3
Nuclear 19.1 19.1 18.4 18.4 18.0 18.0 17.8 17.8
Hydro 17.1 17.2 16.4 16.7 16.2 16.5 16.1 16.3
Other 2.0 2.0 1.9 1.9 1.9 1.9 1.9 1.9
Net Imports 10.7 9.4 9.6 6.7 8.1 4.0 4.5 0.0
Total 100.0 100.0 100.0 100.0 100.0 100.0 100.0 100.0
3-109
2008 2012 2016 2020100
110
120
130
140
150
(x00
0's
tons
)
Ref. CaseMore Gen
Ref. Resource Case vs. More Generation SensitivityAnnual SO2 Emissions
Figure 8
2008 2012 2016 202020
30
40
50
60
(x00
0's
tons
)
Ref. CaseMore Gen
Ref. Resourse Case vs. More Generation SensitivityAnnual NOX Emissions
Figure 9
• Emissions. The fuel shifts between the two cases resulted in reduced air emissionswhich is summarized inFigures 8, 9, and 10. By2020, the annual SO2,NOx, CO2, and 5-monthNOx have been reducedby 13%, 35%, 5%, and31%, respectively.Within the New Yorkelectricity system, thereis a shift in the regionalnature of emissions intothe air, with southeasternNew York realizingsignificant reductions inall the emissionscategories.
Lower Trade SensitivityScenario. The ReferenceResource Case assumes that theNew York electricity systemparticipates in a robust regionalelectricity trading program withother near-by electricitysystems. The high level ofelectricity trading amongsystems is reflecting one of theprimary objectives of electricityderegulation efforts and,potentially, the benefits that willbe enhanced throughdevelopment of an appropriatelystructured RTO. This sensitivityscenario explores theconsequences of decreasing significantly the level of inter-regional trading among the threemajor electricity systems in the Northeast. The objective of this sensitivity is to identifythe value to the New York electricity system of enhanced and unimpeded electricitytransactions with other supply systems.
3-110
2008 2012 2016 202050,000
52,000
54,000
56,000
58,000
60,000
62,000
64,000
(x00
0's
tons
)
Ref. CaseMore Gen
Ref. Resource Case vs. More Geneation SensitivityAnnual CO2 Emissions
Figure 10
2002 2003 2004 2005 2008 2012 2016 20200.80
0.90
1.00
1.10
1.20
1.30
Inde
x Ref. CaseLow Trades
Ref. Resource Case vs. Lower Trades SensitivityLBMPs for Long Island (Indexed to Ref. Case)
Figure 11
• Wholesale Prices.Average annual customerwholesale price indexesrise significantly in everyyear and each zone inthis sensitivity scenariorelative to the ReferenceResource Case. Priceincreases are mostextreme in the earlyyears, but the differencesnarrow in the later yearsof the assessment period. Figures 11 and 12display the pricedifferences in the “NewYork City” and “West”zones between theReference Resource Caseand the Lower Tradescenario.
New York State electricconsumers shouldexperience lowerwholesale electric pricesdue to increased regionalelectricity trading. Conversely, owners ofin-State generationresources would gainhigher revenues fromelectric sales iftransactions from outsidethe State are reduced. Inthis sensitivity, LBMPvalues in New York increase and prices in the Pennsylvania-New Jersey-Marylandand New England systems decrease.
• Generation Mix. Due to the constraint on outside electricity supply in thissensitivity, in-State generating resources produce 15,192 additional GWhs ofelectricity in 2002 in this sensitivity compared to the Reference Resource Case. Most of the additional electric generation in this sensitivity is provided by naturalgas and residual oil in the early years and then primarily by natural gas in the lateryears. Table 14 compares the generation mix in New York State for the two cases
3-111
for the years 2002, 2008, and 2020. Differences in the figures are accounted for inthe differences in net imports between the two cases, because load is held constant.
Table 14Comparison of Generation Mix Between
the Reference Resource Case and the Lower Trades Sensitivity
GenerationFuels
2002 2008 2020
Ref. Case
Low Trades
Ref. Case
Low Trades
Ref. Case
Low Trades
Natural Gas 24,706 31,134 63,684 76,286 88,129 90,738
Oil 24,784 32,912 6,388 7,424 4,279 4,319
Coal 29,380 30,017 17,271 18,954 16,858 17,210
Nuclear 32,563 32,563 32,657 32,657 32,649 32,649
Hydro 29,109 29,107 29,195 29,195 29,519 29,519
Other 2,866 2,866 3,429 3,429 3,430 3,430
Net Imports 18,799 3,607 18,311 2,990 8,165 5,165
Total 162,207 162,207 170,934 170,935 183,029 183,030
In % of Total Generation
GenerationFuels (in %)
2002 2008 2020
Ref. Case
Low Trades
Ref. Case
Low Trades
Ref. Case
Low Trades
Natural Gas 15.2 19.2 37.3 44.6 48.2 49.6
Oil 15.3 20.3 3.7 4.3 2.3 2.4
Coal 18.1 18.5 10.1 11.1 9.2 9.4
Nuclear 20.1 20.1 19.1 19.1 17.8 17.8
Hydro 17.9 17.9 17.1 17.1 16.1 16.1
Other 1.8 1.8 2.0 2.0 1.9 1.9
Net Imports 11.6 2.2 10.7 1.7 4.5 2.8
Total 100.0 100.0 100.0 100.0 100.0 100.0
• Emissions. The increased in-State generation associated with the Lower TradeSensitivity causes increased in-State emissions of NOx, SO2, and CO2. Figures 13,14, and 15 contrast the cases for SO2, NOx, and CO2 emissions.
3-112
2002 2003 2004 2005 2008 2012 2016 20200.80
0.90
1.00
1.10
1.20
Inde
x
Ref. Case Low Trades
Reference Resource Case vs. Lower Trades SensitivityLBMPs for West (Indexed to Ref. Case)
Ref. Resource Case vs. Lower Trade SensitivityAnnual SO2 Emissions
Figure 13
In the Lower TradeSensitivity, the NewYork system experiencesdifficulty in meeting SO2emission reductionobjectives outlined in theAcid Rain DepositionReduction Initiative. Areview of all threeNortheast electricitysystem emission profiles,however, indicates thatthe overall combinedregional air emissions areessentially identical forthe Reference ResourceCase and the LowerTrade sensitivity.
System Operations
The NYISO has theresponsibility for the reliable andlowest cost operation of the NewYork State power system. TheNYISO operates the systemaccording to rules andprocedures approved by theFERC, which allow it to receivebids from generators and loadsand to schedule generatorsaccording to the lowest costcombination for the State. Thisleast cost scheduling is doneboth for a day-aheadcommitment of generators and for the real time operation of the system within theconstraints of maintaining system reliability at all times.
The NYISO continuously coordinates its operations with each of its neighboring controlareas, including New England, PJM (Pennsylvania, New Jersey, Maryland), Quebec, andOntario. Power flows are scheduled in advance to accommodate economically desirabletransactions, and adjustments are made in real time to maintain reliability.
Ref. Resource Case vs. Lower Trade SensitivityAnnual NOx Emissions
Figure 14
2002 2003 2004 2005 2008 2012 2016 202050,000
55,000
60,000
65,000
70,000
75,000
80,000
(x00
0's
tons
)
Ref. Case Low Trades
Ref. Resource Case vs. Lower Trade SensitivityAnnual CO2 Emissions
Figure 15
Reliability criteria for theoperation of the New York Statesystem are developed andmonitored by the New YorkState Reliability Council. Thisorganization has representativesfrom each of the transmissionowning utilities, other marketparticipants, and independentmembers. Each of the localreliability rules must beapproved by this Council, whichalso has statewide reliabilityresponsibilities, such asdetermining the statewideinstalled generation reservemargin necessary to meet nationally accepted reliability criteria.
Infrastructure Security.
Governor Pataki created theOffice of Public Security inOctober 2001. That office ischarged with developing acomprehensive statewide anti-terrorism strategy, including anassessment of the vulnerabilityof critical infrastructures toterrorist attack. Thatvulnerability assessment willinclude nuclear and other powerplants, telecommunicationsystems, gas pipelines, andwater systems. Strategiesdesigned to protect thesefacilities from attack will bedeveloped, and plans will be augmented to provide rapid restoration of utility service in theevent of terrorist attack.
26 The statewide analyses presented in this section do not attempt to address reliability issues on a zonalbasis or within load pocket areas.
3-114
Concurrently, the Department of Public Service established the Security Assessment Teamto assess regulated utility efforts to maintain system reliability and security. This team iscoordinating its activities with the Office of Public Security. The objective of theDepartment’s team is to analyze each utility’s security plans, policies, and proceduresrelating to the vulnerability and protection of critical utility operational and administrativefacilities. The team will also be reviewing longer-term security plans and strategies, andthe utilities’ abilities to accomplish timely restoration, especially in the presence ofbiological and chemical agents.
Load and Capability Analyses
Load and capability analyses are basic tools used in long-range electric system planning torelate the projected customer peak load each year during a given planning period to theresources (both supply and demand reduction techniques) expected to be available. 26 Tothe extent projected resources exceed forecast peak load requirements, excess resourcesprovide a reserve margin to cover equipment outages and failures that might occur duringthe system peak period. The New York State Reliability Council reviews the New Yorksystem annually to determine the necessary size of the reserve margin to maintain a reliablesystem, that is, a system in which the probability of a customer outage due to lack ofsupply will be no greater than once in any 10-year period. Currently, the reserve margin isset at 18%. While such a resource margin does not guarantee system reliability (or thatthere will not be problems in specific regions of the state), the greater the margin, the lessthe chance of outages. The smaller the margin, the greater the need for system operators tomonitor the system closely and use procedures available to them to maintain systemintegrity. The greater the margin, the smaller the concern for system reliability and thegreater the competitive pressures on generation owners to operate efficiently. From acompetitive wholesale market perspective, as reserves diminish or cease to exist, wholesaleprices will tend to increase. Conversely, as reserves increase, supply will exceed therequired demand and wholesale prices will tend to decline.
Table 15 shows the results of a statewide load and capacity analysis based on theassumption that no new generation will be added to the system throughout the planningperiod beyond that already being planned for the 2002 summer period and the 210 MW ofrenewables to be installed through the System Benefit Charge programs over the nextseveral years. As the table indicates, system capability would likely exceed demandthroughout the planning period, as some reserves would exist, but after 2003 they would
3-115
not be sufficient to meet the 18% level currently deemed appropriate for ensuringreliability, nor would they ensure that economic service could be provided in the State. The 1998 State Energy Plan projected that new resources would be required sometime inthe 2001-2005 time frame to maintain system reliability. While the reserve requirementwas set at 22% at that time, rather than the current 18%, this updated analysis results in afinding that additional resources are needed for Statewide system reliability purposes.
TABLE 15PROJECTED RESERVE MARGINS WITH NO NEW RESOURCES
A more likely scenario is that some new generation will be built during the next few yearsto raise the margin above 18%. Accordingly, Table 16 below provides the results of astatewide load and capability analysis using a more reasonable set of minimum resourceassumptions and three different forecasts of peak system loads (low-. mid-, and high-rangeforecasts, as set forth in the “Electricity Load and Price Forecasts” section in thisElectricity Resource Assessment). The resources assumed in this analysis are those thatcurrently exist or might reasonably be expected to be available as a minimum during theplanning period. Of course, many other resource scenarios might also be considered, andseveral such alternatives are discussed later. Further, the existence of an appropriatestatewide reserve level does not necessarily ensure that adequate resources exist in everyarea of the state. It is clear, however, that the greater the supply of generation in relation todemand, within a reasonable range, the better off consumers will likely be in terms of bothprice and reliability.
As can be seen in Table 16 above, the reserve margins over the planning period might be aslow as 10.6% or as high as 33%, depending on the load forecast assumed. The data based
3-116
on the mid-range (or “outlook”) forecast, using the Reference Resource Case, shows thatreserve margins throughout the planning period will likely exceed the 18% level. Reservesmight even approach the 30% level in the 2005 – 2007 time period, but they would declineover time as load increases and no new generation or additional load reduction occursunder this specific scenario.
Higher reserve levels might be achievable if additional generation or load managementresources become available or if the peak load tends toward the low-range forecast. Lowerreserve levels might occur if the generation assumed in the reference capability case is notconstructed or if peak loads tend toward the high-range forecast.
As previously noted, the Reference Resource Case used here is based on current conditionsand a set of future expectations that one could reasonably make at this time. In particular,the reference case assumes:
1) Demand reductions described in the forecast section of this Assessment will occur;
2) Most of the plants previously certified under Article X of the Public Service Lawwill be built and placed into operation (2,326 MW net). It should be noted,however, that the existence of a certificate to construct and operate a generationplant does not guarantee that the plant will in fact be built and operated.
3) All other plants that have not been certified that have complete Article Xapplications and that are proposed to be built at existing sites and that are coupledspecifically with retirement of less efficient, more polluting equipment, will be builtand placed into operation (increases of 710 MW in 2005, and 170 MW in 2006, fora total of 880 MW net). This assumption should not be interpreted as anyprejudgment of the Article X process; it is simply an assumption for the referenceresource case.
4) Approximately 2,000 MW of capacity will become available from some, but not all,of the other Article X projects with completed applications (about 950 MW in 2004and about 1,050 MW in 2005; again, no prejudgment is intended here as to whichof the proposals will be approved, if any).
5) Approximately 630 MW of capacity from miscellaneous non-Article X generationwill become available in 2002 and 2003 (500 MW in 2002 and 130 MW in 2003).
6) Approximately 210 MW of additional renewables will be added between 2002 and2006 through use of the System Benefit Charge program.
7) Retirements or deactivation of 60 MW of generation in 2004 and 570 MW in 2005will occur.
3-117
8) Relicensing of all operating nuclear units will occur.
9) Firm purchases and sales, as described in the ISO’s 2001 5-112 filing with the NewYork State Energy Planning Board, will take place.
10) Other additions, especially renewable generator and demand reductions, areprobable but are not assumed in this conservative case.
Other cases might also be considered to evaluate alternative assumptions. Table 17 showsthe projected reserve margins over the planning period for the several alternative load andcapability cases described below, all based on the mid-range peak load forecast.
Alternative Load and Capability Case 1. – Same as the reference resource case exceptassumes that all Article X projects with completed applications are approved and built (thiscase adds 925 MW more in 2004 and 1,040 MW more in 2005). In this scenario, thereserve margin would reach as much as 36% by 2006 and would gradually decline to about25% at the end of the planning period.
Alternative Load and Capability Case 2. – Same as the reference case except assumesretirement of nuclear units at the ends of their current license periods. (Reserve margins
would drop below the desired 18% level in 2013 such that over the planning period about3,400 MW of additional resources would be needed to maintain reliability.)
Alternative Load and Capability Case 3. – Same as the reference case except assumesretirement of about 4,500 MW of additional generation during the planning period.
Alternative Load and Capability Case 4. – Same as the reference case except assumesretirement of about 8,400 MW of additional generation by the end of the planning period.
TABLE 17
PROJECTED RESERVE MARGINS FOR ALTERNATIVE SCENARIOS
27 As previously noted, the Reference Resource Case assumes that at least 5000 MW of new generation canreasonably be expected to be added between 2003 and 2006.
3-118
The data in Tables 16 and 17, and the load and capability analyses supporting them, showthat under the mid-range forecast, system reliability (i.e., assuming continuation of the 18%requirement) can generally be maintained on a statewide basis throughout the planningperiod if the assumptions of the reference case are fulfilled and especially if any unitretirements are replaced by new resources. This means that at least 4,800 MW of addedcapability, including capability from generating plants already approved and new resourcesfrom plants not yet approved and/or permanent load reduction, is required after 2002.27 Ifexisting generation, above the 570 MW assumed in the Reference Case, is retired,corresponding additions or peak load reduction would also be needed at some time duringthe planning period (for example, see Alternate Load and Capability Cases 2, 3, and 4). Also, if load grows at a higher rate than assumed by the mid-range forecast, the additionalresources will be needed sooner. On the other hand, if load grows at a slower rate (forexample, see Alternate Load and Capability Case 1), resources beyond those alreadyapproved may not be required for reliability purposes, except as replacements whenretirements occur, as necessary, or to address market power concerns.
ELECTRICITY LOAD AND PRICE FORECASTS
Approach
The long-range forecasts (i.e., through 2020) of electricity demand and prices weredeveloped from forecasts prepared by the Department of Energy’s Energy InformationAdministration (EIA) and captured in its Annual Energy Outlook 2001. New York electricity demand and price forecasts were generated by applying growth rates from EIA’sMiddle Atlantic regional forecasts to base New York State and EIA numbers. Themethodologies used to develop the State Energy Plan projections of demand and prices forelectricity are described in greater detail in the Forecast Summary (Section 3.1).
Load
Growth in peak demand, depicted in Figure 16, is projected to be between 0.32% and1.05% per year, with an Outlook Case growth rate of 0.68% per year. Growth in total electricity requirement, depicted in Figure 17, is projected to be between0.37% and 1.10% per year, with an Outlook Case growth rate of 0.73% per year.
3-119
2000 2003 2006 2009 2012 2015 2018 2021
29
30
31
32
33
34
35
36
37
38
Thou
sand
sM
WLow Economic Case Outlook Case High Economic Case
Peak Electricity Demand
Figure 16
2000 2003 2006 2009 2012 2015 2018 2021
150
160
170
180
190
200
Thou
sand
sG
Wh
Low Economic Case Outlook Case High Economic Case
Total Electricity Requirements
Figure 17
Retail Prices (Delivery andCommodity)
During the past several years,the State’s electric and gascustomers have received thebenefits of significantreductions in their electricand gas delivery rates. Since1996, the New York PublicService Commission (PSC)has issued orders that have sofar resulted in cumulativecustomer rate reductions of about $3.4 billion, with at least that same amount of furthercumulative savings to be available over the next several years. The Long Island PowerAuthority has similarlyprovided rate reductions forits customers in the amountof about $2 billion through2001. In addition, furthercustomer savings ($152million per year) will resultfrom the recent PSC Orderdetermining electric revenuerequirements for the NiagaraMohawk PowerCorporation, and customersavings might also resultwhen the on-going NewYork State Electric and Gas Corporation/Rochester Gas and Electric merger proceeding iscompleted.
This section of the Electricity Resource Assessment forecasts average electricity pricesover the planning period for both the regulated delivery and competitive commoditycomponents of customer bills.
Near-term average electricity prices, depicted in Figure 18, are projected to decrease by5.30% per year in the Low Economic Case, 5.03% per year in the Outlook Case, and4.85% per year in the High Economic Case, in constant 2000 dollars, for the next fiveyears.
3-120
2000 2001 2002 2003 2004 2005 20068
8.5
9
9.5
10
10.5
11
11.5
cent
s/kW
h
Low Economic Case Outlook Case High Economic Cas
Average Electricity Prices2000-2006
Figure 18
2000 2003 2006 2009 2012 2015 2018 2021
7
8
9
10
11
12
cent
s/kW
h
Low Economic Case Outlook Case High Economic Case
Average Electricity Prices2000-2021
Figure 19
Long term averageelectricity prices, depictedin Figure 19, are projectedto decrease in constant2000 dollars by 1.71% peryear in the Low EconomicCase, 1.36 % per year inthe Outlook Case, and1.42% in the HighEconomic Case.
FINDINGS AND CONCLUSIONS
• New York is a national leader in restructuring its electricity industry. More than15% of customer load has switched from local utility to new retail serviceproviders. Most switching in retail service providers has occurred in thecommercial and industrial sectors with considerable variability throughout theState. More progress in increasing customer choice can be expected, especiallywhen more supplies and demand reducing options become available.
28 Report of the New York State Energy Planning Board as mandated by Chapter 636 of the Laws of 1999.
3-121
• The initial years of wholesale electricity market operations in New York coincidedwith periods of high fuel prices, significant transmission congestion, and tightsupply conditions. Wholesale electricity prices reflected these conditions, but theyhave begun to moderate, although not in a uniform pattern, across the State. Wholesale electricity prices are forecast to decline in real terms, as are retail prices,over the planning period. This expectation is strongly conditioned on new demandand supply resources being added, especially at critical locations which will serveto reduce transmission congestion.
• Electricity peak demand is forecast to grow at annual average rates ranging from0.32% to 1.05%, with a mid-range value of 0.68%. The loss of load in New YorkCity resulting from the terrorist attack on the World Trade Center is not factoredinto the forecast. This load is expected to be restored gradually during rebuildingefforts and completely restored once rebuilding efforts are finished. Load isprojected to be fully restored sometime in the early half of the forecast period.
• Reserve margins, representing one measure of system reliability, are projected toexceed the current requirement of 18% throughout the planning period. A higherpeak demand growth rate than projected, however, will require more new resourcesthan are currently projected, especially in the later years of the planning period.
• In the near-term, additional simple-cycle gas turbines and demand reductionprograms will be used to address growth in peak electricity demand. Over thelonger-term, gas-fired combined-cycle base-load units will be added to the system. As of December 2001, five generating projects which total approximately 3,490MW have been approved under the Article X of the Public Service Law. Another19 projects are in the regulatory review process or have been publically announced.
• The State’s transmission system is generally adequate to provide reliable electricityservice, however, there are limitations in the use of the transmission system inmoving power between regions of the State for economic reasons. The siting ofnew generating facilities can reduce price impacts attributed to economiccongestion of the transmission system. This finding is consistent with the PlanningBoard’s recent “Report on the Reliability of New York’s Electric Transmission andDistribution Systems.”28 Some local transmission reinforcements might benecessary in the New York City and Long Island areas.
• A Northeast RTO offers possibilities for enhanced market efficiencies andeconomic benefits for most participants. The RTO structure may also offer avehicle for developing new transmission lines to increase power transfers acrossNew York’s borders. There are certain principles for RTO formation that should befollowed to ensure benefits are realized by New York consumers
3-122
• New York is projected to increase significantly the share of electricity generationfueled by natural gas. This trend is consistent with other regions of the Northeast. A major force behind this trend is the decisions of merchant generators to selectnatural gas as the preferred fuel of choice. The choice is also influenced byenvironmental factors that recognize the relatively clean air emission profile ofnatural gas generation. This shift in primary fuel requirements for electricity willresult in diminished diversity in the fuel requirements for electricity generation. Reduced fuel diversity increases risk exposure to fuel supply disruptions and priceswings.
• Air pollutant emissions from electricity generation in the State are forecast to decrease over the planning period. Increased use of natural gas for electricitygeneration, increased electricity trading among regional electric systems, and fullimplementation of the Governor’s Acid Deposition Initiative all serve to drive SO2emissions to levels that are one-half that mandated by the Federal Clean Air Act,and extend summertime NOX controls year-round.
1 The New York State breakdown of the volumes by sector: residential 35%; commercial/ industrial 30%; powergeneration 35%.2 The New York State breakdown by sector is: 4.2 million residential customers (including 1.7 millioncustomers who use gas only for cooking or water heating) and 0.4 million commercial/industrial/powergeneration customers. 3 Central Hudson Gas & Electric Corporation (CHG&E), Consolidated Edison Company of New York, Inc. andOrange & Rockland Utilities (Con Edison/O&R), Corning Natural Gas Company (Corning), KeySpan EnergyDelivery of New York and KeySpan Energy Delivery of Long Island (KeySpan), Niagara Mohawk PowerCorporation (Niagara Mohawk), New York State Electric and Gas Corporation (NYSE&G), Rochester Gas &Electric (RG&E), National Fuel Gas Distribution Company (NFGD), and St. Lawrence Gas Company (St.Lawrence).4 These pipelines are: Algonquin Gas Transmission Co. (AGT), Columbia Gas Transmission Corp.(Columbia),Dominion Transmission, Inc. (DTI), Empire State Pipeline Co. (Empire), Iroquois Gas Transmission System(IGTS), National Fuel Gas Supply Corp. (NFGS), North Country Pipeline, Tennessee Gas Pipeline Co.(Tennessee), Texas Eastern Pipeline Co. (TETCO), Transcontinental Gas Pipe Line Corp. (TRANSCO), andTransCanada Pipelines, Ltd. (TransCanada).5 Natural Gas Annual 1999, EIA, issued October 2000.
3-123
SECTION 3.5
NATURAL GAS ASSESSMENT
INTRODUCTION
New York State currently uses approximately 1,200 million dekatherms (MMDT) ofnatural gas per year, making it the fourth largest gas consuming state in the nation behindTexas, California, and Louisiana.1 The State has approximately 4.6 million natural gascustomers2 served by eleven local gas distribution companies (LDCs).3 These LDCsdepend on major interstate and intrastate pipeline systems for access to domestic andCanadian gas supplies.4 Domestic gas, primarily from the Gulf Coast area, accounts forapproximately 62% of the gas consumed in New York with nearly all of the remainderfrom Canadian sources.5 Gas production within New York is growing and currentlymeets about 2% of the State=s annual gas use.
Competitive forces have changed the gas industry dramatically and will likely continueto do so. As explained below, federal and State policies to enhance competition havebeen adopted and are being expanded.
Natural gas demand is expected to increase significantly, especially to generateelectricity. Plans to build about 15,000 MW of new gas fired generation have beenannounced in New York. These plants combined, would require about 2,500 thousanddekatherms of gas per day (MDT/D) if operated at full capacity. Current pipelinedelivery capacity to New York is roughly 6,000 MDT/D, and this capacity is needed tomeet existing core market (residential, commercial, and industrial) demand on a peak
6 Customer costs for LDC sales and transportation services are about $5 billion per year and payments to non-utility suppliers are roughly $2.5 billion per year.
3-124
winter day. In addition, the use of gas in core markets continues to grow, especially inthe downstate (New York City-Long Island) area. Additional pipeline capacity as well asexpansion of distribution system capacity will be needed to meet the anticipated increasein gas use. A number of projects have been proposed to expand pipeline capacity to NewYork State.
As explained below, gas prices increased to unprecedented levels during the 2000-2001winter due to a combination of factors and have since returned to more historic levels. However, gas prices will likely remain volatile.
Finally, the security of gas delivery facilities has not been a problem historically. However, in light of the September 11, 2001 terrorist attacks, Governor Pataki hascreated the Office of Public Security to assess the vulnerability of critical infrastructuresto terrorist attack and develop a comprehensive, Statewide anti-terrorism strategy. Concurrently, the Department of Public Service has established the Security AssessmentTeam to assess utility efforts to maintain system reliability and security.
NATURAL GAS COMPETITION
Status of the New York State Retail Market
Large-volume natural gas customers in New York have been able to choose from non-utility suppliers since the mid-1980s. In 1996, the Public Service Commission (PSC)extended the opportunity to purchase gas from non-utility suppliers to all customers. Asof April 2001, nearly 300,000 residential and smaller non-residential customers hadswitched to non-utility suppliers. These customers use approximately 90 MMDT ofnatural gas per year, or about 9.5% of the total volumes delivered to customers by theLDCs. Most large volume customers switched to a non-utility gas supplier years ago. Intotal about 50% of the gas consumed in New York is gas purchased from non-utilitysuppliers. There are about 25 active marketers in the downstate area, and about 15 inupstate New York. The retail gas market in New York is approximately a $7.5 billionper year market.6
Status of the Wholesale Natural Gas Market
Natural gas commodity prices have been completely deregulated for over ten years. TheNew York Mercantile Exchange (NYMEX) futures price is the benchmark price for
7 Generally defined as points where gas is readily available.8 Case 93-G-0932, Proceeding on Motion of the Commission to Address Issues Associated with theRestructuring of the Emerging Competitive Natural Gas Market; Case 97-G-1380 In the Matter of IssuesAssociated with the Future of the Natural Gas Industry Need and the Role of Local Gas DistributionCompanies, Policy Statement Concerning the Future of the Natural Gas Industry in New York State and OrderTerminating Capacity Assignment, (issued November 3, 1998).9 In this vision marketers would sell gas to customers and LDCs would deliver that gas to them.
3-125
natural gas nationwide, with futures contracts quoted at, and deliverable to, the HenryHub, in Katy, Louisiana. Several market area hubs or liquid trading points7 haveemerged, including Dawn, Ontario, the Columbia pool, and DTI Southpoint. Theestablishment of additional market area hubs/liquid trading points is critical to thedevelopment of a competitive wholesale natural gas market closer to market demand.
Policies to Enhance Competition
New York State. In 1998 the PSC issued a Policy Statement establishing its vision forthe future of the natural gas industry in New York.8 The essence of that vision is that themost effective way to establish a competitive retail market in gas supply is for LDCs tocease selling gas.9 The Policy Statement requires LDCs to hold new upstream pipelinecapacity contracts to the absolute minimum necessary for system operation and reliabilitypurposes and eliminates the LDCs right to assign its capacity to migrating customers,except where specific operational and reliability requirements warrant. This encouragesLDC’s to relinquish capacity as contracts expire to make it available for marketers. Atransition process consisting of three elements was established:
$ Discussions with each LDC on an individualized rate and restructuring plan;
$ Collaboration among stakeholders on the key generic issues of system reliabilityand market power; and
$ Coordination of issues that are also faced by electric utilities, including provider-of-last-resort and competition in areas such as metering, billing, and informationservices.
Multi-year rate and restructuring plans have been approved for Niagara Mohawk, RG&E,CHG&E, and O&R, and proposed for KeySpan. Discussions with Con Edison andNFGD are underway to achieve multi-year agreements. Generally, these plans freeze orreduce retail rates, establish back-out rates applicable when marketers replace certainLDC functions, establish or refine balancing services for marketers, incorporate gascapacity portfolio changes, and promote development of the competitive market throughcustomer information programs.
10 Due to the structure of its supply and capacity portfolio KeySpan was able to allow marketers to use non-primary capacity to meet a portion of their requirements.11 Case 97-G-1380, In the Matter of Issues Associated with the Future of the Natural Gas Industry Need and theRole of Local Gas Distribution Companies, (untitled Order dated July 27, 2001).
3-126
A Reliability Collaborative was established in December 1998 to implement the PolicyStatement=s goal of maintaining the reliability of gas deliveries. Based onrecommendations developed through this collaborative, the PSC requires marketersserving firm loads to have firm, primary delivery point capacity for the months ofNovember through March, with a limited exception for KeySpan.10 LDCs were alsorequired to develop Gas Transportation Operations Manuals to codify all procedures thatmarketers must follow. A Reliability Advisory Group has been established to continue toaddress both short- and longer-term reliability issues.
Upstate LDCs (NFG, NYSE&G, Niagara Mohawk, and RG&E) have been able torelinquish capacity on upstream pipelines as contracts expire, resulting in net capacitycost savings of about $55 million per year to New York gas customers. Downstate LDCs(KeySpan and Con Edison /O&R) relinquished a small amount of capacity to their city-gates when the contracts expired on November 1, 2000, in anticipation of retail marketersacquiring this capacity. However, a wholesale marketer affiliated with an electricgeneration company acquired that capacity. Wholesale marketers with power generationinterests recently acquired available capacity in the broader downstate market for periodsof up to ten years.
The downstate capacity market has become tight, and marketers that acquire capacity atmarket prices cannot compete with the LDCs weighted-average cost of capacity. Inresponse, the downstate LDCs have developed programs under which they will acquirethe resources needed to meet market requirements on a year-to-year basis and makecapacity available to marketers at their average cost of capacity over the next threeyears.11
Finally, the 2000-2001 winter led to a marketer bankruptcy and the withdrawal of amarketer from the residential market in Western New York. These failures were causedby cash flow problems associated with high gas costs and the lack of marketer action tomanage price risk. Most of the customers served by these marketers were returned to theLDC who was able to acquire the capacity needed to serve them.
Several issues common to gas and electric that impact the development of thecompetitive market are being addressed in a coordinated fashion. These issues includeprovider-of-last-resort, billing and metering, electronic data interface, uniform business
3-127
practices, and unbundling of costs. The Electricity Assessment contains a detaileddiscussion of these issues. Federal. In the mid-1990s the Federal Energy Regulatory Commission (FERC)eliminated the merchant role of interstate pipeline companies and transferredresponsibility for gas supply acquisitions to LDCs and customers. FERC issued Orders637 and 637-A in 2000, waiving price ceilings for short-term released capacity for a two-year period, permitting use of peak/off-peak and term differentiated rate structures,allowing capacity segmentation, revising scheduling procedures, narrowing the right offirst refusal and improving reporting requirements and penalty provisions. Thesechanges are intended to improve the efficiency of the interstate pipeline capacity market.
Pipeline companies were required to file Order 637 tariffs beginning in the fall of 2000,on a staggered basis. The DTI and Tennessee proposed tariffs have been approved byFERC. The tariffs of Transco, NFGS, and IGTS are presently pending before the FERC. Texas Gas, AGT, TETCO, and Columbia have filed compliance plans.
One of the common issues among the pipelines is the cash-out mechanism for customerimbalances. With new services and new information systems now available, there is lessreason for customers to remain out of balance between their daily nominations and dailytakes. Weekly rather than monthly cash-out of imbalances have been proposed by twopipelines.
The changing nature of the natural gas market has resulted in the development of newpipeline service offerings. One such development is the opportunity for shippers to makeintra-day nominations, providing more flexible use of pipeline capacity to meet changesin system demand. Another is the introduction of increased hourly delivery quantityflexibility, a service specifically designed for electric generators. Another example,which is being used in the retail access programs in New York, is the development byDTI of its Delivery Point Operator/Customer Swing Service. This essentially allowsmarketers access to no-notice services with the LDC acting as the delivery point operatorthereby administering a program to account for each marketer=s use of such services tomeet daily swings.
NATURAL GAS MARKET DEVELOPMENTS
Natural Gas Demand. Lower oil prices resulted in a decline in United States (U.S.) gasdemand in 1998. However, gas demand recovered somewhat in 1999 and increasedanother 5% in 2000, the result of a strong national economy and the increased use of gas
12 A TCF is equal to approximately 1,025 MMDT.13 Annual Energy Outlook 2001, Energy Information Administration, December 2000.
3-128
21
21.5
22
22.5
23
23.5
24
1995 1996 1997 1998 1999 2000
U.S. NATURAL GAS CONSUMPTION (TCF)
Figure 1
for power generation (see Figure 1). U.S. gas demand is expected to increasesignificantly to 31.6trillion cubic feet(TCF)12, a 38% increase,by 2015. 13
In New York, demandfor gas in core markets(residential, commercial,and industrial) continuesto grow, especially in thedownstate area where thesaturation of gas use isrelatively low and thereis a large potentialconversion market. Themost significant increasein gas use will be forpower generation as about 15,000 MW of new gas-fired generation capacity has beenproposed in New York. Of this amount, about 70% is proposed in the area fromRockland and Orange counties through Long Island. In addition, the Governor’s CleanAir Act Initiative, discussed in the Environment and Energy report in this Plan, willlikely result in increased use of gas for power generation. Finally, the use of gas mayincrease in two other markets: the distributed generation market and the use ofcompressed natural gas (CNG) as a transportation fuel. The increased use of gas in thesemarkets could require improvements to gas distribution systems.
Natural Gas Commodity Prices
Natural gas commodity prices soared to unprecedented levels during the 2000-2001winter. Several factors contributed to this increase. A sustained period of relatively lowgas prices in the 1990’s led to a substantial reduction in gas drilling, constrainingdomestic productive capacity. This set the stage for the price increase, but two factorsthat suppressed gas demand concealed the significance of the problem. First, low oilprices in 1998 and 1999 reduced gas demand through fuel switching to oil. Second, priorto last winter there were three warm winters in a row, masking the underlying level ofgas demand. U.S. natural gas consumption declined by 3% in 1998, grew by 2% in 1999,
14 Case 97-G-0600, In the Matter of the Commission’s Request for Gas Distribution Companies to ReduceGas Cost Volatility and Provide for Alternative Gas Purchasing Mechanisms, Statement of PolicyRegarding Gas Purchasing Practices, (issued April 28, 1998).
3-129
0
2
4
6
8
1 0
1 2
Jan-99
Apr -99
Ju l-99
Oct-9
9
Jan-00
Apr -00
Ju l-00
Oct-0
0
Jan-01
Apr -01
Ju l-01
NYMEX AVERAGE BID WEEK PRICES ($/DT)
Figure 2
and grew by another 5% in 2000, as a result of a strong national economy, rising oilprices, and increased use of gas to generate electricity. In the spring of 2000, prices werestill at a level of about $2.50-$3.00/DT. However, the summer of 2000 was unusuallywarm in the Southwest where substantial air conditioning load is met through gas-firedgeneration. Gas prices started rising steadily in response to the increased summer gasdemand and the competing need to fill gas storage. By the beginning of the 2000-2001heating season, prices were already at record high levels and storage inventories werestill relatively low. The sustained cold weather in November and December 2000 (the 2nd
and 7th coldest ever recorded, respectively) in combination with market nervousness dueto low gas storage levels, caused gas prices to increase dramatically, to nearly $10/DT. The balance of the 2000-2001 winter was mild,drilling for gas increasedin response to higher gasprices, the nationaleconomy slowed, andstorage has been refilledat record levels. As aresult, gas prices havereturned to more familiarlevels (see Figure 2). However, gas prices willlikely remain volatile.
In 1998, the PSC issueda Policy Statement onLDC gas purchasingpractices.14 While the PSC did not direct any particular mix of portfolio options, it statedthat volatility of customer bills is one criterion along with other factors such as cost andreliability, that LDCs should consider in their gas supply portfolio strategies. The PSCstated that excessive reliance on any one gas pricing mechanism or strategy does notappear to reflect the best management of the gas portfolio and any LDC without adiversified gas pricing strategy will have to meet a heavy burden to demonstrate that itsapproach is reasonable.
15 Proven natural gas reserves are those which analysis of geologic and engineering data demonstrates withreasonable certainty to be recoverable from known reservoirs, under existing economic and operatingconditions.16 Potential resources include all the undiscovered gas resources plus that part of the discovered resourcethat is not included in proven reserves.
3-130
18
18 .2
18 .4
18 .6
18 .8
19
19 .2
1 9 95 1 9 96 1 9 97 1 9 98 1 9 99 2 0 00
U.S. GAS PRODUCTION (TCF)
Figure 3
Natural Gas Supplies
Domestic Gas. U.S. gas production in 2000 was 19.1 trillion cubic feet (TCF), a 2.4%increase over 1999. However, production in 1999 was the lowest since 1995 (see Figure3), the result of severalyears of relatively lowgas and oil prices.
Weakening gas pricesin the late 1990’s led toa reduction in gasdrilling activity from657 rigs in December1997 to 362 rigs inApril 1999. Gas rigactivity began toreverse its downwardtrend during 1999,reaching 854 rigs byDecember 2000, and1050 rigs in June 2001(see Figure 4). Thisgrowth in gas rig activity is correlated with the increase in gas prices.
Proven natural gas reserves15 for the lower 48 states totaled 172 TCF at the end of 1999. The amount of proven reserves has held fairly steady at about this level for the last tenyears as cumulative production of 187 TCF over the last decade was offset by reserveadditions. Potential gas reserves16 are currently estimated at 1,206 TCF for the lower 48states.
In addition, Alaska has 10 TCF of proven reserves and 34 TCF of potential reserves fromconventional sources. Further, Alaska has about 210 TCF of reserves fromunconventional sources, such as oil shale and coal-bed seams.
17 Source: Natural Gas Annual 1999, EIA (issued October 2000).18 Canadian Natural Gas: Review of 1999 & Outlook to 2010, May 2000
3-131
0
200
400
600
800
1000
1200
Jan-99
Apr-99
Jul-99
Oct-9
9
Jan-00
Apr-00
Jul-00
Oct-0
0
Jan-01
Apr-01
Jul-01
GAS ROTARY RIGS IN OPERATION
Figure 4Two pipeline routealternatives are beingconsidered to bringAlaskan gas to the lower48 states. The“southern” route wouldparallel the Trans-Alaskaoil pipeline and thenfollow a route parallel tothe Alaskan Highwaythrough the YukonTerritory and BritishColumbia, to connectwith existing pipelines inAlberta. This alternativewould be about 2000miles long and cost about$10 billion. The “northern” route would extend east from the Alaskan North Slope toCanada’s Mackenzie River delta where it would access additional gas supplies, and thensouth along the Mackenzie valley into Alberta. This alternative would be about 1,650miles in length and cost about $8 billion. Canadian Gas. Imports of Canadian gas historically have been from Canada’s WesternSedimentary Basin. On December 31, 1999 Canadian gas imports began from offshoreNova Scotia (Scotian Shelf area) through the Maritimes & Northeast Pipeline (M&NE). Canadian imports into the U.S. totaled 3.5 TCF during 2000, an increase of about 5%over 1999.
Imports of Canadian gas have increased steadily since 1995. The U.S. imported roughly15% of its total requirements from Canada during 2000. In New York, about 38% of thegas volumes coming into the State originate in Canada,17 however, some of this gascontinues on to New England.
Western Canadian Sedimentary Basin proven reserves totaled 63.9 TCF as of January 1,2000. The Scotian Shelf area contains 3 TCF of established reserves (proven reservesthat are connected to pipelines), 2 TCF of discovered resources (proven by drilling butnot yet connected to pipelines), and 13 TCF of undiscovered potential reserves.18
19 Trinidad supplied 96 BCF of LNG, or 44% of total LNG imports in 2000 and Qatar supplied 46 BCF ofLNG or 21 percent. Algeria continued to be a major supplier of LNG accounting for 44 BCF or 20% of allLNG imports.20 Almost 81% of the imports received in Everett came from Trinidad, primarily under long-termarrangements. The Lake Charles facility received 124 BCF, an increase of almost 85% over 1999.
3-132
������������������
������������������
������������������������������������
������������������������������������
������������������������������������
���������������������������
��������� ��������� ���������������������������
0
50
100
150
200
250
1995 1996 1997 1998 1999 2000����
Algeria����
Australia�����
NigeriaQ atar Trinidad UAE
LNG IMPORTS (MMDT)
Figure 5
LNG. Liquefied natural gas (LNG) imports have risen dramatically over the last severalyears (see Figure 5). After nearly doubling in 1999, LNG imports continued their growthin 2000 to a total of 223 MMDT, a 35% increase over 1999. Trinidad and Tobago andQatar surpassed Algeria for the first time as suppliers of LNG to the U.S. in 2000.19 There are twooperational LNGreceiving terminals inthe U.S. located atEverett, MA, and LakeCharles, LA. Importsinto Everett totaled 99MMDT in 2000, anincrease of 3% over1999.20 Following theterrorist attacks ofSeptember 11, 2001, theU.S. Coast Guardbanned LNG deliveriesto Everett, MA, but hassince lifted the ban. Expansion of LNG imports is expected in the future. TRANSCO has filed an applicationwith the FERC to reactivate import capability at its Cove Point, MD, LNG facility by2002, which has not received any imports since 1980. The Elba Island terminal nearSavannah, GA has received FERC approval to resume LNG imports and is expected tobegin receiving shipments in 2002. In addition, about a dozen other LNG projects havebeen announced. Several are proposed in Texas, and would use either existing pipelinesor build new ones to deliver re-gasified LNG for electricity generation customers. On theEast Coast, expansion of the Everett, MA facility is planned to fuel a new 1,550 MWpower plant currently being built nearby. A new plant is planned for Radio Island, NC toserve markets that are too distant from large pipelines.
In New York, LNG plays a critical role in meeting peak winter requirements. Instead ofimports, this use of LNG involves liquefying pipeline gas during the summer, storing that
21 The 1998 Report on Issues Regarding the Existing New York Liquefied Natural Gas Moratorium, by theState Energy Planning Board, led to legislation that lifted the then-existing moratorium on siting new LNGfacilities, except in New York City. 22 From 1995 to 2000, 75 wells were drilled to explore for and develop Black River gas reserves. Drillingon 22 of these wells were began in 2000. By August 1, 2001, 35 applications had been received for BlackRiver wells, a 46% increase over the number of applications received by the same time in 2000.
3-133
LNG in insulated tanks, and re-gasifying it to meet peak day requirements.21
New York State Resources
The first natural gas well in the U.S. was drilled in Fredonia, NY in 1821. Historically,most wells in New York were drilled to sandstone formations at depths of 1,000 to 4,500feet, and produced relatively small amounts of gas (up to 100 DT/D) for many years. Today there are approximately 6,600 gas wells in New York that produce a total of about18.5 MMDT.
Over the last three years, exploration and development of the Trenton and Black RiverGroup has intensified. This is a prolific and deep play (7,000 to 11,000 feet), with somewells producing as much as 10,000 DT/D. It has been under development in Canada andother states for some time. During 2000, natural gas was produced from the Trenton andBlack River in Steuben and Chemung Counties. Production from 23 such wells totaled5.3 MMDT, or about 30% of total Statewide natural gas production of about 18.5 MMDT(from less than 1% of the total number of wells). The New York State Department ofEnvironmental Conservation staff expects that between five and ten additional wells willbe placed into production during 2001, and that production from just the Trenton andBlack River Group may reach 12 MMDT or more. Drilling is most active in the southernFinger Lakes area of Steuben, Schuyler, and Chemung Counties, but wells have beendrilled as far west as Cattaraugus County and as far east as Cortland County.22
In an effort to expand natural gas production in New York, the New York State EnergyResearch Development Authority (NYSERDA) is working with exploration companiesto improve the identification of carbonate reservoirs and increase the geographicdistribution of production. Along with the Trenton and Black River groups, othercarbonates under investigation include the Beekmantown Group and the OnondagaFormation. NYSERDA is also researching improved detection mechanisms to reduce thedry hole ratio. Some NYSERDA projects are located in areas that currently have little orno production, such as the Tug Hill Plateau and Otsego County.
3-134
MERGERS AND ACQUISITIONS
New York LDCs
Mergers and acquisitions continue to reshape the way in which LDC services areprovided. KeySpan Corporation acquired three New England gas utilities (Boston Gas,Colonial Gas, and Essex County Gas); Con Edison acquired Orange and RocklandUtilities; and Energy East (the parent of NYSE&G) acquired Berkshire Gas, aMassachusetts gas utility, Connecticut National Gas Corporation and SouthernConnecticut Gas Company, established the Maine Natural Gas Company. A mergerbetween Niagara Mohawk and National Grid Corporation has been approved and EnergyEast’s acquisition of RGS Energy Group, Inc., the parent of RG&E, is pending.
Interstate Pipelines
Three major mergers have been completed involving interstate pipeline companies thatserve New York. Dominion Resources (an electric utility based in Virginia) acquiredCNG Transmission Corporation and it became Dominion Transmission, Inc. (DTI). Columbia Gas Transmission was acquired by NiSource a Merrillville, IN-based holdingcompany. Finally, El Paso Corp., owner of Tennessee, acquired the Coastal Corporation.El Paso now owns and operates the largest pipeline system in the country, extendingfrom California to Texas, and from Texas to Massachusetts and Illinois. Finally, DukeEnergy recently announced that it is acquiring Westcoast Energy. Duke is a diversifiedenergy company headquatered in Charlotte, NC, and is parent of TETCO and AGT aswell as part owner of the M&NE Pipeline. Westcoast is a leading Canadian natural gascompany based in Vancouver, BC and is parent of Union Gas, Empire State Pipeline, theWestcoast Pipeline (which serves CA), as well as part owner of M&NE.
Analysis of Natural Gas Market Developments
Competition for available capacity is developing between the core market and theelectricity generation market. The use of gas to generate electricity has increased,because of the increased demand for electricity. Further, there is an expectation that theuse of gas for electricity generation will increase significantly as a result of theavailability of 15,000 MW of proposed new gas-fired generation facilities.
Retail marketers to-date have not acquired the capacity necessary to serve theircustomers. Many factors have contributed to this situation such as the tightness in thecapacity market, commodity cost volatility, and access to competitively priced capacity.
23 The sponsors of Alliance are Fort Chicago Energy Partners 26%, Westcoast 23.6%, Enbridge 21.4%,Williams 14.6%, and Coastal 14.4%.24 The sponsors of Vector are Enbridge, Westcoast, and the MCN Energy Group.
3-135
It is not clear whether retail marketers will ever be willing to make capacitycommitments or whether the role of holding capacity will be filled by wholesalemarketers. Meanwhile, wholesale marketers have begun to acquire capacity, ostensiblyto serve the power generation market. Thus, electric market developments are increasingcompetition for available pipeline capacity and changing the dynamics of the gascapacity market.
INFRASTRUCTURE ISSUES
Current Interstate Pipeline Delivery Capacity
Interest in expanding interstate pipeline delivery capacity to New York and the Northeastcontinues to be strong. Three major projects have recently been completed to increasedelivery of Canadian gas to the Chicago market area. The new Alliance Pipeline,23 whichextends 1,860 miles from Alberta, Canada to the Chicago, IL area, began service onDecember 1, 2000, and has a capacity of 1,325 MDT/D. The new Vector Pipeline,24
which extends from Chicago to Dawn, Ontario, also began service on December 1, 2000,with an initial capacity of 700 MDT/D. The existing Northern Border Pipeline wasextended from Harper, IA to Manhattan, IL and its delivery capacity increased by 700MDT/D beginning in December 1998. In the East, the Maritimes & Northeast Pipeline(M&NE), which extends from Sable Island, through Nova Scotia and New Brunswick,Maine and New Hampshire to the Boston, MA area, began service at the end of 1999. Ithas delivery capacity of 440 MDT/D, and "back feeds" the existing gas delivery systemsserving the Northeast with a new competitively priced and sizable gas supply. Several ofthe projects proposed to serve the Northeast would expand access to these Canadian gassupplies.
Approved Projects
The FERC has approved the following projects to increase capacity to New York and theNortheast:
MarketLink Phase I & II. Will expand capacity of the existing TRANSCO Leidy line,which extends from storage facilities in Leidy, PA to the New York City market, in twophases. Phase I will increase capacity by 166 MMCFD to New York City by November1, 2001. Phase II will increase capacity by 130 MMCFD to New Jersey and
25 The addition of pipeline segments parallel to an existing pipeline to increase its capacity. 26 The sponsors of Independence are ANR Pipeline Co., TRANSCO and National Fuel Gas Supply Corp. 27 The sponsor of this storage project and the pipeline lateral is Central NY Oil & Gas Company. 28 ECORP a marketing affiliate of Central NY Oil & Gas.
3-136
Pennsylvania by November 1, 2002. These expansions will be accomplished throughpipeline looping25 and added compression within the existing pipeline right-of-way. MarketLink was proposed as the final link to bring Western Canadian and Midwesterngas supplies to the East Coast. The Independence Pipeline in combination with anupgrade of the ANR Pipeline (described below) would link MarketLink with the Chicagomarket area.
Independence Pipeline. A proposed 36-inch diameter pipeline that would extend 370miles from Defiance, OH to TRANSCO's facilities at Leidy, PA, and have a capacity of916 MDT/D.26 Independence has a proposed in-service date of summer 2003. ANRPipeline’s SupplyLink Project will expand its existing ANR pipeline between Sandwich,IL and Defiance, OH by 750 MDT/D through a combination of added compression andlooping to feed the Independence Project with a targeted in-service date of summer 2003. FERC has approved both of these projects, subject to certain conditions.
Stagecoach. This project involves development of new 12 MMDT storage facility inTioga, NY and Bradford, PA.27 In addition, Tennessee would construct a new a 23.7mile, 30 inch diameter pipeline connecting this storage field to its “300 line” in PA and anew 4.7 mile, 12-inch diameter lateral would be built from this storage facility to theproposed Twin-Tier power plant in Owego, NY. Tennessee’s new pipeline has a plannedin-service date of December 2001. The storage facility would have withdrawal rates ofup to 500 MDT/D and injection rates of up to 250 MDT/D. Tennessee would alsoexpand capacity on that line to NJ by 100 MDT/D with a planned in-service date ofDecember 2001. One company28 has contracted for 400 MDT/D of capacity on thelateral (out of 500 MDT/D) and 90 MDT/D (out of 100 MDT/D) on Tennessee’s “300line” for 10 years.
Hanover Compressor. AGT and TETCO filed a joint application that would increasethe ability of TETCO to deliver gas to New York City by 135 MDT/D. This would beaccomplished by adding compression to AGT’s existing compressor station in Hanover,NJ, allowing TETCO to shift some of its existing deliveries to AGT from theLambertville, NJ interconnect. FERC approved this project on July 26, 2001; theexpected in-service date is November 1, 2001.
29 This project is a replacement for the previously proposed phase III of MarketLink which was rejected byFERC because TRANSCO failed to secure precedent agreements with customers for the total volumesproposed for this phase of the project.30 Millennium is sponsored by Columbia Gas, TransCanada, Westcoast and MCN Energy Group.
3-137
Leidy East. The Leidy East project involves looping and added compression in PA andNJ to expand the capacity of TRANSCO’s Leidy line by 130 MMCFD.29 Construction isscheduled to begin in April 2002 and the proposed in-service date is November 2002.
Dracut Expansion. Tennessee’s Dracut Expansion Project will increase its ability tomove gas from Dracut, MA to the west by 200 MDT/D. The project involves replacing12 miles of 16-inch diameter pipe with 24-inch diameter pipeline. This project was filedat FERC in May 2001, and has an expected in-service date of fall 2002.
Proposed Projects
Several pipeline projects had been proposed for completion in the 2000-2002 timeframe,but delays in the review and approval process have pushed the startup dates back. Sincesome of these projects compete with each other, it is likely that not all of these pipelineswill be built.
The Millennium Pipeline30. A proposed new 36-inch pipeline that would extend 424miles from a new interconnection with TransCanada Pipelines in Lake Erie to atermination point in Mt. Vernon, NY where it would interconnect with Con Edisonfacilities. Most of the route would follow the existing Columbia right-of-way. Millennium would provide access to Canadian gas and the Chicago market area throughUnion Gas as well as access to storage in Michigan and Ontario. The capacity ofMillennium would be 700 MDT/D, of which 350 MDT/D would be for the New YorkCity area. This project has been filed at FERC and a supplemental draft environmentalimpact statement has been issued by FERC for the project. Sponsors of the Canadianportion of the project recently withdrew their applications filed at the Canadian NationalEnergy Board (NEB). They attribute this action to delays in receiving U.S. regulatoryapprovals for Millennium and pledge continuing support to the project and say that theyintend to re-apply for NEB approval at an appropriate time. At this point, the proposedNovember 2002 in-service date is no longer feasible.
Iroquois’ Eastchester Expansion. Involves construction of 32 miles of 24-inch pipefrom the existing Iroquois mainline at Northport, Long Island to the Bronx, New Yorkwhere it will interconnect with the Con Edison system. This project will increasecapacity by 230 MDT/D, primarily for electric generation customers, with an expectedin-service date of November 2002. Iroquois received FERC's preliminary approval on
31 The Islander East Project is sponsored by Duke Energy (50%) and KeySpan (50%).32 The sponsor of this project is Tennessee.
3-138
non-environmental matters in June 2001. FERC has also issued a draft EnvironmentalImpact Statement for the project. Iroquois’ will have to build new compressor stations inBoonville and Dover, NY, and modify the existing Croghan, Wright, and Athens, NYcompression stations to support the proposed deliveries through Eastchester.
Islander East Project31. One of three projects proposed to connect existing interstatepipelines to basically the same point on eastern Long Island. Islander East would consistof approximately 45 miles of new 24-inch diameter pipe from a point near Cheshire, CT,where it will interconnect with the existing AGT mainline, across the Long Island Soundto the town of Brookhaven, NY. Islander East will have an initial capacity of 285MDT/D. The project has been filed at FERC with a proposed in-service date ofNovember 2003.
Connecticut-Long Island Lateral Project. Would consist of approximately 50 miles ofnew pipeline connecting the existing Tennessee pipeline near Agawam, MA, to LongIsland.32 This project has been announced but not yet filed at FERC. The proposed in-service date is November 2003 and the proposed capacity is 450 MDT/D.
Iroquois’ Shoreham Lateral. Would consist of approximately 20 miles of submarinepipe under Long Island Sound from Iroquois’ existing mainline in Milford, CT, toShoreham, Long Island. The proposed capacity is 175 MMCFD and the proposed in-service date is November 2003. The project has been announced but not yet filed atFERC.
Texas Eastern Incremental Market Expansion. TETCO has held an open-season forincreasing its system capacity to the Mid-Atlantic and Northeast markets by as much as300 MDT/D.
Maritimes & Northeast Expansion, Extension and Hubline. Three projects areplanned to increase capacity to deliver Scotian Shelf gas to the Northeast. A 400-MDT/D expansion of the capacity of the existing M&NE pipeline has been proposed forservice in the 2004, but not yet filed at FERC. In addition, M&NE has filed with FERCto construct a new 25 mile pipeline extending M&NE from Methuen to Beverly, MAwith a proposed in-service date of November 2002. This line would interconnect withAGT’s proposed HubLine pipeline, a new 29 mile, 24-inch diameter pipeline extendingfrom Beverly, MA across Boston Harbor to an onshore interconnection with AGT’sexisting facilities in Weymouth, MA. Hubline’s proposed capacity is 300 MDT/D. The
33 The sponsors are TransCanada Pipelines and National Fuel Gas Company.
3-139
project has been filed at FERC with a proposed in-service date of November 2002.
Cove Point Maryland LNG. TRANSCO has filed with FERC to reactivate the importcapability of its Cove Point, MD, LNG facility and expand its storage tank capacity by850,000 barrels (BBLs). Cove Point was originally built with an import terminal, whichwas last used in 1980 and has since been dismantled. The proposed in-service date isApril 2002, with initial tanker delivery capability of 750 MDT/D. The terminal willcontinue to provide 3, 5, and 10-day peaking services under existing tariffs.
ConneXion Project. Tennessee’s ConneXion project involves expanding storagecapacity in Pennsylvania and expanding its delivery capacity from those storage areas toNew York City by about 500 MDT/D. Tennessee plans to file an application at FERC inthe fall/winter of 2002 and expects the facilities to be in-service by November 2004.
Northwinds Pipeline. Would be a new 215 mile, 30-inch pipeline extending fromKirkwell, Ontario, cross the U.S. near Buffalo, NY and follow a southerly route to theEllisburg-Leidy storage area in Pennsylvania. 33 It would have an initial capacity of 500MDT/D and provide shippers access to the Dawn, Ontario hub and storage facilities. Northwinds plans to file for regulatory approvals in the spring of 2002, with a target in-service date of late 2004.
Blue Atlantic Project. El Paso Corporation has announced plans for a new 750+ mile,36-inch pipeline from offshore Nova Scotia to Long Island. It would have an initialcapacity of 1000 MDT/D and is estimated to cost between $1.6 billion and $1.8 billion. El Paso anticipated filing for approvals in late 2002, with a targeted in-service date oflate 2005.
LDC Distribution System Capacity
Distribution system improvements will be needed to serve the power generation marketas well as expanded core markets. Since several of the proposed power generationprojects would be located in and around the Con Edison gas service territory, thecompany has an ongoing effort to work with project sponsors to identify their needs andto determine what distribution system improvements will be needed.
Further, the LDC system infrastructure is aging and to ensure safe operations there is aneed to continue priority replacement programs on portions of the distribution system aswell as to verify LDC transmission system integrity. The LDCs and Department of
3-140
Public Service (DPS) staff have been engaged in a collaborative effort to address theintegrity of transmission systems. That effort involves the development of a riskassessment model to calculate and prioritize the relative risk of transmission pipelinesegments and to work to reduce the highest risks to the pipelines. Both LDCs andoperators of interstate pipelines, which deliver gas to the State, will need to verifytransmission line integrity. Coordination of integrity verification efforts by both LDCsand interstate pipelines will be needed to prevent adverse impacts on continuous gasdeliveries. The federal Department of Transportation is expected to issue a notice ofproposed rulemaking on pipeline integrity for gas operators by the end of 2001. There isa need for continued research and development (R&D) activities to develop new methodsof verifying transmission system integrity as well as to develop cost-effective techniquesto maintain and upgrade the existing distribution system. Infrastructure Security
Interstate pipelines are periodically patrolled by helicopter, and routinely inspected andmaintained. Major gas facilities, such as gas processing plants, LNG plants, andcompressor stations are fenced and typically guarded. The security of gas deliveryfacilities has not been a problem historically. However, in light of the September 11,2001 terrorist attacks, Governor Pataki created the Office of Public Security to assess thevulnerability of critical infrastructures to terrorist attack and to develop a comprehensiveStatewide anti-terrorism strategy. Concurrently, the Department of Public Service hasestablished the Security Assessment Team to assess utility efforts to maintain systemreliability and security.
Analysis of Infrastructure Issues
It is clear that additional capacity will be needed to meet anticipated increases in naturalgas demand in the State. However, because of uncertainties regarding the timing of newmerchant power plants and their impact on the operation of existing gas-fired generators,the extent and timing of that need are less clear. Further, some of the proposed projectsto expand pipeline capacity have contracts with specific customers and are far along inthe regulatory review process, while other projects are at an early stage in theirdevelopment. Most of the more advanced pipeline projects target the area fromRockland and Orange counties to Long Island where some 11,000 MW of newgeneration capacity have been proposed. If all of these generation projects were built andoperated at full capacity on an incremental basis (not a likely scenario) they wouldrequire about 1850 MDT/D of gas. An illustration of the impact of completion ofproposed pipeline projects to serve this market is shown in Figure 6. As can be seen, if
3-141
Impact On Total Downstate Capacity
0
1000
2000
3000
4000
2000-01 2001-02 2002-03 2003-04
Current Capacity MarketLink I Hanover CompressorEastchester Leidy East MillenniumLI Lateral
Figure 6
Projected Total NYS Gas Demand (MMDT)
1000
1200
1400
1600
1800
2000
2200
2000 2005 2010 2015 2020
Low Outlook High
Figure 7
all of these projects arecompleted, capacity todeliver gas willincrease by about 1080MDT/D. FUTURE NATURALGAS DEMAND,SUPPLY, ANDPRICE
Approach
Future natural gasdemand, supply, andprice are especiallydifficult to project dueto the dynamic changes taking place in the gas and electric industries and rapidlychanging market conditions. These forecasts were developed from the 2001 AnnualEnergy Outlook projections prepared by the federal Energy Information Administration(EIA). Considering the market uncertainties, a range of possibilities was examined.
Natural Gas Demand
On a Statewide basis,the projected range ofoverall demand growthis expected to be 2.3%per year in the lowcase, to 2.66% per yearin the high case, withthe Outlook Case at2.7% per year, asshown in Figure 7. Figure 8, shows thebreakdown by sector ofthe Outlook Casedemand projection.
34 It should be noted that these forecasts are for annual requirements and peak-day requirements (whichdetermine capacity requirements) are expected to increase at a faster rate.
3-142
NYS Outlook Case Natural Gas Demand (MMDT)
0
500
1000
1500
2000
2500
2000 2005 2010 2015 2020
Residential CommercialIndustrial Electric Generation
Figure 8
Projected NYS Core Market Gas Demand (MMDT)
500
600
700
800
900
1000
2000 2005 2010 2015 2020
Low Outlook High
Figure 9
On a Statewide basis,the projected range ofcore market demandgrowth is expected tobe 0.6% year in the lowcase, to 1.0% per yearin the High Case, withthe Outlook Case at0.8% per year, asshown in Figure 9.34
The largest increase ingas use in New York isexpected to be forpower generation.However, thisexpectation is subjectto the greatest uncertainty because there is no way of knowing precisely how many newpower plants will be built, how and when they will operate, and how their operation willimpact the operation ofexisting generationstations.
NYSERDA-NYISOhas initiated a study tobetter define powergeneration gasrequirements. Thestudy will also assesspower generationsector use of petroleumand thus provideinformation on fueldiversity in this sector. In addition, the studywill assess the
3-143
Incremental Gas Use for Power Generation 2005 (MDT/D)
-100
0
100
200
300
400
500
600
Summer Winter
No New Generators Base Case M ore New Units
Figure 10
adequacy of natural gas delivery capacity in light of these requirements and explorecontingency issues associated with increased interdependence between gas andelectricity.
During the initial phase of the study, simulation modeling of the electricity system wasused to quantify the potential change in the demand for gas to generate electricitybetween the year 2002 and the year 2005 under various scenarios. This change ismeasured between what the existing generating system would use in the year 2002 andhow much gas would be used under several cases for new capacity additions. In the basecase, new generation capacity additions are assumed to be limited to approved projects and a generic 600 MW of capacity to represent likely additions on Long Island. Inanother case, new generation capacity additions are assumed to include all approvedprojects and all projects with completed Article X applications. These cases provide anindication of the amount of gas required for electricity generation assuming norestrictions on gas availability. All cases were examined for both a summer and a winterpeak day.
As shown in Figure 10,on a summer peak daygas demand is expectedto increase by 546MDT/D in the basecase between 2002 and2005. However, whennearly 3861 MW moreof new plants areadded (the more plantscase), the increase ingas is actually less at331 MDT/D. This isbecause these new,efficient plantsdisplace older lessefficient plants and canuse the gas that they would have used to generate more electricity to meet electricitydemand. When no new plants are added the increase in gas use is smaller at 153MDT/D. On a winter peak day, gas demand is expected to increase by 413 MDT/D inthe base case, by 585 MDT/D when more generation plants are added, and is nearlyidentical to the base case when gas availability is restricted. When no new plants are
3-144
Projected NYS Electric Generation Market Gas Demand (MMDT)
0
200
400
600
800
1000
1200
2000 2005 2010 2015 2020
Low Outlook High
Figure 11
Projected U.S. Natural Gas Wellhead Prices (2000$/DT)
0
1
2
3
4
5
2000 2005 2010 2015 2020
Low Outlook High
Figure 12
added gas demand isexpected to decrease by6 MDT/D. Final resultsfrom this study areexpected in the earlysummer of 2002.
In this plan, over thelong-term on aStatewide basis, theprojected range ofpower generationdemand growth isexpected to be 4.5% peryear in the Low Case,to 5.1% per year in theHigh Case, with theOutlook Case at 5.1%per year, as shown in Figure 11.
Natural Gas Price
It is especially difficultto project futurenatural gas prices dueto uncertainties andrapid changes innatural gas markets. Early in the year 2000,no industry analystspredicted that gasprices would reachanywhere near $10/DTduring the 2000-2001winter. Similarly, noone predicted that gasprices would fall below $2.50/DT before the2001-02 winter. Further, long-term price projections are not intended to and do not
3-145
Projected NYS Residential Gas Prices ($2000/DT)
0
2
4
6
8
10
12
2000 2005 2010 2015 2020
Low Outlook High
Figure 13
Projected NYS Commercial Gas Prices ($2000/DT)
0
2
4
6
8
10
2000 2005 2010 2015 2020
Low Outlook High
Figure 14
reflect short-term pricevariations observed inthe market. However,such price volatilitywill likely be apermanent feature ofthe competitive gasmarket. EIA projections showOutlook Case naturalgas wellhead pricestrending down and thengradually increasing(see Figure 12). Retailcore market prices areexpected to decreaseslightly in real terms over the forecast period. This is because, in addition to anticipateddecreases in commodity cost, there are also anticipated reductions in transmission anddistribution system costs. Figures 13, 14, and 15 show the range of core market pricesfor the residential,commercial andindustrial sectors,respectively.
Retail prices of gas forpower generation arealso expected todecrease slightly andthen increase slightly,essentially remainingflat over the forecastperiod. Figure 16shows the range of gasprices for the powergeneration sector.
3-146
Projected NYS Industrial Gas Prices ($2000/DT)
0
2
4
6
8
10
2000 2005 2010 2015 2020
Low Outlook High
Figure 15
Projected NYS Power Generation Gas Prices ($2000/DT)
0
2
4
6
8
10
2000 2005 2010 2015 2020
Low Outlook High
Figure 16
Natural Gas Supplies
According to EIA’sprojections, there willbe adequate supplies ofnatural gas at allforecast levels ofdemand and price. Thelargest increase insupply will come fromdomestic sources alongwith increaseddependence onCanadian gas, andLNG imports. NewYork State gasproduction will likelyincrease significantly. However, since demand is expected to grow significantly, the portion of the State’s needsmet with indigenous gas is not likely to change much.
3-147
FINDINGS AND CONCLUSIONS
• The demand for natural gas is expected to expand significantly over the planningperiod, particularly in the near-term, with the greatest increase in the use of gasfor power generation.
• More pipeline capacity will be needed to meet the increased demand for natural
gas. Interest in expanding interstate pipeline delivery capacity to the Northeastand New York State continues to be strong. The LDC systems will also have tobe expanded to meet these increased needs.
• The Federal Energy Regulatory Commission (FERC) recently approved fivenatural gas pipeline projects to serve the Northeast; and another 13 projects havebeen proposed.
• Natural gas prices will decrease slightly in real dollars over the long-term and arelikely to remain somewhat volatile.
• There is a general need to continue LDC system integrity and safety programs aswell as to continue research and development efforts to develop cost savingstechniques to maintain and upgrade the existing distribution system.
3-148
SECTION 3.6
PETROLEUM RESOURCE ASSESSMENT
INTRODUCTION
New York State is a major consumer of petroleum fuels such as motor gasoline, homeheating oil, diesel fuel, propane, and residual oil. The State is the fourth largestpetroleum fuel market in the U.S., exceeded only by Texas, California, and Florida. In2000, total Statewide expenditures on all petroleum fuels by all economic sectors equaled$16.3 billion. The transportation sector accounted for $12.3 billion, or 75% of the total. To meet this demand, numerous multi-national, national, and independent companiessupply refined petroleum products to the State through an extensive distribution system. The Port of New York, with large petroleum storage terminals located on both the NewYork and New Jersey sides of the port, is an important component of this system. Thesedeep water terminals receive a steady flow of refined petroleum products and crude oilinto the New York area from domestic and foreign sources. Crude oil is used byrefineries located in the mid-Atlantic region to produce refined products for theNortheastern U.S. Once refined fuels arrive at these facilities, they are distributed bybarge and truck transport to smaller coastal and inland terminals for further redistributionto customers. New York State also receives petroleum products from several pipelinesystems that connect terminals located throughout the State to the major refining centerslocated along the Gulf and East Coasts.
PETROLEUM SUPPLY OVERVIEW
Crude Oil Reserves
Geographic location is as important a consideration as the quantity and quality of crudeoil. The amount of proven world crude oil reserves varies annually with new discoveriesand improved extraction techniques. In recent years, world crude oil reserves haveremained relatively stable as new discoveries have effectively offset depletion of existingreserves. Between 1997 and 2001, estimated worldwide reserves remained steady atapproximately one trillion barrels, as shown in Figure 1. While there are a number ofimportant crude oil producing regions around the world, one of the most vital is theMiddle East, home to many member nations of the Organization of Petroleum Exporting
1 Member nations include Algeria, Indonesia, Iran, Iraq, Kuwait, Libya, Nigeria, Qatar, Saudi Arabia, theUnited Arab Emirates, and Venezuela. Ecuador withdrew in 1992 and Gabon withdrew in 1994.
3-149
1997 1998 1999 2000 2001
0
200
400
600
800
1000
1200
Total World Total OPEC
Source: US DOE/EIA International Energy Annual
Crude Oil Reserves(billion barrels)
Figure 1
1990
1991
1992
1993
1994
1995
1996
1997
1998
1999
2000
0
20
40
60
80
milli
on b
arre
ls p
er d
ay
OPEC Non-OPEC Total World
Source: US DOE/EIA Monthly Energy Review
World Crude Oil Production
Figure 2
Countries (OPEC)1. Current OPEC crude oil reserves equal approximately 800 billionbarrels and accountedfor 77% to 80% of totalworld reserves between1997-2001. As acomparison, UnitedStates crude oil reservesfor this same periodaveraged about 22billion barrels, slightlymore than 2% of thetotal world-wide.
World ProductionTrends
In general, world crudeoil production hasincreased steadily tomeet growing worlddemand. This gradualtrend is occasionallyinterrupted by periods ofinventory draw- downsand short durationreductions in demandresulting from reducedeconomic activity. World crude oilproduction, as shown inFigure 2, fell slightlyfrom 60.6 millionbarrels per day (mmb/d)in 1990 to an average of60.2 mmb/d for the1991-1993 period, a decline of 0.7%. During the 1994-1998 period however, world
2 Data for Russia from 1990-1991 consists of the volumes for the 15 republics that made up the Union of SovietSocialist Republics (USSR). The USSR ceased to exist on December 31, 1991.
3 In 1992 Russia accounted for approximately 90% of total USSR production. Data from 1992 onward does notinclude the remaining 14 former USSR republics.
3-150
1990 19
9119
9219
9319
9419
9519
9619
9719
9819
9920
001
3
5
7
9
11
milli
on b
/d
US Saudi Arabia Russia Venezuela
Source: US DOE/EIA Monthly Energy Review
Major Crude Oil Producers
Figure 3
demand continually moved higher and reached 67.0 mmb/d by 1998. A small reductionof 1.6% occurred in 1999, but this was offset by an increase of 3.5% in 2000 as totalworld production reached 68.2 mmb/d and petroleum fuel use rose in response to agrowing world economy.
Over the past ten years, the percentage of world crude oil production attributed to OPECmember nations has climbed steadily, rising from 38.3% in 1990 to 42.7% in 2000. Thisupward trend was briefly interrupted in1996 and 1999. In 2000, the OPEC percentageshare was at its highest level since 1980 when the 44.6% level was reached. OPEC’s alltime highest percentage share of 55.0% occurred in 1973.
Figure 3 presents the annual crude oil production volumes of several major producersbetween 1990 and 2000. The four countries, Venezuela, Russia, Saudi Arabia, and theUnited States, accounted for 34.6% of world production in 2000, down from 44.3% in1990. The reduction incombined market shareby these countries isprimarily the result ofproduction declines inRussia2 and the UnitedStates. U.S. crude oilproduction fell from 7.4mmb/d in 1990 to 5.8mmb/d by 2000, a20.8% decline. Duringthe same period Russianproduction fell from11.0 mmb/d to 6.5mmb/d, a 41.0%3 declineas that country dealtwith the breakup of theSoviet Union. While U.S. production continues on a downward trend, production inRussia has rebounded in recent years from a low of 5.9 mmb/d in 1996 to 6.5 mmb/d in
3-151
1976
1978
1980
1982
1984
1986
1988
1990
1992
1994
1996
1998
2000
0
10
20
30
40
50
60
70
dolla
rs p
er b
arre
l
nominal dollars constant 2000 dollars
Source: US DOE/EIA Monthly Energy Review
US Crude OilRefiner Acquisition Cost
Figure 4
2000, an increase of 10.2%. Increases in production from Saudi Arabia and Venezuelapartially offset the declines recorded by the U.S. and Russia. Between 1990 and 2000production from Saudi Arabia rose from 6.4 mmb/d to 8.4 mmb/d, a 31% increase. Similarly, production in Venezuela increased from 2.1 mmb/d to 2.9 mmb/d, a gain of38%.
Petroleum Price Review
A review of the refiner acquisition cost (RAC) of crude oil, the average price paid byU.S. refiners for crude oil processed at domestic refineries, in both nominal and constantyear-2000 dollars, ispresented in Figure 4. Thenominal dollar line showsthe average price paid by aU.S. refiner for a barrel ofcrude oil in that year. Theconstant year-2000 lineindicates the price that arefiner would have paid inyear-2000 dollars during agiven year. In 1981, on anominal basis, RAC pricesreached a high of $35.24 perbarrel (bbl) as the Iranianrevolution disrupted theworld petroleum markets. As high as this price seems, in terms of constant year-2000 dollars, the price of crude oilactually reached an estimated $63.28/bbl.
Since the mid-1980s, nominal RAC prices have generally remained within the $15/bbl to$25/bbl range. Even significant events such as the Persian Gulf War in 1990 onlytemporarily interrupted the relative stability of crude oil prices. More recently, OPECmember nations, as well as some large non-OPEC producers including Mexico, Norway,Oman, and Russia, have sought greater control over crude oil prices internationally byrestricting production. The restriction in the amount of crude oil available on worldmarkets has forced RAC prices upward from a 1998 low of $12.52/bbl to $28.23/bbl in2000, an escalation of $15.71/bbl or about 125%.
3-152
1973 1978 1983 1988 1993 1998
0
5
10
15
20
25m
illion
b/d
imports domestic OPEC share
Source: US DOE/EIA Monthly Energy Review
US Petroleum Supply & Demand
Figure 5
U. S. Petroleum Supply and Demand
U.S. demand for petroleum products has grown steadily over the past nine years, asillustrated in Figure 5. Petroleum demand increased from 16.7 mmb/d to 19.7 mmb/dbetween 1991 and 2000, an increase of 3.0 mmb/d or approximately 18%. During thissame period U.S. domestic production, see Figure 3, fell from 10.1 mmb/d to 9.3 mmb/d,a reduction of 7.9%. Tooffset both the decline inU.S. production and tomeet the rise in domesticconsumption, imports rosefrom 6.6 mmb/d to 10.4mmb/d, a gain of 57.6%. On a percentage of totalsupply basis, by 1998imports of crude oil andrefined products passedthe 50% level for the firsttime, equaling 51.6%. Forthe most recent year,2000, imports achieved aU.S. market share ofapproximately 53%. For comparison, the 1990 import share was 42% and in 1980 it was37%.
OPEC’s share of total U.S. petroleum product imports exceeded 50% for the first time in1974 when OPEC supplied 55.7% of total import demand. The percentage share movedsteadily higher until 1977, when an all time high of 72.3% of total imports were suppliedby OPEC members. During the 1978 to 1985 period, the Arab oil embargo and sharplyhigher world crude oil prices pushed the OPEC share down to 42.7% by 1985. Since thattime, OPEC’s share of the U.S. market has remained in the 50 to 60% range.
Refining Industry Profile
The domestic refining industry has undergone significant changes over the past 30 years. During the 1970s and early 1980s, domestic refining capacity climbed fromapproximately 12 mmb/d to 18.6 mmb/d, a 55% gain, as the number of refineriesincreased from 276 to 324 by 1981. This increase in refinery capacity occurred inresponse to rising domestic demand. However by 1978, petroleum demand had reached a
3-153
1970 1975 1980 1985 1990 1995 2000
60
70
80
90
100
perc
enta
ge u
tiliz
atio
n
11
12
13
14
15
16
17
18
19
dom
estic
cap
acity
mm
bbl/d
utilization domestic capacity
Source: US DOE/EIA Annual Energy Review
Refinery Statistics
Figure 6
peak of 18.8 mmb/d, and as a result of higher energy prices stimulating conservationinitiatives, U.S. use began to decline.
As domestic capacity rose, see Figure 6, the percentage utilization rate for domesticrefineries began to fallfrom the 1973 peak of93.9%. In effect, capacityadditions were occurring ata faster rate than thegrowth in demand. Thiscaused utilization rates todecline. The combinationof rising capacity andfalling demand pushedrefinery utilization ratessharply downward untilthey reached a low of68.6% in 1981. As aresult, between 1981 and2000, the number ofdomestic refineries fellfrom 324 to 158, a 51% decline. The corresponding reduction in capacity from 18.6mmb/d to the current level of 16.5 mmb/d, a decrease of 11.3%, resulted in increasedutilization rates in the mid-90% range for the remaining refineries during the 1990s. While this consolidation effort has increased the utilization rate of the remainingrefineries, it has made the industry more susceptible to equipment breakdowns andoutages as facilities have been required to operate closer to their maximum designcapacity over longer durations. One result of this consolidation effort is that regions ofthe country once served by a number of different companies and facilities now mustdepend on fewer refineries. When operational problems occur at one of the remainingfacilities, a region may experience supply disruptions and price surges until adequatereplacement volumes find their way to the affected markets.
Since 1995, domestic refining capacity has increased even as the number of refineriescontinues to decline. While financial, environmental, and legal considerations make itdifficult for new refineries to be built in the U.S., many facilities have added capacity asvarious existing processing units are upgraded or expanded. Refiners are also alteringprocessing units to maximize the production of higher value “light products” such asgasoline, distillate, jet fuel, and liquified petroleum gases at the expense of residual fuel
3-154
1988
1989
1990 19
9119
9219
9319
9419
9519
9619
9719
9819
9920
000
200
400
600
800
1000
1200
Natural Gas Oil
Source: US DOE/EIA
US Rotary Rigs
Figure 7
which has seen its market share decline for many years.
Exploration Industry Profile
The amount of exploratorydrilling and developmentdrilling undertaken by theindustry relies heavily on theprices of crude oil and naturalgas as well as on drilling costs. Data showing the number ofrotary rigs operating in theU.S. for natural gas and oilexploration over the past 13years are presented in Figure 7. The direct correlation betweenoil prices and the number ofrigs in operation was mostpronounced in 1990 and 2000. By referring back to Figure 4,it can be determined that crude oil prices were relatively high during those two years. Correspondingly, Figure 7 shows that the number of rotary rigs exploring for oil alsoincreased. Between 1999 and 2000 the number of rigs exploring for oil increased from128 to 197, a rise of almost 54%. This escalation in activity follows a two year upturn incrude oil RAC prices from $12.52/bbl in 1998 to $28.23/bbl in 2000, a gain of$15.71/bbl, or 125%. The rise in drilling activity in 1990 also followed a two year gainequaling $7.55/bbl, or 51.5%. Additionally, the 2000 data indicates that higher pricesgreatly stimulated natural gas exploration activities. The number of rotary rigs exploringfor natural gas climbed from 496 in 1999 to 720 in 2000, a gain of 224 rigs or 45.2%, asnatural gas prices surged to record highs.
As important as the raw prices of crude oil and natural gas are, the productivity ofdrilling operations is also critical. As the cost of operations and activities, such as dataacquisition and processing, and the display and integration of seismic data with geologicdata, continue to fall, the costs of drilling become more affordable. Additional factors,such as powerful computers and the general increase in knowledge and experience,continue to exert downward pressure on drilling costs and help stimulate exploration.
3-155
NEW YORK STATE OVERVIEW
Infrastructure and Distribution Network
Meeting New York’s future petroleum demands requires both an adequate supply ofrefined products and an efficient distribution network to move the various fuels fromrefining centers to end users. However, the reliability and efficiency of the presentpetroleum distribution system will be continually challenged by changing circumstances,such as stricter environmental requirements, land use issues, and the general aging of theinfrastructure throughout the forecast period.
The petroleum supply industry in New York has adapted over time in response to evergreater dependence on imported oil. As domestic sources of crude oil and refinedproducts became less plentiful, the Port of New York developed into a ready entry pointfor petroleum products. As tanker shipments of petroleum products from foreign anddistant Gulf Coast refineries increased, many terminal companies established largesupply operations along the New York and New Jersey sides of the Port. Today, theseprimary oil storage facilities are vital mechanism’s for redirecting bulk deliveries ofimported and domestic products to end users across the State and throughout theNortheast.
A diverse distribution network has developed over the years to transport petroleumproducts into and throughout New York State. Several pipeline systems connect NewYork consumers to the major refining centers located along the Gulf and East Coasts. Waterways, consisting of coastal channels, rivers, and canals, allow barges and coastaltankers to move supplies of refined products to end users Statewide. These water routesalso provide an alternative means for shipping fuels from domestic refineries locatedoutside the State. Highway transport vehicles deliver supplies from New Jersey,Pennsylvania, and Canada across the southern and northern regions of the State. Railshipments are not as common as other modes of transportation and generally are confinedto interstate movements of bulk quantities of fuel. Refined products often are placed ininterim locations, such as major regional terminal centers, for later truck or bargedistribution to retail outlets and end users.
Statewide Storage Capacity
In recent years, petroleum product distribution companies throughout the State haveexpressed concern over the long-term decline in the number of storage terminals andassociated storage capacity. They note that this reduction has impaired the operating
3-156
1994 1998 1999 2000 20010
100
200300
400
500
600700
800
900m
illion
gal
lons
#2 Fuel kerosene diesel
Source: NYSDEC
NYS Distillate StorageFigure 8
flexibility needed to satisfy consumer oil demand. Petroleum storage terminal facilitiesface many of the same environmental, land use, and economic pressures that affect therefining sector. Operators note the high costs associated with meeting more stringentenvironmental regulations, increased insurance costs, greater carrying costs associatedwith holding petroleum products, and the lack of market incentives to build new facilitiesas impediments to adding storage capacity in the State.
Statewide distillate fuel storage capacity, which includes volumes of #2 home heating oil,kerosene, and diesel fuel, isshown in Figure 8. Operational storage capacity of#2 home heating oil hasdeclined from 794 milliongallons in 1994 to 600 milliongallons by 2001, a reduction of194 million gallons or 24.4%. However, over the sameperiod, Statewide demand forthis fuel by the residential,commercial, industrial, andelectricity generation sectorshas increased 4.3%. Thisindicates that while terminalcapacity is being used moreefficiently to meet normaleveryday demand, there is lesscapacity to meet atypical demand surges associated with cold weather. This createsmarketplace supply uncertainty and contributes to greater short-term price volatility. Ineffect, consumers have become more dependent on the ability of the petroleum transportindustry (tugboats, barges, and tankers) to resupply the remaining terminals during peakdemand periods.
Kerosene is an important fuel used to meet heating needs and as a blending agent to prevent cold weather gelling in diesel fuel. Statewide storage capacity of this fuel hasremained steady at approximately 150 million gallons between 1994 and 2000. It wasonly in the most recent year that capacity declined to 136 million gallons, a reduction of13.2% from 2000.
Storage capacity of diesel fuel increased steadily from 48 million gallons in 1994 to 127
3-157
1994 1998 1999 2000 2001
0
200
400
600
800
1000
1200
milli
on g
allo
ns
gasoline residual fuel
Source: NYSDEC
Gasoline & Resid StorageFigure 9
million gallons by 2000, a gain of 79 million gallons or 165%. However, a significantdecline in capacity occurred in 2001 as the total Statewide volume equaled 99 milliongallons, a fall of 28 million gallons, or 22%.
Statewide motor gasoline and residual fuel storage capacities, presented in Figure 9,indicate the same decliningcapacity trend discussed fordistillate fuels. Between 1994and 2001, gasoline capacity fellfrom 571 million gallons to 471million gallons, a drop of17.5%. Again, while capacitydecreased, demand for gasolineover the same period increasedfrom 5.5 billion gallons to 5.8billion gallons, a gain of 4.2%. Similarly, the capacity ofresidual fuel, a fuel used by theelectricity generation sector andin large industrial, commercial,and residential boilers, sawcapacity move downward from981 million gallons in 1994 to823 million gallons in 2001, a decline of 158 million gallons, or 16%.
Exploration Activities
Historic Industry. New York’s first commercial oil well began production in 1865, andStatewide production peaked in 1882 at 6.8 million barrels per year. This initial oil boomwas short lived, and by 1893 production was down to one million barrels per year. NewYork’s second oil boom occurred with the invention of water flooding, the first enhancedoil recovery technique. The technique led to a second peak of 5.4 million barrels in1943. Since then, Statewide oil production has steadily declined. The last major oil findoccurred in 1981 when the “Bass Island Trend” was discovered in Chautauqua County. This geographic formation proved to hold a significant amount of oil and has producedover 1.5 million barrels of oil and significant volumes of natural gas.
4 An exploratory well drilled in unproven territory.
3-158
1990 19
9119
9219
9319
9419
9519
9619
9719
9819
9920
000
100
200
300
400
500
1,00
0 bb
ls p
er y
ear
Sources: NYS DEC
NYS Crude Oil Production
Figure 10
Current Production Trends. According to the Energy Information Administration,New York ranked 29th out of 31 oil producing states in the year 2000. New York’s oilproduction comes from twodistinct regions: 1) the historicareas of Allegany,Cattaraugus, and Steubencounties, and 2) from the BassIsland Trend in ChautauquaCounty. Oil production in2000 totaled 180,590 barrels,less than 0.1% of annual demand, and a 57% declinefrom 1990 as shown in Figure10. By the end of 2000, therewere 2,803 active oil wellsand another 1,906 notreporting any production. Active wells in the Stateproduce a yearly average of 64 barrels per well. New York’s historic oil fields inAllegany, Cattaraugus, and Steuben counties accounted for 87% of reported production,reflecting the rapid decline of the Bass Island Trend in Chautauqua County.
From 1990 to 2000, oil well completions ranged from a high of 71 in 1992 to a low of 7in 1998. Completions rebounded slightly to 25 in 1999 and 17 in 2000. This modest rebound in new wells can be partly attributed to a 125% increase in average crude oilprices from 1998 to 2000. In 1997, the only wildcat4 well drilled in New York in the lastten years led to the discovery of a small field in northern Cattaraugus County. The field,named Bixby Hill, continues to produce approximately 3,000 barrels of oil per year.
Crude Oil Production Outlook. New York’s decreasing oil production can beattributed to the lack of new discoveries, declining Bass Island production, and thecontinued plugging of both oil and injection wells caused by increased environmentalcompliance costs. Though low product prices have been blamed as a factor for decliningproduction in the past, increased prices in 1999 and 2000 only stimulated a moderatedrilling increase that did not alter the downward trend in Statewide production.
5 Reed, C. ed., 1989. New York State Oil and Gas Drilling and Production 1988. New York StateDepartment of Environmental Conservation - Division of Mineral resources, p. 59.
3-159
Yet, the remaining resource base is substantial. In an extensive geological study of theState’s resource base done in the 1980s, original oil-in-place was estimated at 1.118billion barrels.5 Cumulative production through 2000 totaled approximately 244 millionbarrels. This represents an estimated recovery rate of approximately 22%. Primaryproduction can usually recover a maximum of 30% with another 15% possible fromwater flooding. Using this very optimistic 45% maximum recovery factor, total NewYork production from primary and secondary methods may total 600 million barrels with356 million barrels yet to be recovered. In reality, any significant recovery of thisresource requires new and expensive technologies, such as tertiary recovery methods andhorizontal drilling.
The New York State Energy Research and Development Authority (NYSERDA) hasfunded projects that demonstrate horizontal drilling and enhanced recovery techniques inNew York’s oil fields. A particular success was the Maring 3-B horizontal wellrecompletion drilled in the Bass Island Trend. The well was completed in August 1998with flow rates in excess of 250 barrels of oil per day with associated gas. A secondhorizontal well is planned for 2001.
Without renewed commercial interest, discovering any new major geologic target may bedifficult. If business conditions improve, the application of new technologies, such ashorizontal drilling and tertiary recovery methods, may help slow the State’s productiondecline. Otherwise, the outlook for crude oil production is a continued decline of 5 to10% per year.
Petroleum Share of New York Sector Demand
Petroleum fuels are vital to the State’s economy and remain the single largest source ofenergy consumed in the State. As of 1999, petroleum supplied approximately 40% ofNew York’s total demand. While this is well below the 65% level recorded in 1975, it isgreater than the 31% figure for natural gas in 1999. Petroleum fuels provide energy foreach of the State’s economic sectors, as shown in Figure 11. The electric sector hasposted the sharpest decline, falling from about 47% in 1975 to the current rate of 7.9%. Since the early 1990's, the electricity sector has steadily turned to natural gas to satisfythe State’s increased electricity demand. However, petroleum products such as residualfuel continue to supply a number of large baseline generating units. Distillate fuels serve
3-160
����������������
���������������
������������������������
������������
���������������������������
���������������
��������������������
������������������
����������������
������������������������������������
���������
����������������
��������������������
������������
������������������������������������
��������
������������
����������������
��������
������������������������������������
������������
������������
����������������
��������
����������������������������������������
���������
������������
������
����������������������������������������
���������
���������
��������
���������������������������
ElectricResidential
CommercialIndustrial
Transport0
20
40
60
80
100
perc
ent
������������ 1970������������ 1990
�������������� 1975�������������� 1995
�������������� 1980�������������� 1999
������������ 1985
Source: NYSERDA, Patterns and Trends
Petroleum Share ofNew York Energy Demand
Figure 11
the dual purpose of fueling electricity generation peaking units and providing backup fuelcapability at some generation facilities during periods when natural gas is unavailable. Finally, in the transportation sector, gasoline and diesel fuel still account for over 99% ofenergy supplies.
In the residential sectordemand for all petroleumfuels, including homeheating oil, kerosene,and propane fuel,declined as higher pricesin the 1970s and early1980s encouragedhomeowners to convertto natural gas, increasehome insulation, lowerthermostats, andpurchase high efficiencyfurnaces. Similar end-user sentiment in boththe commercial andindustrial sectors acted toreduce petroleum’s share of total energy supply. A limited amount of dual-fuelcapability exists in large apartment buildings in the residential sector and in both thecommercial and industrial sectors. Dual-fuel equipment allows end-users the option toswitch between natural gas and distillate fuels when the price for one makes it aneconomic advantage to do so. As a result, if a sufficient amount of fuel switching occurs,petroleum use may increase from year to year. This occurred in both the residential andindustrial sectors between 1995 and 1999.
REFINED PRODUCT REVIEW
Distillate Supply and Demand
Monthly total U.S. distillate fuel production and supply is presented in Figure 12. In thisanalysis, supply is used as a surrogate measure for demand. As the graph illustrates,there are a number of months during the winter period when demand outstrips theproduction capacity of domestic refiners. It is during these times that inventories andproduct imports become critical to meet consumer needs. A review of the graph shows
6 Distillate fuel is defined as home heating oil, kerosene, and diesel fuel.7 NYSERDA, Patterns and Trends 1999.
3-161
Jan
97 Jul
Jan
98 Jul
Jan
99 Jul
Jan
00 Jul
Jan
01 Jul0
1
2
3
4
5
milli
on b
/d
production supply
Source: US DOE/EIA Monthly Energy Review
Distillate Production & Supply
Figure 12
that the spread between domestic production and demand has widened over the past fourwinter seasons. Duringthe October 1997 throughMarch 1998 winterperiod, the demand toproduction spreadaveraged 153,000 b/d. The following year thespread increased to295,000 b/d, a gain of142,000 b/d, or 93%. Over the next two winterperiods the spreadclimbed to 371,000 b/d in1999-2000, and finally to375,000 b/d in 2000-2001.
New York Distillate Fuel Focus
New York State is a major user of distillate fuel6 with an estimated 2.9 millionhouseholds (representing nearly one-half of the population) using home heating oil andkerosene for heat. The three distillate fuels are utilized in each of the economic sectorsof the State and account for approximately 25%7 of total petroleum fuel used in NewYork. New York consumers use approximately 20% of the nation’s total distillatesupply, with the residential sector accounting for the majority of the use within the State. New York uses more heating oil than any other state in the nation. The residential,commercial, industrial, and electricity generating sectors use an average of 11 milliongallons of distillate fuel per day over the four-month November through February winterperiod. This figure does not include diesel volumes used in the transportation sector.
8 Includes Delaware, District of Columbia, Maryland, New Jersey, New York, and Pennsylvania.
3-162
Jan
97 Jul
Jan
98 Jul
Jan
99 Jul
Jan
00 Jul
Jan
01 Jul
0
10
20
30
40
50
milli
on b
arrle
s
Source: US DOE/EIA Monthly Energy Review
Distillate InventoriesCentral Atlantic Region
Figure 13
Distillate Inventory Trends
Inventory volumes are important components of the distillate fuel supply system and atthe regional level act as critical buffers to meeting demand during the winter months. Monthly distillate fuel quantities for the Central Atlantic Region8 of the U.S. arepresented in Figure 13. Regional analysis is important because New York’s fuel needs,as well as those of neighboring states, are met from terminals located both within andoutside the State. Correspondingly, some fuel inventories in New York Harbor andnorthward along the Hudson River supply neighboring New England and CentralAtlantic states.
Figure 13 illustrates an important development that has emerged in recent yearsconcerning distillate inventories; it appears the petroleum industry is maintainingprogressively lower volumesof distillate fuel each year inthe Central Atlantic Region. The data show that distillatefuel inventories in 1998peaked at 45.2 milliongallons in November. Thefollowing year a peak of 38.4million gallons occurred inAugust, 6.8 million gallons,or 15% lower than theprevious year. By 2000,inventory volumes onlyreached the 24.9 milliongallon level at the Octoberhighpoint, 35% less than theyear earlier and 45% belowthe 1998 level.
This three-year pattern of lower inventories reflects the industry’s movement to a practiceknown as “just-in-time” inventory resupply. Just-in-time inventory practices have beenundertaken because there are significant costs incurred by petroleum terminal operatorsand distributors in storing large volumes of fuel over extended periods of time. The
3-163
Jan
97 Jul
Jan
98 Jul
Jan
99 Jul
Jan
00 Jul
Jan
01 Jul
0
100
200
300
400
500
600
700
800
thou
sand
bar
rels
per
day
Source: US DOE/EIA Monthly Energy Review
US Distillate ImportsFigure 14
industry now relies on the petroleum supply chain to deliver fuel to satisfy marketrequirements. While this management practice reduces inventory carrying costs, itexposes the petroleum distribution chain to a greater level of vulnerability should supplydisruptions occur anywhere, or for any reason, along the distribution chain.
Northeast Home Heating Oil Reserve
In response to the distillate fuel shortfalls that occurred during the 1999-2000 winterseason, the U.S. Department of Energy (US DOE) established the Northeast HomeHeating Oil Reserve in the summer of 2000. This reserve consists of two million barrelsof government-owned heating oil. The reserve is intended to provide insurance againstlower than normal inventories, supply shortfalls, and delivery interruptions. In the initialyear of operation, reserves of 500,000 barrels each were held at Equiva’s MotivaTerminal and Morgan Stanley’s Williams Terminal, both in New Haven, Connecticut,and one million barrels were held at the Hess Terminal in Woodbridge, New Jersey. Inthe summer of 2001, US DOE approved the relocation of 150,000 barrels of the Reservefrom New Haven to Providence, Rhode Island. There is also an option to expand thisRhode Island volume to 250,000 barrels in the future. This third location enhances thedistribution capabilities by increasing truck and marine loading options. States coveredby the reserve are New York, Connecticut, Maine, New Hampshire, Rhode Island,Vermont, Massachusetts, Pennsylvania, and New Jersey.
Distillate Imports
In response to lowerinventory levels andrelatively steady domesticproduction trends, thepetroleum industry hasincreased imports of distillatefuel to meet the surge indemand that occurs duringpeak periods. Monthly totalU.S. distillate fuel imports areshown in Figure 14. Thegraph illustrates that, asinventory volumes declinedover the past three years, thepetroleum industry satisfied
3-164
Jan
97 Jul
Jan
98 Jul
Jan
99 Jul
Jan
00 Jul
Jan
01 Jul6
7
8
9
10
milli
on b
/d
production supply
Source: US DOE/EIA Monthly Energy Review
Gasoline Production & Supply
Figure 15
demand with increasingly larger quantities of imports. In February 1999, the industryimported a high of 322,000 barrels per day (b/d), 85,000 b/d or 36% more than theprevious year. By February 2000, the total had climbed to 510,000 b/d, 188,000 b/d or58% above the year earlier level. Finally in 2001, the petroleum industry importedrecord volumes for two consecutive months, 778,000 b/d and 668,000 b/d, respectivelyfor January and February.
With import volumes of this magnitude, there is concern whether the distribution system,including barges and tankers, can satisfy the future requirements of the region. Also, potentially significant increases in demand for distillate products used as backup fuel fornatural gas in the electricity generation sector add to the concern. Lower storage tankcapacities and quantity of fuel stored increase the likelihood that supply disruptionscaused by winter storms or heavy ice conditions could adversely affect New York endusers in all economic sectors.
Gasoline Supply and Demand
Monthly total U.S. gasoline production and supply are presented for the January 1997 toAugust 2001 period in Figure 15. Once again, supply is used as a surrogate measure fordemand. The clear pattern that emerges from the data is that, for numerous months of theyear, the U.S. depends on imported gasoline to meet every day demand. This isparticularly true during thesummer months and againhighlights the importance ofmaintaining adequate inventories. On an annualbasis the data indicate thatfrom 1997 to 1999 thedifference between domestic production and demandincreased from 147,000 b/d to320,000 b/d, an increase of173,000 b/d or about 118%. For 2000, this differencedeclined to 286,000 b/d, adecrease from 1999 of 34,000b/d or 11%. The greatest individual monthly difference since 1997 occurred in August2000, when demand surpassed domestic production capacity by 670,000 b/d.
3-165
Jan
97 Jul
Jan
98 Jul
Jan
99 Jul
Jan
00 Jul
Jan
01 Jul0
10
20
30
40
milli
on b
arre
ls
Source: US DOE/EIA
Gasoline InventoriesCentral Atlantic Region
Figure 16
Jan
97 Jul
Jan
98 Jul
Jan
99 Jul
Jan
00 Jul
Jan
01 Jul0
100
200
300
400
500
600
thou
sand
b/d
Source: US DOE/EIA Monthly Energy Review
US Gasoline Imports
Figure 17
Gasoline Inventory Trends
Like distillate fuel inventories, gasoline inventories play critical roles in ensuringadequate supplies of motor gasoline, particularly during the peak summer driving season. Total gasoline inventories forboth conventional andreformulated gasoline arepresented in Figure 16. Unlike distillate fuels, whichshow a downward trend intotal volume, seasonal gasoline inventories haveremained relatively stablesince January 1997. Ingeneral the petroleum industryincreases stock levels duringthe spring in anticipation ofhigher demand during thesummer driving season. During 2000, inventories on average were below the previous two years but in 2001 theyonce again moved to a higher level.
Gasoline Imports
Since the increase in domestic gasoline production has not kept pace with the rise indemand, volumes of importedfuel have been on an upwardtrend. Monthly total U.S.gasoline imports are shown inFigure 17. As the graphillustrates, since 1997 thequantity of gasoline importshas been rising. In 1997,imports averaged 309,000b/d. By 2000, the volumehad risen to 427,000 b/d, anincrease of 118,000 b/d orapproximately 38%. Duringthe 1997 to 2000 period, U.S.
3-166
dependence on gasoline imports to meet domestic demand climbed from 3.8% of totalsupply in 1998 to 5.0% in 2000. While it is expected that product imports will continueto be available, the difference in U.S. gasoline regulations compared to other areas of theworld may limit supply availability in the future.
New York State Gasoline Focus
New York gasoline requirements are satisfied by either conventional grade fuel or U.S.Environmental Protection Administration (US EPA) mandated reformulated (RFG)gasoline. Gasoline retailers are required to sell RFG grade gasoline throughout the yearin New York City and on Long Island, and in the counties of Westchester, Putnam,Orange, Dutchess, and Rockland. This region of the State uses an estimated 2.9 billiongallons, or approximately 50% of New York’s annual gasoline demand. One of theprimary components of RFG is methyl tertiary butyl ether (MTBE). This additive hasbeen used in gasoline since 1979. Initially it was used as an octane enhancingreplacement for lead and later as an oxygenate to reduce ozone, carbon monoxide, andother air pollutants. Other areas of the State use conventional gasoline.
About 50% of all gasoline delivered to New York State is produced at Gulf Coastrefineries. Most of this fuel is shipped by pipeline to storage terminals in northern NewJersey and central and western New York. A small volume of this supply is transportedby coastal tanker into New York Harbor. Approximately 40% of the gasoline consumedin New York is produced at Mid-Atlantic refineries, located primarily in New Jersey andPennsylvania, and moved into New York Harbor and Long Island terminals by barge. The remaining 10% of the gasoline used in the State is imported by ocean tanker from theCaribbean area, largely from Virgin Islands and Venezuelan refineries, or by truck fromCanada. Gasoline reaching New York Harbor is also barged to regional terminals alongthe Hudson River, north to Green Island, and east to Long Island. Tanker trucks thenmove the gasoline from regional terminals to neighborhood gasoline stations.
Article X Focus
Table 1 summarizes petroleum fuel information for 11 of the 22 Article X projects thathave filed applications and have been approved by the New York State Board on ElectricGeneration Siting and the Environment, filed applications and are pending, filed pre-application reports, and/or filed preliminary scoping statements as of September 15,2001.
3-167
Table 1
ARTICLE X PROJECTS PETROLEUM PROFILE
ProjectName
WinterCapacity
(MW)Backup
Fuel
StorageCapacitymilliongallons
AverageBurn Rate
Days ofStorage
BackupFuel
MaximumBurn Rate
gal./hr.
Backup FuelAverage
Burn Rate**gal/hr.
Athens 1080 #2 Oil 4 3.9 66,000 43,000
AstoriaEnergy
1000 #2 Oil 6 6.9 56,000 36,400
Bowline Pt. 3 750 #2 Oil n/a n/a 34,300 22,300
East RiverRepowering
360 #2 Oil 4.4 9.4 30,000 19,500
RavenswoodCogeneration
250 < .04%kerosene
2 8.5 15,000 9,750
Sunset Energy 580 #2 Oil 0.25 0.5 30,528* 19,843*
BethlehemEnergy Center
750 <.04%distillate
10.5 17 39,476* 25,660*
Poletti StationExpansion
500 < .04%kerosene
6 14.6 26,318* 17,106*
Kings Park 300 #2 Oil 0.08 0.5 31,581* 20,528*
CaithnessIsland Power
750 #2 Oil 2.5 4.1 39,476* 25,660*
AstoriaRepowering
589 #2 Oil n/a n/a 31,002* 20,151*
Total 6,909 35.73 399,681 259,898
Table notes:* Calculated using a 7,300 Btu/hour heat rate.** Based on an average burn rate of 65%.
These 11 projects have indicated plans to use petroleum distillate fuel products, such as#2 fuel oil and kerosene, as backup fuel. All the projects plan to use natural gas as theprimary fuel. Of the 11 projects that have stated they plan to use distillate fuel as abackup to natural gas, three of the projects, with their winter megawatt capacity inparenthesis are: Athens (1080), Bowline Point 3 (750), and Bethlehem Energy Center(750); all are located on the Hudson River between Albany and New York City. Theremaining eight projects with winter megawatt capacity are: Astoria Energy (1000), East
3-168
River Repowering (360), Ravenswood Cogeneration (250), Sunset Energy Facility (580),Poletti Station Expansion (500), Kings Park (600), Caithness Island Power (750), andAstoria Repowering (589); all are located in New York City and on Long Island. The tenprojects that do not plan to utilize backup fuels are: Torne Valley (827), Ramapo (1,100),Heritage (800), Twin Tier Power (520), Grassy Point (550), Glenville Energy (520),Brookhaven Energy (580), Oak Point Energy (1075), Wawayanda Energy (540),Besicorp (510).
• Assuming a 65% average daily load factor on backup fuels, if each the 11 projectswere to call upon backup distillate fuel capability at the same time, the averageStatewide burn rate would be approximately 260,000 gallons per hour, or anestimated 6.2 million gallons per day. If the facilities were to use the maximumcapacity burn rate, the 11 projects would consume almost 400,000 gallons perhour, or approximately 9.6 million gallons per day. To put this usage level intoperspective, it is estimated that on a typical winter day New York State uses, onaverage, 11 million gallons. Therefore, the potential exists that these generatingfacilities could almost double the demand for distillate fuels were each of them tohave their natural gas supply interrupted at the same time.
• With hourly use of this magnitude, adequate on site storage capacity for backupfuel is critical. While several of the projects have not yet provided completeinformation, a number are considering backup fuel storage capacity ranging from4 to 15 days of supply. However, there are several projects that are proposingonly very limited backup fuel capacity, some as low as less than one day. Theimplications of this limited capacity is that the electricity generation facilities maynot be able to secure timely resupply of backup fuel and be forced to completelycurtail operation.
• Whether electricity generation facilities choose interruptible or firm natural gasservice will affect several sectors of the State’s economy. If interruption of gasservice to these facilities should occur at the same time that the residential sectoris maximizing the use of #2 heating oil to meet heating demand, there is concernwhether the petroleum supply and transportation industries, including trucking,barge, and tugboats, will have the resources available to meet the increase indemand by the electricity generators. During the peak heating season, mostpetroleum transportation resources are fully committed to the resupply oftraditional customers in the residential, industrial, and commercial sectors. Although these transportation companies also serve the electric sector during thewinter, the magnitude of increase associated with the Article X generators raisesimportant resupply questions.
• Six of the 11 Article X projects propose to be supplied by barge, three will usetruck transport to receive fuel, and two have yet to specify a delivery option.
3-169
During peak demand periods much of the petroleum transport industry is alreadyfully committed. A facility that consumes 20,000 gallons of distillate fuel perhour and does not have, or has only limited, on site storage would need enoughtruck transport delivery capacity to cover the actual burn rate, the time needed tocover the travel distance to and from a petroleum terminal, highway and weatherdelays, loading and unloading times, and delays that may be encountered at theterminal. This may require the total commitment of 6-8 trucks or more for justone of the generating facilities. If additional facilities turn to backup fuel at thesame time, the unavailability of sufficient transport resources will be magnified.
• Increased reliance on #2 heating oil as a backup fuel is not exclusive to New YorkState electricity generators. Numerous states in the Northeast are seeingconstruction of electricity generation facilities using natural gas as the primaryfuel and relying on distillate for backup. Whether there will be sufficientquantities of natural gas, backup fuel, and the ability to transport the backup fuelto facilities located in New York State is being examined by Charles RiverAssociates, Inc. for NYSERDA and the New York Independent System Operator. A final report is expected by late April or early May 2002 (see Natural GasAssessment).
FORECAST SUMMARY
As is evidenced in Table 2, the Draft Energy Plan projects total residential distillate(home heating oil) demand will decline 1.61% annually over the forecast period. Residential distillate demand is projected to decline by 57 TBtu in the reference caseforecast from 197 TBtu in 2000 to 140 TBtu in 2021. However, motor gasoline isexpected to increase 0.92% annually during the forecast period from 697 TBtu in 2000 to844 TBtu in 2021.
Residential distillate fuel prices are estimated to decrease 0.84% per year over theforecast period. The Draft Energy Plan projects that New York State residential distillateprices will decline from 152.6 cents per gallon in 2000 to 127.93 cents per gallon in2021. Similarly, gasoline prices will decrease by 0.4% over the forecast period from158.8 cents per gallon in 2000 to 146.06 cents per gallon in 2021.
For a more detailed discussion of the various forecast assumptions and a description ofthe forecast methodology see the Forecast Summary section of the Draft Energy Plan.
Table 2
3-170
New York State Petroleum Demand and Price Forecast
Actual Outlook Outlook Average Annual Growth
2000 2006 2021 2000-2006 2006-2021 2000-2021
DEMAND: TBtuResidentialDistillateGasoline
PRICE*: cents/gal.ResidentialDistillateGasoline
197697
152.6158.8
167780
116.76148.11
140844
127.93146.06
-2.72%1.9%
-4.36%-1.16%
-1.17%0.53%
0.61%-0.09%
-1.61%0.92%
-0.84%-0.4%
Source: Draft Energy Plan, Forecast Summary.* Petroleum prices are expressed in constant 2000 dollars.
PETROLEUM INDUSTRY AND INFRASTRUCTURE SECURITY
The events of September 11, 2001 have alerted the petroleum industry that there arenumerous steps the industry can take to help protect the critical energy facilities thatsupply petroleum fuels to end-users. Company officials, trade associations, and federaland State government representatives are working together on the common goal ofensuring the security of critical energy infrastructure components. Just a partial list ofthese critical components includes: off-shore and on-shore crude oil production facilities;a vast network of crude oil and refined product pipelines; refineries; storage terminals;transportation components such as trucks, railroad tank cars, barges, and tankers; andeven the local service station and convenience store. Fortunately, the petroleum industry,as well as others, addressed many security concerns and upgraded various measures inpreparation for the “Y2K” event. There will be many challenges in the future and morework needs to be done. Together, the petroleum industry and government representativesneed to devise a long-term strategy to ensure the security of the national energy deliverysystem.
Reliance on any one crude oil producing region of the world has the potential to disruptthe domestic economy in the event that supplies from that region are interrupted. Suchreliance could cause price volatility and increased prices paid by consumers. To offsetthis reliance, greater diversity of sources of oil supply may be achieved by developingnew exploration and production technologies and expanding trade and investment
3-171
initiatives between consuming and producing countries. Equally important is thedevelopment of energy efficiency programs and services that offset demand and createpermanent changes in the market place.
FINDINGS AND CONCLUSIONS
• U.S. production of crude oil continues to decline. As a consequence, both U.S.and New York State continue to increase their dependance on foreign sources ofcrude oil and refined petroleum products to meet consumer demand.
• In-State petroleum terminal storage capacity for distillate fuels, gasoline, andresidual fuel continues to decline. Reasons for this decline include land useconcerns associated with storage, costs associated with properly maintainingfacilities, increased insurance costs, lack of market incentives to construct newfacilities, and the costs of holding large volumes of fuel.
• Lower inventory storage can result in degradation of the operational flexibilityneeded to satisfy consumer demand, greater supply uncertainty, and greater short-term price volatility.
• If the natural gas fueled electricity generation facilities with interruptible gascontracts are unable to acquire their primary fuel and are forced to switch todistillate fuel, they will use significant quantities of distillate over a very shortperiod of time. This could strain the ability of the petroleum infrastructure torespond to this need.
• Electricity generation facilities burning distillate fuel as a backup when naturalgas is interrupted have the potential to disrupt the delivery of electricity in caseswhere such facilities are being relied upon to meet peak demand and whereavailability of distillate fuel is limited. In addition, a sudden, large increase inpetroleum use in electricity generation could potentially have negative impacts onair quality.
3-172
2000 United States Coal Production, Use, and Prices
(Million Tons and Nominal Dollars)
Production by Region Appalachian Interior Western Total
mmtons420.9 144.7 509.9
1,075.5
%39.1 13.5 47.4
Use by Sector Electric Power Coke Plants Other Industrial Plants Residential/Commercial Users Total
mmtons979.9
29.5 65.4
4.9 1,079.7
%90.8
2.7 6.0 0.5
Average Delivered Price Electric Utilities Coke Plants Other Industrial Plants
$/ton $23.83 $44.43 $31.59
Source: U.S. DOE, Energy Information Administration, U.S. Coal Supply and Demand: 2000 Review Annual Energy Review, 2000
Table 1
SECTION 3.7
COAL RESOURCE ASSESSMENT
INTRODUCTION
This section assesses coal use, production, prices, transportation, reserves, and miningoperations in New York State and the United States. It also addresses recent developmentsand trends in the coal industry, examining environmental factors, including the Governor’sAcid Deposition Initiative and clean coal technologies, the U.S. Department of Energy’s(U.S. DOE) Clean Coal Power Plant Improvement Initiative, and the implications ofelectric power restructuring on the coal industry. In addition, this assessment reports onthe future outlook for coal use in New York and presents a forecast of price and demand.
UNITED STATES COAL OVERVIEW
Coal is America’s most abundant indigenous fuel source, accounting for 95% of thenation’s fossil energy reserves. The U.S. has a 250-year supply of coal based on currentusage levels. One quarter of the world’s known coal supplies are in the United States. U.S. coal production is second only to China’s among world producers. In 2000, overone billion tons of coal were producedin the U.S., mined in 25 coal-producingstates. Wyoming is the largest coalproducer, with 339 million tons minedin 2000, representing 31% of U.S.production. Approximately two-thirdsof U.S. coal production is surfacemined. Nearly all of U.S. coalproduction is used domestically.
As shown in Table 1, over one billiontons of coal were used in the U.S., withmore than 90% used in the electricpower sector. Coal power plantsaccount for 57% of all U.S. electricitygeneration, and over 80% of electricitygeneration in twelve states in theMidwest, Southwest, and West.
3-173
2000 United States Coal Productionby Coal-Producing State
Region and State Number ofMines
Production(Million Tons)
Appalachian Region Alabama Kentucky, Eastern Maryland Ohio Pennsylvania Tennessee Virginia West Virginia
1392 47
421 15 79
339 24
161 306
420.9 19.2
105.1 4.3
22.2 75.1
2.7 32.8
159.8
Interior Region Illinois Indiana Kansas Kentucky, Western Louisiana Mississippi Missouri Oklahoma Texas
125 23 34
2 37
2 1 2
10 14
144.7 33.4 28.0
0.2 27.0
3.7 0.9 0.4 1.6
49.6
Western Region Alaska Arizona Colorado Montana New Mexico North Dakota Utah Washington Wyoming
71 1 2
12 6 7 4
15 2
22
509.9 1.6
13.1 29.1 38.4 26.2 31.3 26.7
4.3 339.3
Source: U.S. DOE, Energy Information Administration, U.S. Coal Supply and Demand: 2000 Review
Table 2
Coal is by far the least expensive fossil fuel on a dollar per British thermal unit ($/Btu)basis, averaging less than one-half the prices in 2000 of petroleum and natural gas. Thedelivered price of coal continues to decline, in keeping with a trend that started more thantwo decades ago. Approximately two-thirds of all coal mined in the U.S. is transportedby rail. Hauling coal is the largest single source of freight revenue for U.S. railroads. Coal is also the largest freight revenue commodity moved by barges on the nation’sinland waterways.
United States Coal Production
During the past seven years, U.S. coalproduction continued to grow at anannual rate of nearly 2%. This growthoccurred because, in spite of theclosing or consolidation of mines, theaverage size and productivity of theremaining mines increased. The 20largest coal producing companies nowaccount for more than 70% of U.S.production.
In 2000, coal production in the U.S.totaled 1,075.5 million tons from theAppalachian, Interior, and Westerncoal supply regions. As shown inTable 2, coal production in theAppalachian Region was 420.9 milliontons in 2000. West Virginia is thelargest coal producing state in theAppalachian Region, followed byKentucky and Pennsylvania. Coalproduction in the Interior Region was144.7 million tons in 2000. Texas isthe largest coal producing state in theInterior Region, followed by Illinoisand Indiana. In 2000, a total of 509.9million tons of coal was produced inthe Western Region, dominated by
Origin West of the Mississippi East of the Mississippi
mmtons566.2509.3
%52.647.4
Source: U.S. DOE, Energy Information Admin., Annual Energy Review, 2000
Table 3
Wyoming, which accounted for two-thirds of the regional production and nearly one-third of the U.S. production. The state of Wyoming produced 339.3 million tons of coal,which represents nearly the sum of the next three largest coal-producing states combined. Coal production has grown in the Western Region in recent years and is now nearly 50%of U.S. production. The Appalachian Region continues to be the principal source ofbituminous and anthracite coal. The Western Region coal includes some bituminouscoal, but primarily subbituminous coal and lignite.
The classification of coal is based on its fixed carbon, volatile matter and moisturecontent, and on its heating value. Lignite, also called brown coal, is ranked lowest inquality, and has a high moisture content, as much as 45% by weight. Its heating valuesrange from 9 to 17 million Btu per ton, with an average of about 14 million Btu per ton. Subbituminous coal, or black lignite, contains 20% to 30% moisture and has a heatingvalues that ranges from 16 to 24 million Btu per ton. Subbituminous coal’s heatingvalues average about 18 million Btu per ton. Bituminous coal, or soft coal, is the mostcommonly mined. Its moisture contentusually is less than 20% and the heatingvalues range from 19 to 30 million Btu perton for an average of 24 million Btu per ton. Anthracite, or hard coal, is ranked highest inquality. With a moisture content generallyless than 15%, its heating values range from22 to 28 million Btu per ton and averageabout 25 million Btu per ton. This coal isfound only in Pennsylvania and is usedmostly for space heating and limitedelectricity generation. Table 3 provides U.S.coal production statistics by classification ofcoal, mining methods, and origin.
United States Coal Use
In 2000, the use of coal in the U.S. reached an all-time peak of 1,079.7 million tons. More than 90% of all coal was used by the electric power sector. In 2000, coal was usedto produce 57% of all electricity generated in the United States. The 991.3 million tonsof coal used in the electric power sector does not include coal used by distributedcogeneration facilities. Use of coal for cogeneration is included in industrial andcommercial sector figures reported by U.S. DOE, Energy Information Administration(U.S. DOE/EIA), so actual contribution of coal to electricity generation is slightly higher.
3-175
Estimate of Recoverable Reserves of Coal in United States
(as of January 1, 1997) - (in billion tons)
RegionLow
SulfurMedium Sulfur
High Sulfur Total
Appalachian Interior Western
12 1
88
20 10 55
23 58
9
55 69
151
U.S. Total 100 85 90 275 Source: U.S. DOE, Energy Information Administration, U.S. Coal Reserves: 1997 Update
Table 4
In 2000, New York State ranked thirty-fifth among U.S. states in coal use; Texas,Indiana, Ohio, Alabama, and West Virginia, respectively, were the top five.
United States Coal Reserves
As of January 1, 1997, the demonstrated reserve base (DRB) of coal resources in the U.S.exceeded 500 billion tons (estimated by U.S. DOE/EIA), nearly half located in theWestern Region. The DRB is the estimated quantity of in-ground coal resources in theU.S. that meet minimum criteria. Although the DRB is approximately 500 times the U.S.annual coal production rate, all coal in the DRB is not recoverable. Almost half of theDRB is either inaccessible or likely to be lost in the mining process. The estimatedrecoverable reserves of coal in the U.S. (the portion of DRB that can be recoveredeconomically with the application of current extraction technologies) total 275 billiontons. The estimated recoverable reserves for low (0.60 pound of sulfur per thousand Btuor less), medium (0.61 to 1.67pound of sulfur per thousandBtu), and high (1.68 pound ofsulfur per thousand Btu orhigher) sulfur coal are relativelysimilar, as shown in Table 4.
The amount of recoverablereserves at active mines in theU.S. is estimated at 19.3 billiontons, based on information frommine operators for each activeproperty. The majority of activerecoverable reserves are in the Western Region (13 billion tons), followed by theAppalachian Region (4.7 billion tons), and Interior Region (2.6 billion tons).
United States Coal Mining
The U.S. coal mining industry has undergone considerable change in the past severaldecades that has resulted in a significant decrease in the total number of coal mines,while at the same time mining productivity has increased. Coal mine productivity, intons of coal produced per miner hour, improved both in underground and surface mines
3-176
United States Coal Mining Statistics
1995 2000
Production (in million tons) Underground Surface Total
396 637
1,033
383 693
1,076
Number of mines (active) Underground Surface Total
977 1,127 2,104
839 749
1,588
Number of miners (in thousands) Underground Surface Total
58 32 90
46 32 78
Productivity (tons per miner hour) Underground Surface Average
3.4 8.5 5.4
3.9 10.3
6.5 Source: U.S. DOE, Energy Information Admin., Annual Energy Review, 2000 Coal Industry Annual, 1999
Table 5in all three coal-producing regions. Between1995 and 2000, as labor productivityimproved from 5.4 to 6.5 tons per miner hour,the average number of miners working dailydeclined from 90,000 to 78,000. See Table 5for additional U.S. coal mining statistics.
The U.S. coal mining industry has adopted anumber of technological changes to improvethe productivity and cost-effectiveness ofmining operations. Examples of such changesinclude improved mining equipment, bettermaterial handling techniques, and enhancedautomation of equipment monitoring.
United States Coal Price
Coal prices declined in 2000, continuing thedownward trend of the past twenty-five years. In 2000, the annual average price of coaldelivered to utilities was $24.28 per ton. Asreported by the U.S. DOE/EIA in the Annual Energy Review - 2000, the 1999 nationalaverage prices for coal by class were $38.94/ton for anthracite, $23.88/ton forbituminous, $11.04/ton for lignite, and $7.02/ton for subbituminous.
Because of differences in shipping distance and transportation mode, transportation costsvary greatly for different regions and sources of coal. Appalachian and Interior Regioncoal is costlier at the minemouth, but its transportation costs are lower, involvingrelatively shorter hauls to consumers by rail and barge. Low-cost Western Region coal isshipped primarily by rail over great distances, thus incurring higher transportation coststhan Appalachian and Interior Region coal. Coal transportation costs on averagerepresent 50%, 20%, and 12% of the delivered price for Western, Appalachian, andInterior coal, respectively.
United States Coal Transportation
Coal is an important commodity carried by rail. In 2000, railroads received $7.8 billion,in excess of 20% of their revenues, from transporting coal, and coal comprised 758million tons, or over 40%, of the total tons of freight hauled by rail. Over the past ten
3-177
years, the rail industry’s share of coal transportation has increased, primarily to satisfyincreased demand for low-sulfur western coal. About 74% of U.S. low-sulfur coalreserves are located in Montana and Wyoming. Domestic railroads carried 68 percent ofthe nation’s coal, transporting an average of 14.4 million tons of coal per week in 2000. Coal is also moved by barges, ships, and trucks, where the modes of transportation areeconomical. A few electricity-generating facilities are located near coal mines andreceive their coal directly by conveyor or coal-slurry pipeline.
Average coal rail hauls are getting longer, reflecting the increased penetration of westerncoal carried by rail into southern and eastern U.S. markets. The average haul of coal byrail grew by 33% from 485 miles in 1979 to 643 miles in 1995. Railroads continuallyadopt technological innovations that offer customers greater flexibility. One example isthe “coaltainer”, a container designed especially for transporting coal by rail and bytruck. Another innovation for transporting coal by rail is the use of real-time satellitemonitoring and computerized traffic management systems to improve the scheduling androuting of trains. These electronic traffic management systems will become increasinglyimportant as more electricity generators move toward “just-in-time” inventorymanagement.
NEW YORK STATE OVERVIEW
New York used 311 trillion Btu of coal in 2000. This figure represents 8% of the State’stotal primary energy use of 4,094 trillion Btu. New York has no coal mining activity andno known coal reserves. In 2000, the cost of coal delivered to New York electricitygenerators was $39.11 per ton, over 60% higher than the national average of $23.83 perton.
Coal Use in New York State
In 2000, nearly 12.1 million tons of coal were used in New York State, representing 1%of the nation’s demand. About 80% of this coal was used to produce electricity; theindustrial sector accounted for 18%; residential and commercial use accounted for theremaining 2%. Over the past several years, the amount of coal used for electricitygeneration has remained relatively stable, accounting for 16% (24,520 gigawatt-hours) ofelectricity generated in the State in 2000, while coal use by the other end-use sectors(residential, commercial, and industrial) has declined.
3-178
Coal-Fired Generating Units in New York State(net summer capability in megawatts )
Company and Plant Name County UnitsSummer
Capability
1. AES - Hickling2. AES - Greenidge3. AES - Jennison4. AES - Milliken5. AES - Somerset - Kintigh6. AES - Westover7. Black River - Fort Drum8. Central Hudson9. CH Resources - Niagara10. Eastman Kodak 11. Fibertex Energy12. Jamestown, City of 13. Mirant - Lovett14. NRG - Huntley15. NRG - Dunkirk16. Rochester Electric & Gas
Source: U.S. DOE, Energy Information Administration, Inventory of Nonutility Electric Power Plants in the United States 1999
Table 6New York State Coal-Fired Generating Units
New York has 46 coal-firedelectricity generation unitslocated in sixteen areas ofthe State. These coal-firedelectricity-generation units,listed in Table 6, representnearly 4,000 megawatts ofnet summer capability forthe New York electricitygrid. These stations are alllocated outside of themetropolitan New YorkCity area; the greatestconcentration is in WesternNew York.
New York State Electricity Generation Coal Prices and Characteristics
In the electricity generation sector, the average delivered cost of coal to New York hasremained fairly stable over the past ten years, as shown in Table 7. Table 8 lists detailedaverage delivered cost of coal to New York State electricity generating plants for the year2000.
The average sulfur content of coal delivered to the State’s electricity generators in 2000was 1.1% by weight, compared to the U.S. average of 0.9%. The ash content was lower,7.1% by weight, compared to 8.8% at the national level. Because New York generatorsbuy eastern coal, the Btu content of coal used for generation is much higher than the U.S.as a whole, 13,117 Btu per pound on average, compared to 10,115 Btu per poundnationally.
Source: U.S. DOE, Energy InformationAdministration, Cost and Quality of Fuels forElectric Utility Plants, 2000
Table 7
2000 Average Delivered Cost of Coal to New York State
Electric Utility Plants
Type of Purchase Contract Spot
(¢/MMBtu)152.2127.9
($/ton)$40.04$32.91
Mine Type Surface Underground
129.9150.4
$32.88$39.56
Sulfur Content Less than 0.5% 0.5% - 1.0% 1.0% - 1.5% 1.5% - 2.0% 2% - 3%
159.5157.2136.6130.3132.3
$40.21$41.40$34.97$33.29$34.98
Source: U.S. DOE, Energy Information Administration,Cost and Quality of Fuels for Electric Utility Plants, 2000
Table 8
Origin of Domestic Coal Delivered to New York State by Method of Transportation, 1999
(thousand tons)
State: Railroad River Great Lakes Tidewater Trucks Total
Illinois KentuckyOhioPennsylvaniaVirginiaWest Virginia
0 1,176
16 4,227
93 3,608
0 39
0 50
0 92
0 0 0
465 0 0
0 0 0 0 0
77
63 0 4
634 0 5
63 1,216
20 5,376
93 3,782
Total 9,120 181 465 77 706 10,550 Source: U.S. DOE, Energy Information Administration, Coal Distribution Report.
Table 9
Origin of Domestic Coal Used in New York State
In 1999, domestic coal delivered to New York originated in six U.S. states. Pennsylvaniaand West Virginia accounted for 87%. By far the dominant mode of coal transportationinto New York was rail. Coal is also moved by barge and trucks to end-users in NewYork. Barge transport of coal occurs primarily on Lake Erie. Table 9 lists the origin ofdomestic coal delivered to New York in 1999 by method of transportation.
3-180
DEVELOPMENTS AND TRENDS IN THE COAL INDUSTRY
Environmental Factors
Coal mining can have significant negative effects on land and water resources. Soilsubsidence and erosion are long-standing problems associated with underground andsurface mining. These are addressed by the Surface Mining Control and ReclamationAct of 1977 and the Abandoned Mine Reclamation Act of 1990. Water resources aredegraded by mining and coal preparation. The Federal Water Pollution Control Act of1972 and the Clean Water Act of 1977 both contain provisions to limit water pollutionand run-off from coal extraction and processing. Coal waste from mining, preparation,and combustion are regulated at the federal level by the Resource Conservation andRecovery Act of 1976 and at the State level by 6 NYCRR Part 360 Solid WasteManagement Facilities regulations. Nationally, coal mining waste is used as fill for mineland reclamation projects. In New York State, coal combustion wastes have a variety ofuses. Coal combustion wastes are used as an ingredient in the manufacture of cement,asphalt, roofing shingles, gypsum, calcium chloride, lightweight aggregate, lightweightblock, and low-strength backfill; as a traction agent on roadways and cement; as anaggregate substitute in concrete; and as structural fill in building foundations. It isestimated by New York State Department of Environmental Conservation that 731thousand tons of coal combustion waste were beneficially reused in 1999.
Coal combustion presents air quality and other environmental concerns due to the releaseof sulfur dioxide (SO2), nitrogen oxides (NOx), particulate matter (PM), and carbondioxide (CO2) into the atmosphere. SO2, NOx, and PM emissions are associated withhealth problems and acidification of water resources (acid rain), while CO2 emissions arebelieved to contribute to global warming. In-State emissions of SO2 have been reducedsignificantly as a result of New York’s State Acid Deposition and Control Act (SADCA), and Title IV of the federal Clean Air Act (CAA) Amendments of 1990. As a result ofthese initiatives, SO2 emissions from New York’s electricity generation plants have beenreduced by 50% from 1980 levels. NOx emissions, which combine with volatile organiccompounds (VOCs) in the presence of sunlight to form ozone (or smog), are beingaddressed by Title I of the federal CAA amendments. Substantial staged reductions insummer ozone season NOx emissions from electricity generation plants were made in1995 and 1999 (up to 55% for upstate coal-fired plants); by 2003, summer NOx emissionreductions of up to 75% from 1990 levels will be required for coal-fired plants. Issuesassociated with utility sector air emissions are discussed in more detail in the Energy andthe Environment issue report (Section 2.3).
3-181
Governor’s Acid Deposition Initiative
The Governor’s Acid Deposition Initiative (ADI) announced in 1999 is expected to resultin regulations that will require New York’s electricity generation plants to reduce SO2
emissions by 50% below the levels required by the federal CAA amendments of 1990. The ADI will also require such plants to implement year-round controls for NOX, asubstantial extension of the five-month summer ozone season controls required undercurrent federal and State regulations. The first full year of fully-implemented NOX
controls is expected to be 2005, and SO2 controls are expected to be fully phased in byJanuary 2008.
NOX compliance actions may include a mix of end-of-pipe emission control technologies,such as selective catalytic reduction (SCR) and selective non-catalytic reduction (SNCR). SO2 compliance actions may include switching to lower-sulfur coal, retiring certain coalplants, and installation of flue gas desulfurization (FGD) equipment, or scrubbers, on asubstantial proportion of existing coal plants. While the primary objective of the ADI isto reduce emissions of precursors of acid rain, modeling analysis indicates that emissionsof CO2, the principal greenhouse gas associated with global warming, could be reducedby up to 10%. This indirect benefit could result from shifts from coal and oil-firedgeneration to natural gas. The potential future decrease of coal use due to environmentalinitiatives will decrease rail coal traffic specifically in upstate New York. This reductioncould have a direct impact on rail transport costs for other industries in the regioninvolved.
Modeling analysis of New York’s electricity system indicates that implementation of theADI is technically feasible with respect to the proposed time frame and emission targets. However, there are some risks of higher wholesale electricity prices in certain areas as aresult of the incremental costs of the emission control actions required for compliance. In addition, there could be reliability impacts if operators of certain units choose to ceaseor restrict operations for significant portions of the year as an emission control strategy. Further, the proposed regulations are likely to increase the State’s dependence on naturalgas which could result in supply problems and/or higher prices.
Table 10 shows typical emission rates for SO2, NOX, and CO2 for existing coal plants inNew York compared to estimated emission rates for coal plants that burn low-sulfur coal,plants with advanced emission controls, and plants that have incorporated two new cleancoal technologies. Burning low-sulfur coal could reduce SO2 emissions from anuncontrolled plant by two-thirds; installing a scrubber could reduce emissions by 90% ormore. These representative emission-reduction actions could be undertaken at existing
3-182
coal-fired plants to meet the emission targets of the ADI.
Table 10
Emission Rates for Coal Plants(pound per megawatthours)
SO2 NOX CO2
Existing Upstate Coal Plant1 28.4 4.7 2,310
Existing w/Low-Sulfur Coal2 9.5 4.7 2,310
Existing w/Advanced Controls3 3.0 1.6 2,412
New Clean Coal: CFB4 3.0 1.0 2,180
New Clean Coal: IGCC5 0.4 0.9 2,0281Existing upstate coal plant assumes 1.8% sulfur coal with no scrubber; low-NOX.burners.2Low-sulfur coal assumes 0.6% sulfur coal; low-NOX.burners.3Advanced controls assumes 90% SO2 reduction by scrubber and 65% NOX reduction by selective catalyticreduction.4Circulating fluidized bed.5Integrated gasification combined cycle. Source: NYSERDA
Clean Coal Technologies
Clean coal technologies include various new innovations that are more environmentallybenign than the technologies in common use today. Most are the products of researchconducted over the last 20 years. New pollution control devices, such as advancedscrubbers, clean pollutants from flue gases before they exit the plant’s smokestack. Newcombustion processes, such as circulating fluidized bed (CFB) combustion, improve bothefficiency and emission control. Integrated gasification combined cycle (IGCC)technology converts coal to a gaseous form similar to natural gas before being burned.
Implementation of clean coal technologies has been, and will continue to be, key toachieving the State’s energy, economic, and environmental goals. In recent years,technological advancements have led to substantial reductions in the cost of controllingSO2 and NOX emissions. Some of the most successful advancements are low-NOX
burners, selective catalytic reduction and scrubbers. Also, clean coal technologies underdevelopment show promise of being environmentally superior to the technologies incommon use today.
3-183
Advanced pollution controls installed on existing power plants or built into new facilitiescan provide more effective and/or lower-cost ways to reduce sulfur dioxide and nitrogenemissions. Advanced power generation technologies are complete electric powergenerating systems that offer superior efficiency and environmental performance overconventional coal-burning systems. Examples of these power generation technologiesare atmospheric fluidized bed (AFB) combustion, circulating fluidized bed (CFB)combustion, and integrated gasification combined cycle (IGCC). As shown in Table 10,emissions of SO2 and NOX from coal plants using clean coal technologies are expected tobe 80% to 90% lower than typical existing coal plants.
U.S. Department of Energy Clean Coal Power Plant Improvement Initiative
The U.S. Department of Energy (U.S. DOE) Clean Coal Power Plant ImprovementInitiative provides funding for demonstrations of innovative technologies to improve theperformance and economics of both new and existing coal-fired electric power plants. The AES-Greenidge Multi-Pollutant Project, located in New York State, has beenselected by U.S. DOE for funding. The advanced emission control technologies beingtested by this project are expected to reduce SO2 by 95%, NOX by 60%, and mercury by90% from the existing 100 megawatt generator at a significantly lower cost thanconventional retrofit technologies. It will be the first application of co-firing biomasswith a dry scrubber to remove SO2 and mercury, and selective catalytic reduction toremove NOX. The State has supported the AES-Greenidge Multi-Pollutant Projectlocated in Yates county.
Electric Power Restructuring
During the 1990s, coal producers began to feel the dampening effects of electricityrestructuring on demand for their fuel. Electric utilities and other power producers cameunder pressure to shed high-cost, long-term coal supply contracts and enter into moreflexible, risk-sharing supply agreements. The current movement to restructure U.S.electricity generation markets and make them more competitive may lead to changes inthe financial risks and demands on the supply and transportation infrastructures of thefuels used in electricity generation. Electric power industry restructuring is expected toresult in renewed pressure for cost-cutting and consolidation in the coal industry. Electric power generators will attempt to pass on market risks to coal producers andcarriers. As a result, coal contracts will likely become shorter in duration and lower inprice. Also, small coal-producing firms may be forced out of business, and large firmsare likely to continue to grow in size through acquisitions and mergers.
3-184
New York State Coal Demand and Price Forecast
Actual Outlook Outlook Average Annual Growth
2000 2006 2021 2000-2006 2006-2021 2000-2021
Demand: (TBtu)Price*: ($/ton)
311$39.11
370$36.34
386$33.45
2.9%-1.2%
0.3%-0.6%
1.0%-0.7%
Source: Draft Energy Plan, Forecast Summary. * Coal prices are expressed in constant 2000 dollars.
Table 11
COAL OUTLOOK
The nation is likely to use more coal in the future, especially as an expanding digitaleconomy creates new demands for electricity. Future coal productivity gains will dependon additional penetration of more efficient production methods and technologies that arealready available and the development and application of new technology. Continuedimprovements in mine productivity (which has increased on average 6.7% per year since1979) are projected to result in declining real mine-mouth prices throughout the forecastperiod. There is also considerable opportunity for even greater efficiency andenvironmental improvements at existing and new coal-fired electricity generating plants. New computerized controls, improved burner designs, better gas cleaning systems, andhigh performance turbines are just a few examples of technologies that can produce moreand cleaner electricity from coal. High electricity demand and low prices, in turn, areprojected to increase demand for coal.
FORECAST SUMMARY
The Draft Energy Plan projects that total New York coal demand will increase 1%annually over the forecast period. New York coal demand is projected to increase by 75trillion Btu from 311 trillion Btu in 2000, to 386 trillion Btu in 2021, as shown in Table11. Coal prices paid by the electric generation sector are estimated to decline 0.7% peryear over the forecast period, from $39.11/ton to $33.45/ton in constant 2000 dollars. For a detailed description of the forecast methodology and more discussion on theforecast assumptions, see the Forecast Summary (Section 3.1).
3-185
COAL INDUSTRY SECURITY
Coal is America’s most abundant indigenous fuel resource. U.S. coal accounts for 95%of the nation’s fossil energy reserves and 25% of the world’s known coal reserves. Atpresent, coal provides power for 57% of U.S. electricity generation and 16% of NewYork’s electricity generation. Greater diversity in the types of fuel used for energyproduction could benefit all market participants, ensuring adequate fuel supplies anddampening price volatility. Technological advances in clean coal technologies couldincrease the use of coal for power production and thus diversify New York’s fuel mix.
FINDINGS AND CONCLUSIONS
• Coal is America’s most abundant indigenous fossil fuel resource, accounting for95% of the nation’s fossil energy reserves. The United States has a 250-yearsupply of coal.
• The United States is second only to China among world coal producers. In 2000,over one billion tons of coal were produced in the United States, mined in 25coal-producing states.
• Approximately two-thirds of all coal mined in the United States is transported byrail, making coal the largest single source of freight revenue for United Statesrailroads.
• In 2000, nearly 12.1 million tons of coal were used in New York State,representing 1% of the nation’s coal demand. While coal use represents 8% ofthe State’s total primary fuel mix, most of the coal (80%) was used to produceelectricity.
• New York has 46 coal-fired electricity generation units located in the State,representing nearly 4,000 megawatts of net summer capability for the State’selectricity grid.
• A major consideration in the use of coal as a fuel in electricity generation is theemission of sulfur dioxide, nitrogen oxides, particulate matter, and carbondioxide. Clean coal technologies offer utilities options for making substantialreductions in acid rain and greenhouse gas emissions, while providing health-related benefits due to improved air quality.
• Clean coal technology can play a role in helping the State to achieve its energy,economic, and environmental goals.
Section 4
COMPLIANCE WITH THE STATE ENVIRONMENTAL
QUALITY REVIEW ACT
4-1
SECTION 4.0
COMPLIANCE WITH THE STATE ENVIRONMENTAL QUALITYREVIEW ACT
This section is intended to correlate applicable sections of the Draft State Energy Plan(Draft Energy Plan) with the components of a Draft Environmental Impact Statement,pursuant to the State Environmental Quality Review Act (SEQRA) and its implementingregulations 6NYCRR Part 617. Notice of a Positive Declaration under SEQRA,indicating that implementation of the State Energy Plan may have a significant effect onthe environment, was published in the Environmental Notice Bulletin on April 4, 2001.
The Energy Law generally requires that energy-related actions or decisions of stateagencies, boards, commissions, and authorities be reasonably consistent with theforecasts and long-range energy planning objectives and strategies contained in the StateEnergy Plan. However, the State Energy Plan does not commit any agency, board,commission, or authority to a definite course of specific future decisions. Accordingly,each specificenergy-related action of an agency, board, commission, or authority is independentlysubject to applicable environmental review requirements, such as SEQRA, or ArticlesVII and X of the Public Service Law.
Overall, the policy objectives and strategies set forth in the Draft Energy Plan areintended to maintain and improve environmental quality. For example, energy efficiencyand renewable energy sources tend to reduce air and water emissions and dischargesresulting from fossil fuel combustion and other processes. Improved transportationmobility enhances air quality by reducing traffic congestion.
The Draft Energy Plan addresses the environmental impacts of its energy policyobjectives and strategies. Although specific activities will need to be addressedindividually (see above) these broad objectives and policies do not appear to haveadverse environmental impacts. The Draft Energy Plan itself complies with the specificrequirements for a Draft Environmental Impact Statement as specified in §8-0109 ofSEQRA (ECL, §8-0109), as follows: